


 , Yajun Qiao 1,2,3,†, Huimin Zheng 1,4,5, Xiaohui Li 1,4,6, Qiannan Wang 1,2,3, Xingfang Zhang 1,7, Jianv Wang 1, Lixin Wei 1, Tingting Gao 2,4, Hongtao Bi 1,3,5,6,*
1 Qinghai Provincial Key Laboratory of Tibetan Medicine Pharmacology and Safety Evaluation, Northwest Institute of Plateau Biology, Chinese Academy of Science, 810008 Xining, Qinghai, China
2 School of Psychology, Chengdu Medical College, 610500 Chengdu, Sichuan, China
3 University of Chinese Academy of Sciences, 10049 Beijing, China
4 Department of Psychiatry, The People's Hospital of Jiangmen, Southern Medical University, 529000 Jiangmen, Guangdong, China
5 Medical College, Qinghai Minzu University, 810001 Xining, Qinghai, China
6 Medical College, Qinghai University, 810001 Xining, Qinghai, China
7 Department of Pharmacy, Xijing Hospital, Fourth Military Medical University, 710032 Xi'an, Shaanxi, China
†These authors contributed equally.
Abstract
Depression represents a major global disease burden. High-altitude hypoxia is closely associated with an increased incidence of depressive symptoms; however, the underlying mechanisms remain unclear.
In this study, mice were subjected to 7 days of hypoxic exposure simulating high-altitude environments at 3000 m (14.4% O2) and 4000 m (12.7% O2). Depressive-like behaviors were assessed using the open field test, tail suspension test, and forced swim test. Enzyme-linked immunosorbent assays were employed to measure markers related to inflammatory responses, oxidative stress, and hypothalamic–pituitary–adrenal (HPA) axis activity. Additionally, 16S ribosomal RNA sequencing was performed to analyze alterations in the gut microbiota. Untargeted metabolomics was used to examine metabolite changes in the colon and hippocampus. Validation analyses included measurements of hippocampal immunofluorescence density and cortical neurotransmitter levels.
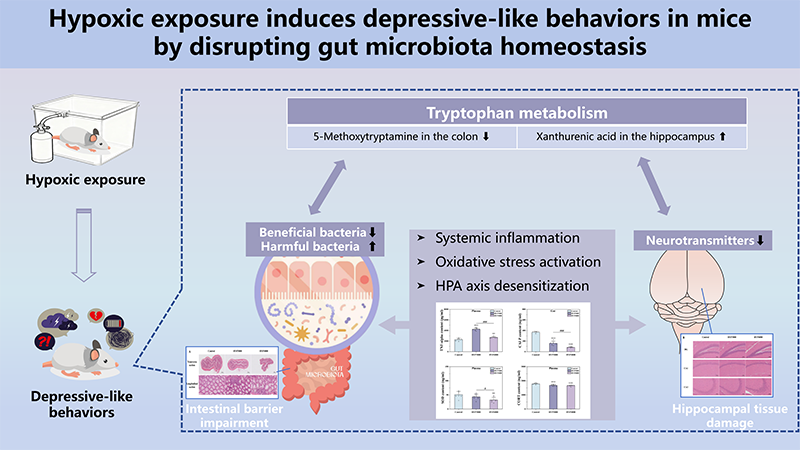
Hypoxic exposure induced depressive-like behaviors, as well as colonic and hippocampal tissue damage. It also exacerbated inflammation and oxidative stress, reduced gut microbiota diversity, disrupted tryptophan metabolism, decreased cortical neurotransmitter levels and brain-derived neurotrophic factor (BDNF), and increased the immunofluorescence density of hippocampal neuron–glial antigen 2 and oligodendrocyte transcription factor 2. These effects exhibited an intensity–toxicity relationship.
Acute hypoxia is associated with gut microbiota imbalance, disrupted tryptophan metabolism, inflammatory responses, and dysfunction of the HPA axis, alongside negative emotional states. These multidimensional alterations are strongly correlated, suggesting a potential regulatory network involving the gut microbiota–tryptophan metabolism axis in hypoxia-induced emotional changes.
Graphical Abstract
Keywords
- high altitude
- acute hypoxia
- depression
- gut–brain axis
- gut microbiota
- tryptophan metabolism
• Seven days of simulated high-altitude hypoxia (3000 m, 4000 m) induces depressive-like behaviors in mice.
• Hypoxia at 4000 m (12.7% O2) causes more severe depressive symptoms, gut dysbiosis, metabolic disruption, and tissue damage than hypoxia at 3000 m (14.4% O2).
• An imbalance in the gut microbiota initiates the response: hypoxia increases the abundance of proinflammatory bacteria (e.g., Staphylococcaceae and Corynebacteriaceae) and reduces the abundance of short-chain fatty acid (SCFA)-producing taxa (e.g., Lachnospiraceae and Ruminococcaceae), disrupting colonic and hippocampal tryptophan metabolism.
• This axis drives a pathological cascade—metabolic changes trigger inflammation, oxidative stress, hypothalamic–pituitary–adrenal (HPA) axis dysfunction, and hippocampal damage and lower levels of gamma-aminobutyric acid (GABA), brain-derived neurotrophic factor (BDNF), 5-hydroxytryptamine (5-HT), and norepinephrine (NE)—leading to depressive-like outcomes.
• This study identifies gut microbiota and tryptophan metabolism as key targets for assessing and treating depression in high-altitude populations.
Depression is a common mental disorder. Owing to its high disability rate, it
ranked among the top 25 contributors to the global disease burden in 2019 [1].
The Coronavirus Disease 2019 (COVID-19) pandemic impacted mental health, further
worsening the disease burden linked to depression. Thus, mitigating the global
health burden and addressing mental health challenges are essential [2].
Depression onset is shaped by multiple factors, including genetics, social
environments, and geographical location [3]. Among these factors, high-altitude
hypoxia has attracted considerable attention as a natural environmental factor.
As global climate change has altered high-altitude ecosystems and human
activities (e.g., mountaineering, plateau development, and military deployments)
in these regions have expanded, more than 80 million permanent residents and 35
million annual visitors worldwide are now exposed to hypoxic conditions
(
High-altitude environments involve multiple concurrent stressors (e.g., hypoxia, low temperature, and intense radiation), with hypoxia being the primary driver of depression [10]. From a toxicological standpoint, hypoxia exerts multitarget toxicity—inducing immune dysregulation, hormonal imbalance, and intestinal/brain tissue damage—but the direct biological mediators linking hypoxia to depressive traits remain poorly defined. In recent years, the gut‒brain axis (a key bridge between the gut microbial community and the central nervous system (CNS)) has emerged as a critical framework for understanding the impact of hypoxia on depression; this axis thus provides a core entry point for dissecting hypoxia‒depression connections. The gut‒brain axis is a bidirectional communication network that links gut microbes to the CNS via microbial metabolites, immune signaling, and the vagus nerve [11, 12, 13]. Notably, the gut microbial composition and metabolic features differ sharply between long-term residents of high-altitude hypoxic regions and those in low-altitude areas [14]. Acute hypoxic exposure disrupts the gut microbial balance [15]; this dysbiosis impairs the intestinal barrier, triggering systemic inflammatory responses that affect the brain—with 7 days of acute hypoxia alone sufficient to cause significant intestinal mucosal injury [16]. Gut microbial dysbiosis also reduces short-chain fatty acid (SCFA) levels, which amplifies hypothalamic‒pituitary‒adrenal (HPA) axis overactivity and hinders neurotransmitter synthesis, ultimately promoting depression [17]. While fecal microbiota transplantation (FMT) can alleviate oxidative stress injury in the hippocampus caused by acute hypoxia [15], critical gaps persist in the understanding of the toxicology of this pathway. Most studies have focused on chronic hypoxia, and the intensity‒toxicity relationship between acute hypoxia levels and depressive-like effects remains uncharacterized. Additionally, existing studies have typically examined individual gut‒brain axis components rather than integrating them into a stress‒toxicity cascade; furthermore, the key microbial taxa and metabolic factors linking gut dysbiosis to hippocampal damage remain unvalidated.
To address these existing research gaps, we designed a study to elucidate the toxicological cascade through which acute hypoxia may contribute to depressive-like phenotypes in mice. This study aimed to investigate how hypoxic stress disrupts the gut microbial ecology and may contribute to a series of cascades that ultimately lead to neurotoxic pathways, which in turn trigger depressive-like behaviors in mice and link gut perturbations to hippocampal damage, through the validation of downstream toxic effects. This research provides a toxicological basis for the risk assessment of high-altitude hypoxic exposure and identifies intervention targets to alleviate its neuropsychiatric toxicity and ultimately reduce the health burden of depression in high-altitude ecosystems.
Thirty 5- to 6-week-old male Kunming (KM) mice were procured from Sipeifu Biotechnology Co., Ltd (Beijing, China). The mice were housed at ambient temperatures of 22–25 °C, with a 12-h light/dark cycle and unrestricted access to standard rodent feed and water.
After two weeks of adaptive feeding, 30 mice were randomly divided into three groups: the control (21% O2), hypoxia 3000 (HYP3000, simulated 3000 meters, 14.4% O2), and hypoxia 4000 (HYP4000, simulated 4000 meters, 12.7% O2) groups. During the 7-day modeling experiment, the control group was housed in a normoxic environment (21% O2), whereas the HYP3000 group and HYP4000 group were housed in hypoxic incubators (OX-100HE-L, TOW-INT TECH Co., Ltd., Shanghai, China) simulating oxygen concentrations at altitudes of 3000 m (14.4% O2) and 4000 m (12.7% O2), respectively [18, 19].
After the modeling experiment, the open field test (OFT), tail suspension test
(TST), and forced swim test (FST) were administered to the mice in order of
increasing stimulus intensity to assess depressive-like behaviors [20]. For the
OFT, each mouse was placed at the center of a 525
After the behavioral experiments were performed, the mice were anesthetized via inhalation of isoflurane (standardized dosage: 3%–5% isoflurane in medical air for induction, 1%–2% for maintenance) via a closed anesthesia chamber (R510-29, Shenzhen RWD Life Science Co., Ltd., Shenzhen, Guangdong, China). Anesthesia depth was verified by the absence of a withdrawal reflex to pinch the paw and a stable respiratory rate. Ocular enucleation was performed to collect blood samples, and the mice were subsequently euthanized by cervical dislocation (consistent with the American Veterinary Medical Association (AVMA) Guidelines for the Euthanasia of Animals). The mice were subsequently dissected to harvest tissues, and the colon and brain were used for H&E analysis. The colon and brain were fixed in 4% paraformaldehyde (HC0892, Guangzhou Mutual Success Technology Co., Ltd., Guangzhou, Guangdong, China) for 24 hours, followed by paraffin (39601095, Leica Biosystem Richmond, Inc., Richmond, IL, USA) embedding. The paraffin-embedded tissues were subsequently cut into 5 µm-thick sections and subjected to H&E staining. Pathological alterations in the tissues were observed under a light microscope and images were captured [24].
Mouse blood samples were centrifuged at 4 °C and 3000 rpm for 10
minutes to obtain serum. The cerebral cortex, hypothalamus, and a portion of the
colon were collected, placed in phosphate-buffered saline (PBS), and homogenized
via a tissue homogenizer (Scientz-48, Ningbo Scientz Biotechnology Co., Ltd.,
Ningbo, Zhejiang, China) at 60 Hz for 2 minutes, after which the homogenate was
centrifuged at 4 °C and 5000 rpm for 10 minutes to collect the
supernatant—both the serum and the supernatant were stored at –80 °C
until subsequent detection. ELISA kits (sourced from Quanzhou Jiubang
Biotechnology Co., Ltd., Quanzhou, Fujian, China) were used to determine the
serum levels of multiple indicators, including inflammatory factors
(lipopolysaccharide (LPS, Cat# 10397), tumor necrosis factor-alpha
(TNF-
DNA extraction from mouse colonic contents was performed with the Mag-Bind Soil DNA Kit (M5636-02, Omega Bio-tek, Inc., Norcross, GA, USA). The V3-V4 hypervariable region of the 16S rRNA gene was amplified via polymerase chain reaction (PCR). Following purification and quantification of the obtained PCR amplicons, a small-fragment library was constructed, and paired-end sequencing was performed on the Illumina NovaSeq 600 sequencing platform. The sample species composition was determined through read assembly, filtering, denoising, species annotation, and abundance analysis. The raw data (raw data) generated from sequencing contained a certain proportion of contaminated data. To ensure the accuracy and reliability of the subsequent bioinformatics analysis, quality control analyses, including quality filtering, denoising, read assembly, and chimera removal, were first performed on the raw data via default parameters in QIIME 2 2024.10 (QIIME 2 Development Team, Flagstaff, AZ, USA). Additionally, sequences with a cumulative abundance of less than 10 across all samples were filtered out, yielding amplicon sequence variants (ASVs). On the basis of rarefied ASVs, multiple diversity index analyses for ASVs and assessments of sequencing depth were conducted [25].
Untargeted metabolomics was used to identify differentially abundant metabolites
in mouse fecal samples and hippocampal tissues, with chromatographic separation
performed on an ultrahigh-performance liquid chromatography (UHPLC) system
(Thermo Ultimate 3000, Thermo Fisher Scientific, Waltham, MA, USA) equipped with
an ACQUITY UPLC® HSS T3 column (2.1
Paraffin-embedded mouse brains were cut into 5 µm-thick sections. After dewaxing and antigen retrieval, the sections were blocked with goat serum (1:9, AR1009, Boster Biological Technology Co., Ltd., Wuhan, Hubei, China) at room temperature for 20 minutes and then incubated overnight with primary antibodies against oligodendrocyte transcription factor 2 (Olig2) (1:1000, ab109186, Abcam, Waltham, MA, USA) and neuron–glial antigen 2 (NG2) (1:100, ab259324, Abcam). After the samples were washed, Fluorescein Isothiocyanate- (FITC; 1:300, GB22303, Servicebio, Wuhan, Hubei, China) and Cy3-conjugated (1:300, GB21301, Servicebio) secondary antibodies were added, followed by incubation at 37 °C for 30 minutes. Finally, the sections were mounted in Fluoroshield mounting medium (ab104139, Abcam) containing 4′,6-diamidino-2-phenylindole (DAPI). Images were acquired via a fluorescence microscope (VS200, OlyVIA, Olympus, Tokyo, Japan) [28].
All the data are presented as the means
Three behavioral tests (OFT, TST, and FST) were performed to assess
depressive-like behaviors in mice exposed to 7-day simulated hypoxic environments
(3000 m, 14.4% O2; 4000 m, 12.7% O2), and the results are presented
in Fig. 1. Anxiety-like behaviors were assessed by the OFT. Compared with control
mice, hypoxic mice presented significant reductions in central zone residence
time (HYP3000: –52.31%, p
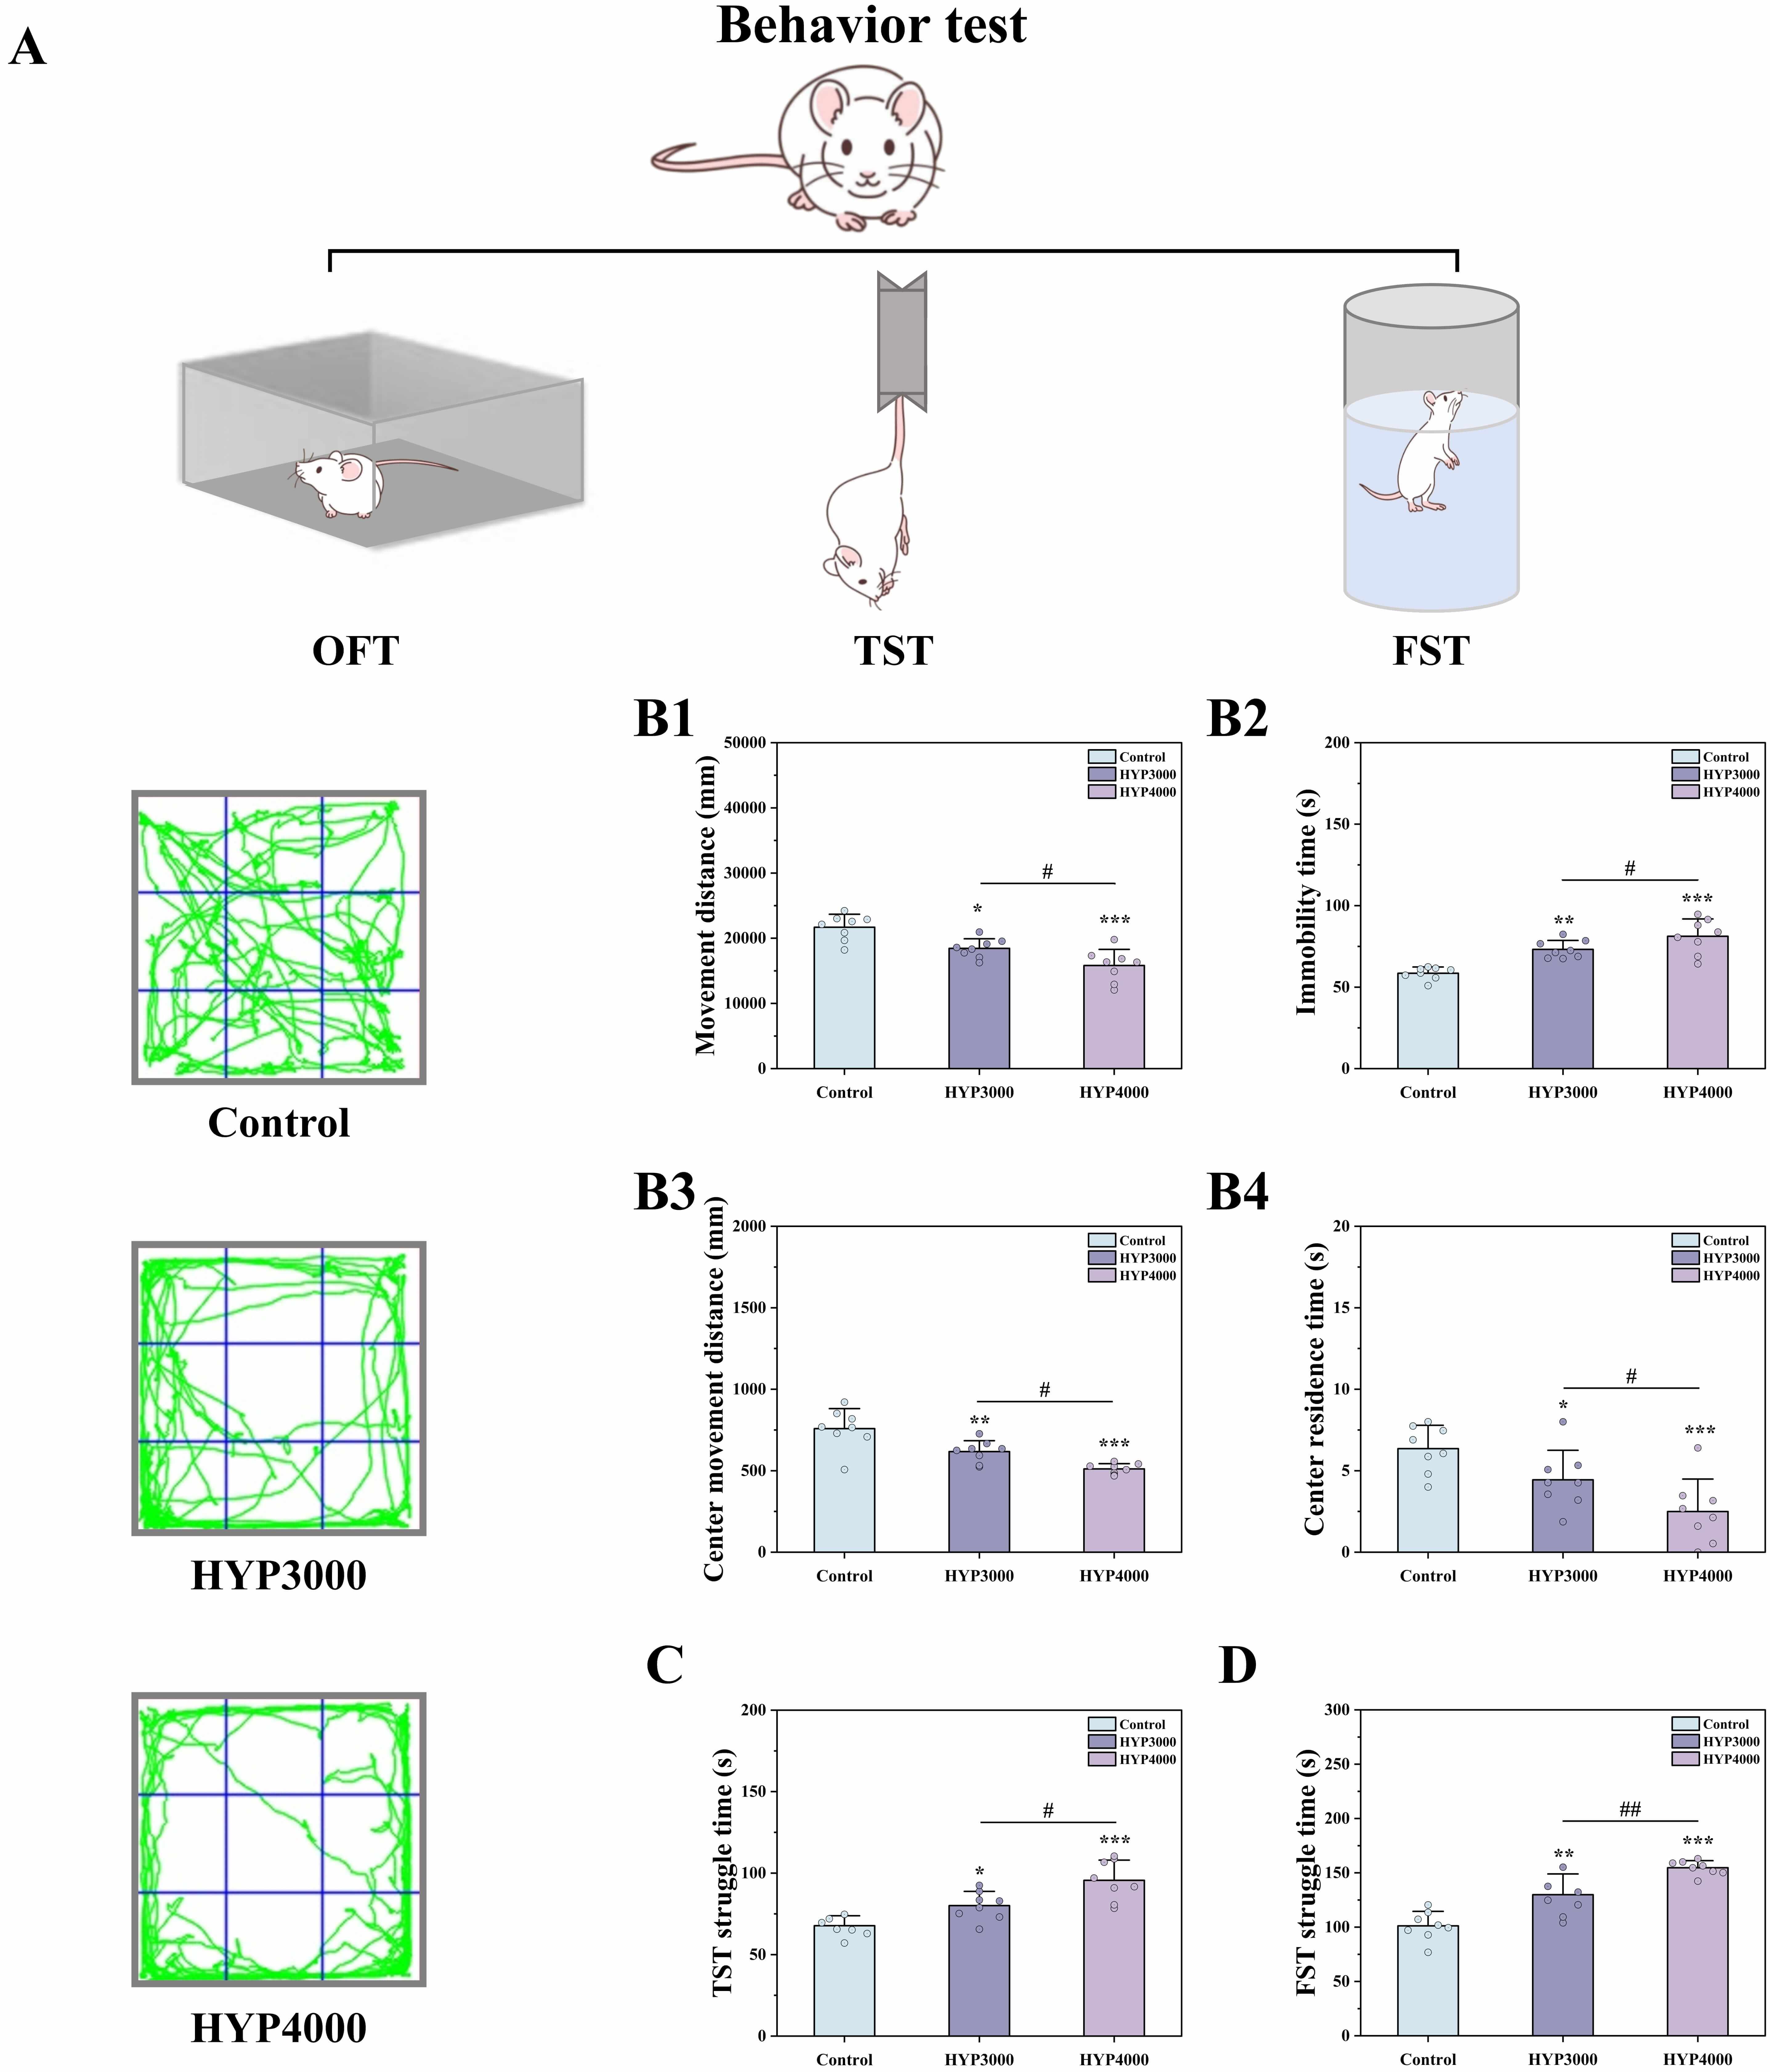 Fig. 1.
Effects of hypoxic exposure at different altitudes on mouse
behavior. (A) Overview of the behavioral tests, (B) Open field test (OFT); (B1)
Movement distance, (B2) Immobility time, (B3) Center movement distance, (B4)
Center residence time, (C) Tail suspension test (TST), and (D) Forced swim test
(FST). The data are presented as the means
H&E staining was performed on the colon and hippocampal tissues of the mice, as shown in Fig. 2. In the control group, the colonic tissue structure showed clear and complete layers; the epithelial cells had a regular morphology and were closely arranged, with no obvious inflammatory cell infiltration observed. In contrast, all the hypoxic groups exhibited varying degrees of inflammatory damage; the epithelial cells in the mucosal layer were disorganized, some cells showed degeneration or even necrosis, and obvious inflammatory cell infiltration was observed.
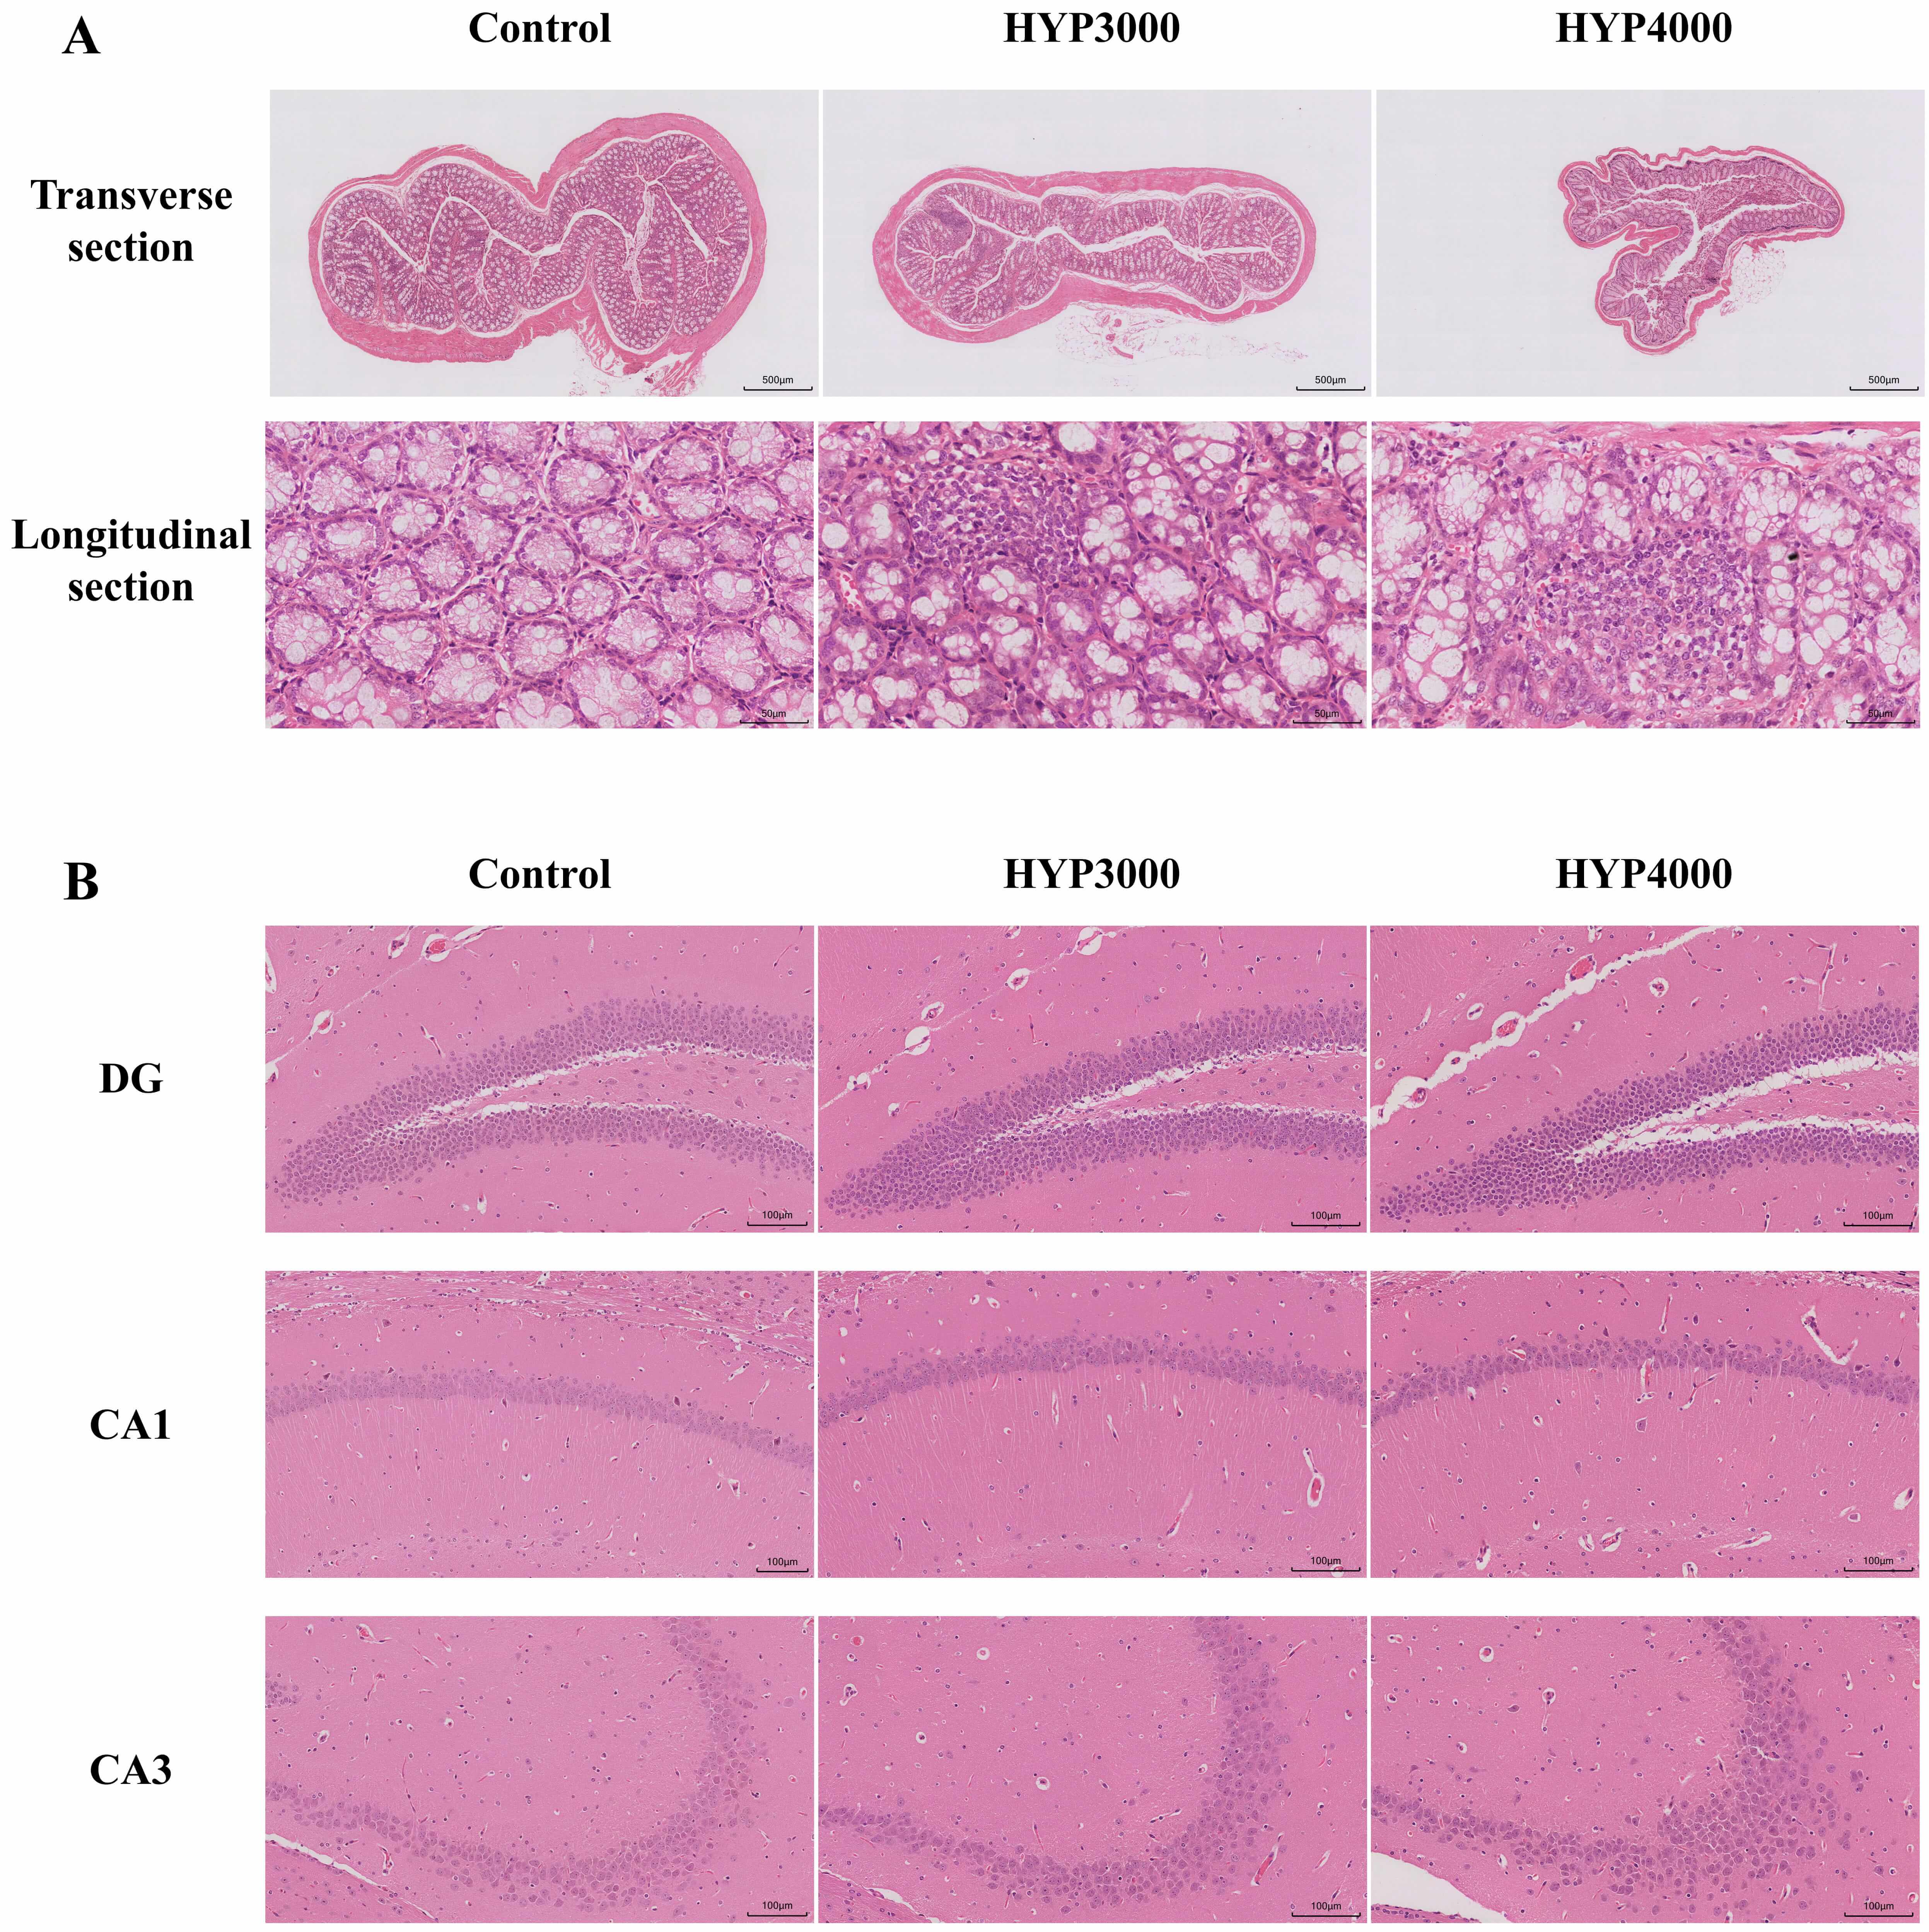 Fig. 2.
Effects of hypoxic exposure at different altitudes on the hippocampus and colon tissue of mice. (A) Transverse (scale bar = 500 µm) and longitudinal (scale bar = 50 µm) sections of colon tissue. (B) 100 µm sections of cells in the hippocampal dentate gyrus (DG), Cornu Ammonis 1 (CA1), and Cornu Ammonis 3 (CA3) subregions; scale bar = 100 µm.
In the control group, the mice exhibited intact hippocampal subregion structures: the neuronal nuclei had clear boundaries, and the cells were arranged in a distinct layered pattern. In contrast, in the hypoxic groups, the cells in the hippocampal dentate gyrus (DG) region showed intense staining (with some cells swollen or deformed); no obvious pathological changes were observed in the Cornu Ammonis 1 (CA1) region, but cells in the Cornu Ammonis 3 (CA3) region were disorganized, loosely arranged, and had wider intercellular spaces.
We detected inflammatory indicators in mouse serum and colonic tissues (results
in Fig. 3A,B). Compared with those in the control group, the serum levels of LPS
(HYP3000: +34.20%, p
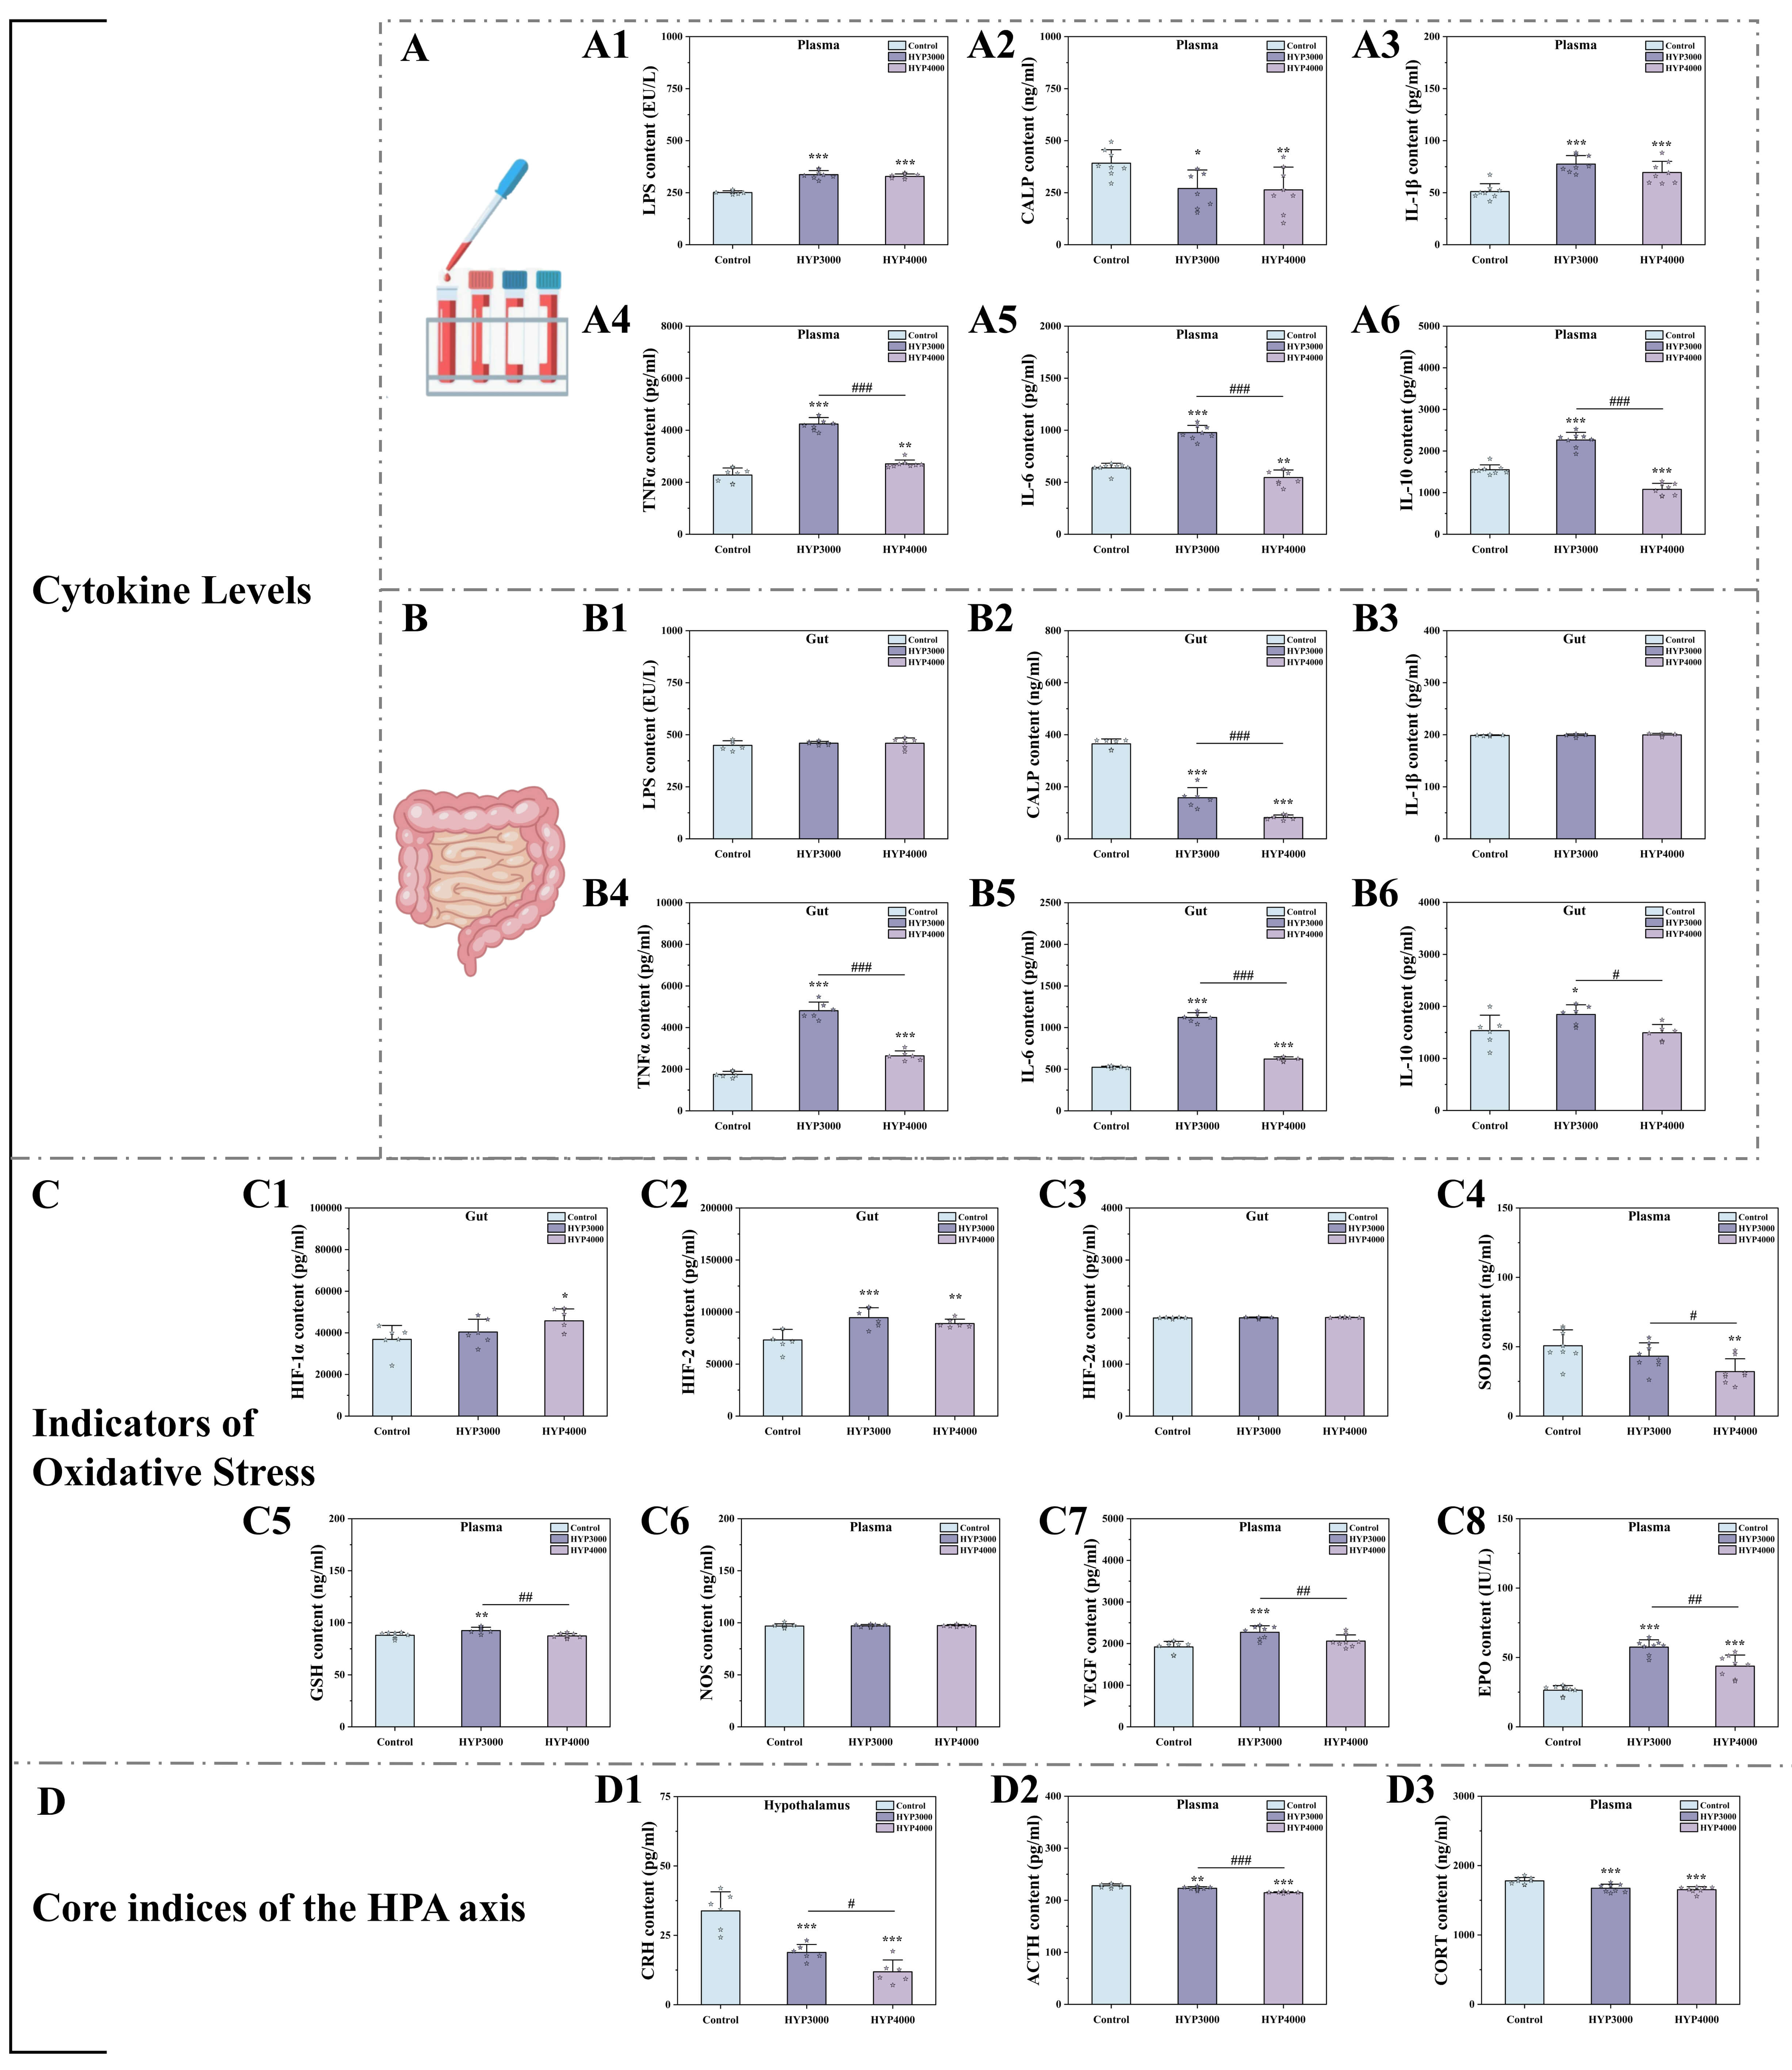 Fig. 3.
Effects of hypoxic exposure at different altitudes on
inflammatory markers, oxidative stress, and the hypothalamic‒pituitary‒adrenal
(HPA) axis. (A) Serum inflammatory indicators, (A1–A6) are as follows:
Lipopolysaccharide (LPS); calprotectin (CALP); interleukin (IL) -1
Oxidative stress indicators (SOD, GSH, NOS, VEGF, and EPO) in mouse serum and
hypoxia-inducible factors (HIF-1alpha, HIF-2, and HIF-2alpha) in the colon were
detected, and the results are shown in Fig. 3C. Compared with those in the
control group, the levels of SOD (HYP3000: –14.89%; HYP4000: –36.79%, p
Compared with those in the HYP3000 group, the levels of SOD (–25.74%, p
We assessed core HPA axis indicators (CRH,
CORT, and ACTH) and the results are shown in Fig. 3D. Compared with the control
group, the hypoxia groups (HYP3000 and HYP4000) presented significantly lower
levels of CORT (HYP3000: –5.95%, p
Analysis of the alpha diversity of the gut microbiota (Fig. 4A) revealed that
compared with the control group, the hypoxia group presented significantly lower
Shannon (HYP3000: p
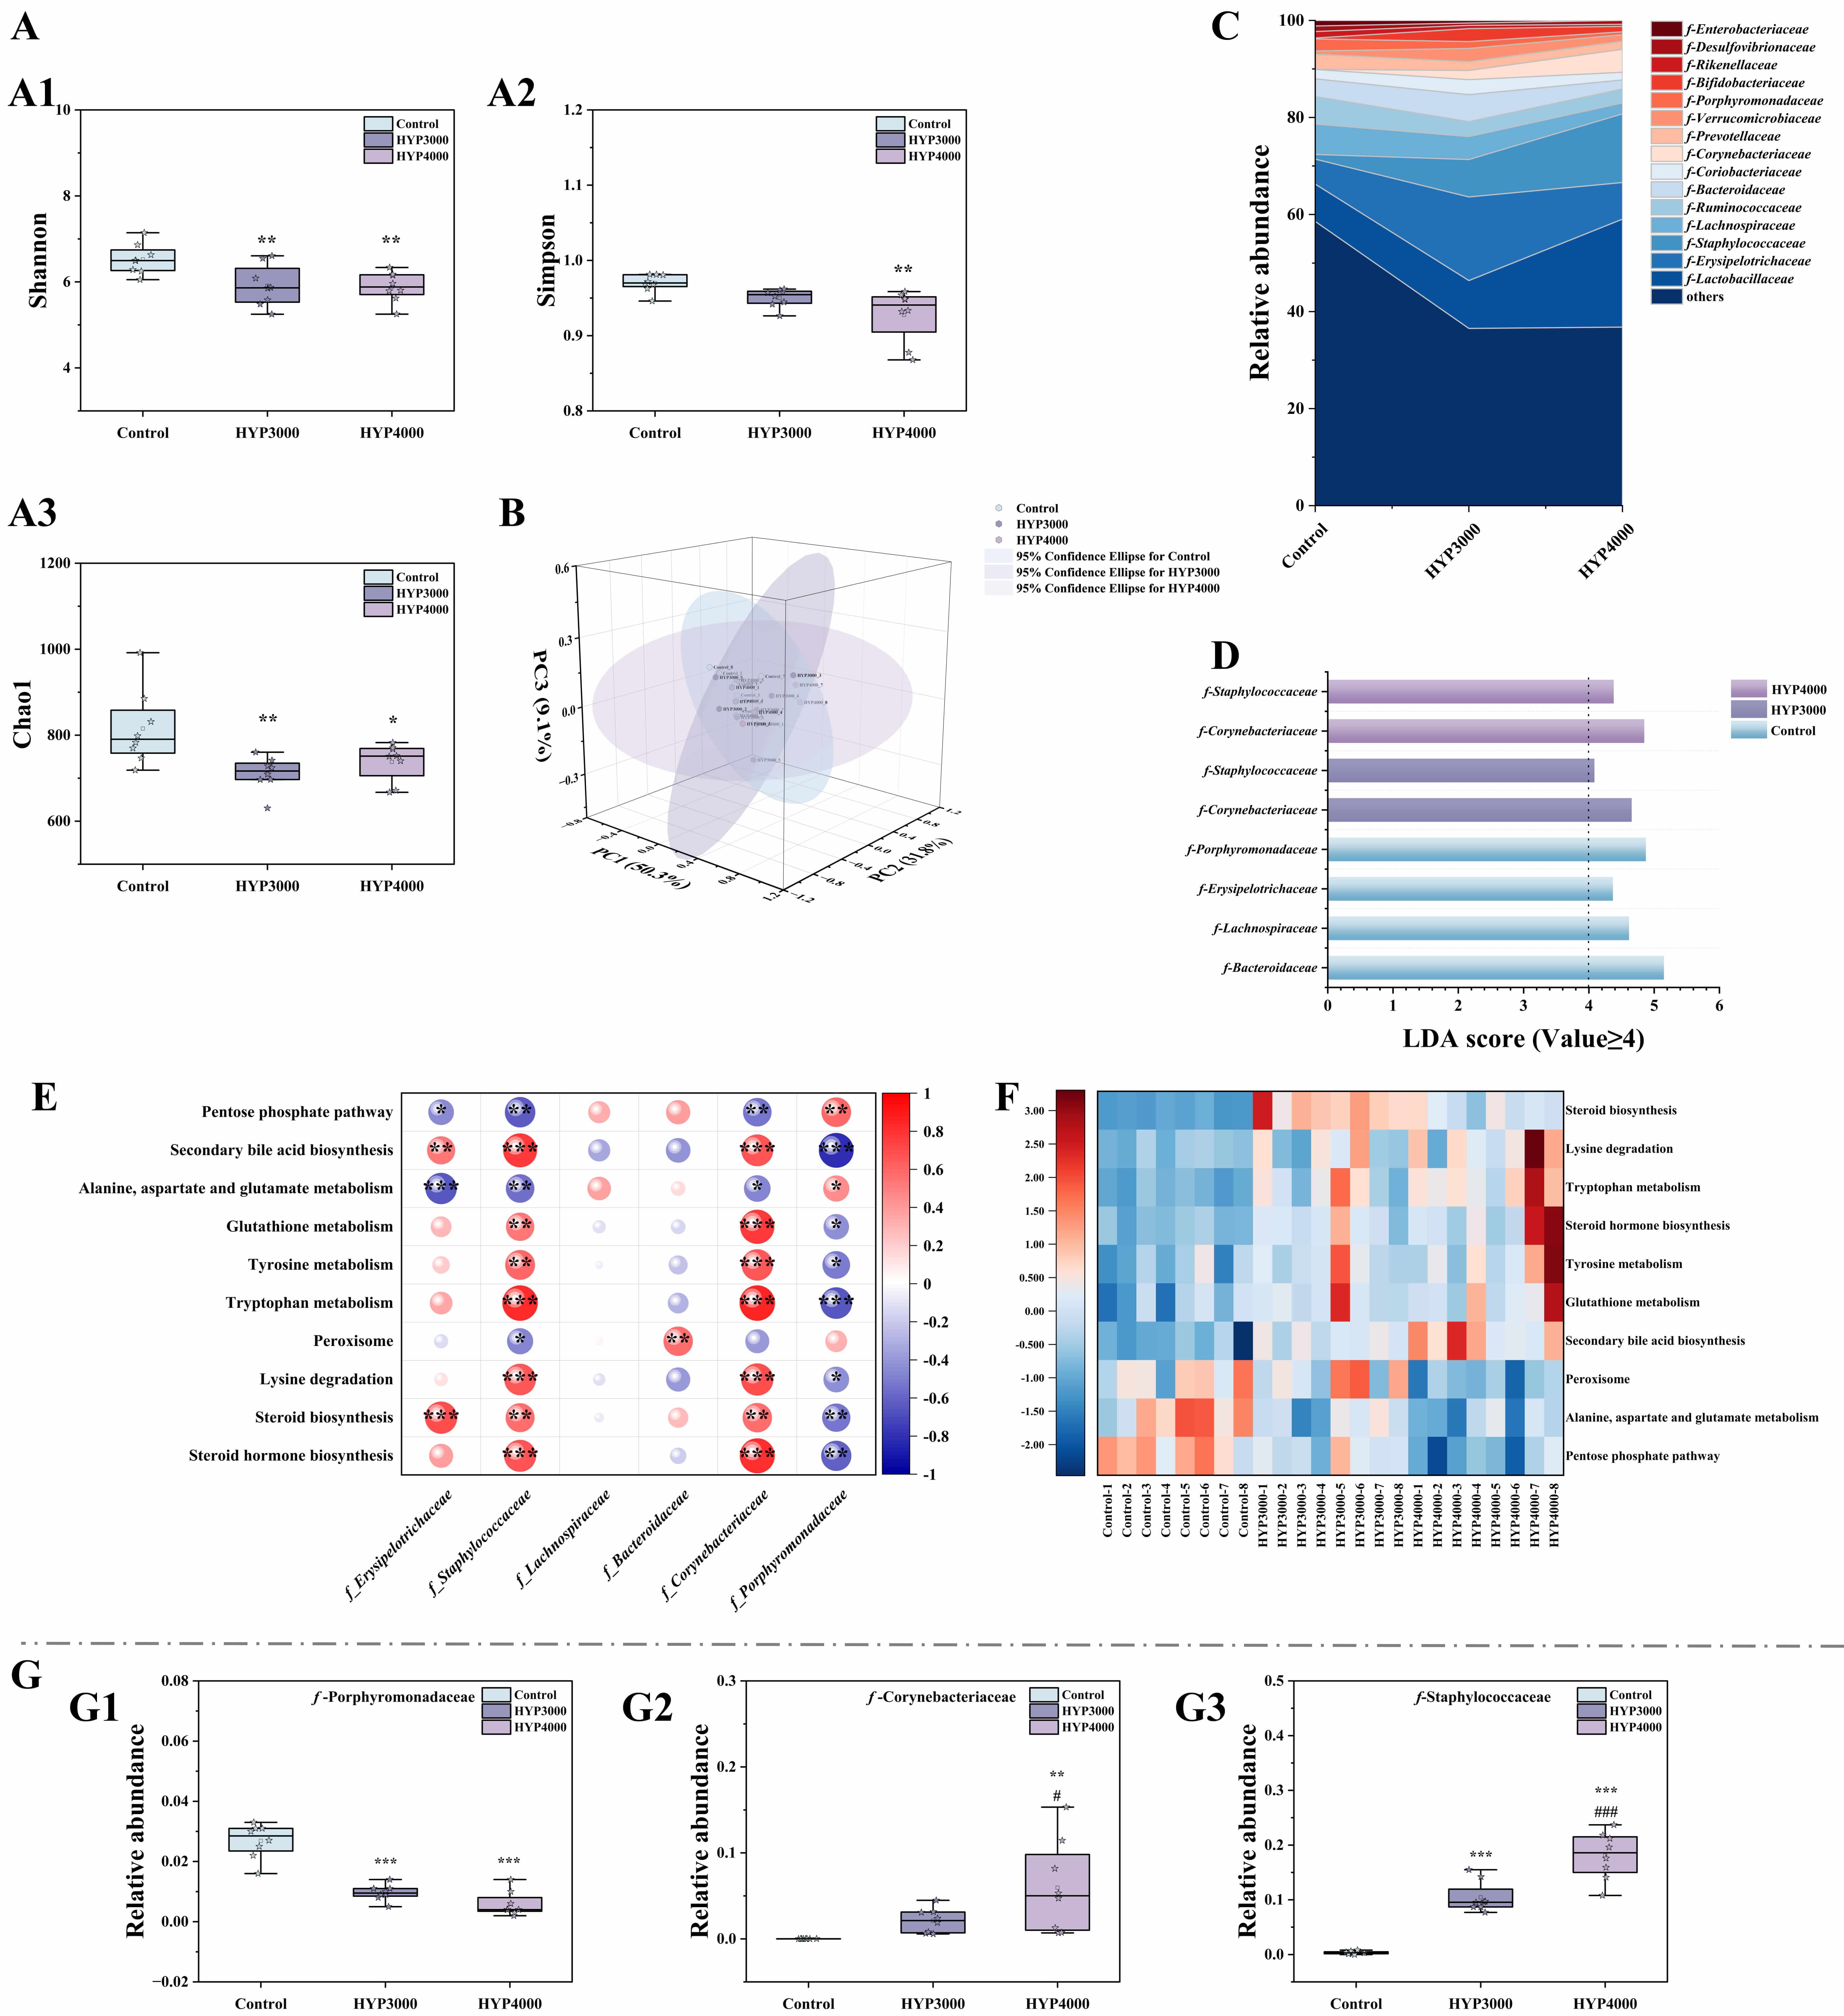 Fig. 4.
Effects of hypoxic exposure at different altitudes on gut
microbiota diversity in mice. (A)
Analysis of relative abundance at the family level (Fig. 4C) revealed that among the top 15 most abundant taxa, f-Lactobacillaceae (Control: 7.71%; HYP3000: 9.87%; HYP4000: 22.25%), f-Erysipelotrichaceae (Control: 5.14%; HYP3000: 17.23%; HYP4000: 7.54%), f-Staphylococcaceae (Control: 0.97%; HYP3000: 7.70%; HYP4000: 14.16%), f-Corynebacteriaceae (Control: 0.01%; HYP3000: 1.89%; HYP4000: 4.73%), f-Verrucomicrobiaceae (Control: 0.67%; HYP3000: 2.74%; HYP4000: 1.36%), and f-Bifidobacteriaceae (Control: 0.19%; HYP3000: 2.66%; HYP4000: 1.12%) were increased in the hypoxic groups. In contrast, the abundances of f-Lachnospiraceae (Control: 6.27%; HYP3000: 4.74%; HYP4000: 2.25%), f-Ruminococcaceae (Control: 5.64%; HYP3000: 3.06%; HYP4000: 2.86%), f-Prevotellaceae (Control: 3.12%; HYP3000: 1.80%; HYP4000: 1.63%), f-Porphyromonadaceae (Control: 2.48%; HYP3000: 1.41%; HYP4000: 0.60%), f-Rikenellaceae (Control: 1.35%; HYP3000: 0.68%; HYP4000: 0.43%), f-Desulfovibrionaceae (Control: 1.14%; HYP3000: 0.50%; HYP4000: 0.79%), and f-Enterobacteriaceae (Control: 1.14%; HYP3000: 0.52%; HYP4000: 0.00%) were decreased in the hypoxic groups.
Subsequent LEfSe analysis revealed taxa contributing significantly to the intergroup differences, with a linear discriminant analysis (LDA) score threshold of 4 (Fig. 4D). There were 4, 2, and 2 statistically distinct taxa in the control, HYP3000, and HYP4000 groups, respectively, all of which were among the 15 most abundant taxa.
KEGG functional prediction at level 3 (Fig. 4E) revealed the top 10 differential
pathways, which included the pentose phosphate pathway, secondary bile acid
biosynthesis, alanine-aspartate-glutamate metabolism, glutathione metabolism,
tyrosine metabolism, tryptophan metabolism, peroxisome, lysine degradation,
steroid biosynthesis, and steroid hormone biosynthesis, and Spearman correlation
analysis (Fig. 4F), between LEfSe-identified differentially abundant taxa, and
these pathways revealed that f-Staphylococcaceae and
f-Corynebacteriaceae were significantly positively correlated with
secondary bile acid biosynthesis (both p
Further analysis of f-Staphylococcaceae, f-Corynebacteriaceae,
and f-Porphyromonadaceae (Fig. 4G) revealed that, compared with the
control, the hypoxic groups presented significantly more
f-Staphylococcaceae (HYP3000: p
Analysis of the metabolite composition in the mouse colon by principal component
analysis (PCA; Fig. 5A) revealed differences in the composition and structure of
the gut metabolites between the control group and hypoxic groups (PC1: 57.8%,
PC2: 23.5%, and PC3: 18.7%). The volcano plot (Fig. 5B) displays differentially
abundant metabolite expression between groups, with screening criteria defined as
follows: VIP
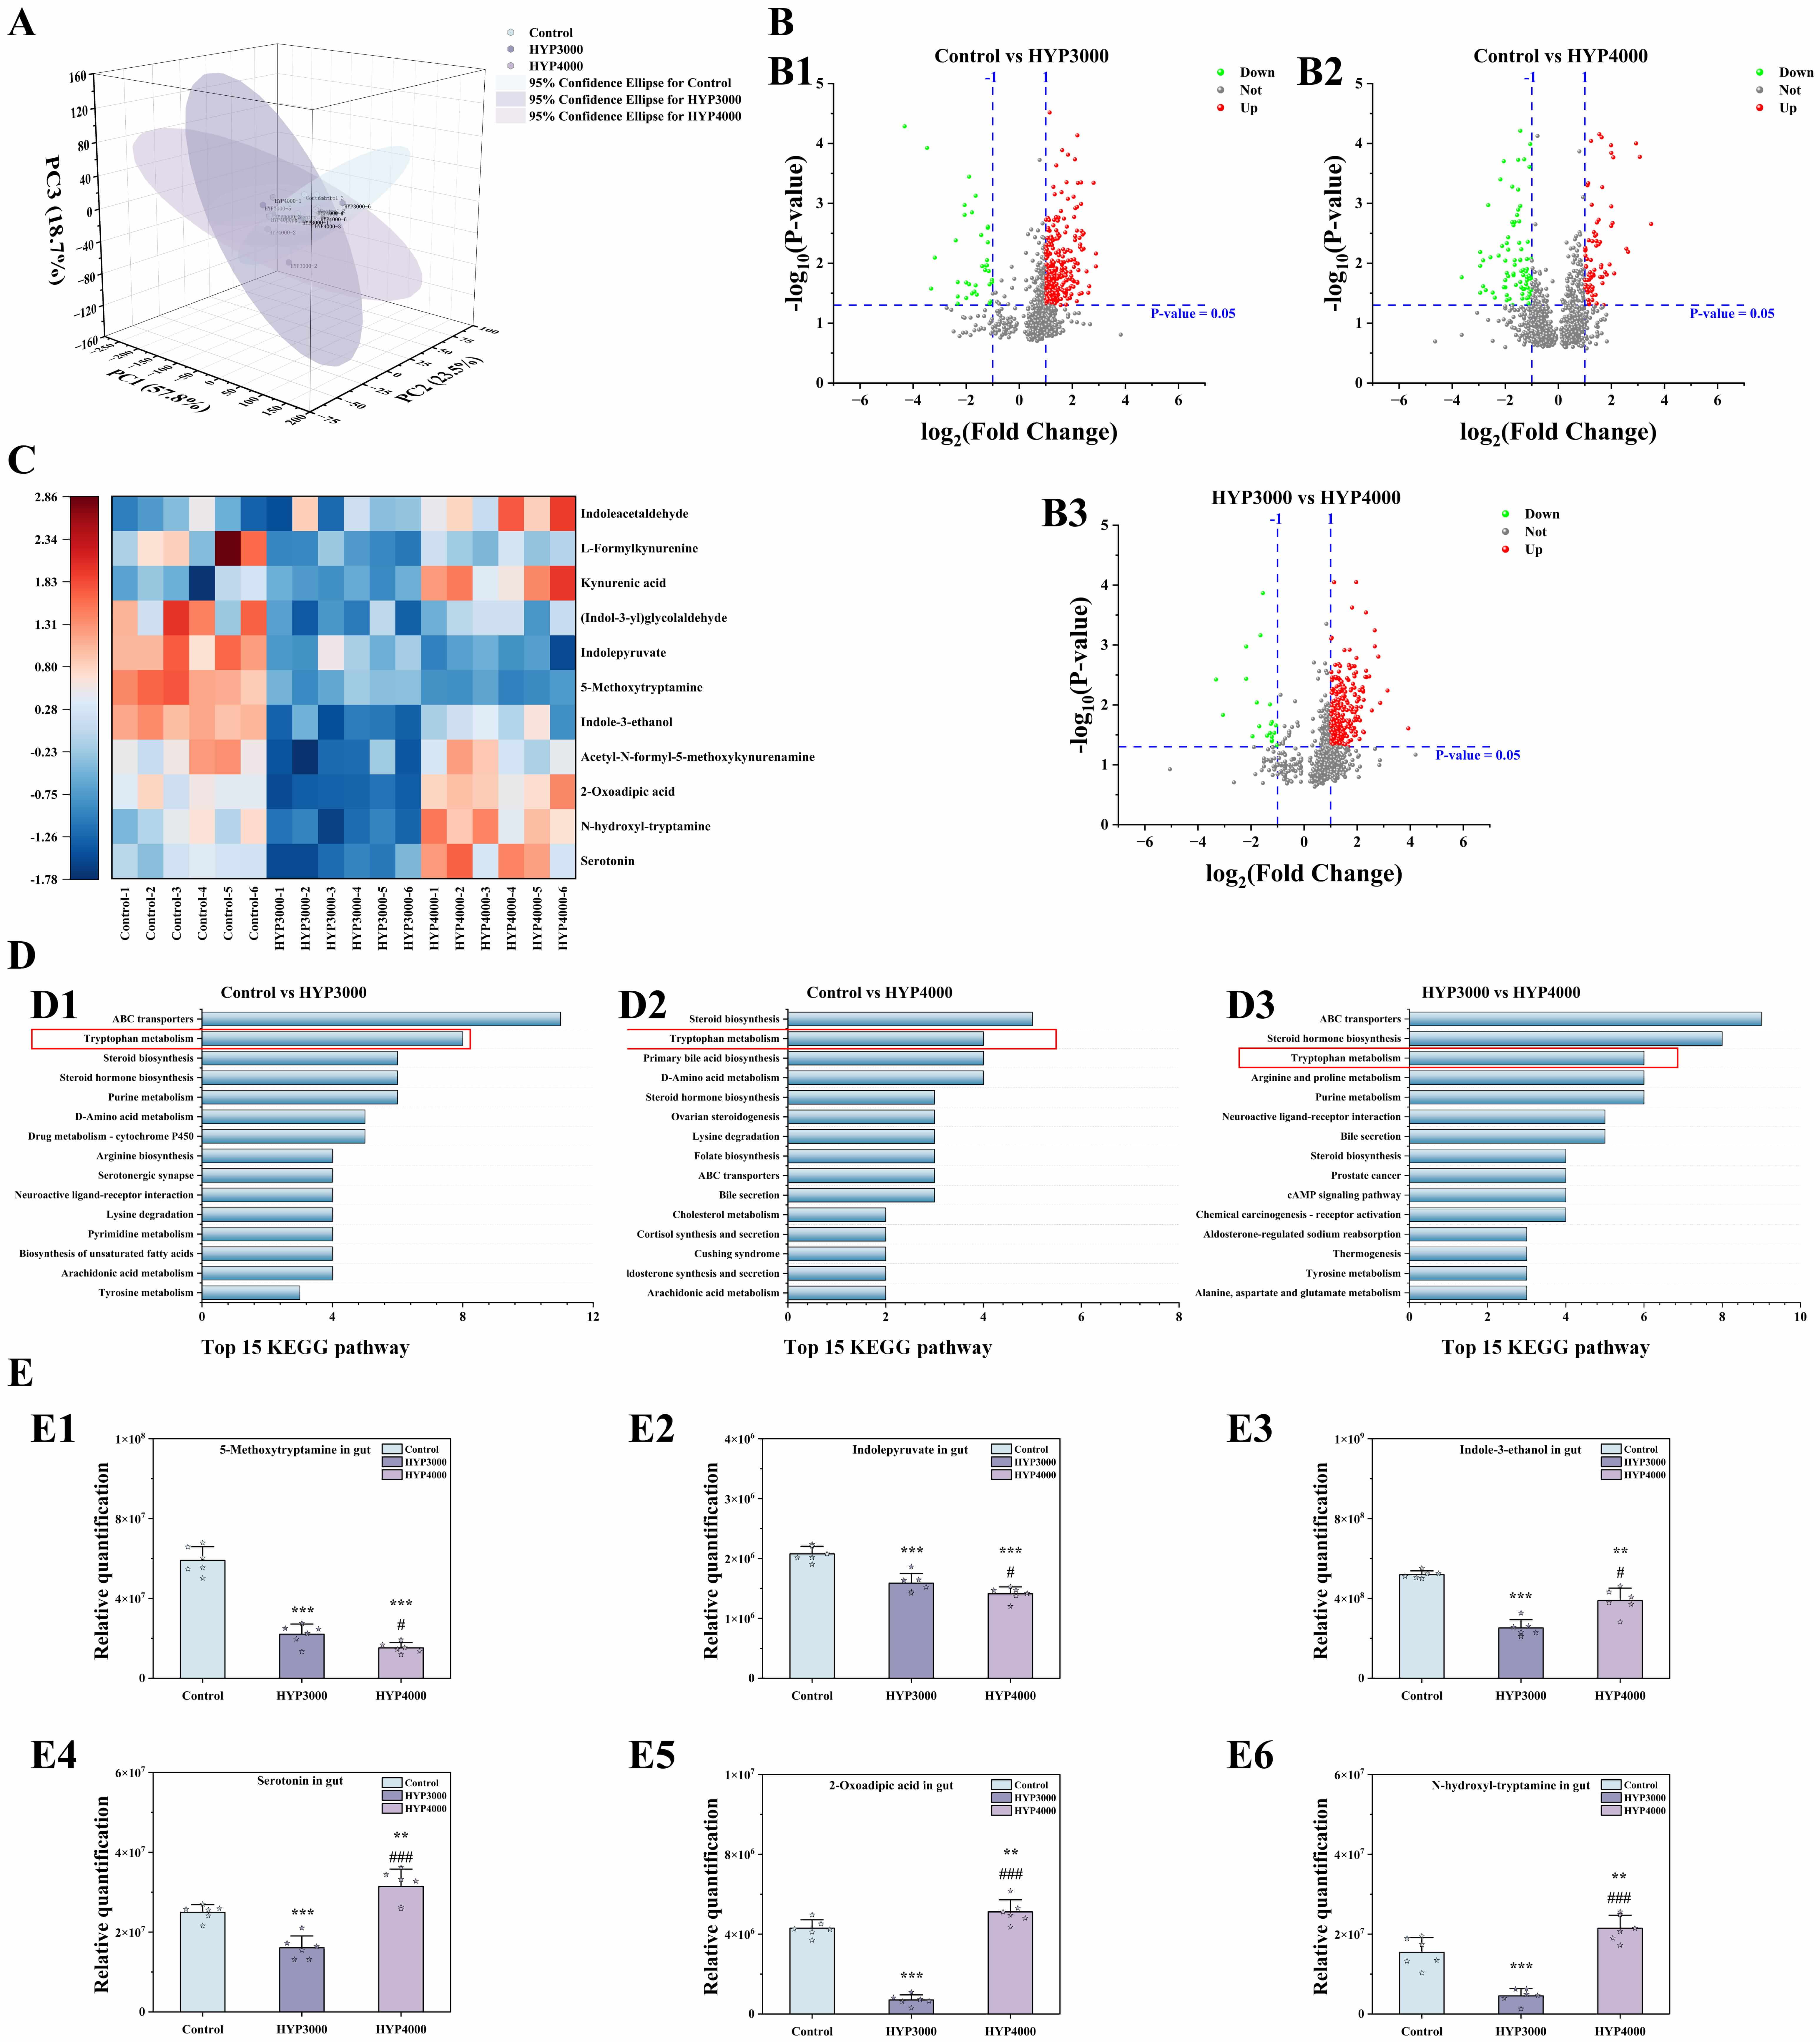 Fig. 5.
Effects of hypoxic exposure at different altitudes on gut
metabolism in mice. (A) Principal component analysis (PCA). (B) volcano plots,
(B1–B3) are as follows: comparison between Control and the HYP3000, comparison
between Control and the HYP4000, comparison between HYP3000 and the HYP4000. (C)
analysis of differentially abundant metabolites. (D) KEGG pathway analysis,
(D1–D3) are as follows: comparison between Control and the HYP3000, comparison
between Control and the HYP4000, comparison between HYP3000 and the HYP4000. The red box is used to highlight the tryptophan metabolism. (E)
differential metabolite abundance analysis, (E1–E6) are as follows:
5-methoxytryptamine, Indolepyruvate, Indole-3-ethanol, serotonin, 2-oxoadipic
acid and N-hydroxyl-tryptamine in gut. The data are presented as the means
KEGG pathway enrichment analysis (Fig. 5D) revealed tryptophan metabolism, steroid biosynthesis, and steroid hormone biosynthesis as shared pathways across all group comparisons. Among these pathways, tryptophan metabolism was among the top three pathways in the comparisons among the three groups.
Cluster analysis of DMs in this pathway revealed that, compared with those in the control group (Fig. 5C), all 11 DMs in the HYP3000 group were downregulated; in the HYP4000 group, 6 DMs were downregulated (5-methoxytryptamine, acetyl-N-formyl-5-methoxykynurenamine, L-formylkynurenine, Indolepyruvate, Indole-3-ethanol, and Indole-3-glycolaldehyde), and 5 DMs were upregulated (serotonin, N-hydroxyl-tryptamine, kynurenic acid, 2-oxoadipic acid, and Indoleacetaldehyde). Compared with the HYP3000 group, the HYP4000 group had 2 downregulated DMs (5-methoxytryptamine and Indolepyruvate) and 9 upregulated DMs (serotonin, N-hydroxyl-tryptamine, acetyl-N-formyl-5-methoxykynurenineamine, kynurenic acid, 2-oxoadipic acid, L-formylkynurenine, Indole-3-ethanol, Indole-3-glycolaldehyde, and Indoleacetaldehyde).
A detailed comparison of 6 DMs with significant differences across all three
groups (Fig. 5E) revealed that, compared with the control group, the HYP3000
group presented significant decreases in 5-methoxytryptamine (–62.56%, p
Analysis of untargeted metabolomics data from mouse hippocampi by PCA (Fig. 6A)
revealed differences in the composition and structure of hippocampal metabolites
between the control group and hypoxic groups (PC1: 15.8%, PC2: 8.9%, and PC3:
7.6%). The volcano plot of hippocampal metabolites (screening criteria: VIP
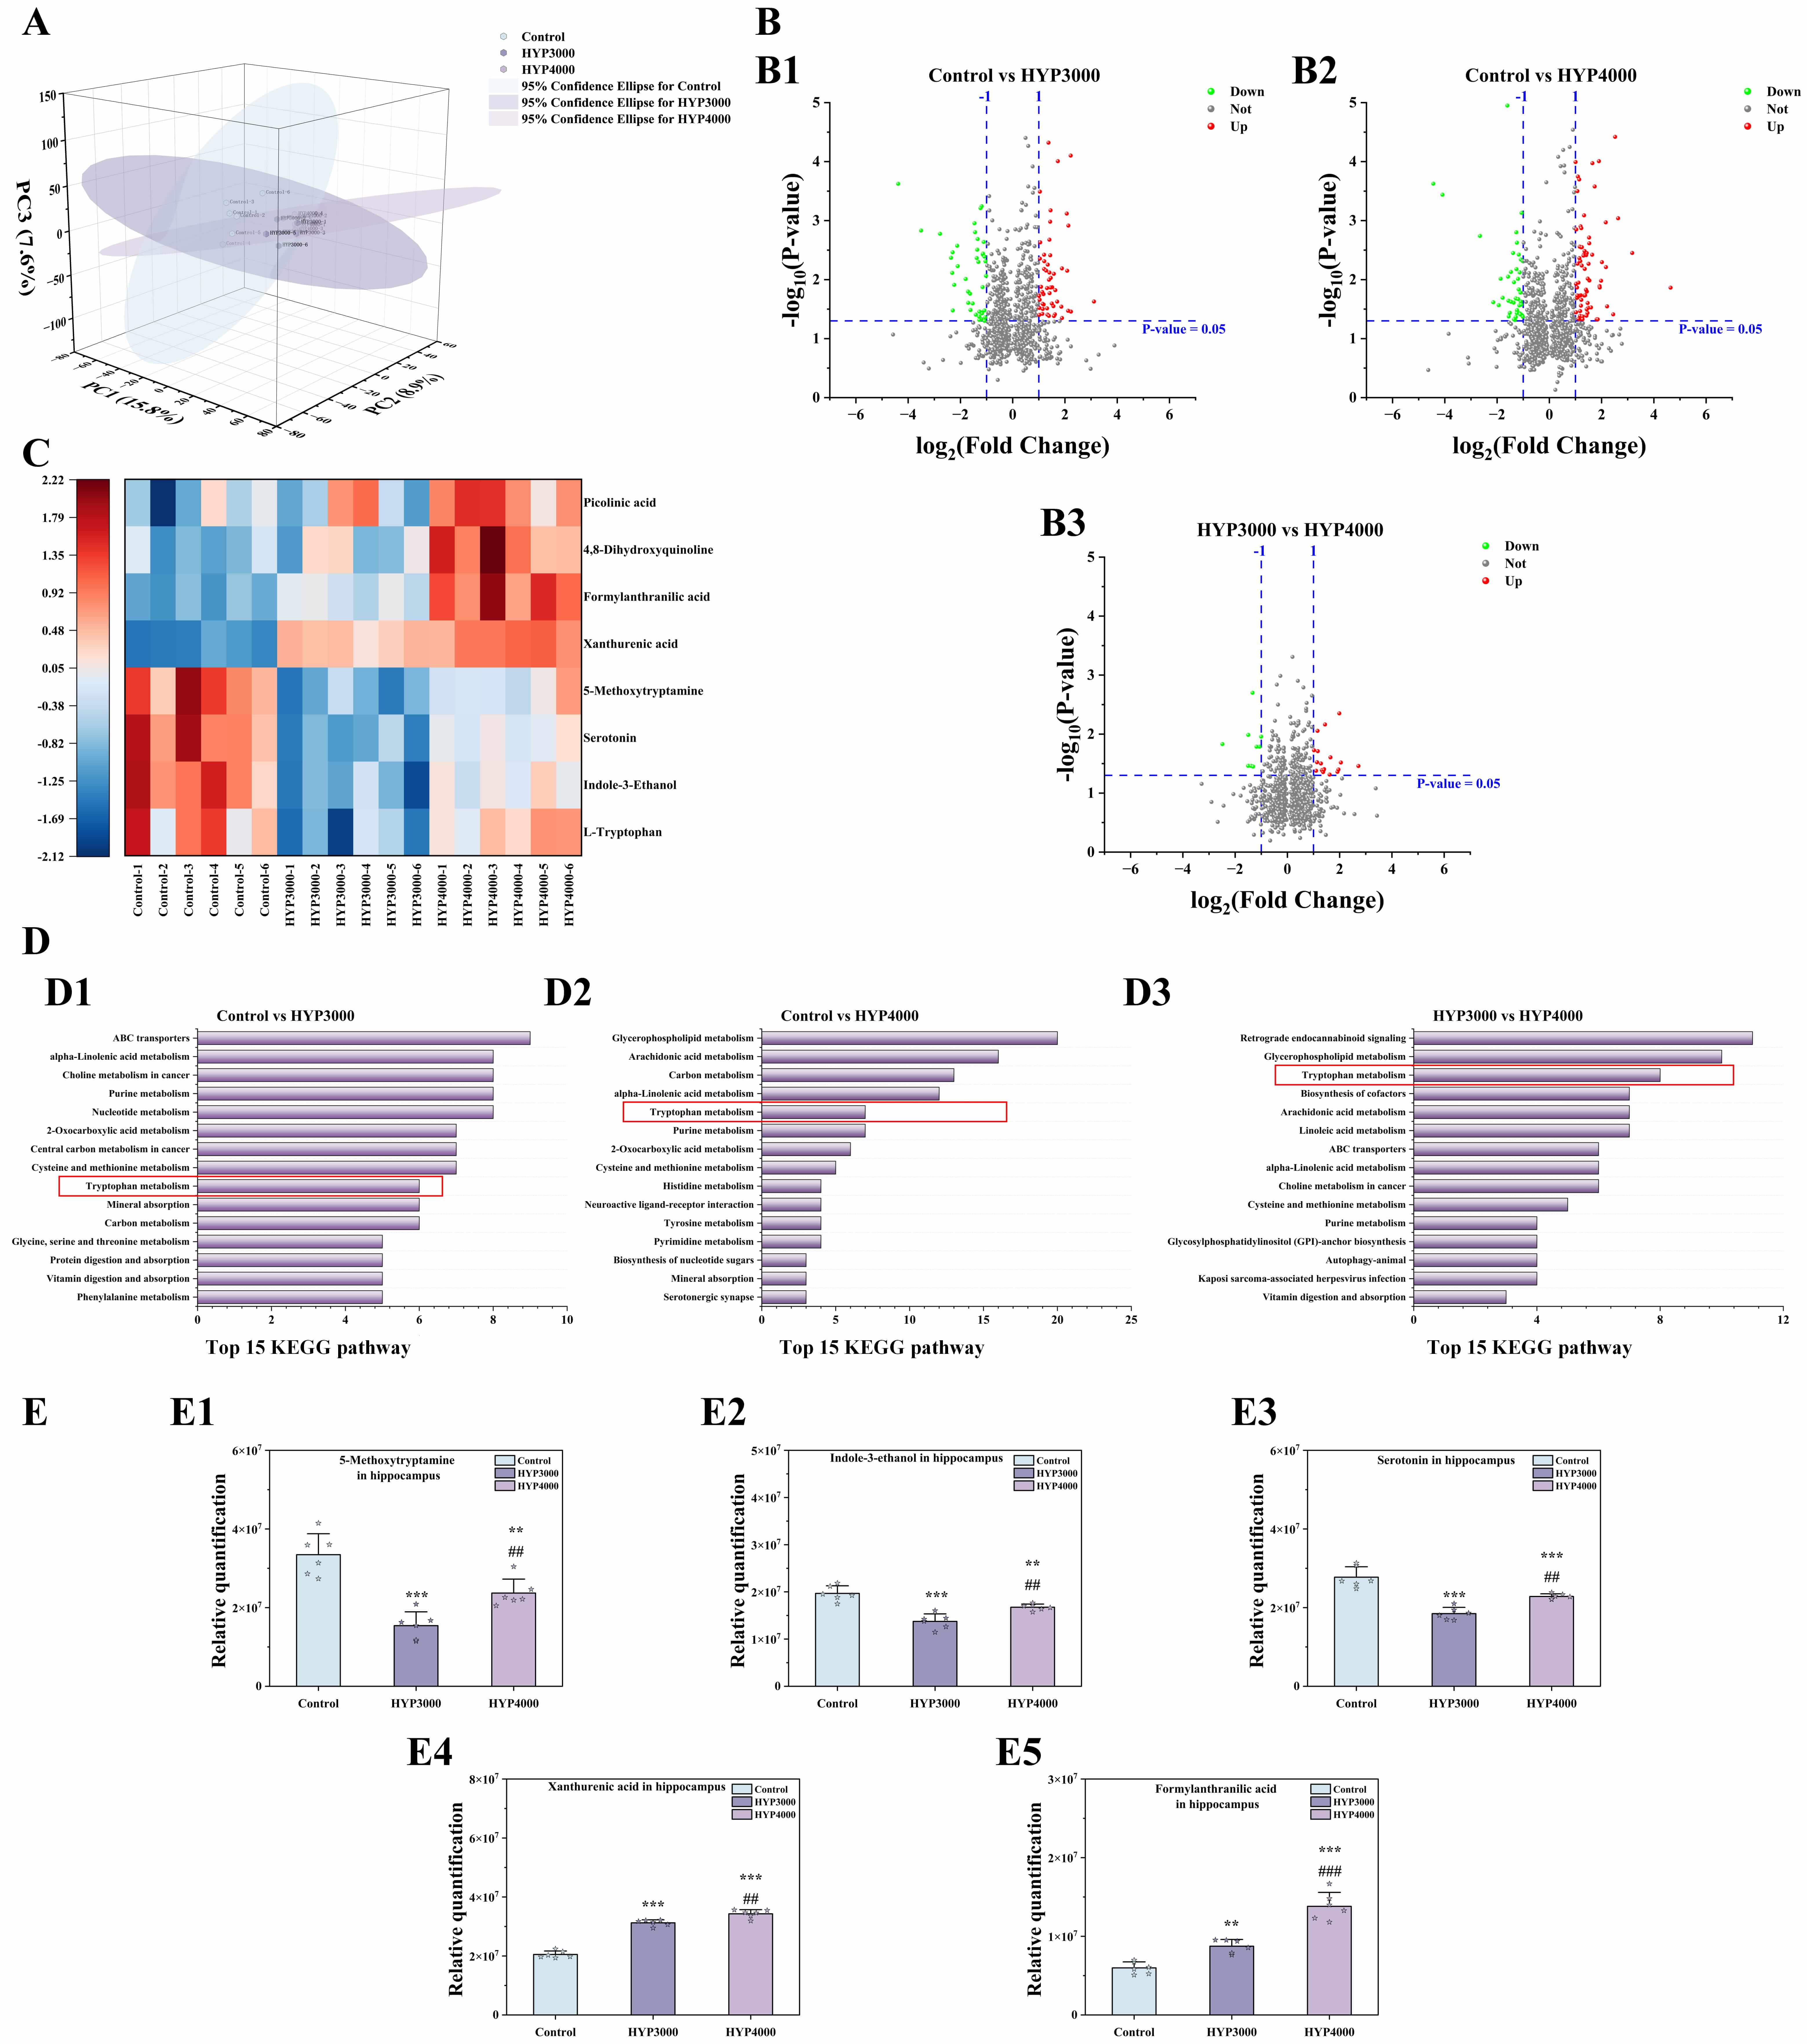 Fig. 6.
Effects of hypoxic exposure at different altitudes on
hippocampal metabolism in mice. (A) PCA. (B) volcano plots, (B1–B3) are as
follows: comparison between Control and the HYP3000, comparison between Control
and the HYP4000, comparison between HYP3000 and the HYP4000. (C) analysis of
differentially abundant metabolites, (D) KEGG pathway analysis, (D1–D3) are as
follows: comparison between Control and the HYP3000, comparison between Control
and the HYP4000, comparison between HYP3000 and the HYP4000. The red box is used to highlight the tryptophan metabolism. (E) differential
metabolite abundance analysis, (E1–E5) are as follows: 5-methoxytryptamine,
Indole-3-ethanol, serotonin, xanthurenic acid and formylanthranilic acid in
hippocampal. The data are presented as the means
KEGG pathway enrichment analysis (Fig. 6D) revealed that the tryptophan metabolism pathway was a shared pathway across all groups, which was consistent with the results of the gut metabolism analysis. Cluster analysis of the DMs in this pathway (Fig. 6C) revealed that compared with the control group, the HYP3000 group had 4 downregulated DMs (L-tryptophan, Indole-3-ethanol, serotonin, and 5-methoxytryptamine) and 4 upregulated DMs (xanthurenic acid, formylanthranilic acid, 4,8-dihydroxyquinoline, and picolinic acid); the HYP4000 group also had 4 downregulated DMs (L-tryptophan, Indole-3-ethanol, serotonin, and 5-methoxytryptamine) and 4 upregulated DMs (xanthurenic acid, formylanthranilic acid, 4,8-dihydroxyquinoline, and picolinic acid). Compared with those in the HYP3000 group, all the DMs in the HYP4000 group were upregulated.
A detailed comparison of 5 DMs with significant differences across all three
groups (Fig. 6E) revealed that, compared with the control group, the HYP3000
group presented significant decreases in 5-methoxytryptamine (–53.91%, p
RDA/CCA was performed to reduce the dimensionality of the behavioral phenotypes, biochemical indicators, gut microbiota, and DMs. The length of the arrow is positively correlated with the intensity of the factor’s influence on metabolites, whereas the straight-line distance from a metabolite to an arrow is negatively correlated with their association.
The results (Fig. 7A) revealed that the analysis was strongly representative
(explanatory rate: 89.79%; variance inflation factor (VIF)
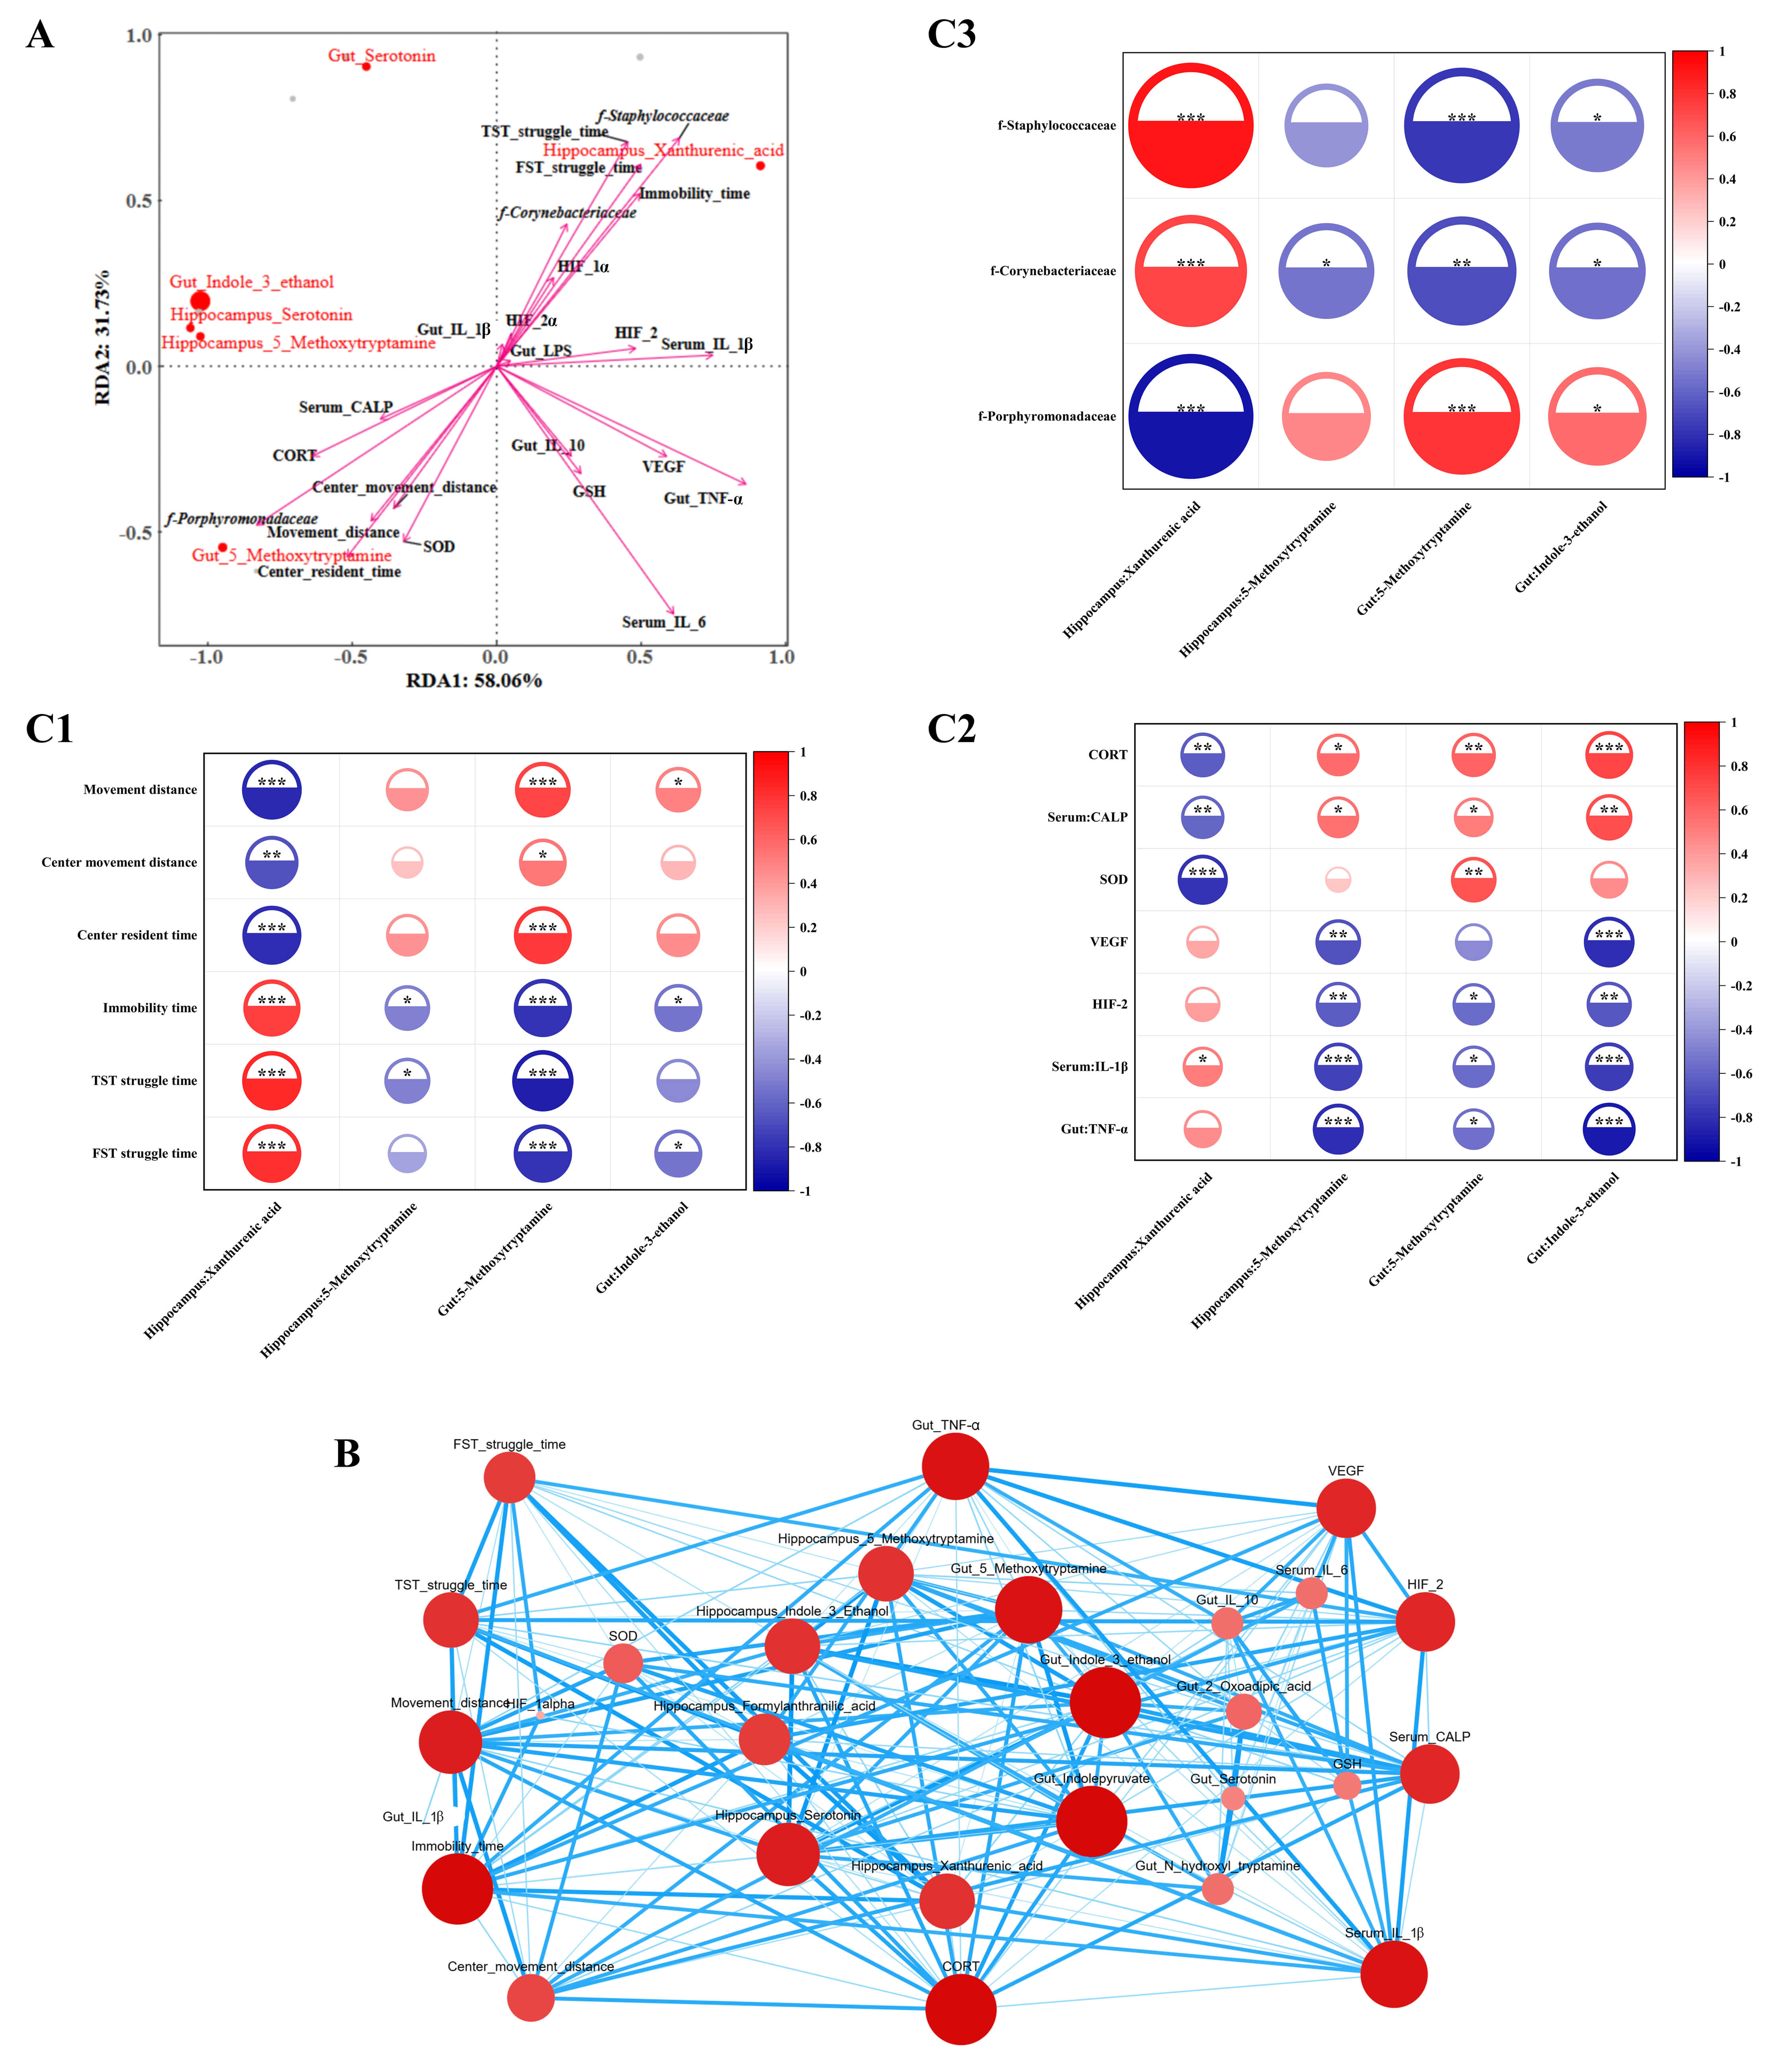 Fig. 7.
Spearman correlation analysis and network visualization (sample
size n = 6). (A) Redundancy analysis (RDA), (B) correlation network diagram, and
(C) Spearman correlation analysis, (C1–C3) are as follows: association between
metabolites and behavioral indicators, association between metabolites and
biochemical indicators, association between metabolites and microbiota. In Panel
B, the node size reflects the core degree of each substance (larger nodes
correspond to higher core degrees), whereas the thickness of lines between nodes
represents the absolute value of the correlation coefficient (thicker lines
indicate stronger correlations). *p
The strength of the relationships between differentially abundant metabolites
and behavioral phenotypes decreased in the following order: TST struggle time
The strength of the relationships between differentially abundant metabolites
and biochemical indicators was in the following order: IL-6
The strength of the relationships between the differentially abundant
metabolites and microbiota decreased in the following order:
f-Porphyromonadaceae
Network correlation analysis was conducted on behavioral phenotypes, biochemical
indicators, the gut microbiota, and differentially abundant metabolites, with the
results revealing four metabolites with high degree, closeness centrality, and
betweenness centrality—gut: Indole-3-ethanol (degree: 19; closeness centrality:
23; betweenness centrality: 47), gut:5-methoxytryptamine (degree: 18; closeness
centrality: 23; betweenness centrality: 9), hippocampus:5-methoxytryptamine
(degree: 15; closeness centrality: 21; betweenness centrality: 13), and
hippocampus: xanthural-acid (degree: 15; closeness centrality: 21; betweenness
centrality: 5)—indicating that they are key substances connecting various
indicators (Fig. 7B). Furthermore, Spearman correlation analysis between these
four metabolites and key behavioral phenotypes, biochemical indicators, and the
gut microbiota (Fig. 7C) revealed that the gut: 5-methoxytryptamine ratio and the
hippocampus: xanthurenic-acid ratio were significantly correlated with behavioral
indicators; the hippocampus: 5-methoxytryptamine ratio was associated with
different time points and TST struggle times; and the gut: Indole-3-ethanol ratio
was correlated with movement distance, immobility time, and FST struggle time.
Biochemical indicator correlations revealed that hippocampus: 5-methoxytryptamine
and gut: Indole-3-ethanol were significantly associated with serum:
IL-1
Immunofluorescence staining was used to determine the effect of hypoxia on
oligodendrocyte precursor cells in each subregion of the mouse hippocampus (Fig. 8A). Compared with that of the control group (Fig. 8B), the fluorescence density
of NG2 was greater in the hippocampal CA1 (HYP3000: 2.01%; HYP4000: 9.64%), CA3
(HYP3000: 64.49%, p
 Fig. 8.
Effects of hypoxic exposure at different altitudes on
hippocampal function in mice. (A) Immunofluorescence images of neuron–glial
antigen 2 (NG2), oligodendrocyte transcription factor 2 (Olig2) and Merge. Scale
bar = 100 µm. (B) Fluorescence density (sample size n = 3), (B1,B2) are as
follows: fluorescence density of NG2, Olig2. (C) Neurotransmitter levels (sample
size n = 6), (C1–C5) are as follows: brain-derived neurotrophic factor (BDNF),
5-hydroxytryptamine (5-HT), norepinephrine (NE), dopamine (DA),
gamma-aminobutyric acid (GABA). The data are presented as the means
Neurotransmitter levels in the mouse cerebral cortex were assessed, and the
results (Fig. 8C) revealed that compared with those in the control group, the DA
levels in the hypoxia groups were significantly greater (HYP3000: 6.65%, p
Numerous clinical and epidemiological studies have confirmed that high-altitude
residence is closely associated with an increased risk of depression. A
systematic review and meta-analysis encompassing more than 40,000 participants
from 4 countries reported that the prevalence of depressive symptoms in
high-altitude (
First, behavioral tests, including the OFT, TST, and FST, were conducted to
evaluate behavioral alterations in mice exposed to a hypoxic environment, with
hypoxic groups exhibiting depressive-like behaviors compared with the normoxic
control group. Specifically, in the OFT, the HYP4000 group presented 38.69%
increases in immobility time (p
It is important to contextualize the behavioral phenotype of hypoxic mice with
their comprehensive behavioral profile and the pathological background of
high-altitude hypoxia, as increased struggle time and decreased immobility in the
TST/FST—conventionally interpreted as antidepressant-like effects in standard
depression models—do not reflect such effects here. In classic depression
models (e.g., chronic unpredictable stress model), mice exhibit decreased
struggle time [40], while in anxiety models, mice show increased struggle time
accompanied by stereotyped behaviors [41], an essential distinction from the
“functional struggle” induced by antidepressant drugs. The increased struggle
time in the TST and FST observed in this study is neither a traditionally
recognized “antidepressant-like effect” nor a pure anxiety phenotype [42].
Instead, it reflects impaired stress adaptation caused by the collapse of the
central stress regulatory network under hypoxia-induced comorbid
depression-anxiety conditions. Unlike pharmacologically induced antidepressant
responses (e.g., selective serotonin reuptake inhibitors that increase synaptic
5-HT availability), hypoxic mice simultaneously displayed reduced center movement
distance (–32.66% in HYP4000), shortened center residence time (–60.72% in
HYP4000), and decreased total movement distance (–25.05% in HYP4000) in the
OFT—core indicators of anxiety-like and anhedonic behaviors, which are hallmark
features of depressive-like phenotypes. Instead, the increased struggle time in
the TST/FST under hypoxia reflects impaired stress tolerance and dysregulated
coping responses, supported by concurrent HPA axis hypofunction (64.92%
reduction in CRH in HYP4000) and hippocampal CA3 region disorganization (loose
cell arrangement, widened intercellular spaces) that disrupts the neural
circuitry mediating stress adaptation. These preclinical findings align with
population-based evidence [12], collectively demonstrating that chronic hypobaric
hypoxia is a key driver of depressive phenotypes. For high-altitude residents,
long-term oxygen deprivation not only triggers systemic inflammation (which is
correlated with elevated C-reactive protein levels) and HPA axis dysfunction but
also disrupts the gut microbiota balance and tryptophan metabolism—the core
mechanisms identified in our mouse model. Additionally, age-specific
vulnerabilities exist: middle-aged and elderly individuals are more susceptible
at 500~2000 m, whereas young people face greater risks at extreme
altitudes (
However, a critical distinction must be made between anxiety-like and
depression-like phenotypes induced by hypoxia, as they involve distinct neural
circuits yet share common pathogenic pathways. OFT-detected reductions in central
zone exploration are unequivocally associated with anxiety, reflecting
hyperactivation of the amygdala‒hippocampal fear circuit. Our data align with
previous findings that high-altitude hypoxia triggers anxiety-like behaviors via
HPA axis overactivation (evidenced by Arginine Vasopressin/Glucocorticoid
Receptor (AVP/GR) upregulation in the hypothalamic paraventricular nucleus) and
neuroinflammatory responses. In contrast, TST/FST behavioral alterations reflect
depression-related dysregulation of stress coping and are correlated with
disrupted serotonergic signaling in the prefrontal cortex‒hippocampal pathway.
Notably, anxiety and depression often co-occur under hypoxic stress, which is
supported by our multidimensional data. Serum levels of IL-1
Our results identify the gut microbiota-tryptophan metabolism axis as the
central pathway that translates hypoxic environmental stress into neurotoxicity.
On the basis of our previous findings, hypoxia disrupts the composition of the
gut microbiota [44, 45], which serves as a central mediator in brain‒gut axis
communication [12]. Therefore, we investigated alterations in the intestinal
microbial community. 16S rRNA sequencing revealed that microbial diversity in the
hypoxic mouse groups was significantly reduced, as indicated by decreased
Shannon, Simpson, and Chao1 indices (Shannon index: p
These findings address a critical knowledge gap regarding key metabolic nodes within the “hypoxia–gut microbiota–depression” axis. Collectively, our results suggest that gut microbiota dysbiosis acts as an initiating factor in hypoxia-induced depression, driving aberrant tryptophan metabolism and mediating hippocampal dysfunction via the gut‒brain axis, which is the core mechanism elucidated in this study.
As previously discussed, aberrant hippocampal neural function is the terminal
neurotoxic effector pathway of hypoxia-induced depressive-like behaviors, which
are intricately linked to the aforementioned gut‒brain axis mechanism,
collectively forming a comprehensive hypoxia‒related network that is correlated
with the regulatory network of toxicity. Oligodendrocytes are increasingly
recognized as key players in neuroimmune modulation under environmental stress
[56]; thus, we examined oligodendrocyte dynamics in the hippocampus.
Immunofluorescence analysis revealed a significant increase in the fluorescence
density of the oligodendrocyte precursor cell (OPC) markers NG2 and Olig2 in the
hippocampal CA3 and DG regions of the hypoxic groups; specifically, NG2
expression in the HYP4000 group increased by 100.22% (p
Additional neurotransmitter profiling revealed that the levels of
antidepressant-associated neurotransmitters, including GABA, BDNF, 5-HT, and NE,
in the cerebral cortex were significantly reduced under hypoxic conditions (BDNF
levels in the HYP4000 group decreased by 37.29%, p
Although new findings have been reported, this study has some limitations. (1) Limitations of the animal models: The present study utilized only male KM mice aged 5–6 weeks and did not include female subjects or other mouse strains, such as C57BL/6. Sex differences may significantly influence susceptibility to depression; for example, females are generally more sensitive to hypoxia-induced stress, and interstrain variations exist in both the composition of the gut microbiota and hypoxia tolerance. Therefore, the generalizability of the findings to other sexes or genetic backgrounds may be limited. (2) Duration of hypoxic exposure: This study focused exclusively on acute hypoxia over a 7-day period and did not examine chronic hypoxic exposure for more than one month. Given that most individuals residing at high altitudes experience long-term hypoxic conditions, chronic hypoxia may induce adaptive alterations in the gut microbiota and metabolic profiles that differ mechanistically from those observed under acute exposure. Additionally, the study did not investigate recovery following cessation of hypoxia, thus precluding evaluation of the reversibility of the observed effects. (3) Causal Relationships Not Established: Although correlations were identified among the gut microbiota, tryptophan metabolism, and depressive-like behaviors, the causal relationships remain unverified. The absence of interventions such as fecal microbiota transplantation (e.g., transferring microbiota from hypoxic mice to germ-free recipients) or direct metabolite supplementation (e.g., administration of 5-methoxytryptamine) limits the ability to determine whether microbial or metabolic changes directly contribute to depressive phenotypes. Although both KEGG functional prediction of gut microbiota and untargeted metabolomics indicate the critical role of the tryptophan metabolic pathway, the functional prediction of gut microbiota is a speculative conclusion, and the regulatory effect of key gut microbiota on the tryptophan metabolic pathway lacks further verification of causal relationships. (4) Scope of Measured Outcomes: The behavioral assessments were restricted to depressive-like behaviors and did not extend to cognitive functions, such as spatial learning and memory (e.g., via the Morris water maze). The hippocampal analyses focused solely on OPCs without evaluating other critical neurobiological markers, such as neuronal apoptosis or microglial activation. Furthermore, the functional potential of the gut microbiota was inferred through KEGG pathway prediction rather than direct measurement of key metabolites such as SCFAs or bile acids, which may have led to an underestimation of functional microbial changes. (5) Clinical translatability: The findings derived from animal models require validation in human populations. To date, clinical data on the gut microbiota composition and tryptophan metabolite levels in individuals with depression living at high altitudes are lacking. Consequently, whether the mechanisms observed in this murine model are applicable to humans remains uncertain.
Therefore, on the basis of the innovations and limitations of this study, further research is still needed in the following aspects. (1) Expanding animal models and modeling conditions: Female mice, more mouse strains and nonhuman primates should be used to investigate potential sex- and species-specific differences. Chronic hypoxia groups with exposure durations of one month or longer, as well as reoxygenation recovery groups after hypoxia cessation, should be established to evaluate the long-term effects and reversibility of hypoxia exposure. (2) Validation of causal relationships: A key limitation of this study is its observational and correlational design, as no intervention experiments (e.g., fecal microbiota transplantation (FMT), antibiotic-induced gut microbiota depletion, or supplementation with key taxa/metabolites) were performed to verify causal relationships between changes in the gut microbiota and emotional phenotypes. While multiomics correlation analyses support a potential regulatory network, causality cannot be definitively inferred from associative data alone, as noted in prior microbiota‒gut‒brain axis studies. Future studies should use intervention approaches (e.g., FMT) to validate whether targeting the gut microbiota or tryptophan metabolism can reverse hypoxia-induced emotional and neurobiological alterations, thereby confirming causal links. (3) Clinical translation: Observational cohort studies in high-altitude populations should be conducted to verify the translational relevance of findings from animal models and targeted clinical intervention trials for high-risk populations in high-altitude areas should be designed and implemented to evaluate the intervention effects of probiotic supplementation or pharmacological regulation of the tryptophan metabolic pathway. (4) Limitation of sucrose preference test (SPT) exclusion and future optimization: This study did not incorporate the SPT because of inconsistent preliminary results, which were attributed to evaporation of the sucrose solution and inherent spatial preferences in mice. As a result, anhedonia could not be directly assessed, representing a key limitation of the present work. Future studies may address this limitation by optimizing the experimental protocol through the use of sealed containers, standardized placement of drinking bottles, and adequate preadaptation of the mice to the testing environment. (5) This study did not assess OPC differentiation status (e.g., the mature oligodendrocyte marker myelin basic protein (MBP) or Cyclin-dependent kinase inhibitor 1 (CC1)) or perform in vivo tracking of OPC fate. Future studies should combine lineage tracing and differentiation marker detection to clarify whether hypoxic OPCs can successfully mature into functional oligodendrocytes. Additionally, intervention experiments (e.g., growth hormone supplementation or CRH signaling modulation) could be used to verify whether promoting OPC differentiation can reverse hypoxia-induced hippocampal dysfunction, thereby validating the causal role of insufficient OPC repair in the observed phenotypes.
This study revealed strong correlations between acute hypoxia, gut microbiota imbalance, tryptophan metabolism disruption, inflammatory responses, HPA axis dysfunction, and a complex negative emotional state encompassing anxiety- and depression-like behaviors. These findings highlight a potential regulatory network centered on the gut microbiota‒tryptophan metabolism axis, providing a foundation for future intervention studies to validate causal relationships and explore therapeutic targets for hypoxia-associated emotional disturbances. Our findings provide a toxicological framework for understanding high-altitude hypoxia-induced depression and offer translational tools for protecting the health of populations in high-altitude ecosystems.
The authors declare that all the data supporting the findings of this study are available upon reasonable request. Raw read files (SRAs) for 16S rRNA sequencing of gut bacteria were deposited into the National Center for Biotechnology Information Sequence database (BioProject: PRJNA1267953). As these data are related to our upcoming experiments and articles, they will not be accessible until September 1, 2026.
HB: Writing—review & editing, supervision, resources, conceptualization, funding acquisition. LW: Supervision, Resources, Funding acquisition, Methodology. TG: Supervision, Funding acquisition, Conceptualization. RC: Methodology, Writing—original draft, Validation, Data curation, Formal analysis, Investigation. YQ: Methodology, Data Curation, Writing—Review & Editing, Project Administration. HZ: Investigation, Methodology. XL: Validation, Formal analysis. QW: Investigation, Formal analysis. XZ: Investigation. JW: Investigation. All authors contributed to editorial changes in the manuscript. All authors read and approved the final manuscript. All authors have participated sufficiently in the work and agreed to be accountable for all aspects of the work.
All animals used in this study were in compliance with ARRIVE guidelines and were subjected to the National Institutes of Health Guidelines for the Care and Use of Laboratory Animals (NIH Publication 18 No. 8023, revised in 1978), which was approved by the Chinese Academy of Sciences Approved by the Northwest Plateau Institute of Biology Committee for use in animal experiments (lot number NWIPB20171106-01).
The basic illustration materials of Figs. 1,3 in this paper are sourced from the Vecteezy platform, and we hereby express our gratitude to the official Vecteezy website. The authors acknowledge Xingang Lv (Shanxi Qinyi Biotechnology Co., Ltd, Shanxi, Taiyuan, China) for the technical support.
This work was supported by the Natural Science Foundation of China (Grant No. 82171863), Special Funds for Central Government to Guide Local Scientific and Technological Development (2025ZY010) and the Tianfu Emei Project of Sichuan Province.
The authors declare no conflict of interest. No potential conflicts of interest exist between the authors and the company acknowledged in this work.
References
Publisher’s Note: IMR Press stays neutral with regard to jurisdictional claims in published maps and institutional affiliations.