


 , Chunlei Liu 1,*
 , Yuyan Jing 1, Zhenzhen Yao 2, Min Chen 2,3,*
1 School of Psychology, Qufu Normal University, 273165 Qufu, Shandong, China
2 School of Mental Health, Jining Medical University, 272000 Jining, Shandong, China
3 Department of Psychiatry, Shandong Daizhuang Hospital, 272051 Jining, Shandong, China
Abstract
Deficits in visual working memory (vWM) represent a core cognitive impairment in schizophrenia; however, the dynamic spatiotemporal characterization of their underlying neural mechanisms remains unclear. The present study employed multivariate pattern classification (MVPC) and searchlight analysis to investigate neural signaling differences between patients with schizophrenia (PSZ) and healthy control subjects (HCS) during a vWM task.
A total of 46 participants (22 PSZ, 24 HCS) completed a change detection task comprising three conditions: two targets, zero distractors (2T0D); two targets, two distractors (2T2D); and four targets, zero distractors (4T0D). Contralateral delay activity (CDA) was extracted through event-related potential (ERP) analysis. MVPC was applied in the temporal dimension, while a searchlight approach was employed in the spatial dimension to decode memory load (2T0D/2T2D/4T0D) and memory side (left/right) information.
CDA amplitude was significantly reduced in the PSZ group, particularly in the 2T2D condition (p = 0.01), indicating that the scope and control of attention elicited comparable CDA amplitudes. MVPC analysis revealed that decoding accuracy in the PSZ group was significantly lower than in the HCS group during the time window of 93–652 ms (pcorrected < 0.05), suggesting diminished efficiency of neural information encoding during the delay period. The searchlight analysis identified the most pronounced decrease in decoding accuracy within the left parietal region in the PSZ group, consistent with the hypothesis of abnormal functional connectivity in the inferior parietal gyrus (IPG).
This study reveals the spatiotemporal dynamics of vWM deficits in schizophrenia, characterized by ERP decoding technology. It offers a novel target for the development of neuromarker-based cognitive interventions.
Keywords
- decoding
- event-related potential
- schizophrenia
- cognitive deficit
- visual working memory
1. Patients with schizophrenia exhibit significantly reduced neural decoding accuracy during the visual working memory delay period compared to healthy controls, indicating diminished maintenance of stimulus-specific information in neural signals (93–652 ms post-stimulus).
2. Spatial decoding analysis reveals pronounced deficits in the left parietal cortex of patients with schizophrenia, with searchlight analysis showing significantly lower decoding accuracy across all electrode sites, particularly in left parietal regions, suggesting compromised neural information representation in this area.
3. Patients with schizophrenia demonstrate reduced contralateral delay activity amplitudes and lower working memory capacity, with the most severe behavioral and neural impairments observed under conditions requiring attention control (distractor presence), though they maintain above-chance decoding ability.
4. Multivariate pattern classification and searchlight decoding methods effectively reveal the spatiotemporal dynamics of visual working memory deficits in schizophrenia, providing a sensitive, individualized approach to characterizing neural representation impairments that extends beyond traditional univariate event-related potential (ERP) analyses.
Schizophrenia is a complex and severe brain disorder characterized by neurocognitive dysfunction at its core [1]. According to the World Health Organization, by 2021, nearly 24 million people worldwide were projected to suffer from this disorder, resulting in a significant social burden. Impairment in working memory (WM) is a fundamental cognitive deficit associated with schizophrenia [2, 3, 4, 5] and has been identified as a potential warning sign for the onset of psychosis [6, 7, 8].
Since visual working memory (vWM) is strongly correlated with higher cognitive functioning, recent research on working memory in patients with schizophrenia (PSZ) has focused on vWM [9, 10, 11, 12, 13, 14, 15]. Attention plays a crucial role in the encoding, maintenance, and extraction of vWM. Based on their independent contributions to vWM performance, attention processes can be subdivided into scope and control [16, 17, 18, 19]. Attention scope refers to the quantity of information that can be actively maintained over a specific duration, while attention control refers to the ability to focus on relevant information while ignoring irrelevant details. Both attention scope and attention control significantly impact vWM capacity [16].
Contralateral delay activity (CDA), a negative slow wave sensitive to the number of objects held in vWM, is commonly used to examine neural activity during the maintenance phase of vWM. Its possible source has been localized to the posterior parietal cortex [20, 21, 22]. A key feature of CDA is that its amplitude increases with the number of objects held in vWM [23, 24, 25]. Numerous studies have demonstrated that PSZ exhibit smaller CDA amplitudes and reduced vWM capacity [10, 11, 14, 26].
Decoding methods are frequently employed to study neurocognitive processing mechanisms in typical individuals and to quantify the information contained in the neural signals of individual participants. Researchers gain insights into brain processing by making statistical inferences about the availability of information [27]. Additionally, comparing decoding accuracy across different brain regions and time points can help elucidate the location and time course of information processing in the brain [28]. In previous studies, researchers have predominantly applied decoding methods to functional magnetic resonance imaging (fMRI) studies, often overlooking the potential benefits of applying these methods to electroencephalogram (EEG) studies.
Multivariate pattern classification (MVPC) is a decoding method employed for EEG data. MVPC utilizes the scalp distribution of EEG signals to decode or track the information contained within these signals, enabling the assessment of how the informational content of neural signals evolves over time following the onset of stimulation [28]. This method has been successfully applied to identify the neural mapping between activity distribution patterns and corresponding mental states [29, 30, 31, 32]. For many inquiries regarding mental disorders—particularly in the domains of perception, attention, and working memory—temporal discrimination may be as crucial as spatial discrimination [33]. In cognitive neuroscience, searchlight analysis is extensively utilized to localize brain regions associated with specific mental processes [34]. Searchlight analysis is entirely data-driven and does not employ any geometric transformations to address high-dimensional problems, thereby preserving spatial information in its original context [35].
In vWM research, the change detection task has become a widely used method for estimating working memory capacity [24]. Therefore, the change detection task was selected as the experimental task for this study, with the CDA serving as the event-related potential (ERP) indicator. Two decoding methods—MVPC and searchlight analysis—were employed to decode the memory load and memory side of ERPs across temporal and spatial dimensions, respectively. The aim was to investigate the neural signaling differences between PSZ and healthy controls (HCS) during a vWM task.
According to G*Power 3.1.9.4 (https://www.psychologie.hhu.de/) calculations
[36], repeated measures analyses of within-group and between-group interactions
were conducted in the present study, with a statistical power of 95%,
Participant exclusion criteria included: (i) a history of traumatic brain injury, neurological disease, or other significant physical illnesses; (ii) prior receipt of electroconvulsive therapy; (iii) a history of alcohol or drug abuse or dependence; (iv) individuals with secondary psychotic symptoms resulting from other organic causes or substance use; and (v) intellectual disability.
The Positive and Negative Syndrome Scale (PANSS) [37], which is commonly used in clinical practice to assess the clinical symptoms of PSZ, was used. The PANSS consists of the General Psychopathology Scale (GPS), the Positive Symptoms Subscale (PSS), the Negative Symptoms Subscale (NSS), and three supplemental scales, totalling 33 items. The Spatial Span (SS) and Number Span (NS) of the MATRICS Consensus Cognitive Battery (MCCB) were selected for working memory assessment, and the change detection task was selected for assessing vWM [24].
The experimental paradigm utilized the change detection task. The stimulus material presented to participants consisted of red or blue color targets appearing on both sides of fixation in various orientations (0°, 45°, 90°, 135°), with the color targets displayed in random orientations. The experimental program was developed and executed using E-Prime 3.0 (Psychology Software Tools (PST), Inc., Pittsburgh, PA, USA). At the beginning of each trial, a spatial arrow cue was presented for 200 ms, prompting participants to remember the target stimulus associated with the specified visual field side (left, right) and color (red, blue). This was followed by a 100 ms memorization page, immediately succeeded by a 900 ms delay page. Finally, a probe page was displayed, where participants were required to quickly and accurately determine whether the direction of the target stimulus had changed for the specified visual field side and color (with a maximum response time of 2000 ms; see Fig. 1). The task comprised three conditions: two targets, zero distractors (2T0D), two target stimuli presented simultaneously with two distractor stimuli (2T2D), and four targets, zero distractors (4T0D). In the formal experiment, there were 80 trials for each condition, resulting in a total of 240 trials.
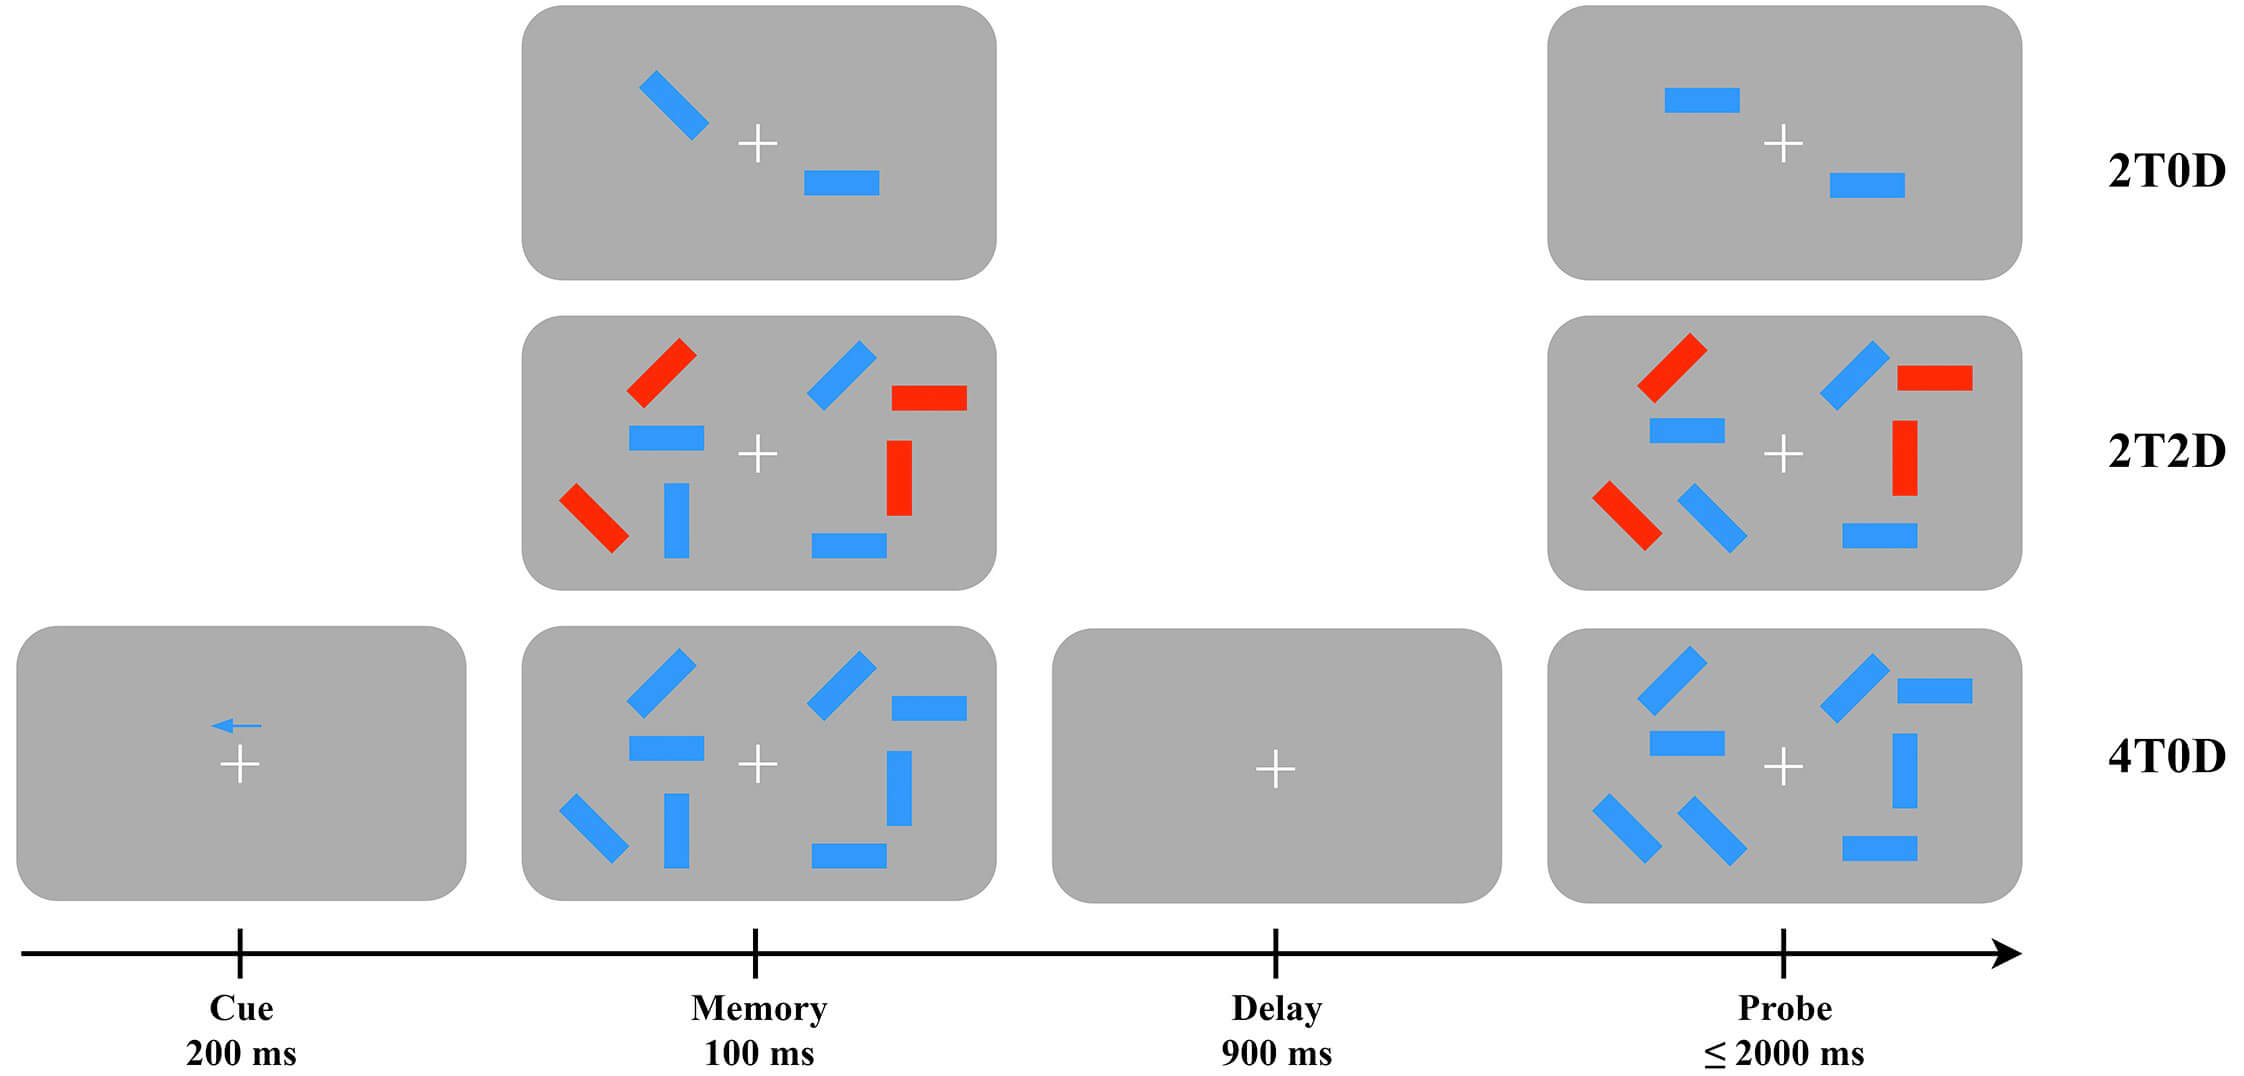 Fig. 1.
Flowchart of the change detection task. Blue Rectangles: the core target stimuli to be remembered. Their orientation (arrow-like direction) is the primary feature participants monitor for changes. Red Rectangles: distractor stimuli (only present in the 2T2D condition). They introduce a secondary feature dimension (color + orientation) to increase task complexity and test memory for feature conjunctions. 2T0D: two targets, zero distractors. This is a low-load, single-feature (orientation only) condition. 2T2D: two targets, two distractors (red rectangles). This is a dual-feature (color + orientation) condition that tests binding of visual features in memory. 4T0D: four targets, zero distractors. This is a high-load, single-feature condition used to assess visual working memory capacity limits. Fixation point (+): a central fixation cross presented at the center of the screen. Participants were required to keep their eyes fixated on this symbol and avoid gaze drift during stimulus presentation.
The experimental apparatus consisted of a 64-channel EEG/ERP system from
NeuroScan (Neuroscan Compumedics Limited, Abbotsford, Victoria, Australia). The
right mastoid (M2) served as the reference electrode during data acquisition,
while the grounding electrode (FPZ) was positioned at the center of the forehead.
Vertical eye movement electrodes (VEOG) were placed 2 cm above and below the left
orbit, and horizontal eye movement electrodes (HEOG) were positioned
approximately 1 cm lateral to the outer canthus of both eyes. A sampling
frequency of 1000 Hz was selected, and a bandpass filter ranging from 0.01 to 100
Hz was applied to ensure that the impedance between the scalp and the electrodes
remained below 10 k
EEG data analysis was performed offline using the EEGLAB2024
(https://sccn.ucsd.edu/eeglab/) [38]. The data were re-referenced to the average of all
electrodes and downsampled to 256 Hz. EEG data were band-pass filtered between
0.1 and 20 Hz using an infinite impulse response (IIR) filter with a roll-off
rate of 12 dB/octave [39]. EEGLAB includes an independent component analysis
(ICA) method to correct eye movement artifacts and remove ICA components based on
automated criteria. In the PSZ group, the mean number of removed ICA artifact
components was 5.64
Possible sources of the CDA have been identified in the posterior parietal cortex [20, 21, 22]. For this study, three representative pairs of parieto-occipital electrodes (PO3, PO4, PO5, PO6, PO7, PO8) were selected. The choice of electrode sites was informed by prior research that utilized CDA as an indicator of vWM capacity [40, 41]. The CDA wave amplitude was calculated by subtracting the average voltage of the electrodes in the contralateral hemisphere from the average voltage of the electrodes in the ipsilateral hemisphere corresponding to the memory side [25]. In this study, the CDA was computed by averaging the wave amplitude from 300 to 800 ms following stimulus presentation, with the interval selection based on previous findings [42, 43].
The preprocessed ERP data were decoded and analyzed using ERPLAB 10.0 (https://erpinfo.org/erplab) with an SVM classifier to perform MVPC [44]. Decoding accuracy for individual participants was calculated using 5-fold cross-validation with 100 iterations. Finally, the average decoding accuracy for each group of participants was computed. We utilized 60 active electrodes as features for decoding. Since we decoded both memory load (2T0D/2T2D/4T0D) and memory side (left/right), the chance level was 1/6. Only accuracy could be reported, and no additional metrics could be provided.
In addition, to further investigate the contribution of individual electrode data to inter-conditional decoding accuracy, we selected data from the CDA time window (300–800 ms) for searchlight decoding analysis, utilizing the MVPA-Light package in MATLAB R2021b (https://www.mathworks.com/) [45], with LIBSVM as the classifier. For each EEG channel, we identified adjacent channels with spatial distances of less than 60 mm to form local clusters [46], and then conducted decoding analysis on these channels (median = 10 electrodes per cluster; minimum = 5, maximum = 13).
vWM capacity is calculated using Cowan’s K [47], where
Statistical analysis was primarily conducted using SPSS (v26.0, IBM Corp.,
Armonk, NY, USA). Demographic data and scale scores for the PSZ and HCS groups
were compared using independent samples t-tests or chi-square tests.
Behavioral indicators and CDA amplitudes were analyzed between the two groups
using repeated-measures analysis of variance (ANOVA). Differences in decoding
accuracy and chance probability were compared using one-sample t-tests.
Decoding accuracy between the two groups of subjects was compared using
independent samples t-tests. A false discovery rate (FDR) correction was
applied to control for multiple comparison bias. A two-sided test was conducted
with a significance level of
To assess the relationship between working memory capacity, CDA amplitude, and
decoding accuracy, correlation analyses were conducted on the indices for
attention scope, indices for attention control,
Between-group comparisons of the PSZ and HCS revealed no significant differences
in gender, age, or education levels. Independent samples t-tests
conducted on the participants’ scores for the spatial breadth test and the number
sequence test indicated a significant group main effect for the spatial breadth
test, with the PSZ group scoring lower than the HCS group (t(44) = 4.91,
p
| PSZ (Mean |
HCS (Mean |
t/ |
p | |
| Age (years) | 29.23 |
31.60 |
1.32 | 0.20 |
| Sex (M/F) | 13/9 | 13/11 | 0.11 | 0.74 |
| Education (years) | 12.45 |
12.10 |
–0.36 | 0.72 |
| MCCB - Spatial Span | 11.91 |
16.88 |
4.91 | |
| MCCB - Number Span | 11.43 |
15.42 |
4.44 | |
| Course (years) | 6.02 |
- | - | - |
| PANSS – General | 25.23 |
- | - | - |
| PANSS – Positive | 12.50 |
- | - | - |
| PANSS – Negative | 17.05 |
- | - | - |
| PANSS – Total | 54.77 |
- | - | - |
PSZ, patients with schizophrenia; HCS, healthy controls; MCCB, MATRICS Consensus Cognitive Battery; PANSS, Positive and Negative Syndrome Scale; M, male; F, female.
A two-factor repeated-measures ANOVA was conducted to assess accuracy. The main
effect of group was significant, with the PSZ group demonstrating significantly
lower accuracy compared to the HCS group (F(1, 44) = 44.57,
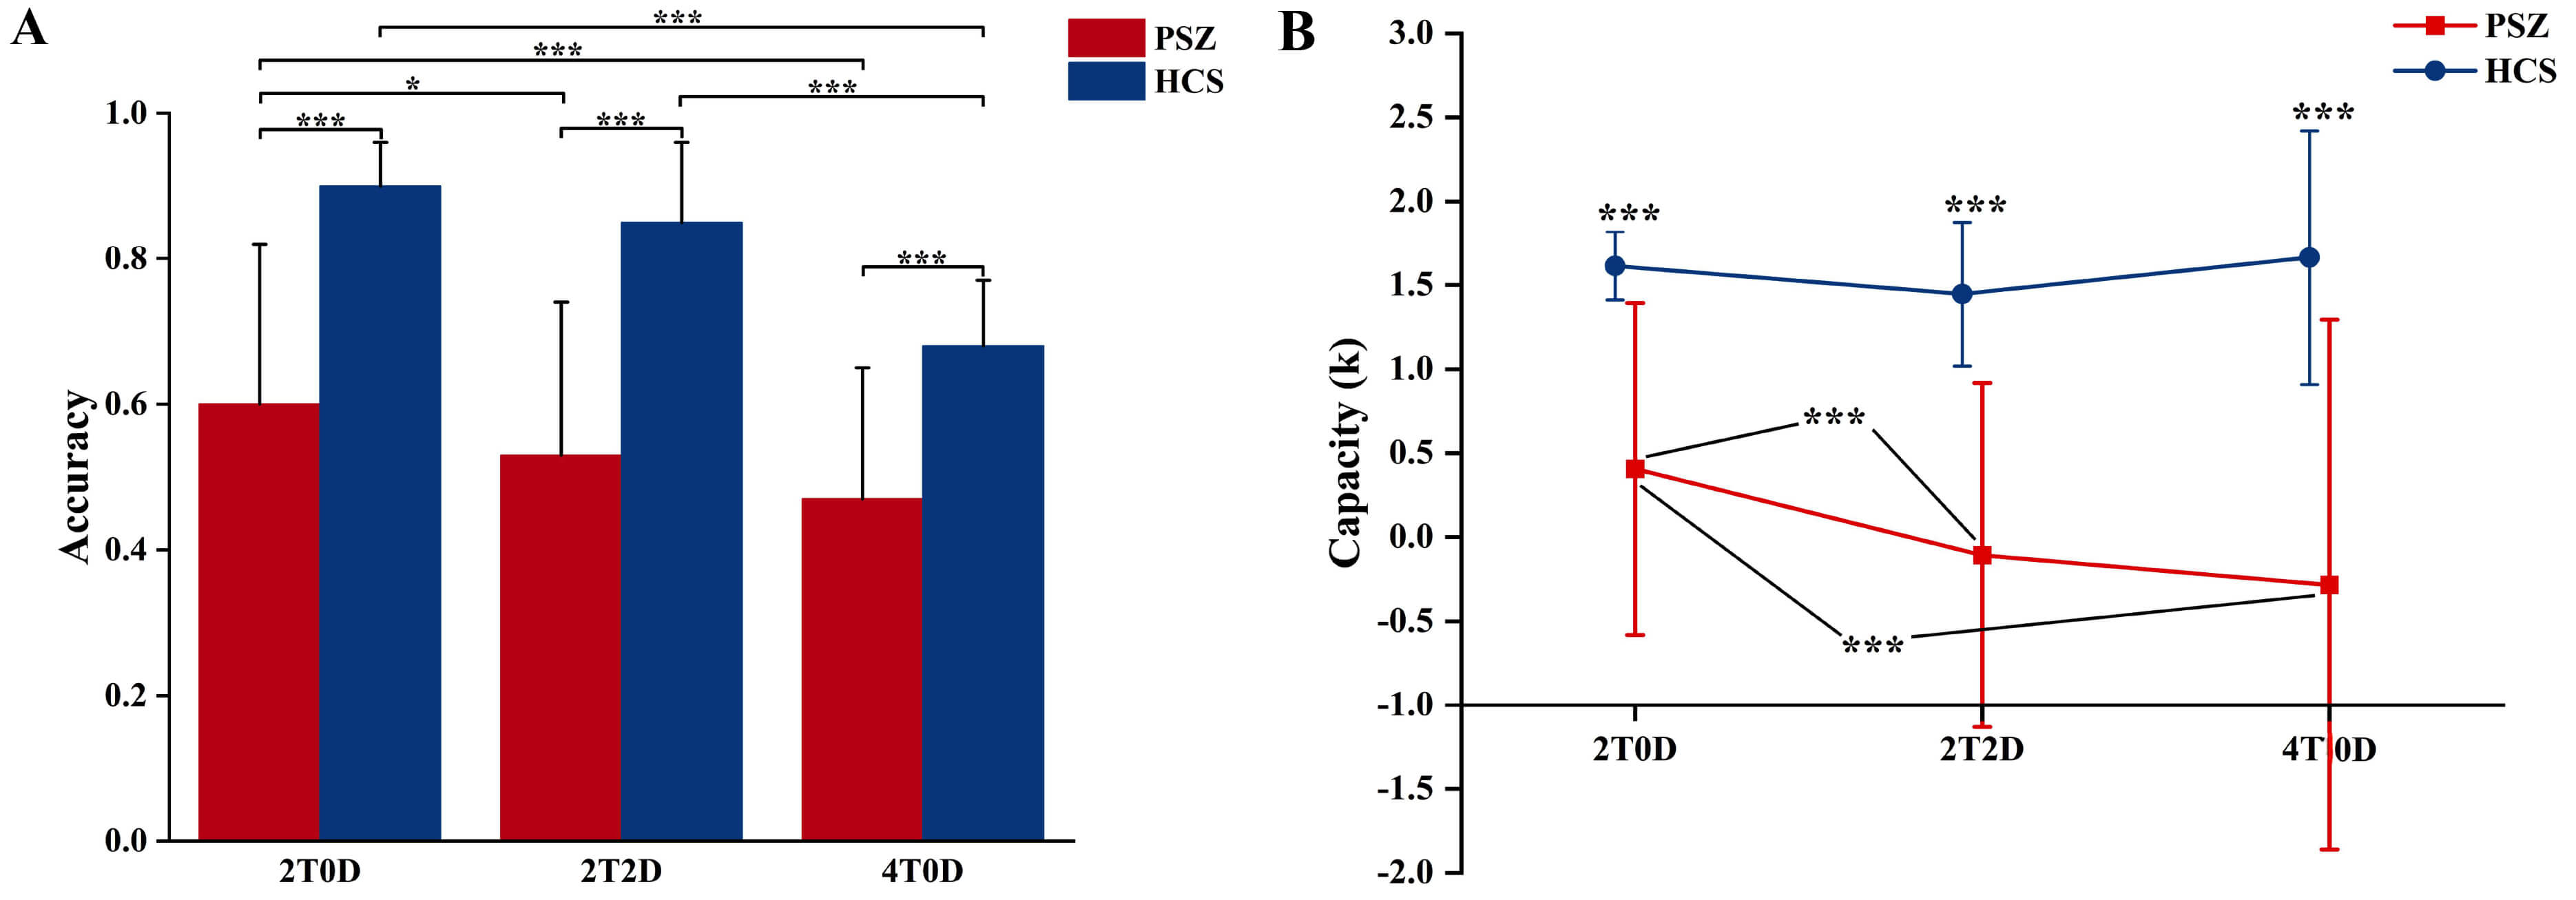 Fig. 2.
Behavioural results. (A) Accuracy of the PSZ and HCS groups
under different memory loads. The error bars represent the mean
A two-way repeated-measures ANOVA was conducted on K. The main effect of group
was significant, with the PSZ group exhibiting significantly lower K values than
the HCS group (F(1, 44) = 43.23,
A two-factor repeated measures ANOVA was conducted on CDA amplitude (Fig. 3).
The results indicated a significant main effect of group, with the PSZ group
exhibiting significantly lower CDA amplitude than the HCS group (F(1, 44) = 5.63,
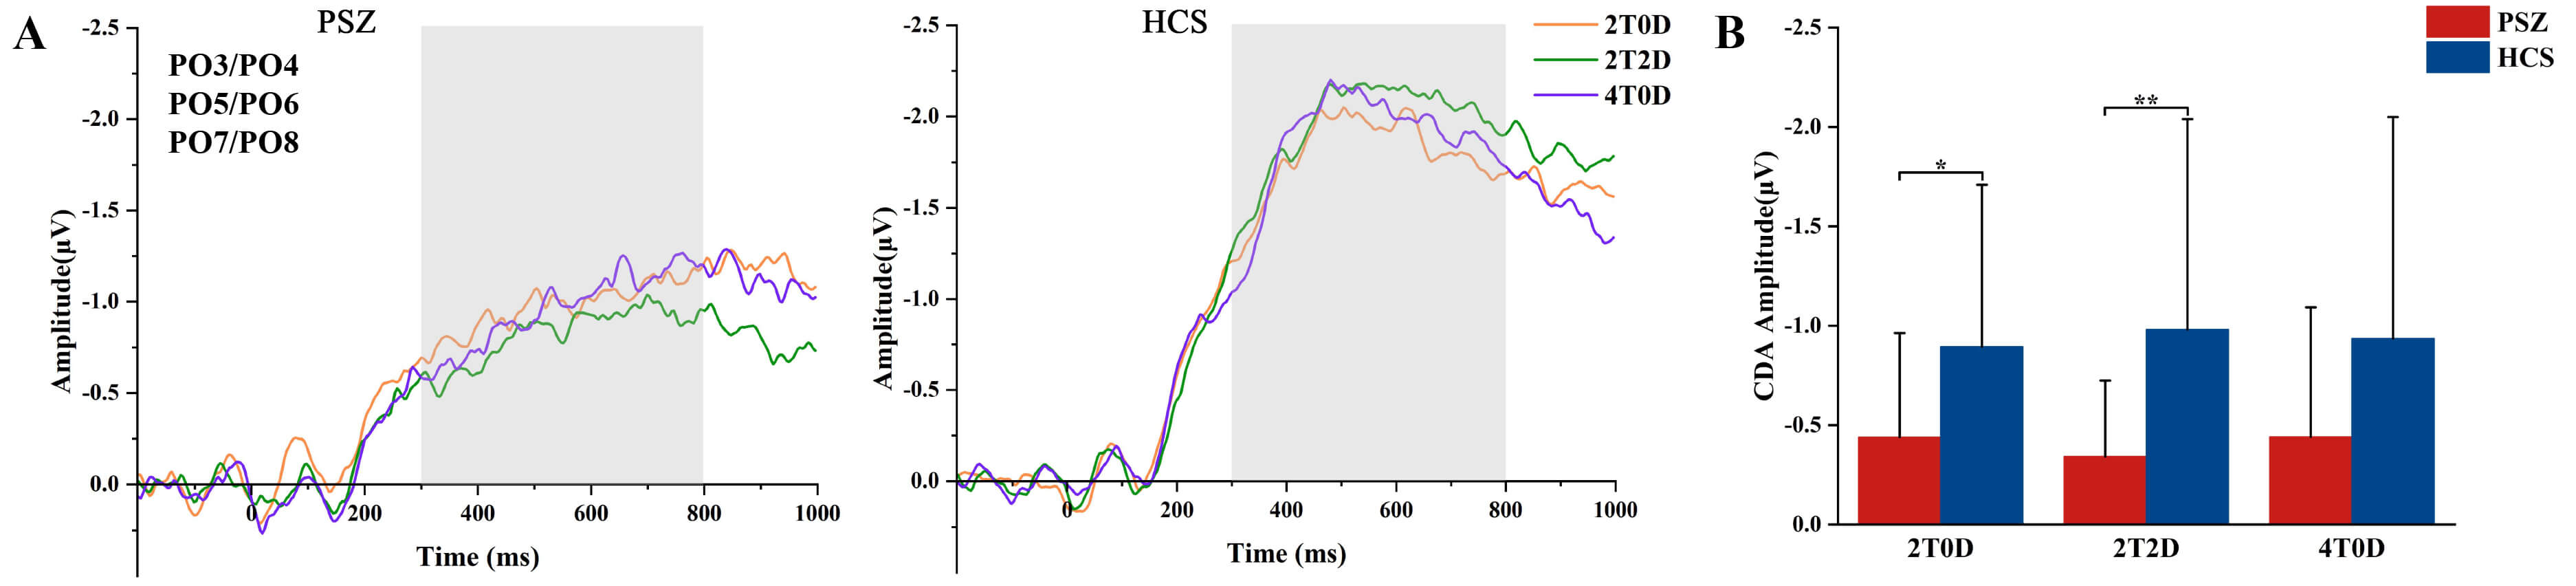 Fig. 3.
CDA results. (A) CDA wave amplitudes (PO3/PO4, PO5/PO6,
PO7/PO8) in the PSZ and HCS groups under different memory loads, with gray
rectangles indicating the CDA time windows. (B) Mean CDA wave amplitudes
(300–800 ms) in the patient and healthy groups across different memory loads; *
indicates p
MVPC accuracy and chance level were compared using one-sample t-tests.
As shown in Fig. 4A, the results indicated that in the PSZ group, the whole-brain
ERP spatial distribution effectively distinguished among stimulus categories
within a time window of –50 to 1000 ms (pcorrected
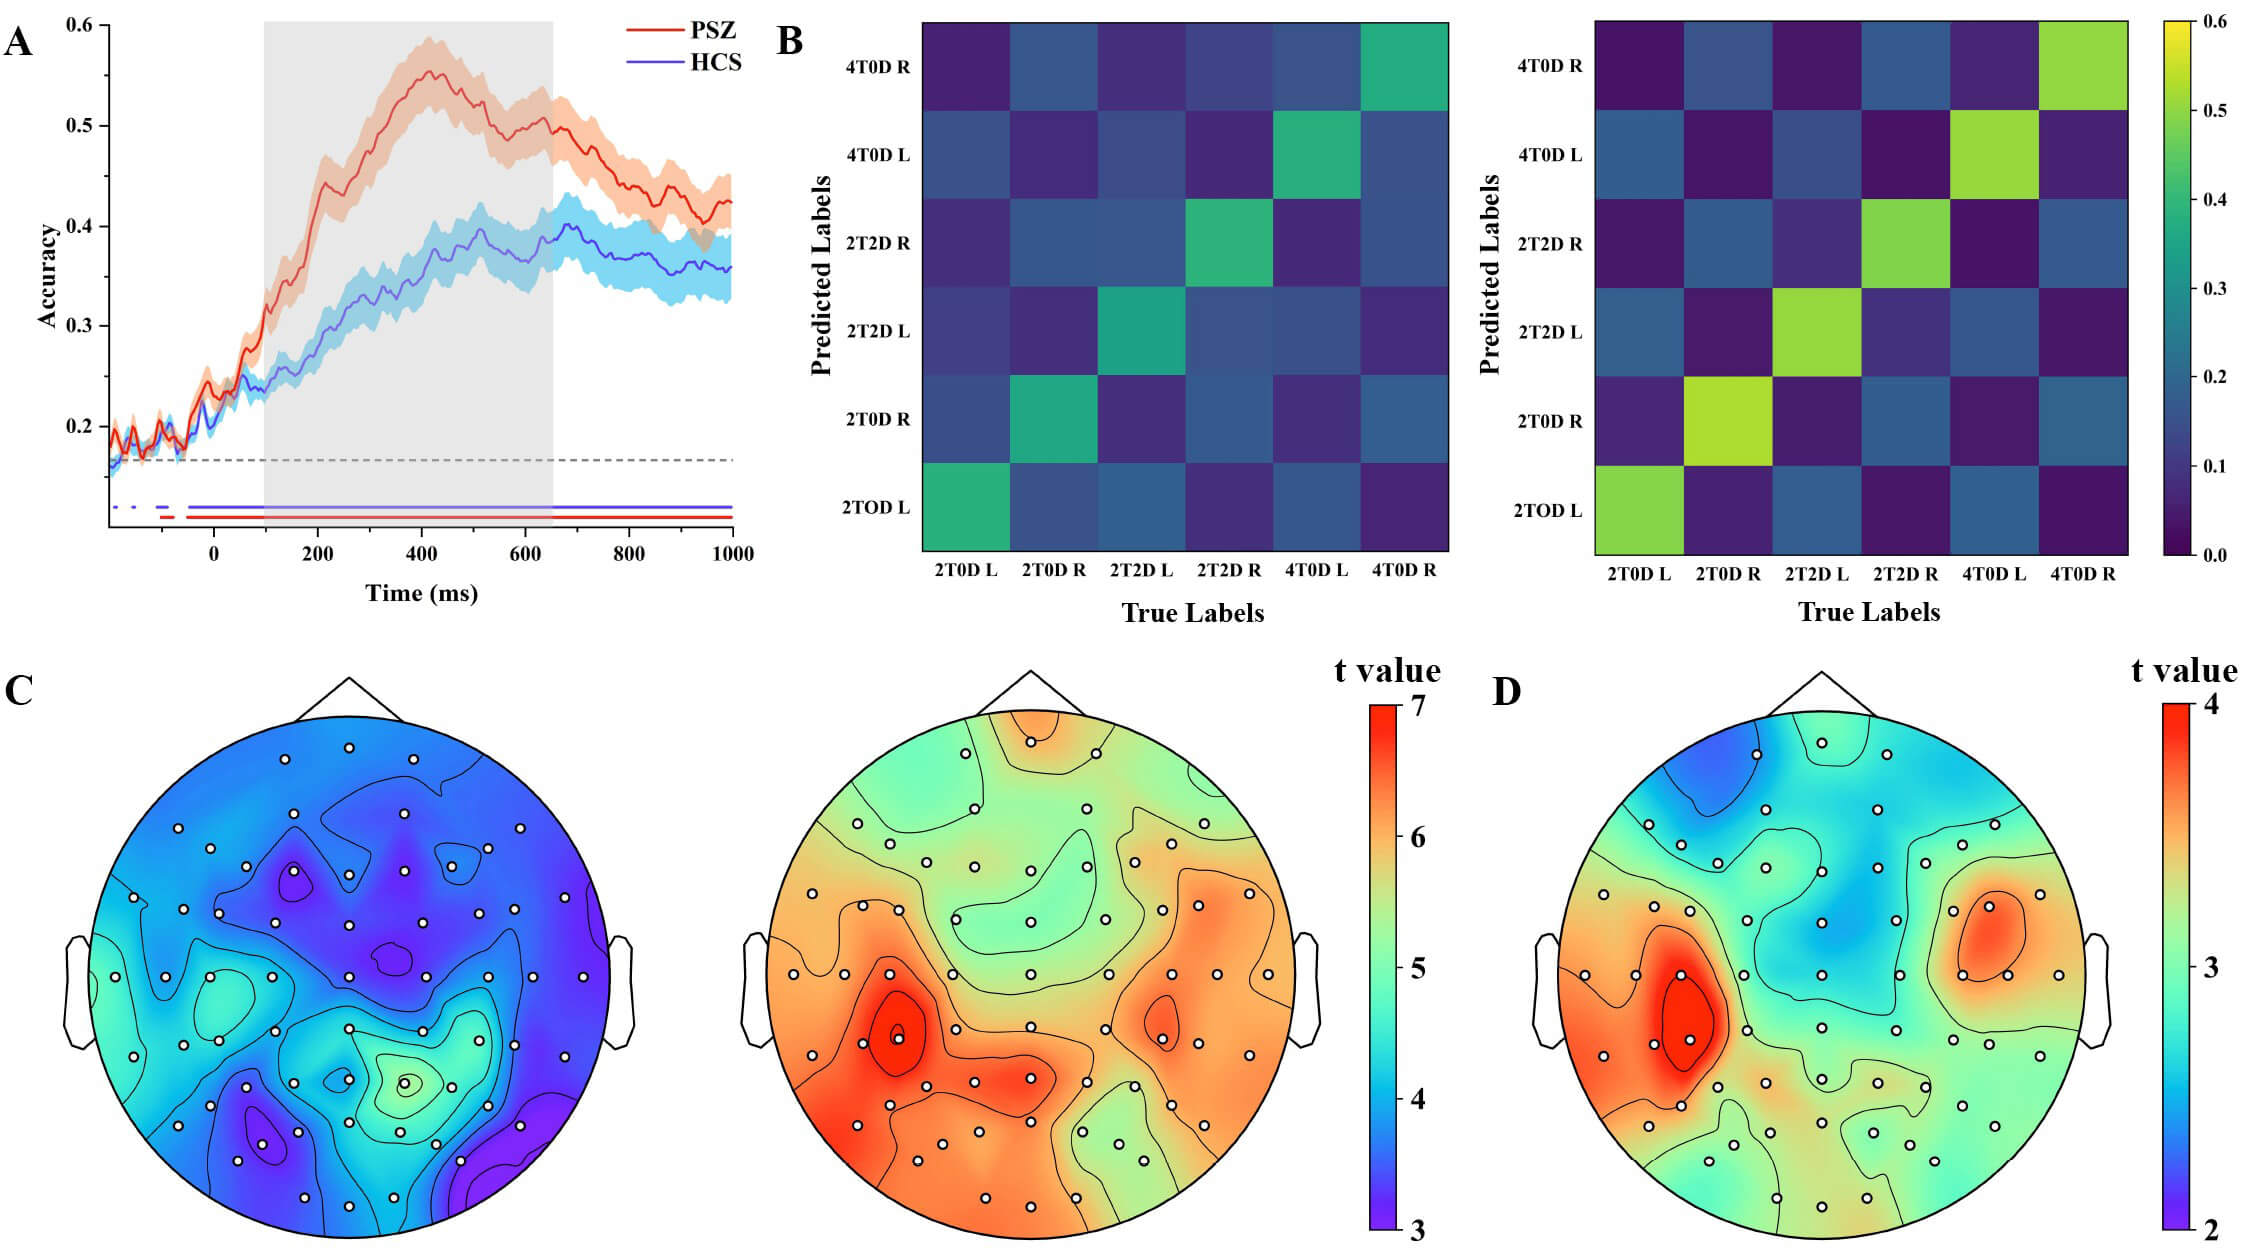 Fig. 4.
Decoding accuracy results. (A) Trends in decoding accuracy over time in the PSZ and HCS groups. The gray dashed lines indicate the chance level, while the red and blue solid lines mark the time points at which the PSZ and HCS groups significantly exceeded this chance level. The gray matrices highlight the time points where the decoding accuracy for the PSZ group was significantly lower than that of the HCS group. (B) MVPC accuracy confusion matrices (300–800 ms) for both groups, with L denoting the left memory side and R denoting the right memory side. (C) Electrode channels influenced by the PSZ and HCS groups during the task, with all electrode sites showing significant activation. (D) Results of the significance test for the searchlight accuracy of each electrode site in both the PSZ and HCS groups, revealing that all electrode sites exhibited significant differences. MVPC, multivariate pattern classification.
A one-sample t-test was conducted to compare searchlight accuracy with
the chance level. The results indicated that the whole-brain electrodes
successfully discriminated among stimulus categories in both the PSZ and HCS
groups (pcorrected
As illustrated in Fig. 5, correlation analyses indicated that in the HCS group,
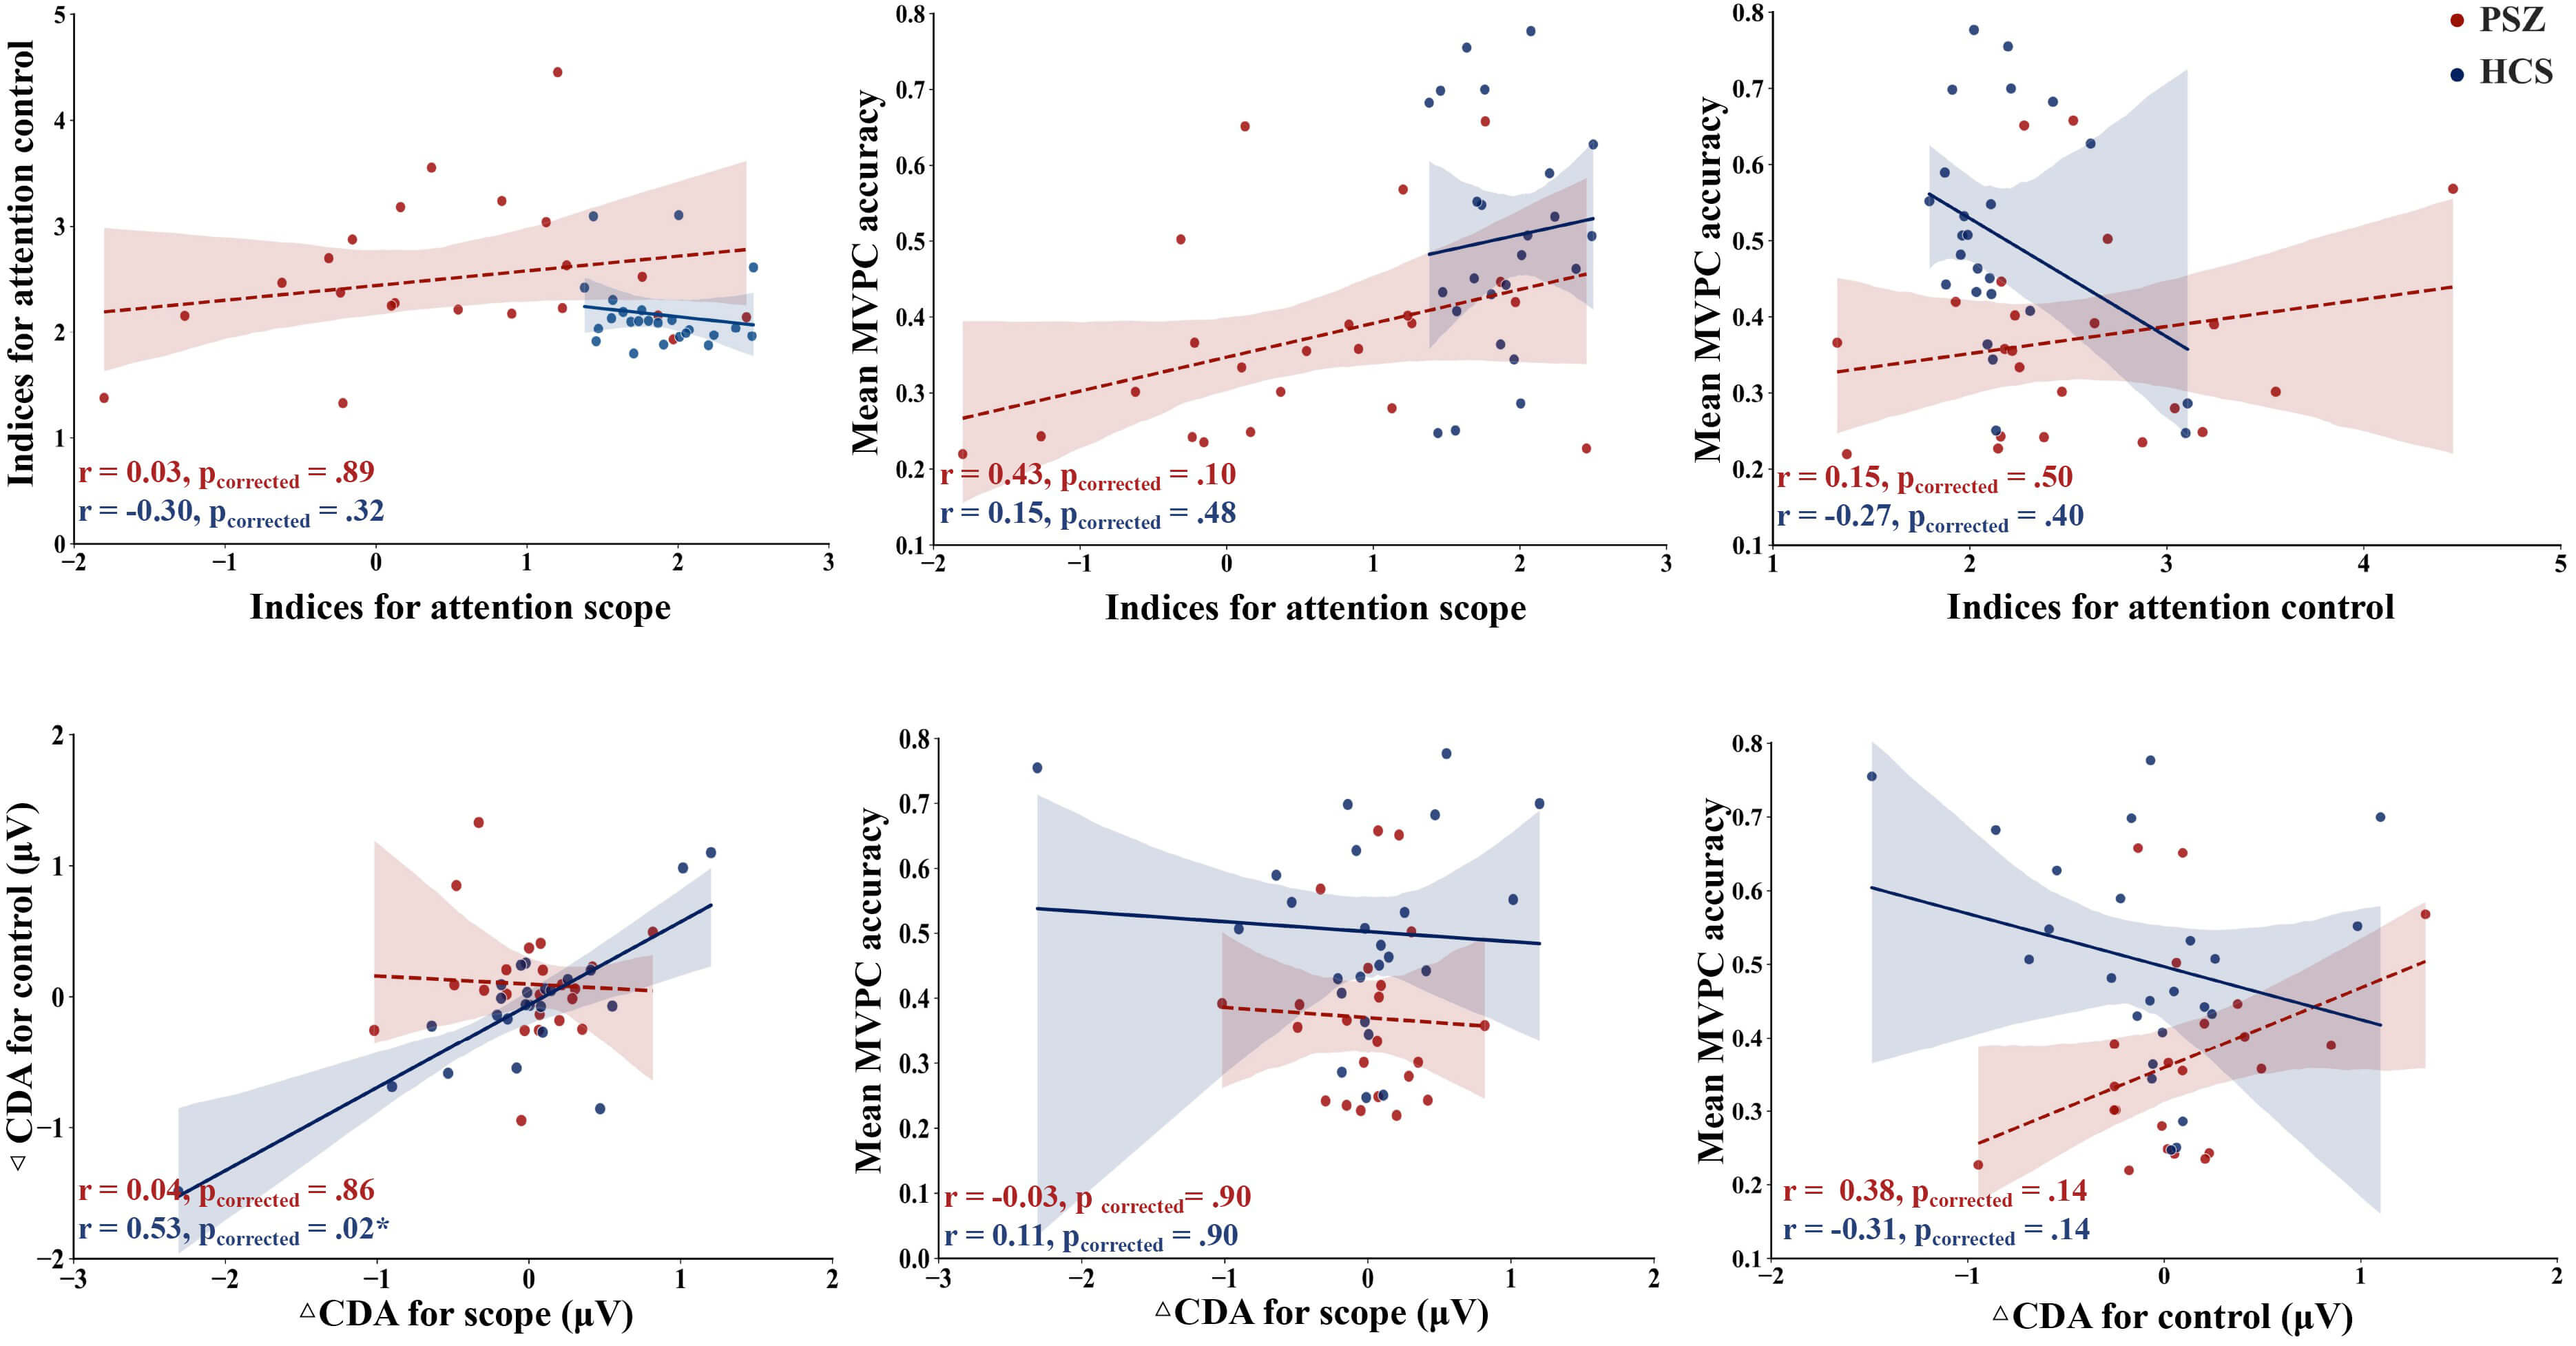 Fig. 5.
Correlation results. The red dashed line represents the linear
regression fit for the PSZ group, while the blue solid line represents the linear
regression fit for the HCS group. The shaded areas indicate the 95% confidence
interval of the fit. In the HCS group,
In this study, we employed decoding methods using ERPs to investigate the differences in neural representations between PSZ and HCS during a change detection task. (1) The MVPC results indicated that ERPs from both the PSZ and HCS groups successfully decoded memory load and memory side information. However, compared to HCS, the PSZ group exhibited lower decoding accuracy during the delay period (93–652 ms), suggesting that the ERPs of the PSZ group contained less stimulus-related information. (2) The searchlight analysis revealed that brain regions of both PSZ and HCS groups were fully activated during the change detection task, with the parieto-occipital region being particularly sensitive to the stimulus category. In terms of whole-brain electrode data, the decoding accuracy for the PSZ group was lower than that of the HCS group, especially in the left parietal electrodes. In conclusion, decoding methods can be effectively applied at the individual subject level to enhance our understanding of the nature of impaired cognitive functioning in individuals with PSZ.
The MVPC results indicated that the decoding accuracy of both PSZ and HCS was significantly higher than chance level, consistent with findings from previous studies. Bae et al. [29] employed the decoding method to evaluate the information content of PSZ ERPs and discovered that the decoding accuracy of PSZ regarding memory side (left/right) exceeded chance level across all three types of memory load (1/3/5T). In the present study, both memory load and memory side were decoded simultaneously, and the decoding accuracy of PSZ and HCS was substantially above chance level. Decoding analyses were conducted for each participant individually, with training and testing based on the means of different trial subsets. The decoding accuracy reflects the ability of each participant’s neural signals to reliably predict the stimulus information to be remembered. Therefore, during the change detection task, the ERPs of both PSZ and HCS contained a sufficient amount of information regarding stimulus categories. It is noteworthy that the decoding accuracy was higher than chance even before the stimulus appeared. This may be because, prior to presenting the stimuli to be memorized, subjects were shown 100 ms of cue information indicating the designated side of the visual field to be memorized. Future studies could consider performing decoding analysis under conditions where cue and stimulus information are presented simultaneously to prevent information leakage.
Compared to HCS, PSZ exhibited lower MVPC accuracy during the delay period, indicating that the ERPs of PSZ contained less information regarding stimulus categories. EEG studies that elicited ERPs during a WM task revealed abnormal electrical activity during both early evoked responses and late cognitively relevant components in the PSZ [50]. Numerous investigations into the neural mechanisms underlying WM deficits in the PSZ have demonstrated significant neural inefficiency, characterized by functional hypoconnectivity within frontoparietal networks [51, 52] and diminished functional interactions between large-scale networks [53, 54]. This may result in decreased efficiency of PSZ in encoding neural information during the delay period, leading to a reduction in the information content of ERPs.
Searchlight analysis revealed that whole-brain electrodes from both PSZ and HCS could significantly discriminate between stimulus categories, with the parieto-occipital region demonstrating the highest sensitivity to these categories. Across the electrode sites, the decoding accuracy for PSZ was notably lower than that for HCS, particularly in the left parietal region, which was especially significant. A recent study indicated that reduced functional connectivity capacity (rFCS) in the left subparietal region is a neurophysiological characteristic that differentiates PSZ from HCS [55]. Previous research has also identified abnormalities in the left subparietal cortex of PSZ, where atypical cortical modulation has been linked to deficits in memory, audiovisual integration, and emotional processing [56]. Furthermore, resting-state EEG micromorphological changes in PSZ exhibited hyperactivation of the left subparietal lobule and a reduction in resting-state micromap duration [57]. Consequently, we hypothesized that during the vWM task, PSZ would exhibit less stimulus information in the ERP signal due to the abnormalities in the left parietal region, resulting in particularly lower decoding accuracy for the left parietal electrode compared to HCS.
Numerous studies have demonstrated an increase in posterior parietal CDA amplitude with an expanding attention scope in vWM [58, 59, 60, 61, 62, 63, 64]. A recent investigation revealed that the processes of attention control and attention scope share similar posterior parietal CDA characteristics [48]. The present study replicated this finding, showing that in the HCS, the 2T2D condition induced a larger CDA amplitude compared to the 2T0D condition. Furthermore, individuals in the HCS group who exhibited greater wave amplitudes in the 4T0D condition also demonstrated higher wave amplitudes in the 2T2D condition. These results support the notion that attention control elicits CDA wave amplitudes comparable to those associated with attention scope. In PSZ, the 2T2D condition necessitates the combined engagement of attention scope and attention control. However, due to significant attention deficits, the CDA wave amplitude in the 2T2D condition is notably smaller than that observed in the healthy group.
Although the present study successfully revealed the spatiotemporal dynamics underlying vWM deficits in PSZ, several limitations remain. The main effect of memory load on the CDA index was not significant. This may be attributed to the introduction of interference stimuli in this study, which aimed to investigate the differences between scope and control processes in working memory. In HCS, the CDA amplitude was slightly higher in the 4T0D condition compared to the 2T0D condition, but this difference did not reach statistical significance. Additionally, Zhang et al. [48] identified a significant positive correlation between the indices of attention scope and attention control. However, in the present study, no significant correlation was found. This lack of correlation may be attributed to the small sample size and the heterogeneity of participants. Finally, since we used ERPLAB for MVPC decoding analysis, the method provides only accuracy as an outcome metric and does not include other metrics, such as the F1 score or balanced accuracy. While accuracy provides a quick overview of overall correctness, it does not fully capture differences in model performance across categories. Especially in unbalanced datasets, where accuracy often provides overly optimistic estimates of model performance [65]. Future studies should aim to increase sample sizes and incorporate more comprehensive outcome measures to achieve more robust results.
In conclusion, this study investigates the differences in ERP neural representations between PSZ and HCS in vWM. We employed decoding methods to reveal the spatiotemporal dynamics of vWM deficits in PSZ. The findings indicate that information-based decoding methods can offer valuable insights into the neural representation of information in specific populations while they perform a task.
The data that support the findings of this study are available on request from the corresponding author.
ZW–Writing, Design, Data Collection and Processing, Analysis and Interpretation, Literature Review, Critical Review; CL–Conception, Supervision, Design, Writing, Critical Review; YJ–Data Collection and Processing, Design, Analysis and Interpretation, Literature Review, Critical Review; ZY–Data Collection and Processing, Design, Literature Review, Critical Review; MC–Conception, Fundings, Design, Critical Review. All authors contributed to editorial changes in the manuscript. All authors read and approved the final manuscript. All authors have participated sufficiently in the work and agreed to be accountable for all aspects of the work.
The study was conducted in accordance with the Declaration of Helsinki, and the protocol was approved by the Institutional Review Board of Daizhuang Hospital in Shandong Province. Approval number: 202111KS-1. All participants provided written informed consent.
The authors would like to thank all health professionals and subjects who were involved in the project.
This work was supported by the Shandong Province Medical and Health Science and Technology Development Program (No. 202103090715) and the Jining City Key Research and Development Program (No. 2025YXNS001).
The authors declare no conflict of interest.
References
Publisher’s Note: IMR Press stays neutral with regard to jurisdictional claims in published maps and institutional affiliations.