

 , David Pospíšil 1,*
 , Jan Řehoř 1, Marek Malik 1,2
1 Department of Internal Medicine and Cardiology, University Hospital Brno and Faculty of Medicine of Masaryk University, 625 00 Brno, Czech Republic
2 National Heart and Lung Institute, Imperial College, ICTEM Building, Hammersmith Campus, W12 0NN London, UK
Abstract
Heart rate variability (HRV) analysis is a noninvasive tool that allows cardiac autonomic control to be assessed. Numerous studies have reported HRV measurements, related changes, and clinical implications for heart failure patients. This review evaluates HRV characteristics in congestive heart failure (CHF), focusing on different recording durations and the diagnostic and prognostic values using HRV measurements. The recording durations are classified as (a) ultra short-term (substantially shorter than 5 minutes), (b) short-term (5 minutes), and (c) long-term (nominal 24 hours). This review of HRV diagnostic and prognostic significance in CHF focuses on time- and frequency-domain HRV measures that have previously been extensively studied. Reported studies document that HRV is lowered in CHF patients, whereas HRV increases may indicate disease improvement, e.g., in CHF patients undergoing cardiac resynchronization therapy. Reduced HRV has consistently been found to be associated with all-cause mortality in CHF patients. However, different thresholds of long-term HRV indices have been proposed as mortality predictors; meanwhile, findings related to the prediction of other cardiac events, including sudden cardiac death, remain inconsistent. HRV is reduced in CHF patients, but the use of HRV as a risk factor remains controversial, with no established cut-off values. HRV does not provide a clinically useful prediction of sudden cardiac death or other cardiac events in CHF patients. Thus, we advocate standardization of investigative protocols based on the existing time- and frequency-domain HRV indices rather than further developing more complex methods. Short-term recordings are preferable for clinical application and measurement reproducibility; thus, future investigations should focus on the following key questions:
1. How to design standardized short HRV tests suitable for outpatient settings?
2. Which HRV indices should be preferred, and what are their optimal prognostic thresholds?
3. How to standardize HRV assessment conditions to minimize external influences?
Keywords
- congestive heart failure
- heart rate variability
- time-domain methods
- spectral analysis
- risk prediction
Congestive heart failure (CHF) became a cardiovascular epidemic in the 21st century [1]. In developed countries, 1–2% of the population suffer from CHF which is present in approximately 26 million people worldwide [2]. CHF is characterized by blood volume and/or blood pressure overload arising from abnormalities in cardiac hemodynamic function [3, 4]. CHF may result from systolic dysfunction when impaired myocardial contractility leads to a reduced left ventricular ejection fraction, diastolic dysfunction marked by impaired relaxation and insufficient filling of the left ventricle, or a combination of systolic and diastolic dysfunction. Typical CHF symptoms include reduced exercise tolerance, increased fatigability, chronic weakness, dyspnea, orthopnea, and nocturia. In more advanced cases, patients experience peripheral edema and palpitations, often presenting as rapid or irregular cardiac periods. CHF is predominantly a consequence of prior cardiovascular disorders, including ischemic heart disease, dilated or hypertrophic cardiomyopathy, hypertension, and heart valve disease [5]. As CHF progresses, anatomical, functional, neurohormonal, and electrophysiological alterations increase mortality [6]. The failing cardiac hemodynamic function also causes secondary autonomic nervous system (ANS) changes.
Balancing the sympathetic and parasympathetic ANS branches is crucial in regulating cardiovascular function. A complex interplay between ANS branches exists in healthy subjects and patients with different abnormalities and pathologies. The parasympathetic system reacts faster than the sympathetic system, which has known advantages for assessing ANS regulation and reflexes [7, 8]. The sympathovagal balance is often disrupted in CHF patients since CHF is associated with chronic sympathetic overactivity due to reduced cardiac output and lower tissue perfusion [9]. Consequently, CHF is often accompanied by reduced parasympathetic (vagal) activity [10], which lowers the ability of ANS to modulate heart rate and maintain cardiovascular homeostasis.
The cardiovascular system involves complex interconnected feedback mechanisms. The feedback maintenance leads to various cardiovascular fluctuations that might be detected and numerically characterized. These fluctuations result from continuous cardiovascular function adjustments, which respond to internal and external challenges and maintain organism stability. Heart rate and blood pressure are modulated in real time by the ANS, hormonal signals, and baroreflex activity [11]. These regulatory mechanisms respond to the requirements of the organism in variable situations, including rest, exercise, and stress. Moreover, the ongoing adjustment of cardiac periodicity leads to measurable variability expressed by heart rate variability (HRV), blood pressure variability, and other characteristics that allow numerical quantification. Ultimately, these measurable fluctuations reflect the ability of the cardiovascular system to adapt when responding to intrinsic demands and environmental stresses [12, 13, 14].
HRV is a recognized method to assess cardiac autonomic modulations. HRV is based on the fluctuations in the intervals between consecutive QRS complexes (waveform segment composed of the Q, R, and S deflections, representing the electrical depolarization of the ventricles) of normal sinus nodal origin, i.e., the so-called normal-to-normal (NN) intervals [15, 16, 17, 18, 19]. Numerous intrinsic factors, such as respiration frequency, body temperature, food intake, sleep and sleep stages, electrolyte levels, humoral control, and sympathovagal balance, regulate sinus rhythm periodicity. HRV also responds to external factors, including daylight, weather, pollution, and perception of threat or tranquil safety. Consequently, HRV is a complex indicator influenced by autonomic modulation and physiological, pathological, and environmental factors. In addition, different pharmaceuticals and recreational substances are known to affect heart rate and impact ANS [20], which is also reflected in HRV changes [21, 22].
Clinically, HRV is useful for assessing autonomic regulation in conditions such as sub-acute myocardial infarction, diabetic autonomic neuropathy, and acute or chronic stress [23, 24, 25, 26, 27]. In cardiac patients, HRV assessment also provides risk characterization and prognosis and allows patient monitoring during disease progression. However, broader clinical applications are limited by measurement variability, external influences, and the lack of standardized normality thresholds [28].
Over the past 40 years, many publications have focused on HRV assessment in CHF patients; thus, HRV characteristics are now well-known to be significantly different in CHF patients compared to healthy subjects [29, 30]: HRV is depressed in CHF patients [16, 31, 32, 33]. This reduction is mainly related to increased sympathetic activity, decreased vagal tone, and depressed baroreceptor responsiveness [34, 35]. Since HRV is a marker of sympathetic and parasympathetic influence on heart rate modulations [36], it has also been proposed as a stratification marker of cardiovascular mortality risk [37, 38, 39], CHF severity [40], and CHF progression [33]. However, the exact predictive thresholds of HRV in CHF patients are difficult to standardize as a variety of HRV parameters have been derived from a recording of different durations during variable activities (e.g., postural testing, physical or mental exercise, and controlled breathing) and at various stages of disease severity.
Generally, long-term (e.g., nominal 24 hours), short-term (5 minutes), and ultra-short-term (substantially shorter than 5 minutes) recordings have been used in HRV studies.
Long-term HRV analysis often utilizes 24-hour Holter monitoring or, less frequently, is based on data provided by simpler wearable devices. Indeed, such a long-term analysis allows circadian rhythms and daily variations to be captured in response to different activities and stressors. In addition to pathological confounding variables, the interpretation of long-term HRV analysis requires the consideration of many factors, including individual characteristics, nutrition, and psychosocial aspects. HRV may also be affected by common factors such as activity, mood, and stress. Therefore, it has been proposed that comparisons of long-term HRV measurements are valid only if all patients are subject to a standardized environment (e.g., hospitalization) during long-term monitoring.
Short-term HRV assessments are based on electrocardiogram (ECG) recordings of 5 minutes, typically during rest or during the previously mentioned controlled conditions, such as exercise, controlled breathing, and postural testing. These can provide insights into the ANS responsiveness to provocative conditions [41]. ECG recordings of the standard 5-minute durations are commonly used for HRV analysis for several reasons: these recordings are relatively easy to obtain, it is possible to eliminate external influences during short-term recordings, and the standardized duration of the recordings allows valid comparisons to be performed [7, 15]. Importantly, controlled conditions during data acquisition allow HRV assessment in ambulatory patients [42].
Ultra-short-term (i.e., much shorter than 5-minute, e.g., 10-second) ECGs are standardly used for morphology/rhythm analysis but are problematic as a recommendation for HRV assessments [43, 44].
Single- or multiple-lead ECG is the most commonly used method for HRV data acquisition; however, plethysmography has also been used in certain HRV studies [45, 46]. In some plethysmography studies with healthy subjects, reasonable correlations were found between plethysmography-based and ECG-based HRV results [45, 46]. Thus, both methods are suitable for assessing heartbeat fluctuations. Because of sensor simplicity, plethysmography is frequently used in simpler commercial heart rate monitors, including those aimed at the home-based wearable device markets. However, plethysmography should not be considered a valid ECG surrogate (not only in HRV analyses) since ectopic activity and arrhythmias cannot be appropriately detected and classified. Additionally, increased arterial stiffness in older patients slows the pulse wave transit, further complicating HRV analysis. Intracardiac electrograms recorded by implantable devices are another possible data source for HRV analyses. However, the absence of valid NN interval sequences (e.g., in patients with atrial fibrillation, frequent ectopy, or paced rhythms) makes it impossible to obtain valid HRV measurements.
Many different HRV indices have been proposed previously [15, 18]. In CHF studies, HRV has most frequently been expressed using either time-domain or frequency-domain quantifications. Time-domain measures express the extent of NN interval variability, and frequency-domain measures estimate the distribution of the absolute or relative power of NN variability in separate frequency bands [7, 15, 45, 47]. The interpretation of other HRV parameters is complex and, in some situations, controversial [18, 48].
The time-domain indices represent perhaps the simplest HRV methods [15]. Usually, a continuous ECG signal is used, and durations of individual consecutive NN intervals are measured. Simple statistical descriptors may subsequently be derived from the NN interval sequence; the most frequently used are listed in Table 1. The mean NN interval or the mean heart rate is usually also derived. Additionally, simpler basic descriptors might be obtained, including the longest and shortest NN interval, their difference, and the day–night heart rate difference.
| Parameter | Description | Unit |
| SDNN | Standard deviation of all NN intervals | ms |
| SDANN | Standard deviation of NN averages in consecutive 5-minute segments | ms |
| RMSSD | Root mean square of successive differences between adjacent NN intervals | ms |
| NN50 | Count of pairs of adjacent NN intervals that differ by more than 50 ms | - |
| pNN50 | Count of pairs of adjacent NN intervals that differ by more than 50 ms divided by total number of NN intervals | % |
HRV, heart rate variability; NN interval, normal-to-normal RR interval (the time elapsed between two successive sinus rhythm R-waves).
The numerical values of time-domain HRV indices depend, among others, on the duration of the analyzed recording. HRV index comparisons are only valid if the same period of the source recordings is used; otherwise, misleading conclusions might be reached [15].
The geometric HRV methods are related to time-domain techniques and are based on a graphical representation of the duration of the heart period. The common geometric methods include the HRV triangular index and the triangular interpolation of the NN interval histogram [15]. While these methods offer insights into the overall HRV patterns and dynamics, they have mainly been used to process long-term ECG recordings in which the detection of individual QRS complexes was not made with the highest accuracy [49, 50]. In addition to studies of CHF populations [51], these methods have also been applied to the heart period intervals detected by implantable devices [52].
Power spectral HRV analysis is usually based on standard technologies estimating
signal spectral components, such as the Fast Fourier transform or parametric
autoregressive modeling [15]. However, other possibilities have also been
reported [46]. Four spectral components might be distinguished in the spectrum
calculated from long-term recordings (e.g., of nominal 24 hours): the
ultra-low-frequency (ULF)
The HF component corresponds to parasympathetic heart rate modulations, mostly reflecting respiration-mediated heart rate changes [54, 55]. A correlation exists between HF and the time-domain measures manifesting parasympathetic modulations (pNN50 (count of pairs of adjacent NN intervals that differ by more than 50 ms divided by total number of NN intervals) and RMSSD (root mean square of successive differences between adjacent NN intervals)) [15, 54]. In healthy subjects, HF increases were observed under vagal dominance conditions [15, 29, 30].
The LF component is a mixture of parasympathetic and sympathetic modulations and is influenced by baroreceptor responses to blood pressure fluctuations [15, 56]. Compared to HF, LF reflects a more complex and not easily discernible mix of sympathovagal balance, renin–angiotensin activity, and baroreceptor reflexes [49, 56, 57]. Correlations were observed between LF power and time-domain SDNN (standard deviation of all NN intervals) and SDANN (standard deviation of NN averages in consecutive 5-minute segments) measures [15]. Furthermore, reported studies failed to correlate direct recording of sympathetic nerve activity with LF power, both in healthy subjects and in CHF patients [58, 59]. This highlights the fundamental difference between the sympathetic tone level and the extent of the sympathetic tone modulations [55].
The VLF component is influenced by many physiological mechanisms, e.g., vasomotor tone, renin–angiotensin system, and thermoregulation [60]; however, true physiological correlates are yet to be established for VLF. Moreover, no physiological correlate exists for the ULF component. The ULF component was previously proposed for pure technical correspondence to the time-domain SDANN method (i.e., aiming to exclude variability faster than a 5-minute cycle length). The influence of sleep patterns and consequential day–night differences in the heart rate have been proposed as possible contributors to the ULF components.
The ratio between LF and HF (LF/HF) has repeatedly been used to indicate the balance between sympathetic and vagal control [9]; thus, LF/HF is interpreted as an index of the sympathovagal balance [15, 61, 62]. Nevertheless, since some uncertainty remains regarding the physiological origins of the LF component, the physiological basis for LF/HF is difficult to discern with certainty, especially when considering conditions that affect the control mechanisms of sympathovagal balance [57, 63]. Moreover, if the HF component is very depressed, the statistical properties of the LF/HF ratio become problematic. Thus, interpreting the LF/HF ratio must consider individual characteristics and external influences to provide meaningful insight into cardiovascular health and autonomic regulation.
Normalized LF and HF (nLF and nHF) components, assessed standardly using
5-minute recordings, do not suffer from this problem [15, 56]. Indeed, nLF and nHF
represent the relative value of each power component in proportion to the total
power minus the VLF component. Fast Fourier transform spectral analysis allows
only an approximate calculation of nLF and nHF as the true definition of nLF and
nHF requires autoregressive spectral assessment, leading to additional components
in the
Standard spectral HRV parameters are listed in Table 2 [15].
| Parameter | Description | Unit |
| Total spectral power | Frequency power 0–0.4 Hz | ms2 |
| ULF | Ultra-low frequency power |
ms2 |
| VLF | Very low frequency power 0.003–0.04 Hz | ms2 |
| LF | Low frequency power 0.04–0.15 Hz | ms2 |
| HF | High frequency power 0.15–0.4 Hz | ms2 |
| LF/HF | Ratio between the LF and HF components | - |
| nHF | Normalized HF component | - |
| nLF | Normalized LF component | - |
According to the established standards [15], frequency-domain methods should be preferred to time-domain methods when investigating short-term recordings obtained under predetermined and consistent conditions. Indeed, spectral analysis over the entire 24-hour period obscures detailed information about autonomic modulation of NN intervals available in shorter recordings [64]. Thus, 5-minute recordings in a stationary condition are preferred unless the nature of the study dictates another design [15]. Sufficient sampling frequency and amplitude resolution of ECG signals are necessary to determine HRV parameters correctly. A low sampling frequency may cause digitization noise and errors in NN measurements. Meanwhile, several studies have suggested that a sampling frequency of 200 Hz might be sufficient [65]. However, a higher sampling frequency is preferred if not required in CHF because of the very low RR interval (the time elapsed between two successive sinus rhythm R-waves) variability and QRS pattern instability [7].
Nonlinear HRV analyses involve applications of mathematical and computational techniques of nonlinear dynamics and chaos theory. Unlike linear methods that assume constant relationships between variables, a nonlinear analysis acknowledges the intricate, dynamic, and often irregular nature of physiological systems [66]. The most common nonlinear HRV measurements include numerical processing of RR interval Lorenz plots [67], fractal analysis [68, 69], sample entropy [70], detrended fluctuation analysis [68, 70], and symbolic analyses [71]. Whilst these methods offer valuable technical insights, they also come with substantial limitations, including computational complexity and, more importantly, difficult physiologic interpretation and clinical evaluations that are not necessarily reproducible. Furthermore, nonlinear methods are difficult to standardize because they are sensitive to recording length, sampling rate, preprocessing techniques, and many other factors. Thus, comparing results across different studies or clinical settings is challenging [7, 17].
A systematic literature review was performed to assess CHF-induced ANS modifications, summarize autonomic HRV-based observations in CHF patients, and analyze reports of HRV usefulness in CHF risk stratification to review the applicability of HRV to CHF.
A PubMed literature search was performed from the database inception until June 2024 using the following search keywords: (“heart rate variability” OR “HRV”) AND (“heart failure”) AND (“prognosis” OR “all-cause mortality” OR “cardiac event” OR “sudden cardiac death”).
The following search results were obtained:
■ (“heart rate variability” OR “HRV”) AND (“heart failure”) AND (“prognosis”) — 240 results.
■ (“heart rate variability” OR “HRV”) AND (“heart failure”) AND (“all-cause mortality”) — 34 results.
■ (“heart rate variability” OR “HRV”) AND (“heart failure”) AND (“cardiac event”) — 7 results.
■ (“heart rate variability” OR “HRV”) AND (“heart failure”) AND (“sudden cardiac death”) — 111 results.
This initial search identified 392 publications. Duplicates, foreign language articles, and search results containing only an abstract without a full text were removed. From the remaining studies, we selected those that reported one or more of the following HRV parameters together with their numerical values:
■ Time-domain measures: SDNN, SDANN, RMSSD, pNN50.
■ Frequency-domain measures: LF, HF, LF/HF, nLF, nHF.
A total of 70 full-text articles remained for the detailed review.
Numerical values of individual HRV measures were graphically displayed and used to describe the predictive values of individual HRV indices in CHF patients.
To study the overlap between HRV indices reported in CHF patients and healthy subjects, published studies were used if they reported the same HRV measurements and included numerical values of the mean and standard deviation of the populations. A case-by-case representation of the published population was modeled for each representative analysis using values taken randomly from the normal distribution with the detailed mean and standard deviation. For each analysis, the reported number of subjects was used as the number of repetitions of the randomly generated case-by-case modeling values. Subsequently, these case-by-case models of individual reported CHF populations were pooled to obtain the overall mean and standard deviation of the published HRV index in CHF patients. Subsequently, the same process was repeated to determine the overall mean and standard deviation of the published corresponding HRV values in healthy subjects. The modeled spans of HRV values in CHF patients and healthy subjects were used to display a general overlap between these clinical categories. This modeling approach was used when sufficient studies reporting the same HRV measurement were available.
Generally, time-domain HRV indices are accepted to decrease in CHF patients compared to healthy controls [34, 69, 70, 72].
In healthy subjects, a good correlation (r
Only a few studies used short-term ECG recordings for the time-domain HRV analysis in CHF patients. The primary problem with reviewing the HRV results of short-term recordings is the variable recording length used in different studies. Significantly lower SDNN from short-term recordings was found during 15-minute rest, controlled breathing [74], and in 4-hour daytime segments in CHF patients [29] compared to non-VHF controls. However, only a few studies have analyzed HRV in CHF patients using exactly 5-minute recordings [37, 75, 76]. Meanwhile, none of these studies compared the HRV values in CHF patients with those in healthy subjects.
SDNN is the most often used HRV index derived from long-term recordings in CHF patients. As already stated, the SDNN index is substantially influenced by the recording duration. Therefore, only results based on recordings of the same duration might be meaningfully compared. In nominal 24-hour ECG recordings, SDNN was generally reduced in CHF patients compared to healthy controls [32, 33, 77]. However, Guzzetti et al. [78] identified a non-significant trend toward reduced SDNN in CHF patients compared to healthy controls.
SDANN quantifies slow NN interval oscillations, mainly concentrating on diurnal variability [15, 79]. Thus, SDANN represents a suitable method for assessing day–night differences in heart rate oscillations. Plausibly, it may be expected that these differences are reduced in CHF patients. In recent studies, SDANN was calculated from continuous heart rate recordings by implantable devices to predict the outcome in CHF patients [80, 81, 82]. Patients who exhibited higher SDANN early after the implantation of cardiac resynchronization therapy (CRT) devices benefited more from the treatment.
Although it is generally accepted that under normal circumstances, both RMSSD and pNN50 predominantly measure oscillations in parasympathetic activity [16, 61], a study comparing CHF patients and healthy controls found no differences in RMSSD [32]. Further, RMSSD was not investigated in other studies, while pNN50 was significantly lower in CHF patients [29, 77]. Thus, CHF-related results of these HRV indices appear rather inconsistent.
The tendency towards a decline in HRV time-domain measures in CHF patients is shown in Fig. 1. Nevertheless, an obvious overlap between the reported HRV numerical values in CHF patients and healthy controls is also evident (Fig. 1). Likewise, a wide variation in the reported HRV indices is visible within both clinical categories.
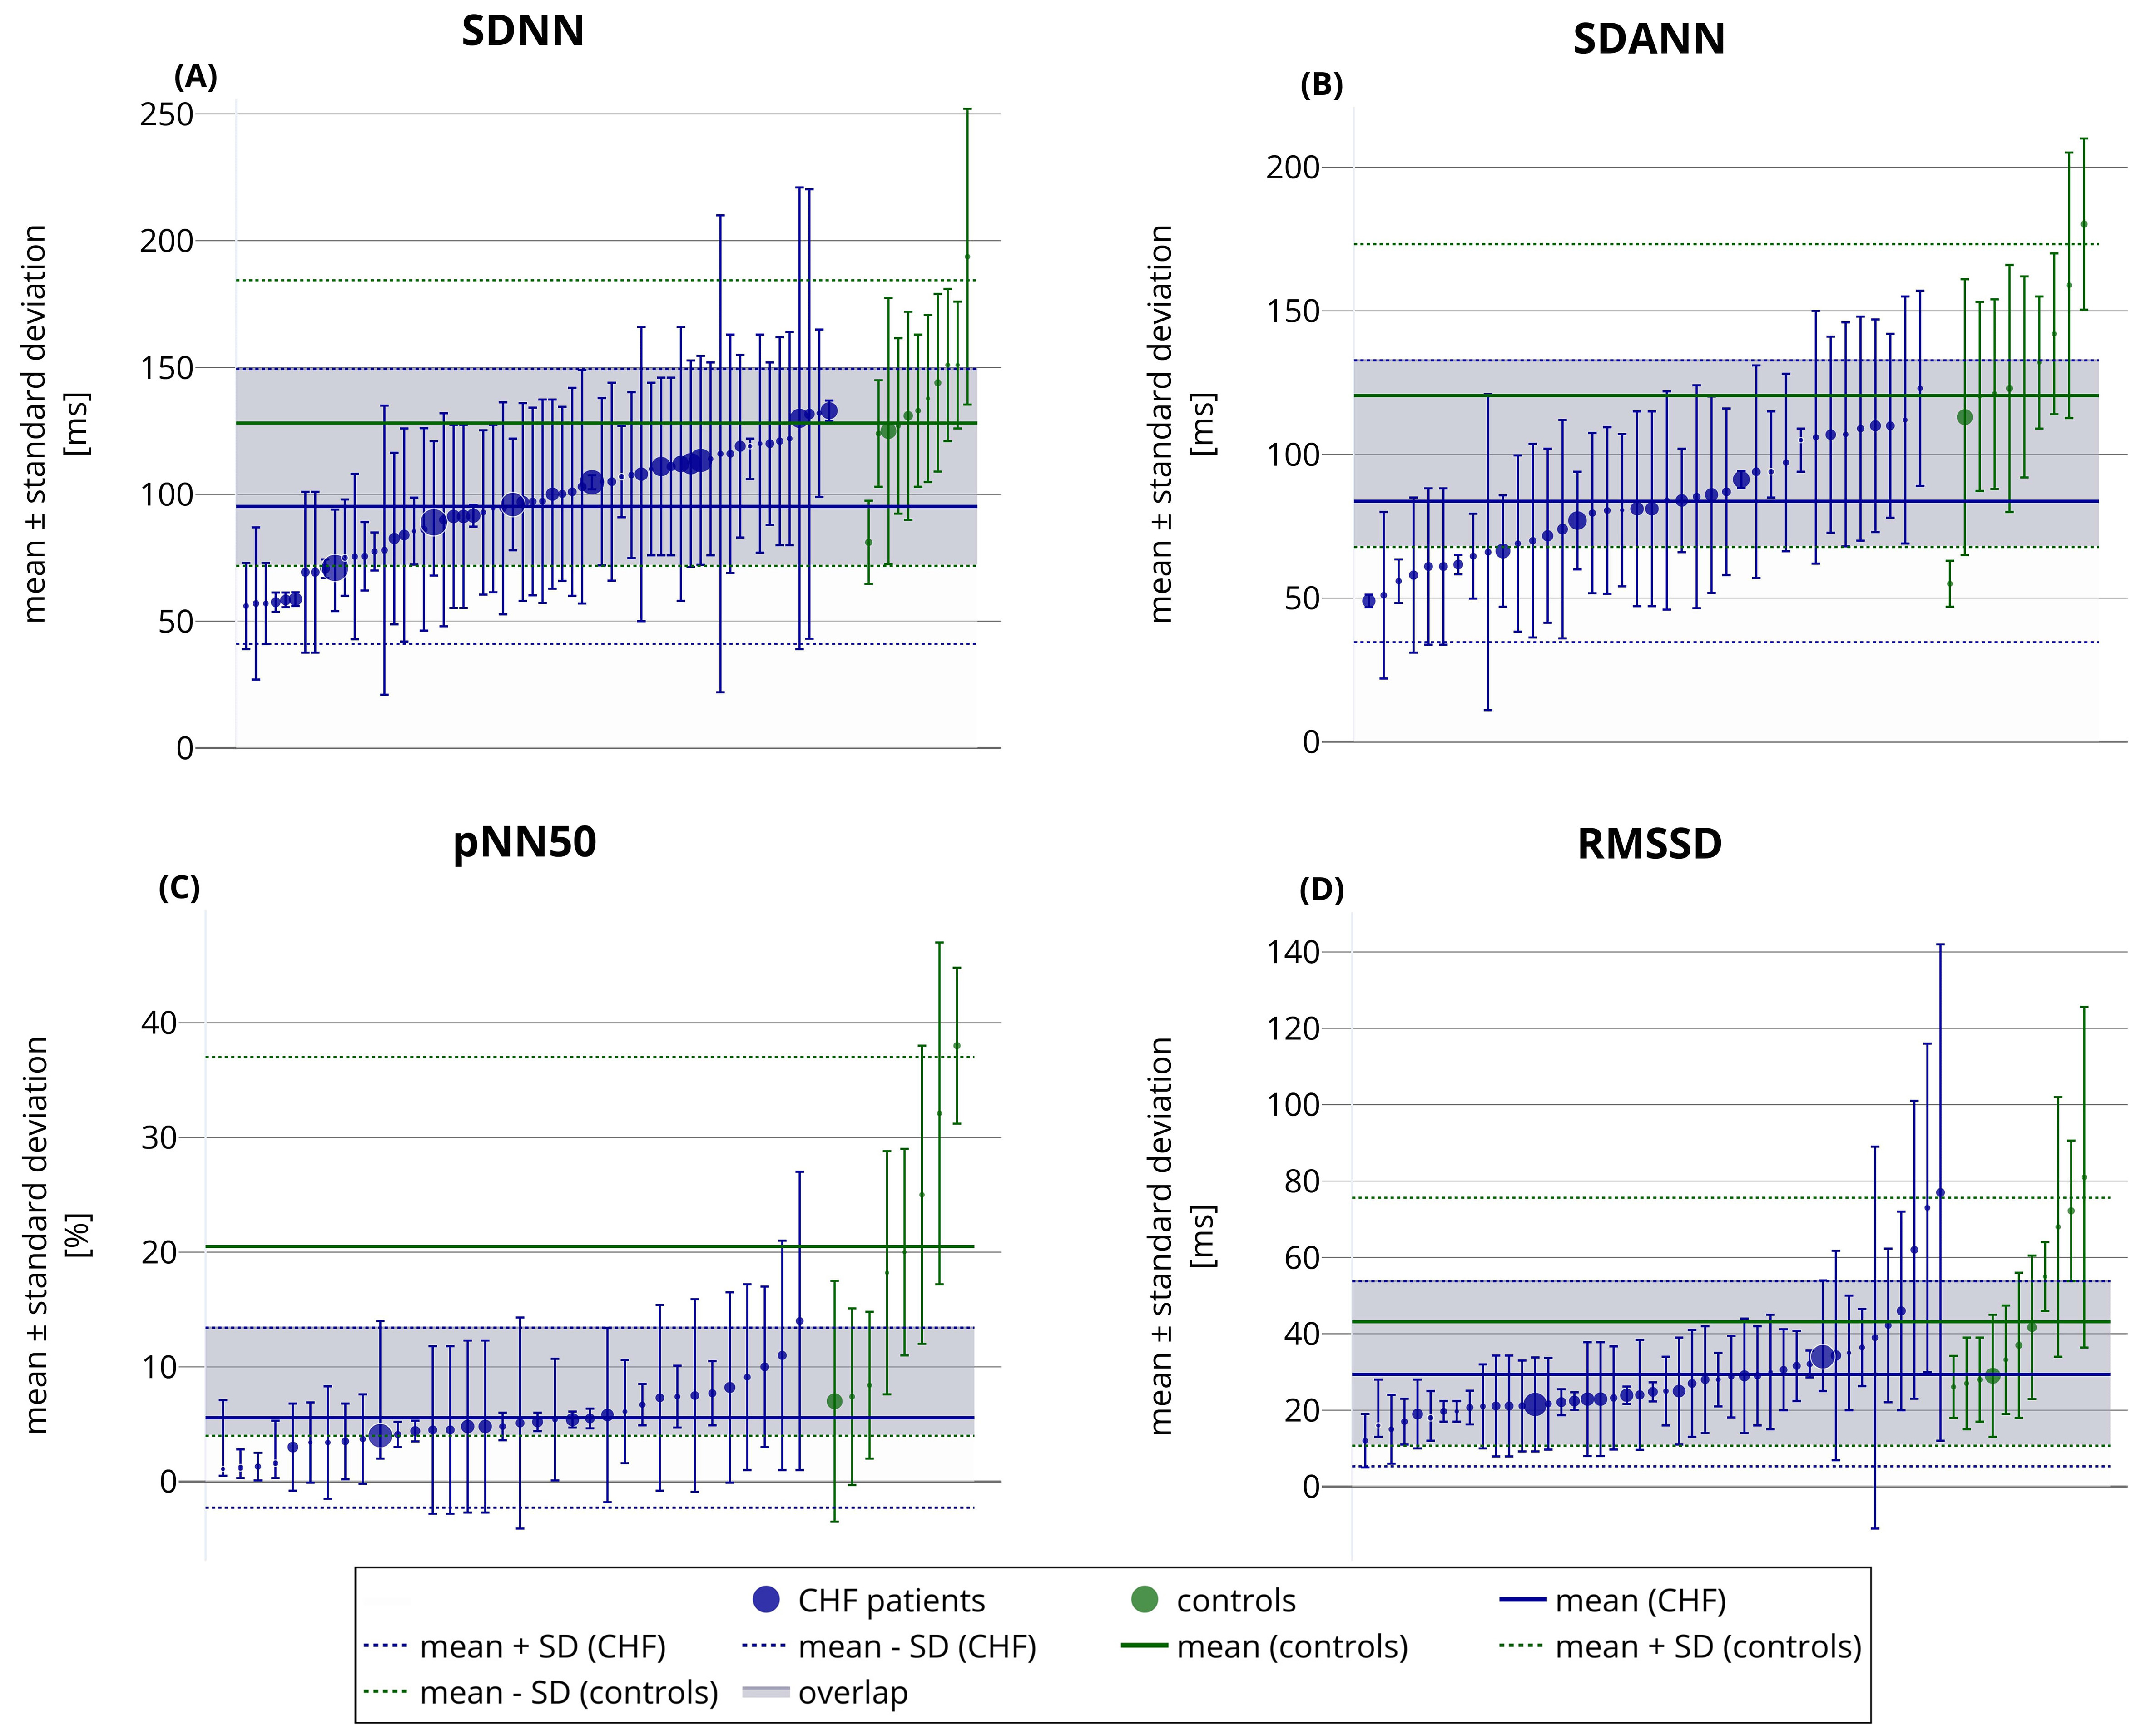 Fig. 1.
Reported SDNN (A), SDANN (B), pNN50 (C), and RMSSD (D)
values in reviewed studies of CHF patients (blue) and of healthy subjects
(green). Each circle with error bars corresponds to a different publication. The
circles present reported mean values, while the error bars show reported standard
deviations. The circle sizes indicate the sample sizes used in the studies. The
horizontal axis represents no variable and is used only for presentation
purposes. The general modeled mean
Compared to the time-domain measures, the frequency-domain HRV indices are more sensitive to the accuracy of cardiac tachograms and may easily be influenced by artifacts due to heart rate instability in the analyzed recordings. This has evident implications for interpreting CHF studies using spectral HRV analysis.
A significant decrease in the HF component after a postural change from supine to standing and increased HF during controlled breathing was observed in healthy subjects [82]. In contrast, CHF patients failed to show any changes in the HF frequency induced by controlled breathing, tilt test, or postural changes [74, 82, 83]. However, decreasing respiration frequency from 20 to 10 breaths per minute led to a significant HF increase in CHF patients [82]. Nonetheless, the results of studies dealing with the HRV analysis during controlled breathing must be carefully interpreted. The HF modulations are linked to respiration, which influences short-term alterations in sinus rhythm frequency. Thus, changes in the HF component reflect differences in rhythm modulations that do not necessarily imply corresponding changes in the vagal tone [55].
Soejima et al. [54] observed HF decreases during early CHF stages but did not find any further progressive HF changes, in contrast to progressive LF decline. Similarly, Bonaduce et al. [84] concluded that the decrease in HF seems to occur early in CHF development; thus, HF is not a suitable marker to characterize CHF progression.
Previous studies indicated that the LF component is reduced by controlled respiration in normal subjects [74, 83]. During a postural test (position changes from supine to standing), the LF component increased in normal subjects regarding the total heart period variance [82]. In contrast, no significant changes in the LF component were observed in CHF patients after a postural change [82], tilt [83], or during controlled respiration [83]. Even in asymptomatic CHF patients, there was no difference in the LF component in response to these provocations. This might suggest that autonomic dysfunction occurs during early CHF stages [59, 74].
In a study using postural changes from supine to standing, an increase in the LF/HF ratio was seen in normal subjects; meanwhile, this was absent in CHF patients, possibly reflecting blunted cardiovascular reflexes [82].
An increased nLF was observed in healthy subjects during maneuvers that increase sympathetic tone (90° tilt, standing, mental stress, and moderate exercise) [85]. However, in the same study, CHF patients failed to show any nLF or nHF changes during the corresponding maneuvers. Guzzetti et al. [78] noted a significantly lower nLF spectral component in CHF patients than in healthy subjects.
Research using normalized spectral components remains limited. Some authors use a different frequency band for the LF spectrum (e.g., 0.03–0.15 Hz) [78]. Meanwhile, because of the complex interpretation of the LF components, changes in LF/HF and normalized frequency measures are difficult to associate with specific autonomic control processes in CHF patients.
VLF and ULF were reported to have the strongest predictive value in acute myocardial infarction survivors [86]. Nevertheless, the predictive values of VLF and ULF in CHF patients remain uncertain. While some studies suggest a potential association between VLF components and cardiac events, only a few studies have investigated this relationship, and their findings are not easily comparable [87, 88, 89].
As discussed later in this text, numerical comparisons of spectral HRV results are problematic because of differences in reported units. Therefore, we did not attempt to apply the analyses presented in Fig. 1 (for the time-domain HRV indices) to the results of spectral HRV measurements.
Risk stratification in CHF patients is clinically important. Patients at higher risk of adverse outcomes, such as hospitalization, worsening symptoms, or mortality, benefit from frequent clinical attention. Hence, effective risk stratification enables clinicians to tailor treatments with the aim of prognosis improvement [90]. Many published studies focused on all-cause mortality (ACM) and sudden cardiac death (SCD) in CHF patients. Conversely, numerous other studies have examined HRV predicting different cardiac events in CHF patients.
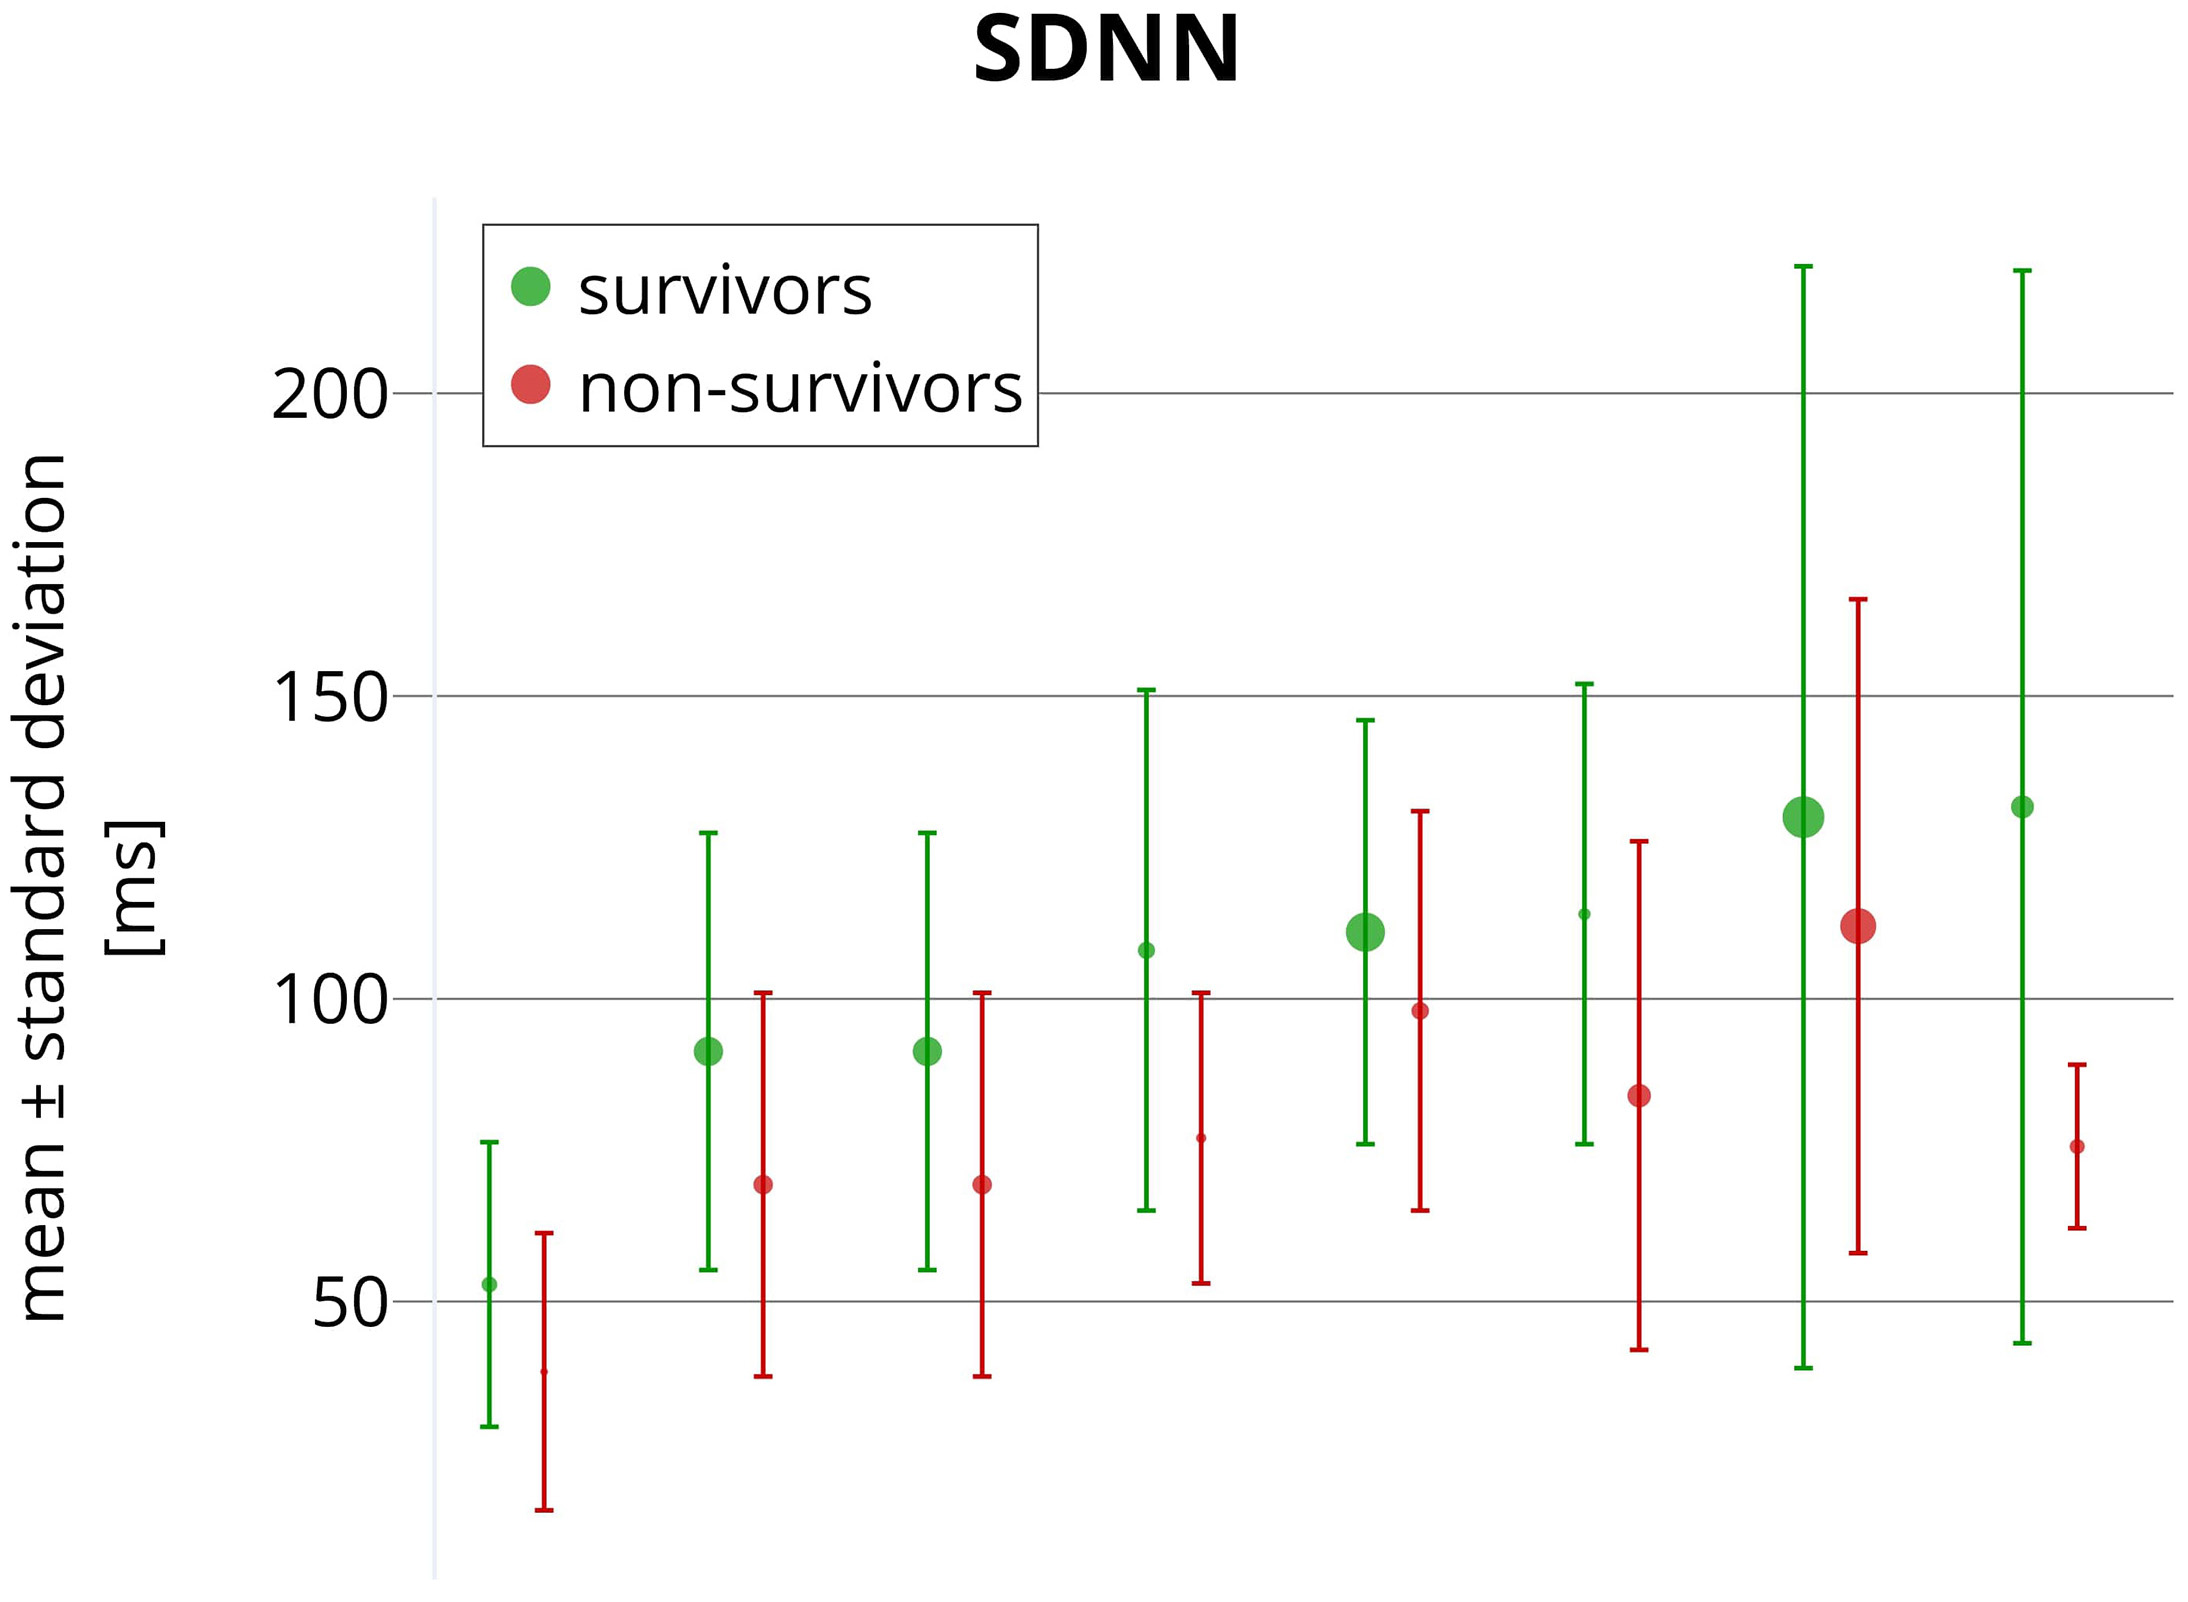
It has long been debated whether decreased HRV indices indicate high ACM risk in CHF [16, 36]. In several studies, reduced SDNN values were associated with ACM in CHF patients [91, 92, 93]. However, different predictive values of the SDNN cut-off were proposed. Namely, 24-hour SDNN measurements below 108 ms [94], 100 ms [95], 86 ms [96], 70 ms [97], 67 ms [92], and 44 ms [39] were reported as ACM predictors in CHF patients. Meanwhile, among other studies, Nolan et al. [98] reported mortality rates in patients with mild to moderate CHF stratified according to SDNN measured over a nominal 24 hours and found ACM incidences of 5.5%, 12.7%, and 51.4% for SDNN measurements above 100 ms, between 50 and 100 ms, and below 50 ms, respectively. In a recent study by Cheng et al. [81], post-implant depressed HRV was associated with ACM in CHF patients receiving an implanted defibrillator with cardiac resynchronization function (CRT-D). For every 10 ms increase in SDNN at 6 months after CRT-D implantation, the risk of ACM decreased by 27%. Studies comparing 24-hour SDNN in CHF survivors and non-survivors are summarized in Fig. 2.
 Fig. 2.
Reported SDNN values comparing CHF survivors (green) and non-survivors (red). Each pair of circles with error bars corresponds to a different publication. Circles present mean values, while the error bars show reported standard deviations. The circle sizes indicate the sample sizes used in the studies. The horizontal axis represents no variable and is used only for presentation purposes. All SDNN values were obtained from long-term ECG recordings (nominal 24-hour Holter recordings).
Using frequency-domain HRV analysis in CHF patients, baseline LF power has often been examined as an ACM predictor [93]. Ponikowski et al. [95] and Folino et al. [93] showed that reduced LF power identifies CHF patients at a high risk of cardiac death. In most studies, RMSSD, pNN50, and HF have not been found to predict ACM in CHF patients [93, 95, 98]. Further, the role of pNN50 in CHF risk stratification has been suggested only once [84].
Thus, compared to other HRV measures, SDNN and LF seem to be important prognostic ACM markers in CHF patients [92]. However, the published studies do not agree on a threshold that optimally indicates an increased ACM risk. Fig. 2 shows a large overlap of 24-hour SDNN values between surviving and non-surviving CHF patients.
SCD predictions based on HRV indices remain controversial in CHF patients [36]. Depressed SDNN values did not predict SCD in CHF patients with left ventricular ejection fraction (LVEF) greater than 35% [96]. The same observation was made in patients with mild to moderate CHF [91, 98, 99, 100]. In several studies, abnormal frequency components of HRV were also not found to predict SCD in mild to moderate CHF [54, 100].
Only a small number of studies showed significant differences in selected HRV
measures between SCD victims and survivors among CHF patients. Galinier
et al. [92] found that reduced daytime LF power was an independent risk
predictor of SCD in CHF patients with a New York Heart Association (NYHA) class
above stage I. In the same study, SDANN and RMSSD were significantly related to
SCD. Fauchier et al. [101] reported that depressed SDNN (
Limited numbers of SCD events during the follow-up periods of reported studies are likely one of the reasons for the observed inconsistencies. Additionally, many CHF patient deaths are difficult to classify with certainty [92, 96, 102]. Multiple studies also suggested that in CHF patients with lowered LVEF, ischemic heart disease and/or non-sustained ventricular tachycardias are more potent SCD predictors than HRV indices [92, 98, 99, 100]. Many other studies on CHF patients also reported that the risk was not purely associated with SCD but the risk of SCD in combination with other cardiac events [32, 42, 87].
Similar to SCD risk stratification, HRV-based predictions of combined cardiac events (CEs) in CHF patients also appear controversial. Studies have been reported that include a wide variety of end-point classifications: The combination of SCD, pump failure death, transplantation, and hospitalization due to CHF worsening has frequently been used [32, 42, 87, 88, 89, 103, 104]. Kaufmann et al. [105] used a major adverse cardiovascular events endpoint, defined as a combination of cardiovascular death, nonfatal myocardial infarction, and/or nonfatal stroke, while using short 10-minute recordings during controlled respiration in ischemic CHF patients. Furthermore, Kaufmann et al. [105] reported that none of the HRV indices were significant CE predictors.
Likewise, the reported CE risk association with the LF component and the LF/HF ratio appears inconsistent. While the LF/HF ratio did not predict CE in most studies [87, 88, 105, 106], Lucreziotti et al. [42] described a low LF/HF ratio as an independent CE predictor in CHF. A possible explanation may be including patients with advanced disease stages; thus, spectral analysis might allow better prognostic stratification in advanced CHF stages [54].
Conversely, SDNN appeared to be a promising CE predictor [32, 95, 103, 104, 107]. Jiang et al. [104] observed that depressed SDNN had a higher predictive value than more conventional parameters (lower LVEF and increased frequency of ventricular premature complexes) that were not associated with CE. Nevertheless, other studies did not demonstrate the predictive value of SDNN [88, 105, 106]. Krüger et al. [103] concluded that in CHF patients, the inclusion of depressed SDNN enhances the prognostic power offered by lowered LVEF. However, other HRV indices failed to predict CE in this study [103].
RMSSD and pNN50 did not show any usefulness in CE risk stratification studies. This finding is unsurprising since these indices express rapid beat-to-beat heart period changes related to abnormal regulatory systems in most CHF patients [98]. Even more controversial is the predictive power of frequency-domain HRV indices [36]. Thus, no specific link has been established between CE and parasympathetic and/or sympathetic activity and sympathovagal balance [93].
Studies using HRV measures for predicting various CE measures are shown in Table 3 (Ref. [32, 42, 87, 88, 89, 95, 103, 104, 105, 106, 107]). Table 3 illustrates the difficulty in comparing the studies since different CE definitions prevent overall conclusions from being made.
| Study | Recording | Patient numbers | Cardiac events | Follow-up | Findings |
| Fauchier et al., 1997 [32] | 24-hour Holter | 93 IDC pts: 33 NYHA I and 60 NYHA II–IV | SCD, pump failure death, and transplantation | 49.5 |
Reduced SDNN independent predictor of CE; RMSSD not predictive of CE |
| Krüger et al., 2002 [103] | 24-hour Holter | 222 CHF pts | SCD, pump failure death, and CHF hospitalization | 15 |
SDNN was significantly lower in patients with CE |
| Fauchier et al., 2003 [107] | 24-hour Holter | 103 IDC pts | Cardiac related death, sustained ventricular tachycardia, and transplantation | 27 |
SDNN was an independent predictor of CE |
| Jiang et al., 1997 [104] | 24-hour Holter | 26 CHF pts of NYHA III | SCD, pump failure death, and successful resuscitation | 18 months | SDNN and SDANN are significantly lower in patients with CE. |
| RMSSD, pNN50, LF, and HF are not predictive of CE | |||||
| Ponikowski et al., 1997 [95] | 24-hour Holter | 102 CHF pts: | Cardiac-related death | 584 |
SDNN, SDANN, and LF are independent predictors of survivors. |
| 48 NYHA II, 51 NYHA III, and 3 NYHA IV | |||||
| RMSSD, pNN50, and HF are not predictive of CE | |||||
| Lucreziotti et al., 2000 [42] | 5 minutes | 75 CHF pts | SCD, pump failure death, and transplantation | 11.4 (0.20–38.40) months | LF/HF is an independent predictor of CE. |
| LF and HF are not predictive for CE | |||||
| Tateishi et al., 2002 [89] | 24-hour Holter | 43 CHF pts: | SCD and CHF hospitalization | 12 months | VLF can be used in Cheyne–Stokes breathing patients to predict CE |
| 33 NYHA II and 11 NYHA III | |||||
| Yamada et al., 2003 [88] | 24-hour Holter | 65 CHF pts | SCD and CHF hospitalization | 34 |
VLF is significantly associated with CE. |
| SDNN, SDANN, RMSSD, pNN50, LF, HF, and LF/HF are not predictive of CE | |||||
| Hadase et al., 2004 [87] | 24-hour Holter | 54 CHF pts | SCD, pump failure death, and CHF hospitalization | 19.8 |
VLF is an independent predictor of CE. |
| HF and LF/HF are not predictive of CE | |||||
| Hashimoto et al., 2020 [106] | 24-hour Holter | 133 CHF pts | Cardiac related death, acute myocardial infarction, stroke, and CHF hospitalization | 5.4 |
VLF (night-time) is significantly lower in patients with CE. |
| SDNN and LF/HF (daytime, nighttime, total) are not predictive of CE | |||||
| Kaufmann et al., 2022 [105] | 10 minutes | 188 ich CHF pts: | Cardiovascular death, nonfatal myocardial infarction, and nonfatal stroke | 34 (14–71) months | SDNN, RMSSD, pNN50, nLF, and LF/HF are not predictive of CE |
| 34 NYHA I, 122 NYHA II, and 32 NYHA III |
CE, cardiac event; ich, ischemic; IDC, idiopathic-dilated cardiomyopathy; LF/HF, the ratio between the low-frequency and high-frequency; NYHA, New York Heart Association; pts, patients; SCD, sudden cardiac death.
The published literature shows clear agreements, substantial disagreements, and existing open questions related to recording technology, HRV measurements, and their clinical value and applicability.
Ultra-short-term HRV analyses have not been found useful in CHF research. Meanwhile, only a few studies utilized ultra-short-term HRV analysis in CHF patients. Shah et al. [108] found that reduced baseline HRV (determined by SDNN and RMSSD) is associated with an increased incidence of CHF. Nevertheless, according to the established standards [15], the LF component cannot be estimated from recordings shorter than 2 minutes (for reliable spectra, stable 5-minute recordings are recommended). Thus, ultra-short ECG recordings are unsuitable for spectral HRV analysis and are not only for CHF patients [15].
Short-term HRV analyses are commonly used in CHF severity, progression, or mortality prediction studies. While the number of these studies is not large, short-term ECG recordings are easy to obtain, and their advantages include faster data processing and, more importantly, the convenience of controlling confounding factors (activity, respiration, body position, and room temperature). In contrast, short-term HRV analyses might suffer from lower reproducibility due to the physiologic variation in the cardiac autonomic status [12].
In comparison, long-term HRV analysis is a more stable tool, provided that standardized recording conditions are ensured. Consequently, most studies comparing HRV in CHF patients have been based on ECG signals of nominal 24-hour Holter recordings; even longer recordings might be obtained from wearable electronics or implantable devices. Nevertheless, much longer recordings are, by definition, more time-consuming to determine and might easily be influenced by changes in physical activity, environmental factors, and noise [12].
Lower SDNN values are commonly observed in CHF patients, representing reduced autonomic flexibility due to impaired cardiac hemodynamic function. Numerous studies have demonstrated that lower SDNN values are associated with worse clinical outcomes, including higher mortality rates [32, 95, 103, 104, 107]. In CHF studies, SDNN and other HRV parameters were most frequently obtained from nominal 24-hour ECG recordings.
Preserved autonomic responsiveness characterizes CHF patients with better prognosis [93]. Simple maneuvers (e.g., postural tests or controlled breathing) that allow autonomic responsiveness to be assessed based on short-term HRV comparisons have been used in several clinical outcomes studies in CHF patients [37]. Physical activity, posture, and respiratory effort influence HRV, yet these confounders are all difficult to standardize during long-term ambulatory recordings [109]. Thus, short-term ECG recordings obtained under the supervision of the investigator are recommended. Short-term data acquisition during provocative maneuvers seems to provide more useful information regarding CHF prognosis than evaluating a baseline unprovoked cardiac autonomic status [93]. HRV assessed from these recordings appears useful in identifying CHF patients likely to benefit from CRT [110, 111] and might also identify patients with better prognoses [93]. CHF patients with poor prognosis show more rigid autonomic responses, or a lack of such responses, as they are unable to react to many provocative stimuli. Indeed, significant HRV variation is missing during simple, provocative maneuvers in CHF patients with the worst prognosis [93]. The reproducibility of all these observations depends, to a large extent, on the conditions and duration of ECG recordings, which, unfortunately, have not been consistent in published studies.
Several authors analyzed long-term HRV in CHF patients indicated for CRT implantation [80, 111, 112, 113]. Implanted CRT devices might be used to measure HRV and monitor HRV evolution continuously after implantation. Meanwhile, studies showed HRV improvement in CHF patients with left bundle block after CRT implantation [81, 110]. A lack of HRV improvement after CRT implantation also identifies patients at higher risk of CE, ventricular tachycardia, and/or ACM [81, 111, 113].
Clinical use of HRV is also limited for other reasons. The prevalence of atrial fibrillation, which eliminates the possibility of HRV assessment, is around 10–15% in mild to moderate CHF and increases up to 50% in patients with more advanced CHF [114]. HRV analysis may be negatively influenced by atrial and ventricular ectopic beats or atrial stimulated beats in CHF patients with cardiac implantable devices [115]. Even if the ectopic beats are removed from the recording, the effects of heart rate turbulence remain [116, 117] and tend to increase the LF power without affecting the HF power appreciably [115]. Sinus node dysfunction, atrioventricular block, and prevalent paced rhythm are additional exclusion criteria in HRV studies of CHF patients [88].
Diurnal physical activity, breathing, and cognitive and emotional reactions influence HRV while being difficult to standardize during long-term recordings [109, 118]. Additionally, published articles often do not describe the conditions under which the 24-hour Holter recordings were obtained.
Although most studies have shown depressed HRV in CHF patients, a wide variation exists among the reported time-domain HRV indices. We have already shown an overlap in time-domain HRV measures between CHF patients and healthy subjects. Therefore, numerical differences in HRV indices between CHF patients and normal controls are obscured, likely because of dissimilarities in investigative protocols and recording conditions.
Spectral analysis of HRV benefits from standardized 5-minute ECG recordings. However, while such recordings are frequently used [37, 119], many studies used different setups, including 10-minute or longer recordings [119, 120]. Moreover, many authors used spectral analysis of 24-hour recordings or shorter segments (e.g., 5 minutes) with results averaged over the entire 24-hour period [31, 37, 42, 74, 82, 119, 121, 122, 123].
The reported units for the main spectral components (VLF, LF, HF) are also not
uniform. In most studies, the appropriate units of ms2 were used.
However, some authors reported units of ln(ms2), ln(ms),
(beats/min)2
Although several studies confirmed that SDNN provides independent prognostic value in CHF patients [98, 124], no consistent SDNN cut-off values have been reported. Thus, while reported sensitivity might be high, lower specificity prevents any measure from being used alone as a routine screening test [125, 126]. The reported results regarding predicted SCD and/or other CE remain conflicting.
A general consensus has emerged that HRV indices decrease as the CHF severity
increases. This is consistent with increased sympathetic activation due to
disease progression [109]. However, the published studies characterizing CHF
severity are less consistent. A significant reduction in SDNN, SDANN, and RMSSD
was found in CHF patients with NYHA classes
The use of spectral HRV analysis in assessing CHF severity remains even more controversial. A significant increase in the LF spectral component was found in mild symptomatic CHF patients (NYHA class II). This may reflect decreased sinus nodal responsiveness to neural modulatory influences [59, 83]. However, another study found no significant difference in LF power between patients with asymptomatic left ventricular dysfunction and normal subjects [74]. The LF component seems to decrease with the severity of the disease [74], and an almost complete absence of LF was found in the most severe CHF of NYHA class IV [79, 83]. A possible explanation for the reduction in LF might include impaired adrenergic receptor responsiveness, central autonomic regulatory impairment, and increased chemoreceptor sensitivity [30, 48]. Soejima et al. [54] showed LF decreases progressively depending on the severity of CHF, while the LF/HF ratio did not show any significant differences between NYHA classes. Nevertheless, other studies failed to document any significant correlation between declined spectral HRV indices and NYHA functional class [42, 128, 129].
HRV assessment is not commonly used in clinical practice for reasons that likely include insufficient validation, inconsistent results, and methodological complexity. Long-term HRV assessment ideally requires in-hospital recordings, so the healthcare burden becomes a practical obstacle [130, 131, 132]. Therefore, it is appropriate to consider key areas for future research to enhance the understanding of the remaining problems and to increase the applicability of HRV in CHF management.
Accurate HRV measurements require consistent, high-quality data, which may be challenging, especially with long-term recording, as artifacts and recording inconsistencies might pollute these data. Conversely, short-term measurements might eliminate these problems. However, the question remains of how to perform a short, standardized test that could be applied in a standard outpatient environment. The recording conditions (duration, posture, free or controlled breathing, mood, stress, etc.) can substantially affect the results of short-term HRV measures. Thus, broadly acceptable investigative protocols are needed to ensure standardized conditions during a short HRV test.
Numerous HRV indices might be derived from ECG recordings. As discussed, a spectral analysis offers advantages over time-domain measures when applied to short-term recordings that would make HRV-based testing more practical. In conjunction with provocative components of the HRV tests, standardization of the technical set-up of the spectral HRV analysis is needed, including the selection of outcome parameters.
Nonlinear HRV methods were not included in our review due to their limited clinical applicability [18] and lack of sufficient validation in CHF studies, which often involved only small numbers of patients.
It might appear appealing to involve artificial intelligence (AI) systems in supporting future HRV analyses. Indeed, AI has already been successfully applied to risk assessment in well-defined clinical populations [133, 134, 135]. Nevertheless, it is not obvious whether and how AI might address the problems of handling recordings of incompatible quality and duration (which might, despite their poor reproducibility, be selected by the AI models as prognostic indicators instead of the HRV indices) and what input should be provided to the AI systems. Thus, if the source ECG recordings are processed, characteristics very different from the sinus nodal periodicity might dominate the AI systems [136, 137].
HRV analysis should be capable of enhancing the personalized healthcare of CHF patients by providing insights into autonomic function and facilitating continuous monitoring. ANS responds differently to various stimuli, situations, and treatments for each patient, which all necessitate a tailored approach. Thus, methodologies need to be proposed to establish a baseline HRV profile for each CHF patient and utilize such profiles to optimize therapeutic interventions.
HRV analysis might also be a cost-effective tool for monitoring and predicting responses to CHF treatment, including medication, CRT, and lifestyle modifications. However, different CRT device manufacturers implement different HRV measures, leading to inconsistencies in available parameters and making their global interpretation difficult [111, 138, 139]. This presently limits any standardized use of HRV in therapy assessment. An increase in HRV may indicate improved autonomic regulation and cardiac function, whereas a lack of improvement or a decline in HRV indices might suggest a suboptimal response to CRT. In such cases, HRV data could potentially guide CRT optimization by suggesting adjustments to device settings. Advanced methods, such as individually tailored AV and VV synchronization using ultra-high-frequency ECG, may further refine therapeutic outcomes.
Wearable devices have gained significant interest for their potential in monitoring CHF patients [140]. Indeed, most commercially available smartwatches rely on photoplethysmography to detect heart rate and cardiac cycle periods [141]. Nevertheless, as already mentioned, although convenient and noninvasive, photoplethysmography is susceptible to motion artifacts, changes in skin tone, and varying levels of ambient light, which all might compromise the accuracy of HRV measurements [142].
Key standardization questions include (a) which HRV measure is the most reliable predictor of CRT response and (b) how HRV-based optimization strategies might be effectively implemented in clinical practice.
To ensure standardized conditions and minimize external stressors, HRV testing should occur in a noise- and disturbance-free environment, including temperature-controlled examination rooms. Moreover, a 5–10-minute rest before the test should be included to stabilize heart rate, and a standing, seated, or supine position is typically used, as postural changes affect autonomic tone. A combination of several postural positions maintained for 10 minutes (of which the middle 5-minute section is subsequently used for the HRV analysis) makes it possible to assess ANS behavior and responses to the postural provocations. This has already been shown in a large pediatric population of healthy children and adolescents [143, 144, 145]. Nevertheless, extensive protocols with many postural changes are likely unnecessary since the increased duration of the tests might hamper their clinical applicability. Ideally, tests should be concise to ensure feasibility in a clinical environment.
The selection of HRV indices and the definition of their cut-off thresholds are critical for the effectiveness and applicability of HRV analysis. As we have shown, the most useful HRV indices in CHF patients were obtained from long-term recordings; hence, choosing a suitable index for our proposed short tests might be challenging. Therefore, further experience with the proposed postural provocative tests is needed.
The time-domain and frequency-domain measures are widely accepted and should be considered. Consistent with the recent consensus on developing more advanced HRV techniques [18], further experience with the well-established time- and frequency-domain methods seems to be fundamentally preferable to creating newer, more complex, and technically challenging methods. More importantly, establishing well-defined cut-off thresholds for the time- and frequency-domain methods now represents an unmet clinical need, and solving it involves extensive research correlating specific HRV indices values with clinical outcomes in CHF patients. Additionally, combining HRV indices with the characterization of myocardial substrate might enhance clinical insight into CHF prognosis.
While reviewing the literature on the diagnostic and prognostic roles of various HRV indices in CHF patients, we have intentionally limited the scope of the review to the time-domain and spectral-domain HRV techniques. More technically complex, especially non-linear, measures have not been considered since these do not appear to offer noticeable clinical advantages to the more established indices. Indeed, a PubMed search yielded only 34 nonlinear HRV studies, mostly with fewer than 50 patients. A detailed comparison of spectral components was also not included. The corresponding published articles used different recording durations and inconsistent reporting units—we could not reconcile these differences. Moreover, it would be valuable to divide the article by other types of heart failure (systolic/diastolic, heart failure with preserved/reduced/mildly reduced ejection fraction, etc.); however, very few articles deal with HRV in these CHF sub-populations. Consequently, a review of these might have been misleading. While focusing on HRV in CHF patients, we have not considered age, sex, or race when comparing individual HRV measures. The modeling approach to derive globally representative HRV data in healthy subjects and CHF patients should have ideally included Monte Carlo-type repetitions of random number generation. Nevertheless, since our aim was merely to demonstrate a substantial overlap between healthy subjects and CHF patients, we trust that our simpler approach was fully sufficient.
In summary, there is a general agreement that HRV is decreased in CHF patients. Despite expectations, simple comparisons of CHF patients with healthy subjects did not find any clear and fully consistent separation of the two population categories; meanwhile, using HRV indices as risk factors in CHF patients remains controversial. While time- and frequency-domain analyses were repeatedly reported to predict ACM, no apparent agreement exists on the cut-off values for any of these HRV indices. Thus, the HRV-based prediction of SCD and other CE in CHF patients does not appear clinically valuable.
Consequently, we propose several standardization questions and open issues concerning the established time- and spectral-domain HRV indices. Short-term recordings are preferred for practical reasons, as these allow a standardized environment and repeatable investigation protocol to be proposed and tested. We strongly believe that for the clinically practical utility of HRV assessment in CHF patients, solutions to these problems are needed much more than developing even more complicated HRV techniques, regardless of their conceptually or technologically elaborate concepts.
MMik — study concept and design, literature searches, published data review, manuscript drafts. DP — study concept and design, graphics design, visualization, study supervision. JŘ — software coding for data reconstruction, visualization, and composition of figures. MMal — study concept and design, graphics design, study supervision, review of manuscript drafts, final manuscript approval. All authors contributed to the conception and editorial changes in the manuscript. All authors read and approved the final manuscript. All authors have participated sufficiently in the work and agreed to be accountable for all aspects of the work.
Not applicable.
Not applicable.
Supported by Ministry of Health, Czech Republic - conceptual development of research organization (FNBr, 65269705) and SV/MUNI/A/1626/2023.
The authors declare no conflict of interest.
References
Publisher’s Note: IMR Press stays neutral with regard to jurisdictional claims in published maps and institutional affiliations.