


 , Nilanjon Naskar 1,†, Kirsten Reess 1, Daniela Nobre Sarmento dos Santos 1, Julia M. Weise 3, Thomas Blatt 3, Sebastian Kordes 3, Paul Walther 2, Angelika Rück 1
1 Center for Biomedical Research, Ulm University, 89081 Ulm, Germany
2 Central Facility Electron Microscopy, Ulm University, 89081 Ulm, Germany
3 Research and Development, Beiersdorf AG, 20245 Hamburg, Germany
†These authors contributed equally.
Abstract
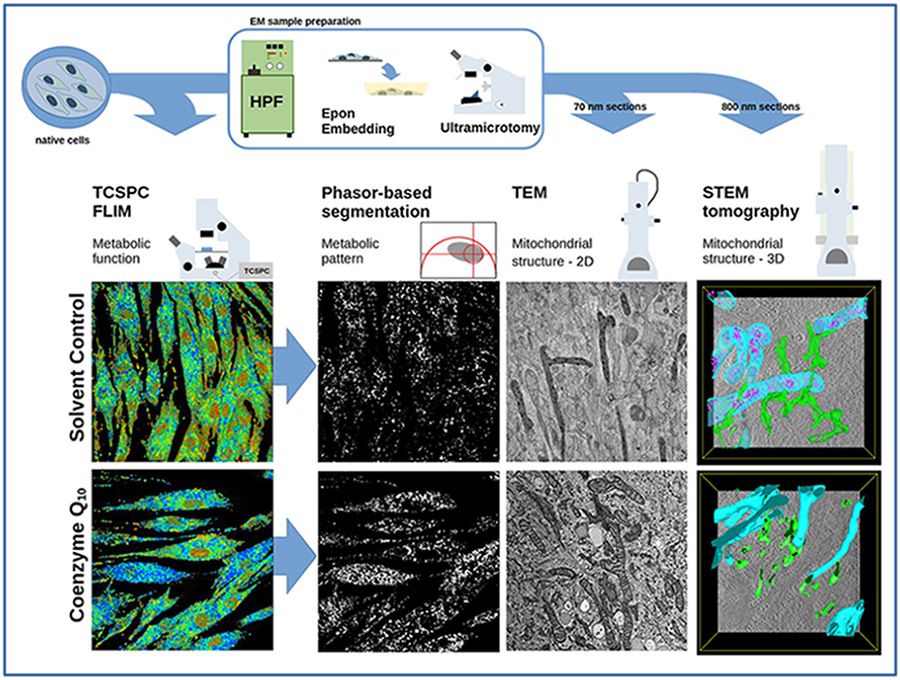
Coenzyme Q10 (CoQ10), also known as ubiquinone-10, is an important molecule of the mitochondrial respiratory chain that acts as an electron carrier between complexes I, II, and III and additionally functions as an antioxidant. Due to its bioenergetic properties, CoQ10 is of high interest for therapeutic and cosmetic use. This study aims to characterize the metabolic impact of CoQ10 on primary human dermal fibroblasts (HDF) using fluorescence lifetime imaging microscopy (FLIM) and electron microscopy.
FLIM of nicotinamide adenine dinucleotide (NADH) is a robust method to characterize cellular energy metabolism that also provides spatial information. Electron microscopy offers a way to characterize the ultrastructure of mitochondria and reveal features not visible in FLIM.
We reported a shift towards longer lifetimes of NADH in primary fibroblasts from ten different donors upon treatment with CoQ10, which indicates the stimulation of oxidative phosphorylation. This is confirmed by phasor-based metabolic pattern segmentation, which showed localization of longer NADH lifetimes in CoQ10-treated cells, indicating activated mitochondria in the cytoplasm. In addition, a complementary investigation of the mitochondrial ultrastructure using transmission electron microscopy (TEM) and scanning transmission electron microscopy (STEM) tomography showed a reduction in stress granules in CoQ10-treated cells.
Together, FLIM and electron microscopy (EM) imaging strongly imply that CoQ10 stimulates cellular energy metabolism.
Graphical Abstract
Keywords
- CoQ10
- fibroblasts
- oxidative phosphorylation
- energy metabolism
- FLIM
- phasor-based segmentation
- high pressure freezing
- transmission electron microscopy
- STEM tomography
Coenzyme Q10 (CoQ10), also known as ubiquinone-10, is a 1,4-benzoquinone with an isoprenoid side chain with ten subunits. In the mitochondrial respiratory chain, CoQ10 serves as an electron carrier, transferring electrons between complexes I and III and complexes II and III [1]. CoQ10’s role as an electron carrier allows it to play a crucial role during the process of adenosine triphosphate (ATP) generation. Furthermore, CoQ10 plays an important role as an antioxidant [2]. Tissue CoQ10 levels are determined by endogenous biosynthesis and dietary uptake [3]. During the aging process, CoQ10 levels decline in multiple tissues, e.g., heart, kidney, lung, and skin [4, 5]. These biochemical properties have rendered CoQ10 a molecule of interest for therapeutic and cosmetic use. Given the well-established role of CoQ10 as an essential component of the mitochondrial respiratory chain, we investigated human dermal fibroblasts with CoQ10 in a proof-of-concept study with three sophisticated optical methods: (1) fluorescence lifetime imaging microscopy (FLIM), (2) transmission electron microscopy (TEM), and (3) scanning transmission electron microscopy (STEM) tomography to provide a holistic quantification and visualization of CoQ10’s cell energizing effect.
Over the last decades, FLIM of nicotinamide adenine dinucleotide (NADH) has become the gold standard for imaging-based characterization of cellular energy metabolism. The fluorescence lifetime of NADH is influenced by its protein binding, which changes depending on the metabolic state of the cell. The fluorescence lifetime of protein-bound NADH is ~2500 ps, whereas the fluorescence lifetime of free NADH is only ~400 ps [6, 7]. The contribution of the nicotinamide adenine dinucleotide phosphate (NADPH), which cannot be spectrally separated, can be distinguished by a longer lifetime in comparison to NADH [8]. Free NADH is primarily produced during anaerobic ATP production during glycolysis, whereas bound NADH is correlated to aerobic ATP production during oxidative phosphorylation (OXPHOS) in the inner mitochondrial membrane. There, NADH is bound to complex I of the mitochondrial respiratory chain. From this, anaerobic and aerobic cellular energy metabolism can be distinguished by inspecting the fluorescence lifetime of NADH. Bound and free NADH are always present but have varying contributions. Therefore, a bi-exponential fitting procedure for the fluorescence intensity is provided to calculate the mean fluorescence lifetime of NADH. A shift towards OXPHOS is correlated with an increase in the mean fluorescence lifetime. Alternatively, the metabolic index, defined as the ratio between unbound NADH (a1) and bound NADH (a2), can be calculated. In that case, a shift towards OXPHOS can be deduced from a decrease in the metabolic index.
Phasor-based image segmentation can reveal distinct metabolic patterns within cells [9, 10]. Instead of fitting the fluorescence intensity with a bi-exponential fit to calculate the lifetimes, a Fourier transform of the intensity is calculated and visualized as a vector (called phasor) in the unit circle, with a characteristic length (called modulation) and phase (the angle to the X-axis). All phasors end on the unit circle if the fluorescence lifetime follows a mono-exponential decay. In case of a bi-exponential decay, e.g., the NADH lifetime, the endpoints of all phasors form a phasor cloud within the unit circle. Within the phasor cloud, groups with long and short lifetimes can be selected and used to define regions of interest and segment the image. Thereby, different metabolically active areas in the cell can be distinguished according to the NADH lifetime [9, 10].
While FLIM can yield a sensitive, label-free characterization of mitochondrial energy metabolism, it cannot produce high-resolution images of intracellular organelles due to the diffraction limit of visible light. Therefore, the characterization of mitochondrial structure relies on electron microscopy. Since mitochondria have a complex, three-dimensional morphology, electron microscopy (EM) tomography is a crucial tool [11]. Scanning transmission electron microscopy (STEM) tomography offers the advantage of imaging thick sections (up to 1 µm in thickness), hence, the ideal technique for the investigation of mitochondrial ultrastructure [12, 13, 14].
A hallmark in the EM-based investigation of cellular energy metabolism was the discovery of amorphous calcium phosphate granules in smooth muscle cells by energy-dispersive X-ray (EDX) spectroscopy [15, 16]. The occurrence of calcium phosphate granules has been linked to cell stress due to high sodium (Na) and low potassium (K) concentrations in the cytoplasm of affected cells [15, 16] or mitochondrial damage due to type-1 interferonopathy [17]. The presence of amorphous calcium phosphate granules in natively frozen fibroblasts has been confirmed by a three-dimensional characterization with cryo-STEM tomography in connection with EDX spectroscopy [18]. The findings of Wolf et al. [18] set aside any concerns that calcium phosphate granules might have formed due to the EM sample preparation process since their protocol does not involve dehydration or heavy metal staining. However, the introduction of metabolic stress prior to freezing of samples has been discussed as a possible reason for the formation of calcium phosphate granules, especially in biopsies [16]. In conclusion, a complementary method should be employed to ensure the metabolic state of cells. FLIM of NADH is a suitable technique as cells are measured in the native state (in situ), and no disturbance of cellular ultrastructure due to fixation or staining is expected [14].
We employed a holistic characterization of cellular energy metabolism with FLIM and EM to investigate the impact of CoQ10 on mitochondrial function and calcium phosphate granule formation. To the best of our knowledge, no quantitative visualization of cellular energy metabolism together with mitochondrial ultrastructure analysis after CoQ10 supplementation has ever been performed in human dermal fibroblasts. Our findings provide new visual insights into the mode of action of CoQ10 in terms of cellular bioenergetics and antioxidant function.
Cell culture and CoQ10 incubation were performed as previously described [19]. Briefly, primary human dermal fibroblasts (HDF) obtained from ten different adult donors (n = 10) were purchased from Alphenyx (Marseille, France), TebuBio (Offenbach, Germany), and Tissue Solutions Ltd (Glasgow, United Kingdom). Isolated HDF were tested negative for mycoplasma and all cultured in a humified incubator at 37 °C and 5% CO2. Cells were seeded in 35 mm microscopy culture dishes (Greiner Bio-One GmbH, Frickenhausen, Germany) with 60,000 to 100,000 cells per dish. The cell culture medium consisted of DMEM 4.5 g/L D-glucose, 10% fetal bovine serum (FBS), 1% penicillin G (100 units/mL), 100 µg/mL streptomycin (P/S), and 1% 100X GlutaMAX™ (all cell culture reagents from Gibco™, Thermo Fisher Scientific, Waltham, MA, USA). CoQ10 (Kaneka Corporation, Takasago, Japan) was dissolved using a mixture of glycerol and the emulsifier PEG-40 hydrogenated castor oil (CoQ10:glycerol:PEG-40 = 0.4:0.6:1) according to Knott et al. [5]. The CoQ10 stock solution was added to DMEM medium 24 h after seeding and once the cells were ~70% confluent. The final CoQ10 concentration was 15 µg/mL. The cells were further incubated for 24 h, and then FLIM images were acquired. Untreated cells and cells treated with the respective solvent control were used as controls. Prior to FLIM measurement, the medium was replaced with Tyrode’s buffer consisting of 135 mM NaCl, 5 mM KCl, 1 mM MgCl2, 1.8 mM CaCl2, 20 mM 4-(2-hydroxyethyl)-1-piperazineethanesulfonic acid (HEPES), and 5 mM glucose (all chemicals from Sigma-Aldrich, St. Louis, MO, USA). The pH was kept at 7.4.
Following the experimental protocol by Kalinina et al. [20], FLIM
imaging was performed using a Zeiss LSM 710 NLO (non-linear-optic) laser scanning
microscope (Zeiss, Oberkochen, Germany) equipped with a femtosecond pulsed Mai
Tai AX HPDS titanium-sapphire laser (Spectra Physics, Santa Clara, CA, USA) with
a repetition rate of 80 MHz and a tuning range of 690 nm to 1040 nm. The
excitation wavelength for NADH FLIM was 740 nm. The laser pulse for two-photon
excitation was controlled by an electronic system, enabling
time-correlated-single-photon-counting (TCSPC). With this, signal detection was
accomplished through an HPM-100-40 hybrid detector system (Becker & Hickl GmbH,
Berlin, Germany) coupled to the non-descanned detection (NDD) port of the
microscope. FLIM images were acquired using the SPC64 software (Becker & Hickl
GmbH) with a resolution of 512
I(t) is the fluorescence intensity, a1 and a2 are the relative amplitudes,
The phasor plot was calculated with the SPCImage software (v8.1, Becker & Hickl GmbH). For the metabolic pattern segmentation, discrete lifetime ranges of 600–800 ps, 800–1000 ps, and 1000–1200 ps were selected.
Segmented images were generated with OriginPro, and pixel areas were quantified using FIJI (https://fiji.sc) [21]. The number of pixels in the discrete lifetime ranges was related to the total number of pixels within the whole lifetime range (area A). The mean area (Amean) was calculated as the mean of area A from six different images from the same donor. This procedure was completed using two individual donors.
Fibroblasts for EM imaging were prepared along with the FLIM samples.
Carbon-coated glow-discharged sapphire disks were placed in cell culture dishes
[22]. The seeding and treatment of the cells was conducted as described above.
After the addition of CoQ10, samples were high-pressure frozen using a
Wohlwend HPF Compact 01 high-pressure freezer (HPF) (Engineering Office M.
Wohlwend GmbH, Sennwald, Switzerland) following the protocol of Villinger et al. [22]. Samples were freeze substituted following the protocol of Walther
and Ziegler [23] with a substitution medium consisting of acetone (100%
analytically grade) with 0.2% osmium tetroxide (ChemPur, Karlsruhe, Germany),
0.1% uranyl acetate (Merck KGaA, Darmstadt, Germany) and 5% water, and
subsequently embedded in epoxy resin. Sectioning was performed using an Ultracut
(UCT) ultramicrotome (Leica Microsystems, Wetzlar, Germany) equipped with a
35° diamond knife and a trim diamond (https://www.diatomeknives.com).
For TEM imaging, 70 nm thick sections were mounted on copper slot grids. For STEM
tomography, sections of 700 to 900 nm were mounted on a glow-discharged copper
grid with parallel bars. A droplet of 10% (w/v) poly-L-lysine (Sigma Aldrich) in
water was added. The sections were then dried at 37 °C for 5 min. After
that, 15 µL of a colloidal gold solution (particle size: 15 nm,
https://aurion.nl) diluted 1:2 in water was applied to both sides of the sections. The
gold nanoparticles were later used as fiducial markers for tomogram
reconstruction. A 5 nm carbon coating was applied on both sides with a BAF 300
electron beam evaporation device (https://www.opticsbalzers.com). Samples were
imaged using a JEOL JEM 1400 transmission electron microscope (JEOL, Tokyo,
Japan) for an overview of the cellular ultrastructure and quantification
purposes. Tomogram acquisition was performed with a JEOL JEM-2100F scanning
transmission electron microscope (JEOL, Tokyo, Japan) at 200 kV acceleration
voltage using the EM-Tools-software (TVIPS, Tietz, Germany). A series of 97
bright-field images with 200,000
The statistical analysis of the data was performed using the software OriginPro (OriginLab Corporation, Northampton, MA, USA). For each condition, ten adult fibroblast donors (n = 10) were used to estimate the mean and median fluorescence lifetimes. For each donor, 12 NADH fluorescence lifetime images were analyzed. The Shapiro–Wilk test was used to evaluate whether the data sets were normally distributed. The one-way analysis of variance (ANOVA) test was used to test the significance of the population means between a pair of test conditions. In addition, a nonparametric Wilcoxon signed rank test determined the significance of the population medians. All hypothesis tests were performed using a significance level of 5% (p = 0.05).
It is well known that CoQ10 is a crucial component of the mitochondrial
respiratory chain. In order to characterize the metabolic state under the
influence of CoQ10, the mean fluorescence lifetime (
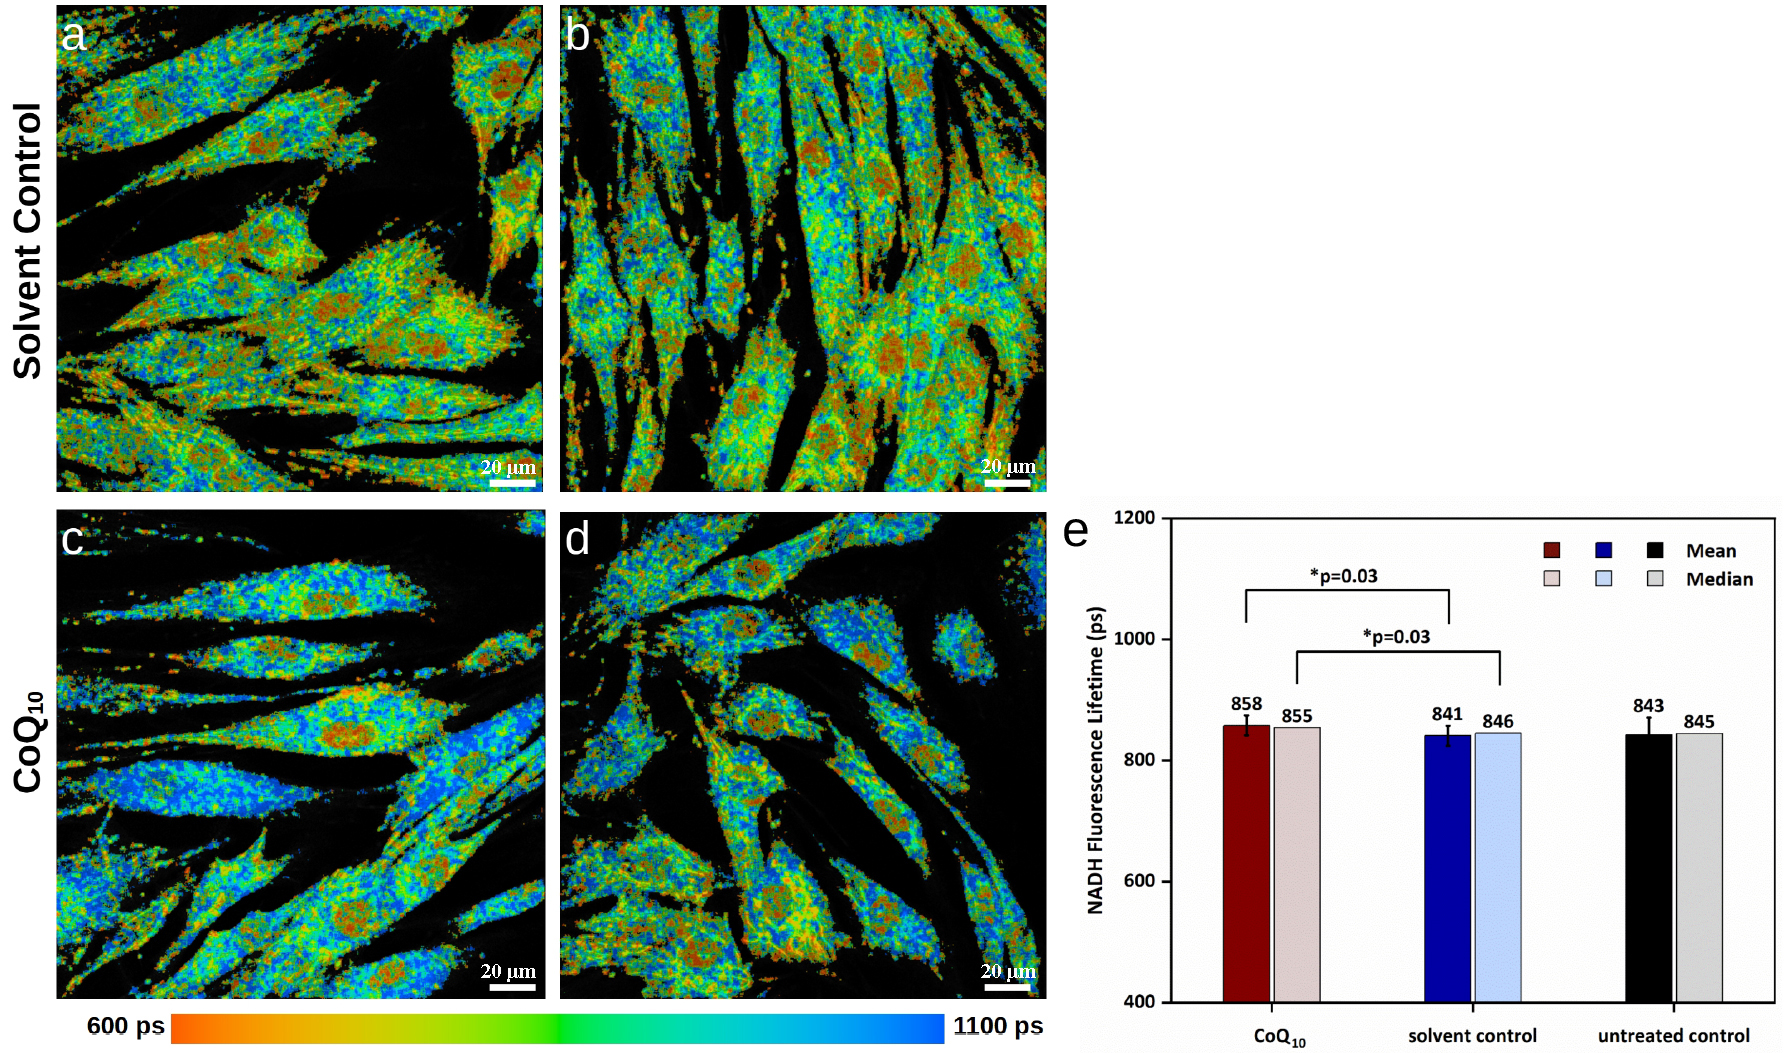 Fig. 1.
NADH FLIM images of primary fibroblasts in false colors (representing lifetimes from 600 ps in orange to 1100 ps in blue) from one representative donor. (a,b) solvent control cells. (c,d) cells treated with 15 µg/mL coenzyme Q10 (CoQ10) for 24 h. Blue signals corresponding to longer nicotinamide adenine dinucleotide (NADH) lifetimes are found more in (c) and (d) than in (a) and (b), which indicates a stimulation of cellular energy metabolism. The scale bars represent 20 µm. (e) Mean and median NADH fluorescence lifetimes of CoQ10-treated human dermal fibroblasts (HDF) vs. solvent control and untreated control based on the NADH fluorescence lifetime imaging microscopy (FLIM) images of fibroblasts of n = 10 different donors. The mean and median NADH fluorescence lifetimes of CoQ10 and solvent control are significantly different, with a p-value of 0.03. *, significant differences are marked with an asterisk.
Phasor-based image segmentation of cells from two donors was performed to identify metabolically active intracellular areas. For each of the two donors, six images were segmented with three discrete lifetime ranges (600–800 ps, 800–1000 ps, 1000–1200 ps), and the area A covered by the signals in the respective lifetime range was quantified for each individual image (Fig. 2), and the mean area Amean was calculated for all images. Signals from the lifetime range of 600–800 ps were found in large areas of the cells, covering the nuclei and cytoplasm (Fig. 2). Amean occupied by signals from the short lifetime range of 600–800 ps was smaller in CoQ10-treated cells than solvent control cells (Amean = 30% for the 1000–1200 ps range vs. Amean = 21% for the 600–800 ps range in one donor and Amean = 35% for the 1000–1200 ps range vs. Amean = 29% for the 600–800 ps range for the second donor), sometimes leaving empty spaces in the cytoplasm around a clearly distinguishable nucleus (Fig. 2). In one of the donors, signals from the longer lifetime range of 1000–1200 ps clearly occupied a larger area in CoQ10-treated cells (Amean = 9% vs. Amean = 17%), whereas the second donor only showed a trend in this direction. The phasor-based segmentation highlights more intracellular areas with long NADH lifetimes (1000–1200 ps) after CoQ10 treatment, indicating stimulated mitochondria.
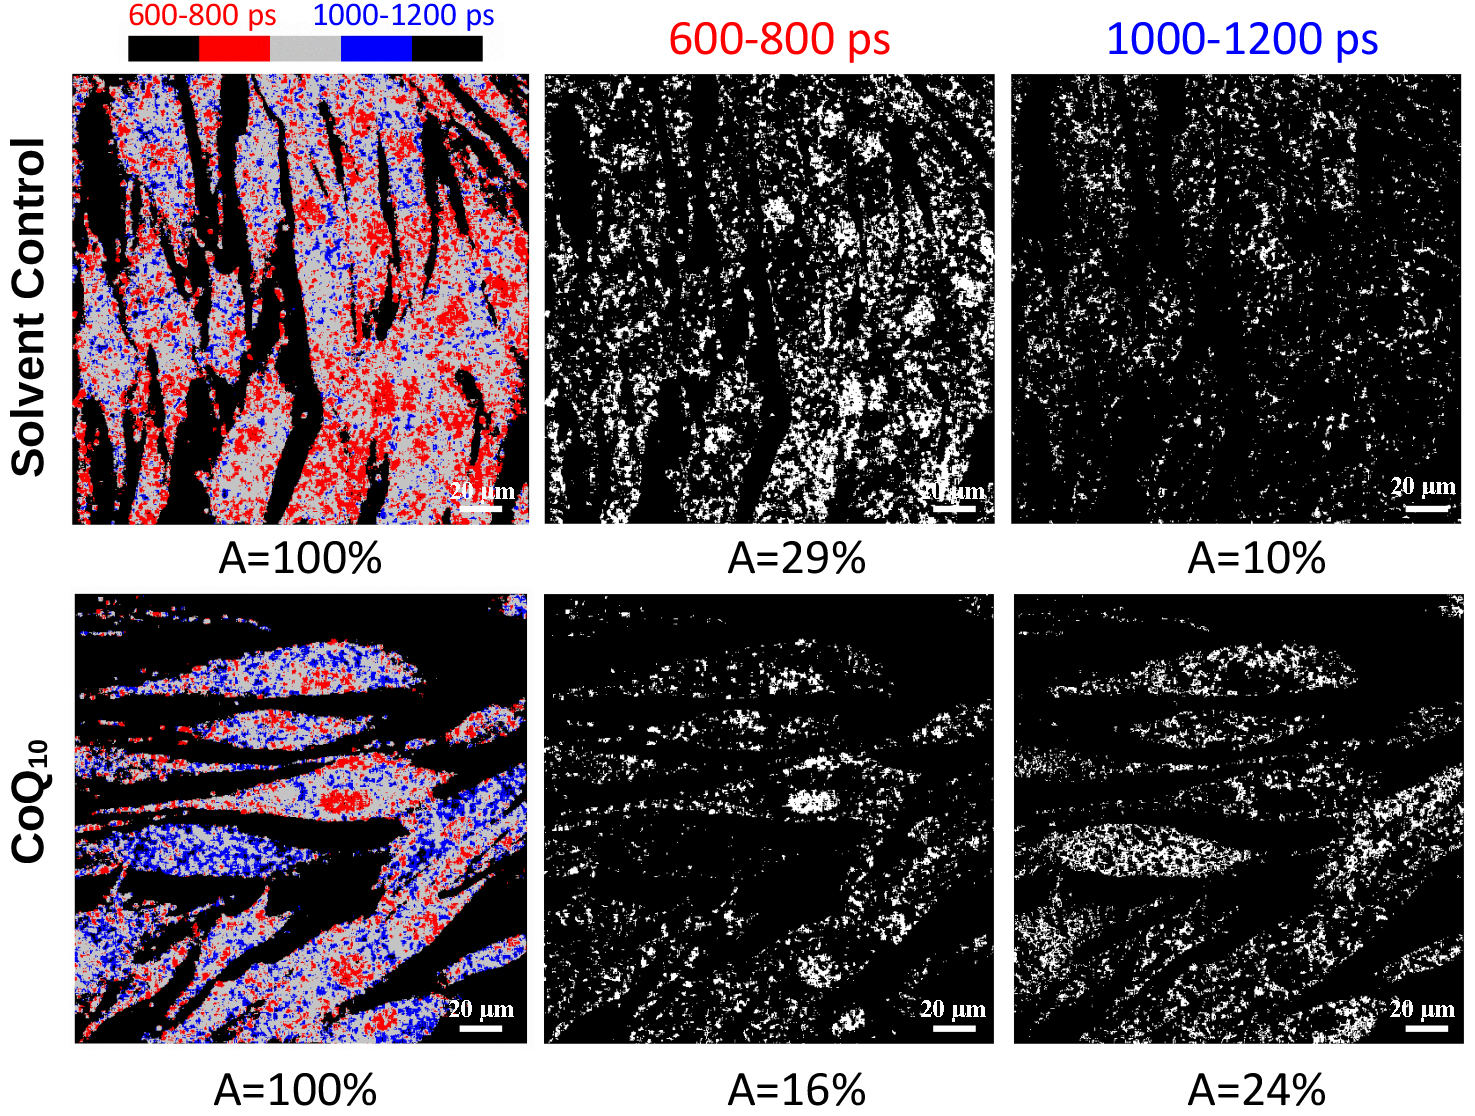 Fig. 2.
Example of the calculation of metabolically active areas (A) for one image of one donor. Phasor-based metabolic pattern segmentation of solvent control cells and 15 µg/mL CoQ10- treated cells from one representative donor after 24 h. False colors represent lifetimes from 600–800 ps in red and 1000–1200 ps in blue. A indicates the area covered by the signal in the respective lifetime range. The signal from the short lifetime range is absent from the cytoplasm of some CoQ10-treated cells, and more signal from the long lifetime range is present in the cytoplasm, possibly representing activated mitochondria. The scale bars represent 20 µm.
The mitochondrial ultrastructure was investigated with transmission electron microscopy (TEM) and scanning transmission electron microscopy (STEM) tomography. TEM analyses of fibroblasts from two donors were performed, and for each condition, 12 cells were analyzed. The TEM images of solvent control cells showed dark, dense granules within some mitochondria (Fig. 3a,b). In general, mitochondria were darkly stained and found near the sites of the endoplasmic reticulum (dark arrowheads in Fig. 3a). A descriptive quantification showed that the granules were highly abundant in the solvent control cells. In one donor, the dark granules were found only in two untreated control cells (16.6% of a total of 12 cells). In the cells treated with the solvent control, the granules appeared in three cells (25%). Upon CoQ10 stimulation, the granules were found only in one cell (8.3%), and the majority of mitochondria exhibited well-defined and parallel cristae (Fig. 3c). For this donor, the number of mitochondrial granules decreased along with an increase in the NADH lifetime upon CoQ10 stimulation. The increase is visible in the rendered FLIM image (Fig. 1c,d), where the fibroblasts appeared predominantly blue, corresponding to longer NADH lifetimes. The findings obtained for the donor shown in Fig. 3 were confirmed by the TEM images and quantification for a second donor, where the granules were found in 0 untreated cells, five cells treated with the solvent control, and one cell treated with CoQ10.
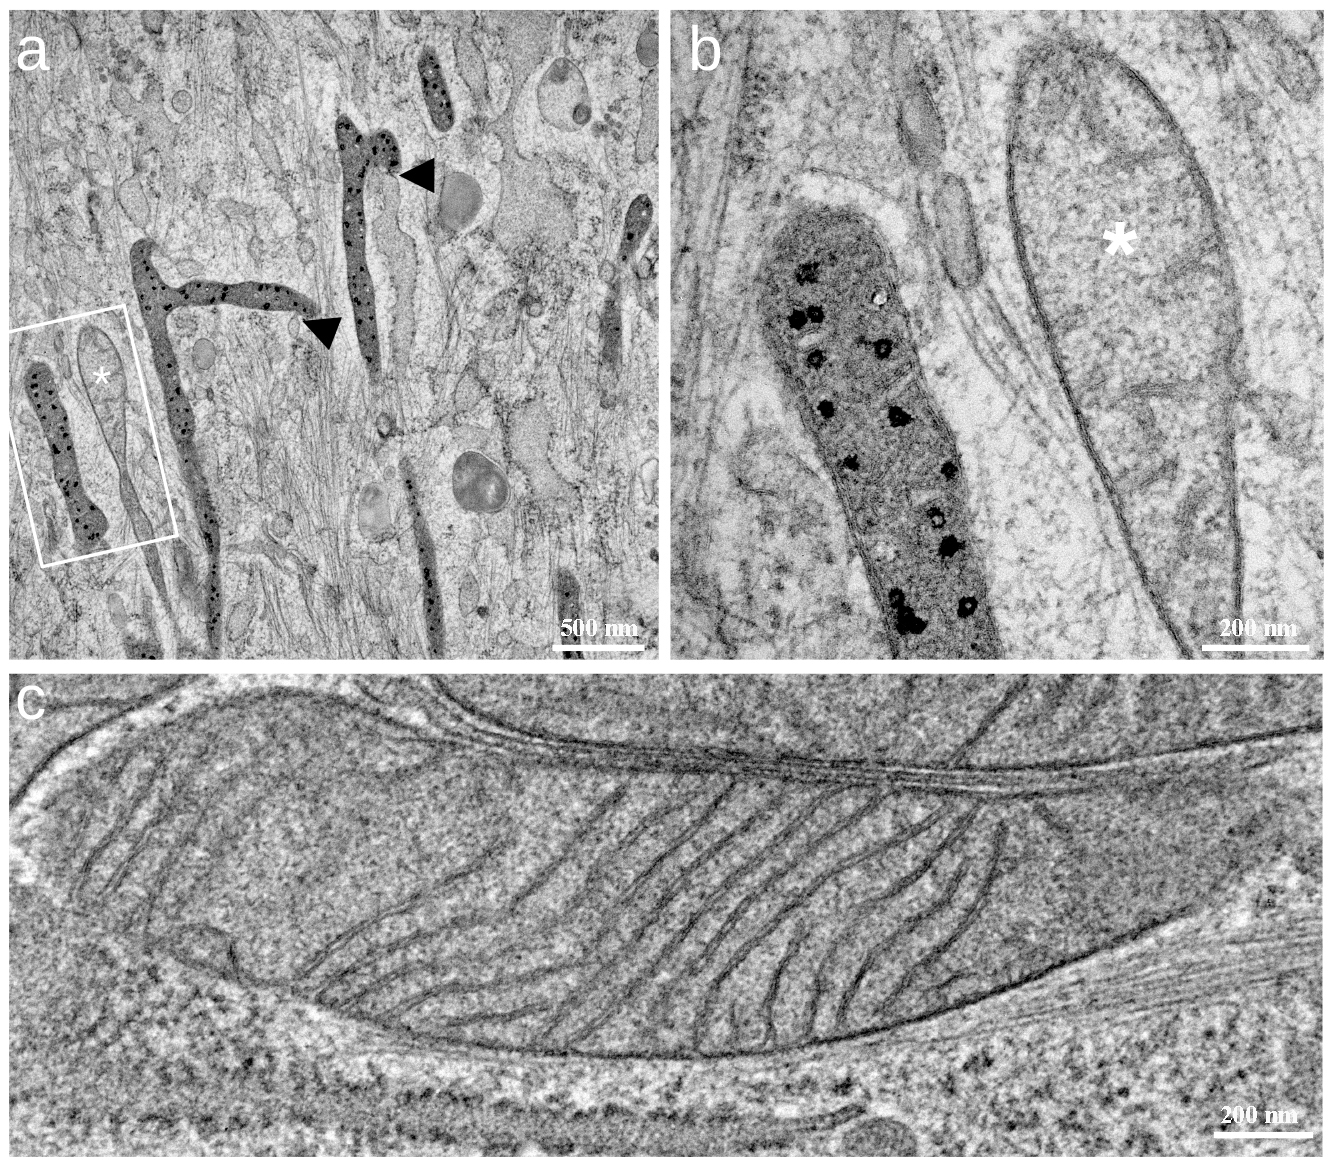 Fig. 3.
TEM images of primary fibroblasts from one representative donor. (a) Transmission electron microscopy (TEM) image showing several mitochondria from a solvent control cell. Numerous black granules appear in some mitochondria, while others (marked with a white star in (a) and (b)) appear with no granules but stain brighter. Endoplasmic reticulum (ER)-contact sites of mitochondria with black granules (black arrows) are often encountered. (b) Higher magnification image of two mitochondria marked with the white rectangle in (a). (c) Mitochondrion from a CoQ10-treated cell (15 µg/mL CoQ10 for 24 h). Cristae are regularly arranged, and no granules are visible. The scale bars represent 500 nm in (a) and 200 nm in (b,c).
From virtual sections obtained from a STEM tomogram (Fig. 4) of a solvent control cell, the dark granules were well visible, similar to the TEM images. Manual segmentation of the tomogram showed that the granules were present over the entire volume of the mitochondria (Fig. 4a,b; Video S1). As visible from the segmentation and virtual sections, the contact sites of the endoplasmic reticulum (ER) (segmented in green) with mitochondria were present and spanned over large areas near the mitochondrial surface. In CoQ10-treated cells, the mitochondria appeared vastly connected, as shown in the rendered segmentation of a STEM tomogram (Fig. 4c; mitochondria segmented in blue). Mitochondria exhibited well-pronounced cristae on virtual sections (Fig. 4d) and well-visible contact sites with the endoplasmic reticulum (green in Fig. 4c).
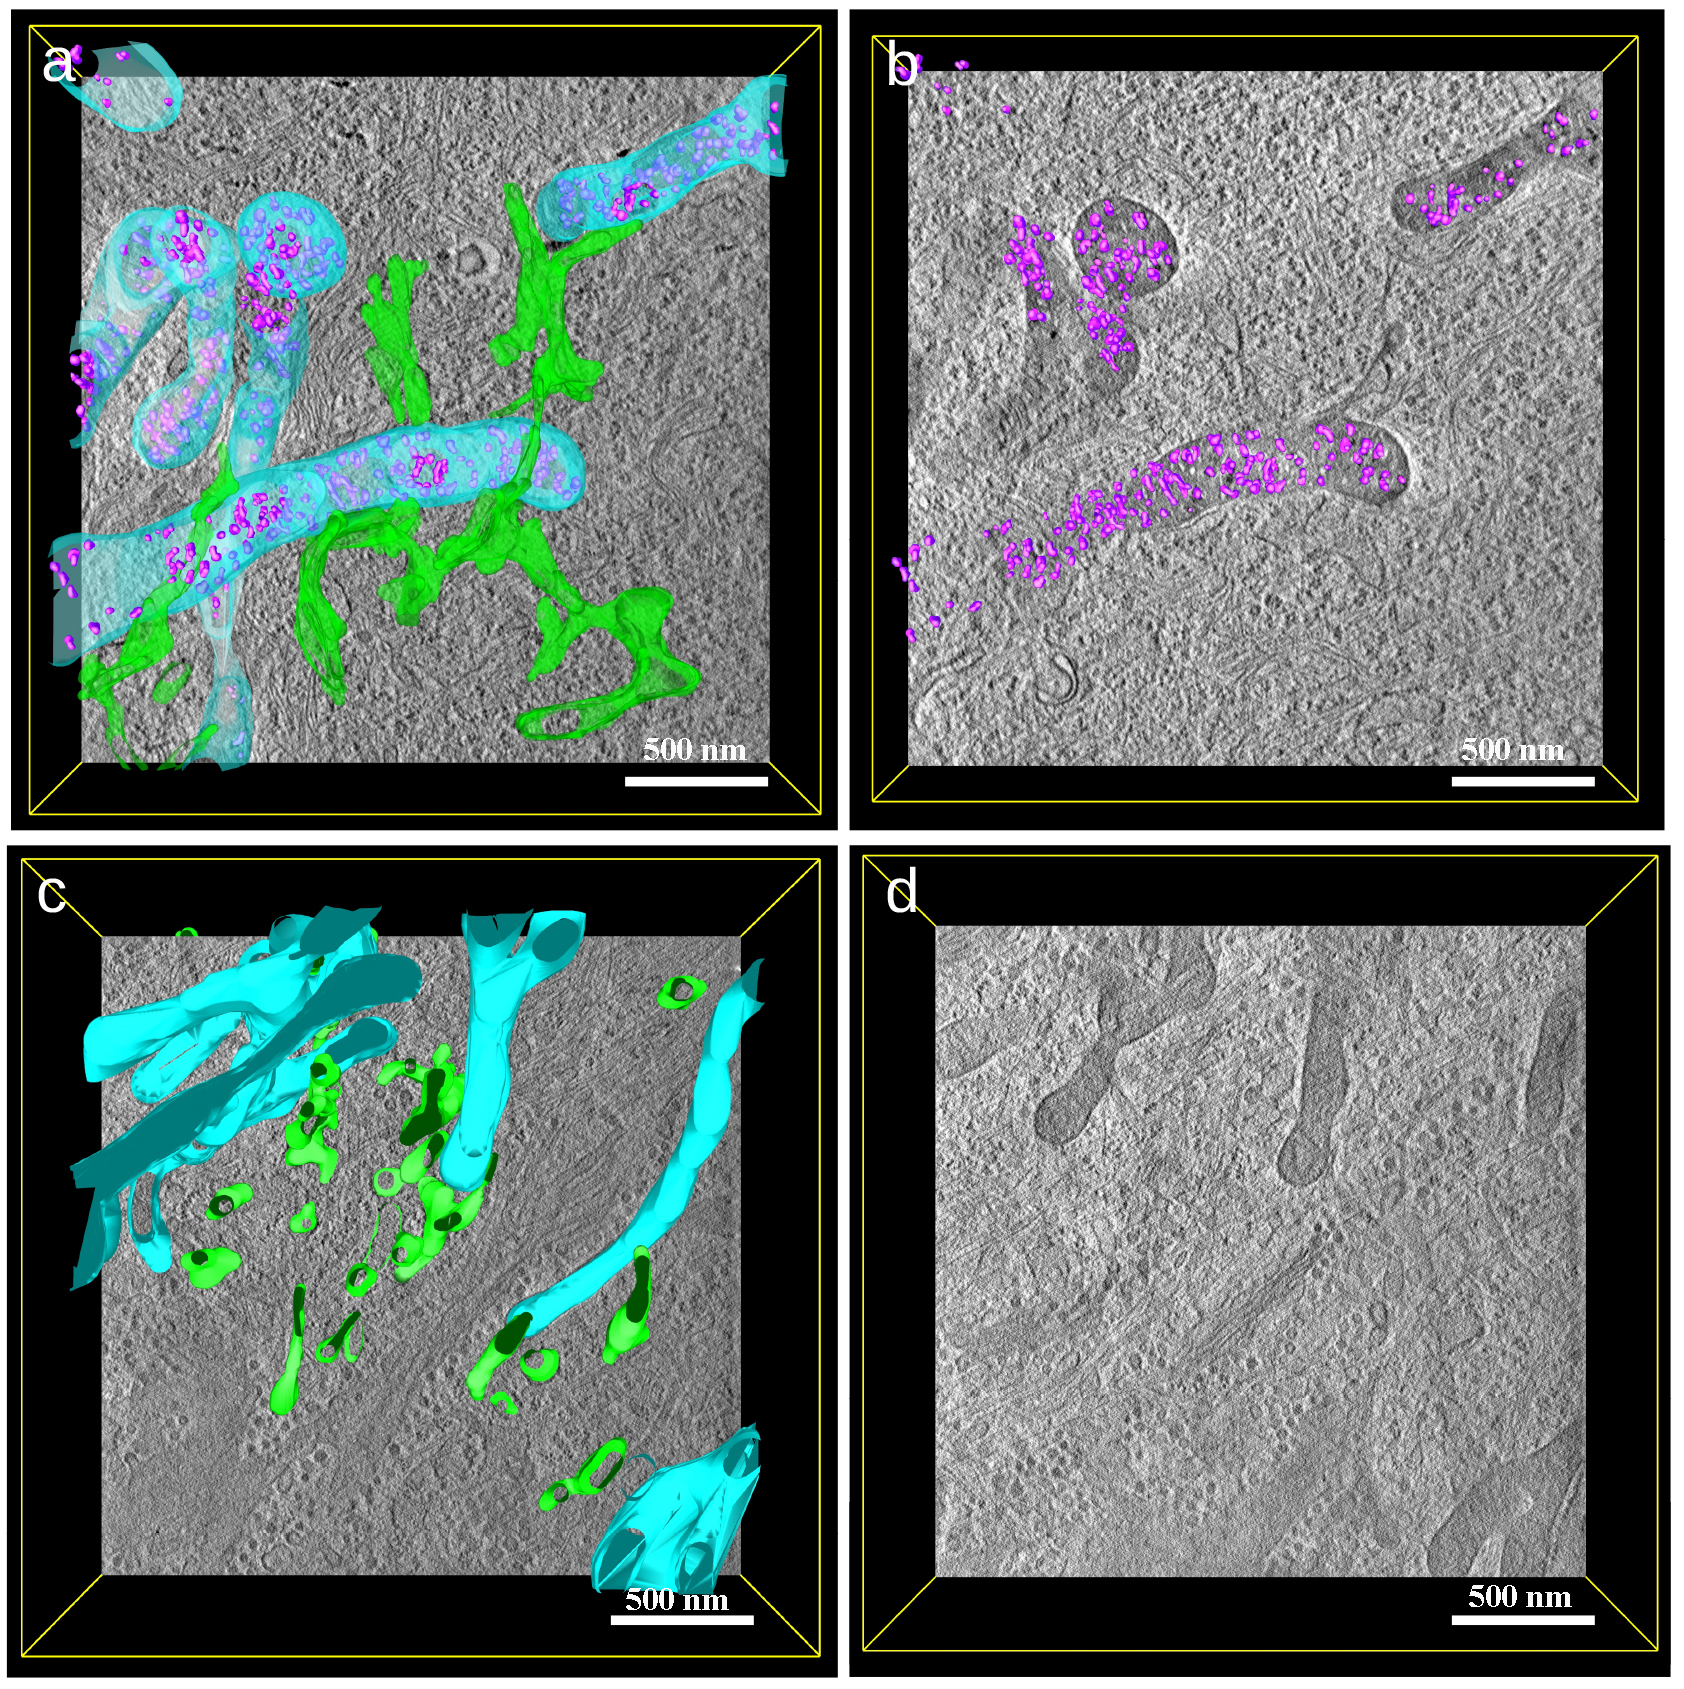 Fig. 4.
STEM tomogram of a solvent control cell (a,b) and a CoQ10- treated cell (15 µg/mL CoQ10 for 24 h) (c,d). (a) Segmented scanning transmission electron microscopy (STEM) tomogram showing the stress granules also found in TEM images (compare Fig. 3). Stress granules are segmented in violet, mitochondria in blue and endoplasmic reticulum in green. (b) 3D segmentation of only stress granules (in violet), showing a homogenous distribution in the mitochondria. (c) Segmentation of the mitochondria (light blue) without stress granules and endoplasmic reticulum (green) in a CoQ10-treated cell. (d) Virtual section of a tomogram of a CoQ10- treated cell showing healthy mitochondria (compare Fig. 3c). The scalebar represents 500 nm in (a–d).
In summary, complementary examination of mitochondrial ultrastructure in control cells revealed multiple stress granules, whereas mitochondria from CoQ10-treated cells showed predominantly well-defined and parallel cristae with minimal stress granules.
CoQ10 is an important cofactor endowed with bioenergetic and antioxidant properties. This lipophilic coenzyme is ubiquitously present in all human cells in biological membranes such as the mitochondrial or cellular plasma membranes [3]. In vitro experiments revealed that CoQ10 supplementation (15 µg/mL) in human dermal fibroblasts (HDF) resulted in elevated CoQ10 levels in the cell, in particular in the mitochondria [19]. Augmented mitochondrial CoQ10 stimulates cellular energy metabolism, whereas cellular CoQ10 deprivation decreases OXPHOS and has been quantified in the past, e.g., via measurement of oxygen consumption rate and ATP synthesis [26, 27]. Using FLIM together with the segmentation via the Phasor method and TEM analysis for the first time allows simultaneous visualization and quantification of the energizing effect of CoQ10 in HDF. In FLIM, fibroblasts treated with CoQ10 showed an increased fluorescence lifetime of NADH. This corresponds to a larger fraction of bound NADH than free NADH and envisions that CoQ10 stimulates oxidative phosphorylation and, thus, ATP production. This is in line with CoQ10’s known role as an electron carrier between complexes I and III and hints at the possibility that the electron transfer by CoQ10 might be a rate-limiting step in OXPHOS. In this model, the addition of CoQ10 results in an increased electron transfer rate between complex I and III, augmenting complex I to provide more electrons through increased binding of NADH. From phasor-based metabolic pattern segmentation (Fig. 2), it can be speculated that CoQ10 not only shifts energy metabolism towards OXPHOS but also increases the amount of highly activated mitochondria, as distinct regions showing longer lifetimes could be identified. In addition to a longer NADH lifetime, fewer HDF-bearing calcium phosphate granules were found in CoQ10-treated samples. The formation of calcium phosphate granules has been associated with metabolic stress, resulting from a phosphate surplus due to impaired ATP synthesis that precipitates in combination with calcium inside the mitochondria [15, 16]. Two subpopulations of mitochondria, one bearing granules and one lacking granules, have been reported earlier and relate to the possibility that ion uptake might be impaired in mitochondria not bearing granules [15]. Once formed, calcium phosphate granules have been discussed to disrupt the complexes of the mitochondrial respiratory chain, leading to further metabolic stress [28]. The occurrence of calcium phosphate granules in HDF treated with the solvent control hints at a minor detrimental effect of the solvent. The reduced abundance of calcium phosphate granules upon CoQ10 treatment indicates that CoQ10 can compensate for metabolic stress and, together with the longer NADH lifetime, presents further evidence of the oxidative phosphorylation stimulating effect of CoQ10. Its antioxidant function may also contribute to the compensation of metabolic stress.
The combination of FLIM and EM enables new insights into the mode of action of CoQ10 and its role as a cellular energizer.
Our data indicate that:
(1) Treatment with CoQ10 increases the NADH lifetime, corresponding to stimulation of oxidative phosphorylation.
(2) Phasor-based metabolic pattern segmentation reveals areas with high NADH lifetimes in CoQ10-treated cells, indicating stimulated mitochondria.
(3) Treatment with CoQ10 decreases mitochondrial calcium phosphate granules, further underlining its cellular energizing effect and antioxidant properties.
With this quantitative visualization of cellular energy metabolism together with mitochondrial ultrastructure analysis after CoQ10 supplementation, our approach provides the intriguing possibility to investigate in much more detail the mode of action of CoQ10 on a subcellular scale in terms of cellular bioenergetics in the future. Further analysis with, for example, in vitro aged or stressed fibroblasts and in vivo FLIM may give further insights into CoQ10’s role in skin aging and inflammation and would allow us to monitor the beneficial effects of topical or oral CoQ10 supplementation.
All raw data, including FLIM images, TEM images and reconstructed tomograms can be made available upon reasonable request to the corresponding author.
JMW, TB, and AR designed the research study. JGW, NN and DdS performed the research. KR and SK provided help with cell culture and experimental ressources. PW and AR supervised the experiments. JGW, NN, PW, and DdS analyzed the data. JGW wrote the original draft. All authors reviewed and edited the manuscript and contributed to editorial changes. All authors read and approved the final manuscript. All authors have participated sufficiently in the work and agreed to be accountable for all aspects of the work.
Not applicable.
The authors want to thank Renate Kunz, Jana Apolloni, and Reinhard Weih of the Central Facility Electron Microscopy for excellent technical assistance in sample preparation and device maintenance. We thank Clarissa Read of the Central Facility Electron Microscopy for providing support for the EM experiments. Furthermore, we want to acknowledge David Mastronarde and his team for the development and support of the IMOD software package and the IMOD mailing list. We would like to thank the Core Facility Confocal and Multiphoton Microscopy of the Medical Faculty at Ulm University for providing support and instrumentation. The authors wish to express their thanks to Juliane Lüttke for her valuable support in the statistical analysis.
This study was part of a cooperation project and funded by Beiersdorf AG.
The authors declare no conflict of interest. This study was part of a cooperation project and funded by Beiersdorf AG. Julia M. Weise, Thomas Blatt, and Sebastian Kordes are employees of Beiersdorf AG, and the judgments in data interpretation and writing were not influenced by this relationship.
Supplementary material associated with this article can be found, in the online version, at https://doi.org/10.31083/j.fbl2911383.
References
Publisher’s Note: IMR Press stays neutral with regard to jurisdictional claims in published maps and institutional affiliations.