
 , Zhao-Hui Liang 1, Li-Yan Guo 1, Miao-Miao Liu 1,*
1 School of Public Health, Jining Medical University, 272013 Jining, Shandong, China
Abstract
Dementia is a major global health challenge, with Alzheimer’s disease (AD) being the most common cause.In China, due to its large and aging population, AD poses a significant threat. Although systematic reviews on the prevalence of dementia in the Chinese population exist, relatively few have specifically targeted AD. This study aimed to analyze the prevalence of AD among the population aged 60 years and older in China from 2014 to 2024.
A literature search on the prevalence of AD in China was conducted. A meta-analysis was performed using Stata version 16.0. The I2 was used to assess heterogeneity. The random-effects model was used to calculate the pooled effect size. Subgroup analyses were conducted based on different characteristics. Meta-regression was used to explore the sources of heterogeneity and identify the factors that significantly affect the effect size. Funnel plots and Egger’s test were utilized to evaluate publication bias.
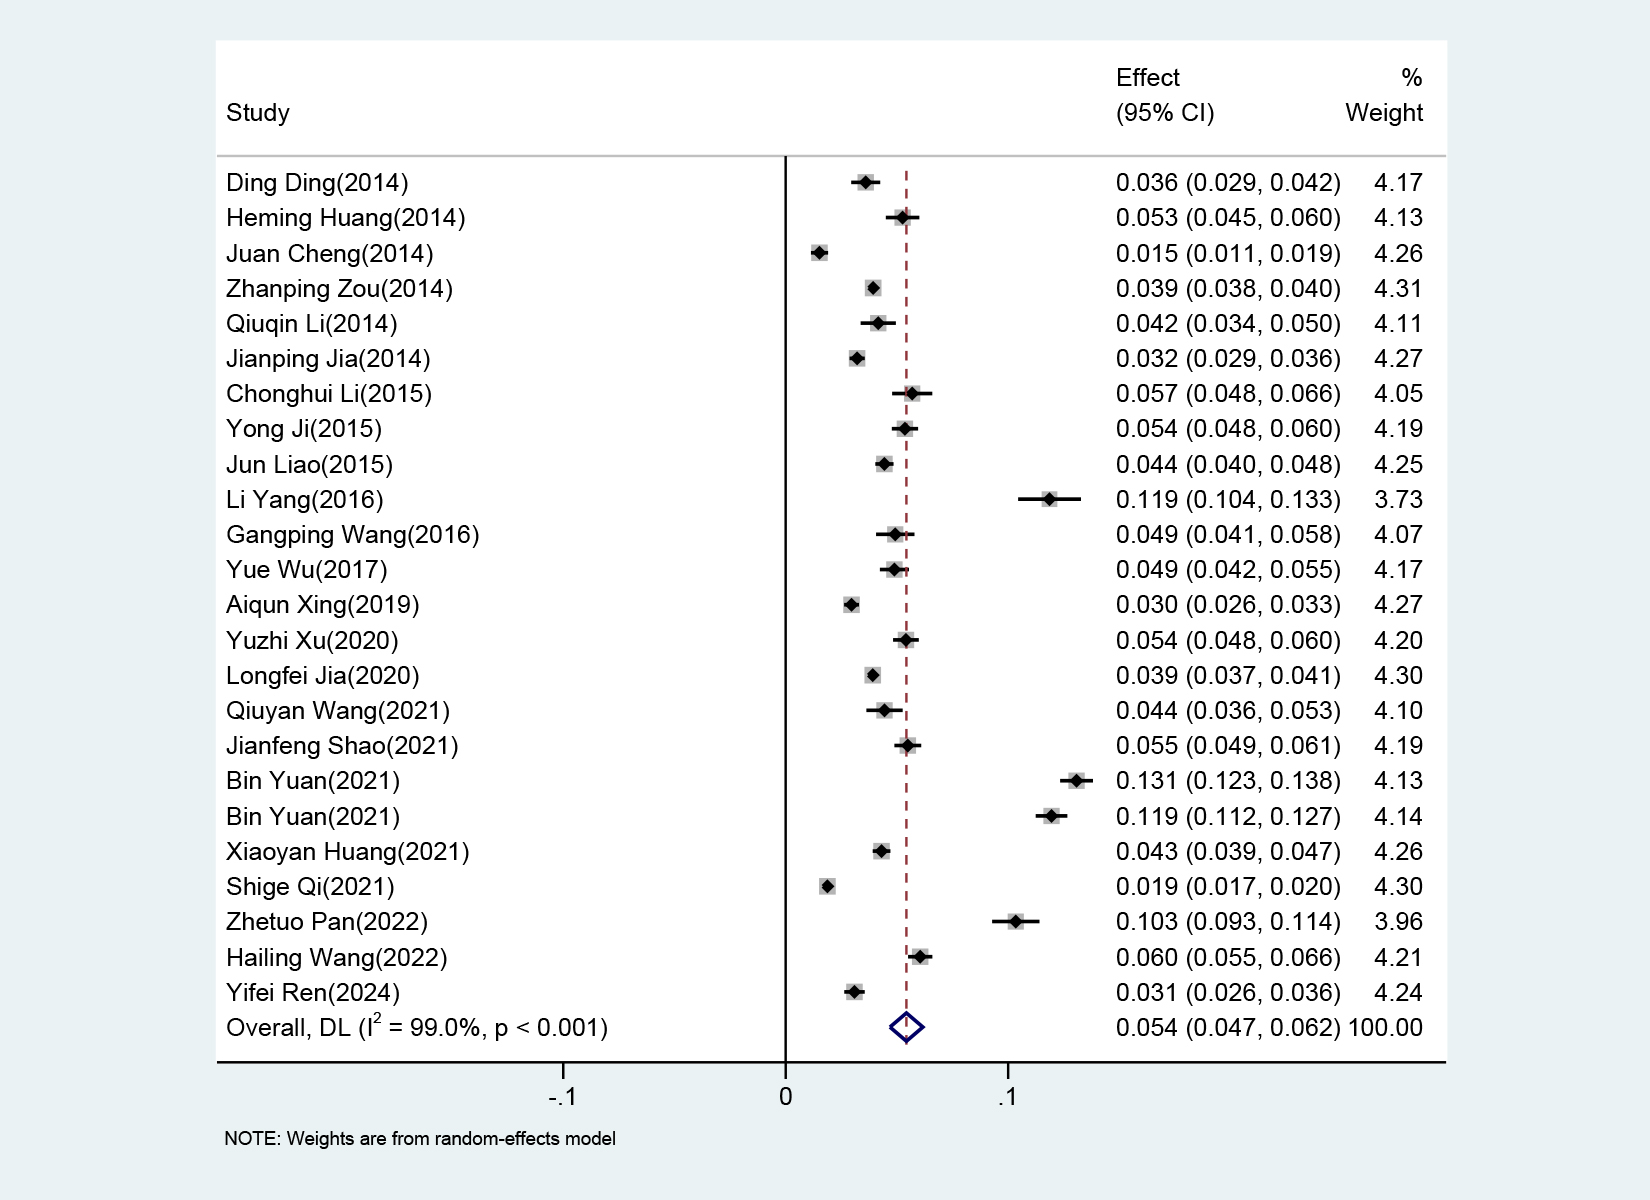
A total of 23 studies were included, with a total sample size of 307,415, including 13,662 patients with AD. The results of the meta-analysis showed that the prevalence of AD among the elderly Chinese population was 5.4% (95% CI: 4.7%–6.2%). The results of the meta-regression indicated that factors such as female sex, advanced age, low educational level, rural residence, and geographical region are the main factors influencing the prevalence of AD.
In the past decade, the prevalence of AD among people over 60 years of age in China was approximately 5.4%, which is a major public health problem for China.
Keywords
- Alzheimer disease
- prevalence
- systematic review
- meta-analysis
- China
Alzheimer disease (AD) is a progressive neurodegenerative disorder characterized by gradual loss of memory, cognitive abilities, and behavioral functions. It is the most common form of dementia, affecting millions of people worldwide and causing significant impairment in daily life activities [1, 2]. AD is a devastating condition that significantly affects the social, occupational, and daily lives of elderly individuals, imposing a heavy burden on their families and on society. With the increasing aging population worldwide, it has become a major public health concern. The China Alzheimer Disease Report 2021 showed that the standardized prevalence of AD and other dementias in China was 788.3 per 100,000 in 2019, which was higher than the global standardized prevalence of AD and other dementias of 682.5 per 100,000 [3]. In recent years, the process of global aging has accelerated, and the aging of China’s population has reached a relatively high rate, showing a trend of accelerated development. With an increase in aging, the number of elderly people with cognitive impairment is also increasing rapidly. Research indicates that by the middle of the 21st century, the elderly population in China will increase to 400 million, and the number of patients with dementia will reach 20 million [4]. Numerous systematic reviews have analyzed the prevalence of dementia among the elderly population in China. However, current information regarding the prevalence of AD is mostly fragmented and regional.
Therefore, this study systematically reviewed the studies on the prevalence of AD among the elderly in China published in the past decade, to analyze the development trend of AD prevalence, to provide data support for formulating public health service policies for the elderly, and carrying out public health service work in the future.
This systematic review was conducted in accordance with the Preferred Reporting Items for Systematic reviews and Meta-Analyses (PRISMA) 2020 guidelines [5]. The PRISMA checklist is available in the Supplementary materials. The protocol of this review had been registered in PROSPERO (CRD42024629531). From January to June 2024, a systematic search was conducted on the literature regarding the prevalence of AD in the elderly in China, published from January 1, 2014, to June 30, 2024, in CNKI, Wan Fang Database, VIP Database, PubMed, and Web of Science. The search terms included “Alzheimer Disease”, “Dementia”, “epidemiology study”, “prevalence”, “China”, and “Chinese”. Additionally, literature tracing was used to further search for relevant data.
Inclusion criteria: (1) The subjects in the studies are
elderly individuals aged
Exclusion criteria: (1) Duplicate publication or incomplete information; (2) non-Chinese region studies; (3) Published before 2014; (4) The research objects were non-community elderly, veteran cadres, and elderly people in welfare institutions; (5) Review or non-cross-sectional survey.
Two researchers independently screened the articles by reading the titles and abstracts and then conducted a secondary screening by reading the full texts. Unqualified studies were excluded based on inclusion and exclusion criteria. In case of controversial studies, the research team discussed and decided whether to include them. Microsoft Excel 2016 (version 16.0, Microsoft Corporation, Redmond, WA, USA) was used to establish an information extraction database, and the following contents were extracted from the literature: first author, publication year, study region, diagnostic criteria, subject age, sex, urban-rural status, education level, sampling method, sample size, number of cases, and prevalence of AD.
The Agency for Healthcare Research and Quality (AHRQ) scale was used to evaluate
the quality of the included studies (11 items) [6, 7]. Each item was scored as 0
points for ‘NO’ or ‘UNCLEAR’ and 1 point for ‘YES’. A total score of
Meta-analysis was performed using Stata software (version 16.0, Stata Corp LLC,
College Station, TX, USA). Heterogeneity was evaluated using an inconsistency
index (I2). In cases where I2
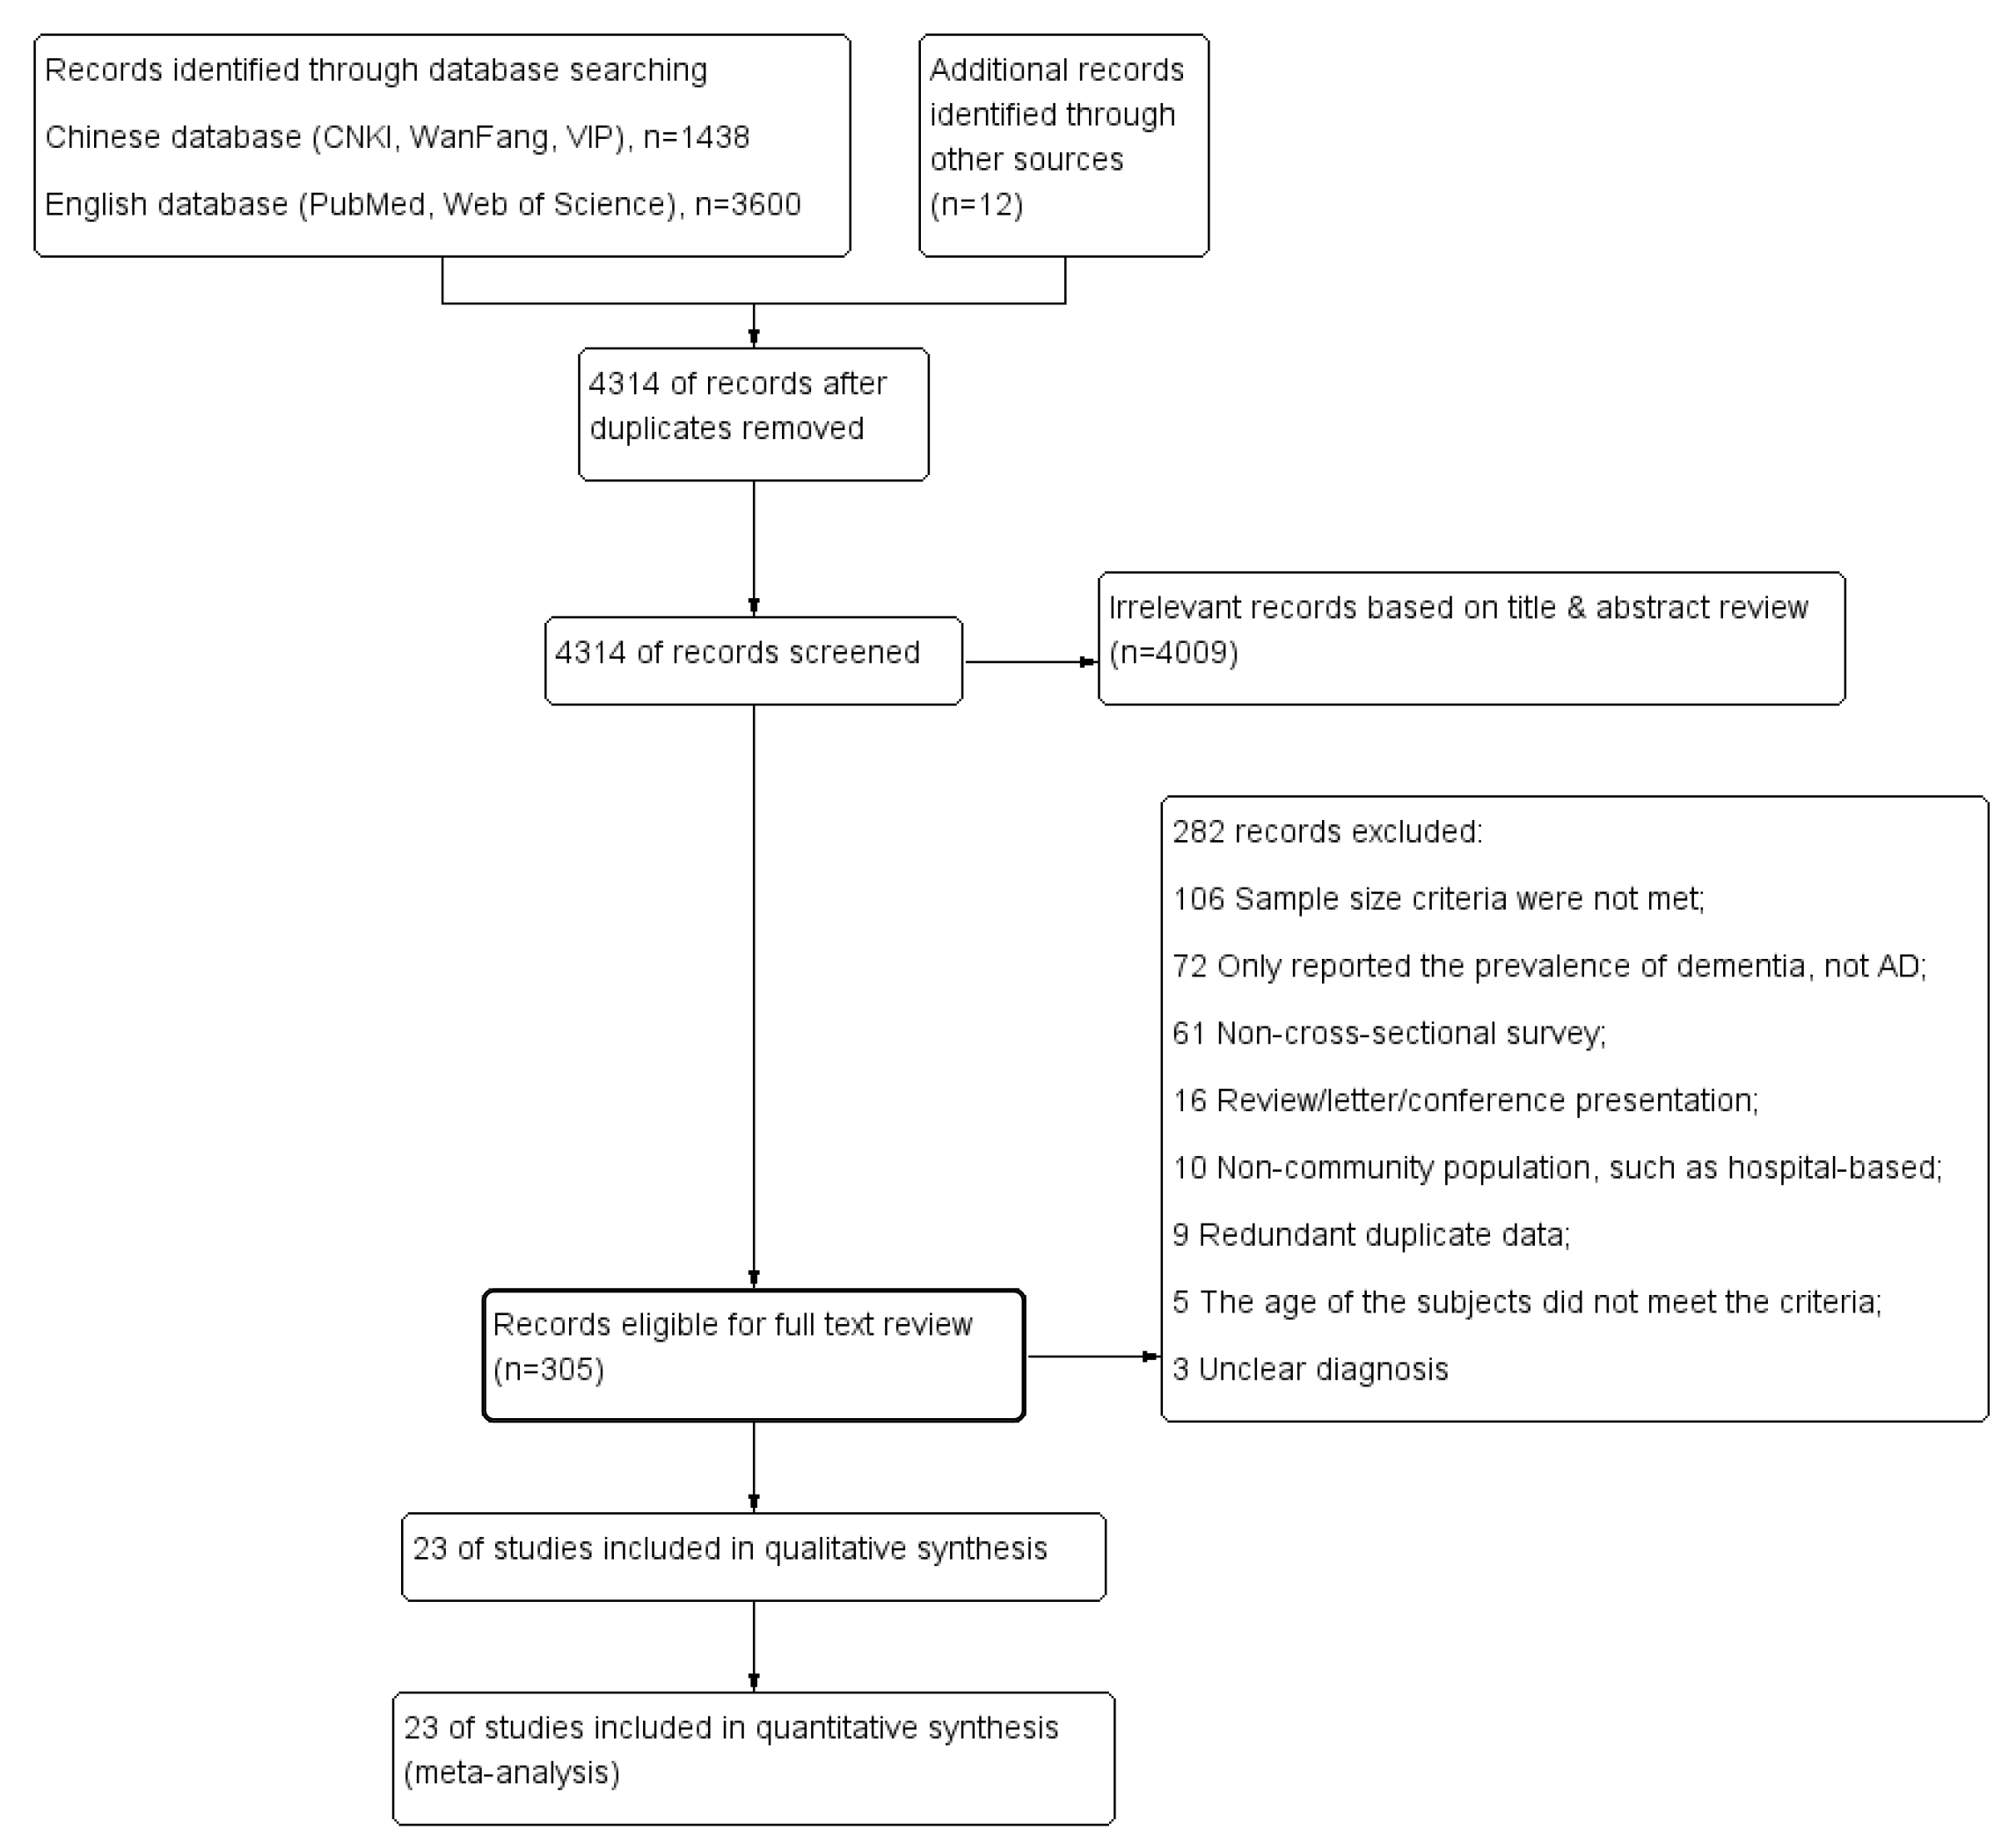
A total of 5050 studies were initially retrieved. According to the inclusion and exclusion criteria, 23 articles (16 in Chinese and 7 in English) were ultimately included in the detailed analysis. The literature retrieval process is illustrated in Fig. 1. Across these 23 articles, the combined sample size totaled 307,415 individuals, with 13,662 cases of AD being specifically reported. The quality scores of these articles ranged from 4 to 8, and general information of the included articles is presented in Table 1 (Ref. [9, 10, 11, 12, 13, 14, 15, 16, 17, 18, 19, 20, 21, 22, 23, 24, 25, 26, 27, 28, 29, 30, 31]).
 Fig. 1.
Flowchart of the literature selection process. AD, Alzheimer disease.
| First author & published year | Region | Diagnostic criteria | Sampling method | Age | No. of subjects | No. of case | AHRQ score |
| Ding Ding (2014) [10] | Shanghai | NINCDS-ADRDA | census | 3141 | 113 | 6 | |
| Heming Huang (2014) [11] | Shenzhen | NINCDS-ADRDA | cluster randomized sampling | 3368 | 177 | 7 | |
| Juan Cheng (2014) [9] | Peking | DSM-IV | multistage stratified random cluster sampling | 3885 | 59 | 7 | |
| Zhanping Zou (2014) [12] | Zhejiang | MMSE/ICD-10 | stratified cluster sampling | 121,949 | 4795 | 7 | |
| Qiuqin Li (2014) [13] | Zhejiang | MMSE/CCMD-2-R | randomized sampling | 2451 | 102 | 4 | |
| Jianping Jia (2014) [14] | Changchun, Peking, Zhengzhou, Guiyang, Guangzhou | MMSE | multistage cluster sampling | 10,276 | 330 | 6 | |
| Chonghui Li (2015) [15] | Tianjin | DSM-IV/NINCDS-ADRDA/NINDS-AIREN | cluster randomized sampling | 2532 | 144 | 6 | |
| Yong Ji (2015) [16] | Tianjin | NINCDS-ADRDA | no mentioned | 5578 | 299 | 6 | |
| Jun Liao (2015) [17] | Jiangxi | MMSE/NINCDS-ADRDA | census | 9733 | 432 | 4 | |
| Li Yang (2016) [18] | Zhejiang | MMSE/NIA-AA | multistage stratified random cluster sampling | 2015 | 239 | 6 | |
| Gangping Wang (2016) [19] | Gansu | DSM-IV | multistage stratified random cluster sampling | 2416 | 119 | 6 | |
| Yue Wu (2017) [20] | Jiangsu | NINCDS-ADRDA | stratified cluster random sampling | 4195 | 205 | 7 | |
| Aiqun Xing (2019) [21] | Hainan | DSM-IV-TR | multistage cluster sampling | 10,000 | 296 | 6 | |
| Yuzhi Xu (2020) [22] | Peking | MMSE/CCMD-3 | convenient sampling | 5901 | 319 | 5 | |
| Longfei Jia (2020) [23] | 12 provinces | NIA-AA | multistage stratified cluster-sampling | 46,011 | 1801 | 8 | |
| Qiuyan Wang (2021) [24] | Zhejiang | NINCDS-ADRDA | cluster randomized sampling | 2454 | 109 | 6 | |
| Jianfeng Shao (2021) [25] | Zhejiang | MMSE/ICD-10 | stratified cluster random sampling | 5483 | 301 | 6 | |
| Bin Yuan (2021) [26] | Tibet Autonomous Region | NIA-AA | stratified cluster random sampling | 8000 | 1046 | 6 | |
| Bin Yuan (2021) [26] | Shandong | NIA-AA | stratified cluster random sampling | 8000 | 956 | 6 | |
| Xiaoyan Huang (2021) [27] | Zhejiang | DSMIV-TR | multistage cluster sampling | 10,000 | 431 | 5 | |
| Shige Qi (2021) [28] | Peking, Shanghai, Hubei, Sichuan, Guangxi, Yunnan | MMSE/NINCDS-ADRDA | multistage clustered sampling | 24,117 | 452 | 7 | |
| Zhetuo Pan (2022) [29] | Zhejiang | NINCDS-ADRDA | multistage sampling | 3152 | 326 | 6 | |
| Hailing Wang (2022) [30] | Henan | AD8/CSI-D | multistage stratified random cluster sampling | 7326 | 443 | 6 | |
| Yifei Ren (2024) [31] | Shandong | DSM-IV/NIA-AA | cluster randomized sampling | 5432 | 168 | 5 |
Diagnostic criteria: NINCDS-ADRDA, national institutes of neurological disorders and stroke-Alzheimer’s disease and related disorders association; DSM-IV, the diagnostic and statistical manual of mental disorders, fourth edition; MMSE, the mini-mental state examination; ICD-10, international classification of diseases 9th/10 editions; CCMD-2-R, the Chinese classification of mental disorders; NINDS-AIREN, the national institute of neurological disorders and stroke and association internationale pour la recherche et l’Enseignement en neurosciences; NIA-AA, national institute on aging–Alzheimer’s association guidelines; AD8, Alzheimer disease survey (8 editions); CSI-D, community screening instrument-dementia; AHRQ, agency for healthcare research and quality.
The heterogeneity test of the 23 included studies showed significant
heterogeneity (I2 = 99.0%, p
 Fig. 2.
Forest plot of the prevalence of Alzheimer disease.
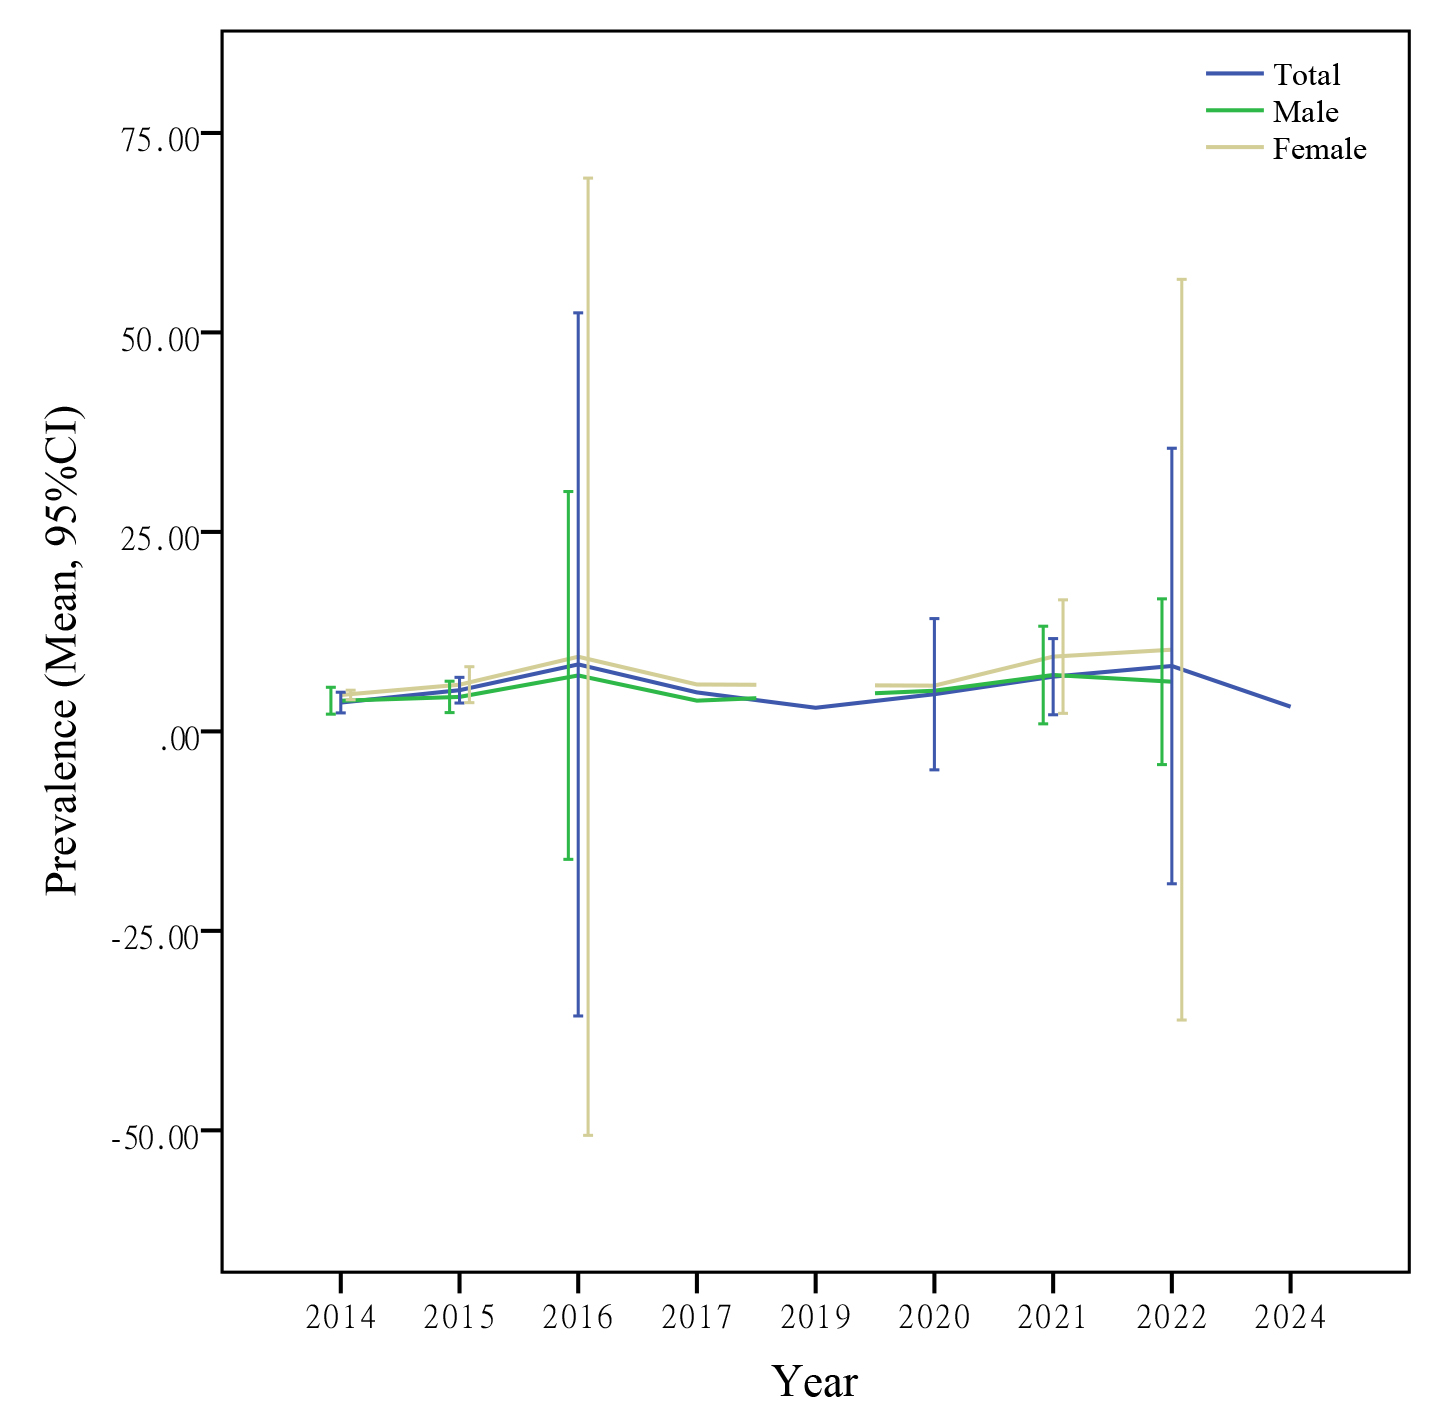
By analyzing the development trend of AD prevalence among older adults in China over the past 10 years, it was found that the prevalence showed a fluctuating trend, among which the prevalence in 2016 and 2022 were relatively high (Fig. 3).
 Fig. 3.
The prevalence of AD among the elderly in China over the past decade.
Among the 23 included studies, 16 studies explicitly provided the prevalence
data for the different genders. The prevalence of AD among females were 7.2%
(95% CI: 6.0%–8.4%), significantly higher than the prevalence among
males (5.4%, 95% CI: 4.3%–6.4%) (
The prevalence of AD showed a clear upward trend with increasing age. The
prevalence in the 60–69 age group is 3.2% (95% CI: 2.2%–4.2%),
6.2% (95% CI: 4.6%–7.9%) in the 70–79 age group, and as high as
14.3% (95% CI: 11.3%–17.3%) in the
In terms of education, the lower the educational level, the higher the prevalence. The prevalence of AD among older adults with primary school education or below was 8.8% (95% CI: 6.6%–11.1%), which was significantly higher than that among those with junior high school education (3.9%, 95% CI: 2.7%–5.2%) and senior high school education or above (3.0%, 95% CI: 2.1%–3.9%).
The prevalence of AD was 5.5% (95% CI: 4.4%–6.6%) for the urban
population and 6.6% (95% CI: 4.6%–8.0%) for the rural population.
The regression coefficient
| Analysis item | Studies, n | Sample, n | Cases, n | Heterogeneity test | Pooled prevalence (95% CI) | Model | p value | |||
| I2 value (%) | p value | |||||||||
| Gender | ||||||||||
| Male | 16 | 102,903 | 4273 | 98.3 | 0.054 (0.043–0.064) | Random | 0.016 | |||
| Female | 16 | 116,454 | 6342 | 98.3 | 0.072 (0.060–0.084) | |||||
| Age (y) | ||||||||||
| 60 |
14 | 48,319 | 1644 | 98.6 | 0.032 (0.022–0.042) | Random | 0.054 | |||
| 70 |
13 | 37,386 | 2099 | 98.3 | 0.062 (0.046–0.079) | |||||
| 13 | 14,440 | 1772 | 97.0 | 0.143 (0.113–0.173) | ||||||
| Education | ||||||||||
| Primary and below | 13 | 59,500 | 4123 | 99.2 | 0.088 (0.066–0.111) | Random | –0.028 | |||
| Junior high school | 10 | 16,940 | 557 | 95.6 | 0.039 (0.027–0.052) | |||||
| High school and above | 9 | 10,730 | 279 | 89.7 | 0.030 (0.021–0.039) | |||||
| Area | ||||||||||
| Urban | 12 | 182,756 | 7887 | 99.0 | 0.055 (0.044–0.066) | Random | 0.007 | 0.043 | ||
| Rural | 8 | 39,208 | 2111 | 98.9 | 0.066 (0.046–0.080) | |||||
| Geographic region | ||||||||||
| Southern | 12 | 177,941 | 7526 | 96.8 | 0.053 (0.046–0.060) | Random | 0.015 | |||
| Northern | 7 | 25,896 | 1777 | 99.2 | 0.056 (0.032–0.079) | |||||
| Northwestern | 2 | 10,416 | 1165 | 99.5 | 0.090 (0.010–0.170) | |||||
| Diagnostic criteria | ||||||||||
| NINCDS-ADRDA | 9 | 58,270.00 | 2257.00 | 98.6 | 0.051 (0.036–0.065) | Random | 0.003 | |||
| MMSE | 8 | 181,925.00 | 6970.00 | 98.9 | 0.049 (0.039–0.059) | |||||
| DSM-IV | 6 | 34,265.00 | 1217.00 | 96.7 | 0.037 (0.026–0.048) | |||||
| NIA-AA | 5 | 69,458.00 | 4210.00 | 99.6 | 0.088 (0.049–0.126) | |||||
| ICD-10 | 2 | 127,432.00 | 5096.00 | 96.0 | 0.047 (0.032–0.062) | |||||
| Others* | 5 | 25,536.00 | 1451.00 | 78.2 | 0.055 (0.049–0.061) | |||||
* Indicates grouping of other single diagnostic criteria into one category.
The prevalence varies under different diagnostic criteria. For example, it is
5.1% (95% CI: 3.6%–6.5%) under the national institutes of neurological disorders and stroke-Alzheimer’s disease and related disorders association (NINCDS-ADRDA) criteria and 4.9%
(95% CI: 3.9%–5.9%) under the mini-mental state examination (MMSE) criteria. The regression
coefficient
Sensitivity analysis was performed using a random-effects model. There were no significant changes in the pooled prevalence when any of the studies were removed (Supplementary Fig. 1).
Funnel plots and Egger’s tests were used to assess the publication bias. The funnel plot was asymmetric, indicating a potential publication bias in the combined results (Supplementary Fig. 2). Subsequent analysis using Egger’s test confirmed the existence of publication bias in the pooled prevalence of AD (t = 2.79, p = 0.011) (Supplementary Figs. 3,4).
Dementia is a syndrome characterized by a progressive decline in cognitive and functional abilities, predominantly affecting individuals aged 60 and above. Based on the underlying pathology, dementia is clinically categorized into the following forms [32, 33]. AD is the leading cause and prototypical form, presenting insidiously and causing progressive memory impairment and cognitive dysfunction with increasing severity over years. Vascular dementia (VaD) is widely recognized as the second most common form of dementia and often co-occurs with other progressive cognitive disorders. Lewy body dementia encompasses Parkinson’s disease dementia and dementia with Lewy bodies, which have similar neuropathological profiles and spectra of clinical symptoms, and are differentiated primarily by the order of motor and cognitive symptom onset. Frontotemporal dementia (FTD) is a rare form of dementia that occurs earlier than other forms, progresses rapidly, and often has a genetic component. As a result of population aging, dementia has emerged as a pressing public health concern. Previous research has predominantly concentrated on the prevalence of dementia among elderly Chinese individuals, whereas the present study focused on elucidating the prevalence of AD specifically.
The results of this study showed that the prevalence of AD among elderly Chinese individuals over the past decade was 5.4% (95% CI: 4.7%–6.2%), which is higher than the findings of another meta-analysis conducted in China in 2020 (3.20%, 95% CI: 3.17%–3.23 %) [34]. It is note-worthy that studies conducted in the United States [35] (5.7%) and Korea [36] (5.7%) have shown a higher prevalence of AD than that in China, while studies from Europe [37] (5.05%) and Japan [38] (3.8%) have indicated a lower prevalence. The global inconsistencies may be attributed to disparities in the genetic, environmental, lifestyle, and diagnostic criteria across individual study [39].
Consistent with previous findings, the prevalence of AD was significantly higher among females [38, 40]. This is related to differences between men and women in terms of physiological, psychological, and social factors [41]. Studies found that sex hormones and sex chromosomes interact with various disease mechanisms during aging, encompassing inflammation, metabolism, and autophagy, leading to unique characteristics in AD progression between men and women [41, 42]. A marked decrease in circulating estrogen levels during menopause may increase the risk of developing AD [43, 44]. In addition, higher levels of mental stress, excessive social roles and caregiving responsibilities, coupled with relatively fewer opportunities for education and career advancement, could contribute to a higher incidence of AD among women [42, 43, 45, 46]. Moreover, because women generally have a longer average lifespan than men, they face a higher risk of developing the disease in their later years.
Multiple epidemiological studies have shown that the incidence of AD significantly increases with age [9, 36, 40]. Aging is a complex and irreversible process that occurs in multiple organs and cell systems. It is manifested by a reduction in the brain’s volume and weight, a loss of synapses, enlargement of the ventricles in specific areas, accompanied by the deposition of senile plaques and the formation of neurofibrillary tangles. These structural and pathological changes in the brain create conditions for the development of AD [39].
This study found a negative correlation between the prevalence of AD and educational level, which is consistent with most previous results [47, 48]. The cognitive reserve model has been proposed to explain the association between higher education level and the lower incidence of AD. Cognitive reserve refers to the brain’s capacity to maintain functional resilience in the presence of AD neuropathology [48]. A shorter duration of education among residents may lead to a lack of sufficient cognitive reserves, subsequently reducing the capacity of the brain to resist damage.
Our results showed that the prevalence of AD was significantly higher in rural areas than in urban areas. There may be some adverse environmental and lifestyle factors in rural areas, including lack of education, unhealthy eating habits, and exposure to pesticides, all of which can negatively affect cognitive function [49]. Furthermore, unbalanced allocation of medical resources affects the prevalence of AD in rural areas. The regional subgroup analyses suggested a large variation in the prevalence of AD in China, which can be attributed to enormous differences in the natural and social environments, economic development, and traditions among different regions. In addition, this study found that variations in diagnostic criteria could affect the pooled effect size, which could be attributed to differences in the definition and judgement methods of AD among different diagnostic criteria.
This meta-analysis was conducted to reveal the prevalence of AD in the elderly population in China over the past decade. The results showed that AD has become a major public health problem in China. Therefore, the implementation of effective preventive measures is imperative. At the individual level, the elderly should strengthen comprehensive prevention strategies by enhancing cognitive training through activities such as reading, learning new skills, and playing board games to stimulate brain function and improve cognitive abilities. Maintaining healthy weight management through balanced diets, caloric control, and increased dietary fiber consumption is equally essential. Regular engagement in aerobic exercise, including walking and jogging, can promote cerebral blood circulation and metabolic function. Cultivating a positive mindset via social interactions and hobbies helps alleviate negative emotions, while ensuring a nutrient-rich diet with adequate proteins, vitamins, and brain-beneficial components—such as omega-3 fatty acids from fish and antioxidants from fruits and vegetables—provides foundational support for cognitive health.
At the societal level, the government and relevant departments should increase healthcare investment and optimize resource allocation to strengthen primary healthcare services, particularly ensuring equitable access to quality medical care for elderly populations in rural and remote areas. Concurrently, enhancing public education to raise awareness of Alzheimer’s disease and establishing robust social support systems are critical to providing assistance to affected families and fostering a dementia-inclusive society.
This study has several limitations. First, there was considerable heterogeneity in the combined results. The subgroup analysis and meta-regression indicated that gender, age, education level, urban/rural, Geographic region, and diagnostic criteria significantly moderated the effect size. However, substantial residual heterogeneity remained, suggesting unmeasured factors (e.g., have other disease, family history, living or marital status) that might contribute to the heterogeneity. Second, all the studies included in this research were cross-sectional studies, and there were relatively few high-quality studies. After removing studies with low AHRQ-score, heterogeneity remained to I2 = 99.1%. However, sensitivity analysis revealed that there were no significant changes in the pooled prevalence when the low AHRQ-score studies were removed (Supplementary Table 1). As mentioned in many other meta-analyses, conducting meta-analyses on cross-sectional studies will inevitably face the problem of relatively large heterogeneity [50, 51]. Third, there was a publication bias in this study. After the trim-and-fill method analysis, it was found that the pooled effect size decreased to 3.6% (95% CI: 2.8%–4.4%) (Supplementary Table 2). Therefore, it is impossible to accurately capture the changing trends of AD solely through cross-sectional studies. We believe that the results of this study should be interpreted with caution. Moreover, we hold the view that it is highly necessary to conduct longitudinal studies in the future to comprehensively understand the development trends of AD among the elderly in China.
With the accelerating aging population in China, the risk of Alzheimer’s disease (AD) among older adults is projected to escalate significantly, necessitating proactive responses from both individuals and governments to address this pressing issue through timely interventions.
The data are obtained from major medical journal databases. The full dataset and data analysis code are available from the corresponding author.
Conceptualization, LYG and MML; methodology, GZH and ZHL; software, ZHL and MML; validation, GZH and MML; formal analysis, MML; writing—original draft preparation, GZH, ZHL and MML; writing—review and editing, LYG; supervision, MML. All authors read and approved the final manuscript. All authors have participated sufficiently in the work and agreed to be accountable for all aspects of the work.
Not applicable.
Thanks to all the peer reviewers for their opinions and suggestions.
This study was supported by grants from the College Students’ Innovative Training Program of Jining Medical University (cx2023161).
The authors declare no conflict of interest.
Supplementary material associated with this article can be found, in the online version, at https://doi.org/10.31083/RN36394.
References
Publisher’s Note: IMR Press stays neutral with regard to jurisdictional claims in published maps and institutional affiliations.