


 , Ziquan Liu 1, Yanxiang Niu 1, Guowu Xu 2, Kang He 3, Jinrui Dong 1,4, Tayierjiang Tuerxun 5, Guansen Hua 6, Xiangyu Yan 1,*
 , Haojun Fan 1,*
1 School of Disaster and Emergency Medicine, Tianjin University, 300192 Tianjin, China
2 Department of Emergency Medicine, Tianjin Medical University General Hospital, 300052 Tianjin, China
3 Bioengineering College of Chongqing University, 400044 Chongqing, China
4 School of Medicine, Faculty of Medicine, Tianjin University, 300052 Tianjin, China
5 Urumqi Traditional Chinese Medicine Hospital, 830000 Urumqi, Xinjiang, China
6 Xiamen Peiyang BCI & Smart Health Innovation Research Institution, 361199 Xiamen, Fujian, China
Abstract
Acute kidney injury (AKI) is a significant cause of mortality among post-cardiac arrest patients. However, clinical prediction models for assessing AKI risk for in-hospital cardiac arrest (IHCA) patients remain limited. Thus, this retrospective study aimed to develop a nomogram that uses readily available clinical characteristics to predict the likelihood of AKI in this group of patients during intensive care unit (ICU) hospitalization.
This study constructed a nomogram based on the Medical Information Mart for Intensive Care IV (MIMIC-IV) database and conducted variable selection through Least Absolute Shrinkage and Selection Operator (LASSO) regression, followed by univariate and multivariate logistic regression analyses on the selected variables. Model performance was evaluated by calculating sensitivity, specificity, and the Youden index, and by performing decision curve analysis (DCA), clinical impact curve (CIC), and receiver operating characteristic (ROC) curve analysis.
This study included 1427 cardiac arrest (CA) patients, who were randomly allocated into a training cohort (n = 999) and a validation cohort (n = 428). We identified five independent predictors for post-cardiac arrest AKI: weight (adjusted odds ratio (aOR): 1.016, 95% confidence interval (CI): 1.009–1.024), peripheral capillary oxygen saturation (SpO2) (aOR: 1.044, 95% CI: 1.026–1.063), sodium (aOR: 0.947, 95% CI: 0.919–0.975), Sequential Organ Failure Assessment (SOFA) score (aOR: 1.134, 95% CI: 1.083–1.190), and Oxford Acute Severity of Illness Score (OASIS) score (aOR: 1.080, 95% CI: 1.059–1.103). The model demonstrated strong performance, with area under the curve (AUC) values of 0.920 and 0.875 in the training and validation cohorts, respectively. Upon validation, the specificity, sensitivity, and Youden index for the model were 0.837, 0.781, and 0.618, respectively. The calibration curve indicated good agreement between predictions and observations. The DCA and CIC confirmed the clinical utility of the model.
The developed prediction model exhibits high predictive performance for predicting AKI in IHCA patients.
Keywords
- MIMIC-IV database
- in-hospital cardiac arrest
- cardiac arrest-associated acute kidney injury
- prediction model
Despite significant improvements in preventive measures, cardiac arrest (CA)
remains a serious public health issue [1]. In the United States, approximately
290,000 in-hospital cardiac arrests (IHCA) and 350,000 out-of-hospital cardiac
arrests (OHCA) occur annually [2]. The incidence of IHCA ranges from
approximately 1 to 17 per 1000 admissions, though the global incidence in adults
has not been well characterized [3]. IHCA remains a relatively neglected
condition compared to OHCA. A systematic review of 92 randomized CA clinical
trials (1995–2014,
Acute kidney injury (AKI) occurs in approximately 50% of post-cardiac arrest
patients [6] and has been associated with poor clinical outcomes in studies
of cardiac intensive care unit patients [7]. AKI is a significant risk factor
for unfavorable neurological outcomes and elevated mortality following CA [8, 9]. Previous research has indicated that severe AKI is associated with reduced
hospital survival (48% versus 65%, p = 0.006) and reduced 12-month
survival with favorable neurobehavioral outcomes (30% versus 53%, p
In CA patients, early recognition of AKI is critical, as renal replacement therapy (RRT) becomes the only therapeutic option when there is severe progression of the disease. Wang et al. [11] established and validated a predictive model for early acute kidney injury after cardiac arrest resuscitation through retrospective collection of clinical cases. Similarly, Lin et al. [12] developed and validated a risk prediction model for AKI after cardiac arrest using clinical data. However, both studies share the same limitations: they are single-center retrospective studies with relatively small sample sizes and limited included variables. Therefore, developing robust risk prediction models for cardiac arrest-associated acute kidney injury (CA-AKI) is necessary. Such models would facilitate early and accurate detection of CA-AKI, enabling timely intervention before severe progression occurs.
We acquired the study data from a comprehensive critical care database named Medical Information Mart for Intensive Care IV (MIMIC-IV), which is equipped for multi-parameter intelligent monitoring. MIMIC-IV is an openly available database containing intensive care information from more than forty thousand patients from 2008 to 2022. This database was established following ethical and regulatory guidelines, having received approval from both the Massachusetts Institute of Technology (MIT) and the Beth Israel Deaconess Medical Center (BIDMC) [13]. The researcher successfully completed the required Human Subject Research Course (Certification Record: 58084498) and secured official permission to use the database.
The MIMIC-IV database used in this study was approved by the Institutional Review Boards (IRB) of both the Massachusetts Institute of Technology and the Beth Israel Deaconess Medical Center. Since the database contains no protected health information and all patient data are de-identified, individual patient consent was not required for this research.
This study retrospectively analyzed intensive care unit (ICU) inpatient records
from the Massachusetts Institute of Technology Beth Israel Deaconess Medical
Center between 2008 and 2022. Eligible patients satisfied the following set of
criteria: (1) age
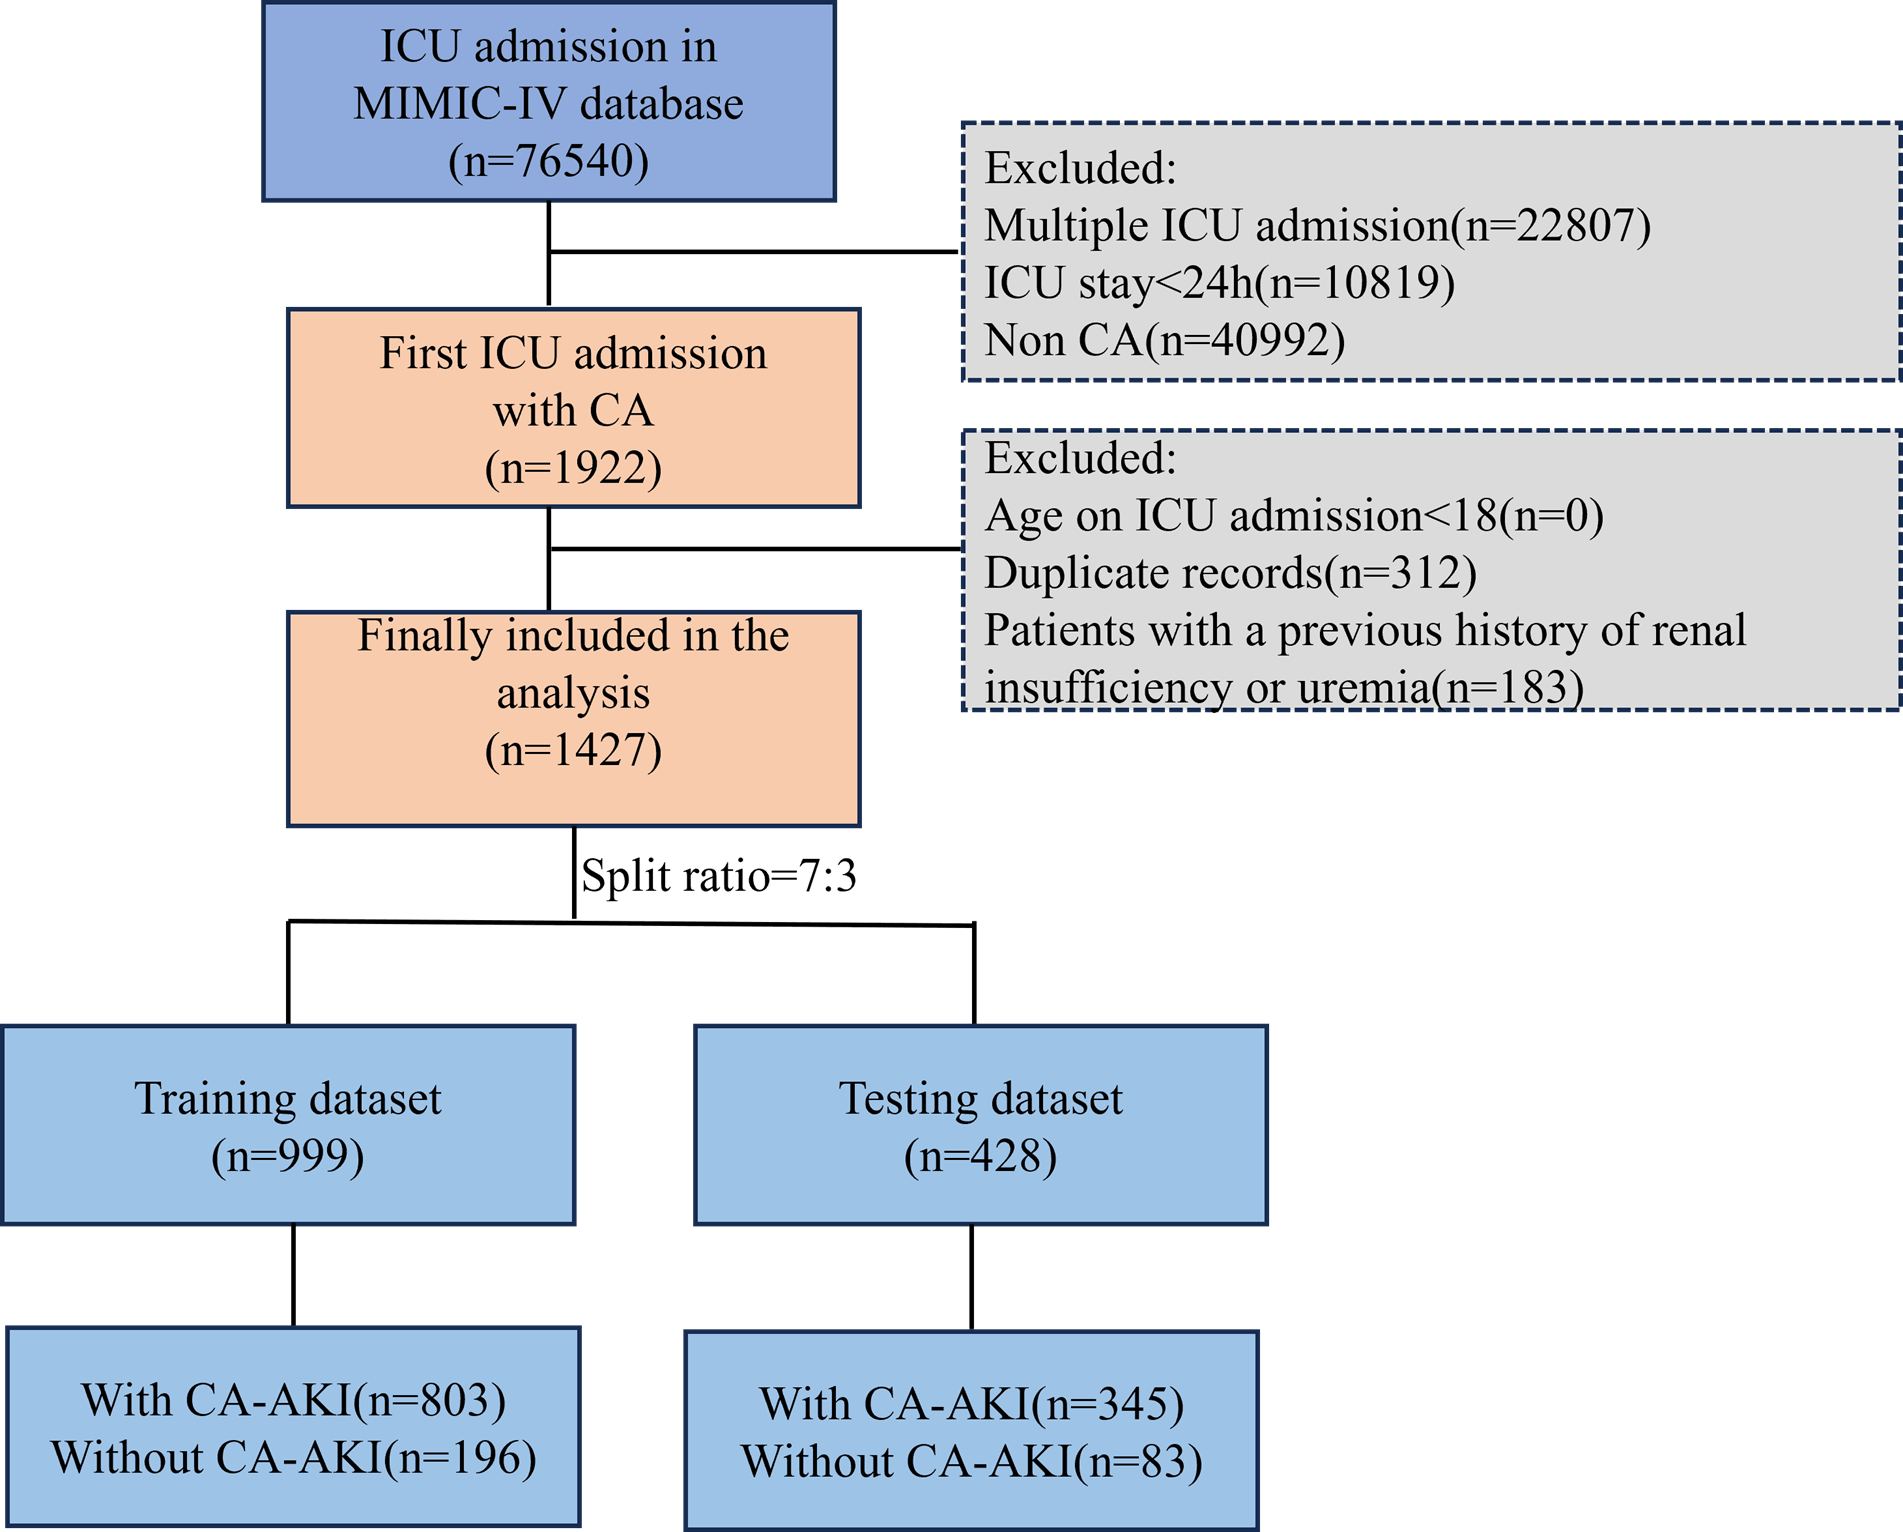 Fig. 1.
Graphical depiction of the participant inclusion procedure in the study. MIMIC-IV, medical information mart for intensive care IV; ICU, intensive care unit; CA, cardiac arrest; CA-AKI, cardiac arrest-associated acute kidney injury.
We sought to create an easily applicable clinical prediction tool for estimating
the risk of AKI in CA patients admitted to the ICU. The primary outcome was
ICU-acquired AKI, for which we used the first ICU serum creatinine value within
24 hours as the surrogate baseline to: (1) compute the KDIGO-defined
LASSO regression was selected for variable screening due to its computational efficiency, ability to generate sparse solutions, and robustness against multicollinearity and overfitting-advantages highlighted in comparative analyses with methods such as Horseshoe [14], which, despite theoretical optimality, lacks LASSO’s practical applicability in large-scale datasets and interpretable model construction.
The study incorporated a dataset comprising ICU-admitted patients, for whom demographic characteristics were meticulously documented. On the first day of the ICU admission, a comprehensive evaluation of relevant factors was conducted using the database. This evaluation encompassed demographic characteristics (age, sex, weight), vital signs (heart rate, respiratory rate, blood pressure), oxygen saturation, blood checks (white blood cells, platelet, hemoglobin), blood gas analysis (pH, PaCO2, lactate), biochemical markers (Creatinine, Lactate Dehydrogenase [LDH]), electrolytes (sodium, potassium), common severity scores (Sequential Organ Failure Assessment [SOFA], Systemic Inflammatory Response Syndrome [SIRS], Simplified Acute Physiology Score II [SAPS II]), AKI stage, and underlying diseases (hypertension, diabetes).
We addressed missing values in the dataset using the multivariate imputation by
chained equations (MICE) package (version 3.14.0; Stef van Buuren, University of
Utrecht, Utrecht, Netherlands) in R (version 4.3.1; R Foundation for Statistical
Computing, Vienna, Austria). (Supplementary Table 1). We first analyzed
the distribution and proportion of missing data with the md.pattern() function
and VIM visualization tools to perform imputation strategies. We applied multiple
imputation via the MICE algorithm, selecting Predictive Mean Matching (PMM) for
continuous variables (e.g., age, weight), logistic regression (logreg) for binary
variables (ventilation type, AKI occurrence), and polynomial regression (polyreg)
for categorical variables (race, gender). Imputation parameters were set to m = 5
imputations, maxit = 50 iterations, and a random seed of 500 for reproducibility.
We assessed convergence and imputation quality using diagnostic plots and
combined results following Rubin’s rules to account for imputation uncertainty,
ensuring the rigor and validity of our statistical inferences. The enrolled
patients were randomly partitioned into a training set and an internal validation
set at a 7:3 ratio via the random number method. In the multicenter MIMIC-IV
database, LASSO regression was conducted for variable selection. The logistic
regression model was used to construct the final prediction model. The receiver
operating characteristic (ROC) curve of the prediction model was plotted, and the
area under the curve (AUC) was calculated to evaluate the predictive ability of
the model. The calibration curve was used to evaluate the consistency between the
actual probability and the predicted probability, and the decision curve analysis
(DCA) was constructed to evaluate the net clinical benefit under different
threshold probabilities. Statistical significance was set at p
In the three formulas, TN, FP, TP, and FN denote True Negative, False Positive, True Positive, and False Negative, respectively.
Data from a total of 76,540 patients were retrieved through the MIMIC-IV database during the study period. After exclusion, 1427 patients were included in the final analysis. Among them, 999 patients were split into the training dataset and 428 into the testing dataset (Fig. 1).
Compared to patients without CA-AKI, those CA-AKI had an average age of 66.97
| Variable | Without CA-AKI (n = 2791) | CA-AKI (n = 11481) | p-value2 | ||
| Demographic characteristics | |||||
| Age (year) | 66.58 (18.42) | 66.97 (16.79) | 0.746 | ||
| Gender | 0.174 | ||||
| Female (%) | 123 (44%) | 454 (40%) | |||
| Male (%) | 156 (56%) | 694 (60%) | |||
| Weight (Kg) | 77.42 (19.78) | 84.26 (24.16) | |||
| Vital indicators | |||||
| Heart rate (beats/min) | 91.75 (24.69) | 90.81 (22.74) | 0.566 | ||
| Respiratory rate (breaths/min) | 19.51 (6.80) | 20.03 (6.89) | 0.254 | ||
| Systolic blood pressure (mmHg) | 119.96 (29.10) | 132.23 (14.9) | 0.254 | ||
| Diastolic blood pressure (mmHg) | 68.59 (20.69) | 69.94 (20.56) | 0.328 | ||
| Mean blood pressure (mmHg) | 80.71 (21.07) | 82.78 (21.50) | 0.143 | ||
| SpO2 (%) | 94.34 (10.21) | 96.20 (7.25) | 0.004 | ||
| Temperature (°C) | 36.56 (5.10) | 36.67 (6.73) | 0.390 | ||
| Laboratory indicators | |||||
| White blood cells (K/uL) | 13.04 (8.85) | 13.87 (8.46) | 0.155 | ||
| Platelet (K/uL) | 206.23 (89.05) | 214.76 (112.05) | 0.175 | ||
| Hemoglobin (g/dL) | 11.53 (2.58) | 11.54 (2.52) | 0.922 | ||
| Sodium (mEq/L) | 139.57 (5.76) | 138.64 (5.51) | 0.015 | ||
| Potassium (mEq/L) | 4.31 (0.81) | 4.35 (0.92) | 0.448 | ||
| Glucose (mg/dL) | 177.49 (107.80) | 182.30 (102.64) | 0.501 | ||
| pH | 7.28 (0.17) | 7.30 (0.14) | 0.239 | ||
| PaCO2 (mmHg) | 45.38 (14.85) | 44.53 (15.15) | 0.392 | ||
| Lactate (mmol/L) | 3.82 (3.54) | 3.68 (3.06) | 0.531 | ||
| Anion gap (mEq/L) | 16.92 (5.74) | 17.18 (5.23) | 0.490 | ||
| Total carbon dioxide (mEq/L) | 22.72 (6.94) | 22.59 (6.18) | 0.769 | ||
| Urea nitrogen (mg/dL) | 28.00 (25.93) | 30.68 (22.73) | 0.113 | ||
| Creatinine (mg/dL) | 1.37 (1.36) | 1.80 (1.79) | |||
| LDH (IU/L) | 714.01 (661.01) | 853.80 (796.8) | 0.148 | ||
| Magnesium (mEq/L) | 2.03 (0.40) | 2.05 (0.47) | 0.457 | ||
| Disease severity scoring system | |||||
| SOFA | 5.41 (4.06) | 9.23 (4.36) | |||
| APS III | 50.53 (26.01) | 73.76 (30.20) | |||
| SIRS | 2.31 (1.13) | 2.79 (1.01) | |||
| SAPS II | 37.06 (15.29) | 49.47 (16.77) | |||
| OASIS | 31.67 (9.97) | 40.93 (9.57) | |||
| Mechanical ventilation | |||||
| Invasive mechanical ventilation | 1.29 (0.75) | 2.25 (2.77) | |||
| AKI stage | |||||
| Stage 1 | 0 (0%) | 194 (17%) | |||
| Stage 2 | 0 (0%) | 459 (40%) | |||
| Stage 3 | 0 (0%) | 495 (43%) | |||
| Underlying diseases | |||||
| Hypertension | 112 (40%) | 482 (42%) | 0.589 | ||
| Diabetes | 70 (25%) | 357 (31%) | 0.049 | ||
1Mean (SD); n/N (%). 2Welch two-sample t-test; Fisher’s exact test; Fisher’s Exact Test for Count Data with simulated p-value (based on 2000 replicates). LDH, Lactate Dehydrogenase; SOFA, Sequential Organ Failure Assessment; APS III, Acute Physiology Score III; SIRS, Systemic Inflammatory Response Syndrome; SAPS II, Simplified Acute Physiology Score II; OASIS, Oxford Acute Severity of Illness Score; AKI, Acute Kidney Injury.
The study included 1427 patients, and after LASSO regression, 28 variables were
selected and underwent logistic regression analysis (Fig. 2 and Table 2). We have
included the variables that are statistically significant in the univariate
logistic regression. These features were put through an additional binary
multivariable logistic regression analysis and created a nomogram. This analysis
led to the identification of five independent predictors for patients with
CA-AKI, which include: weight (Adjusted Odds Ratio [aOR]: 1.016, 95% CI:
1.009–1.024), p
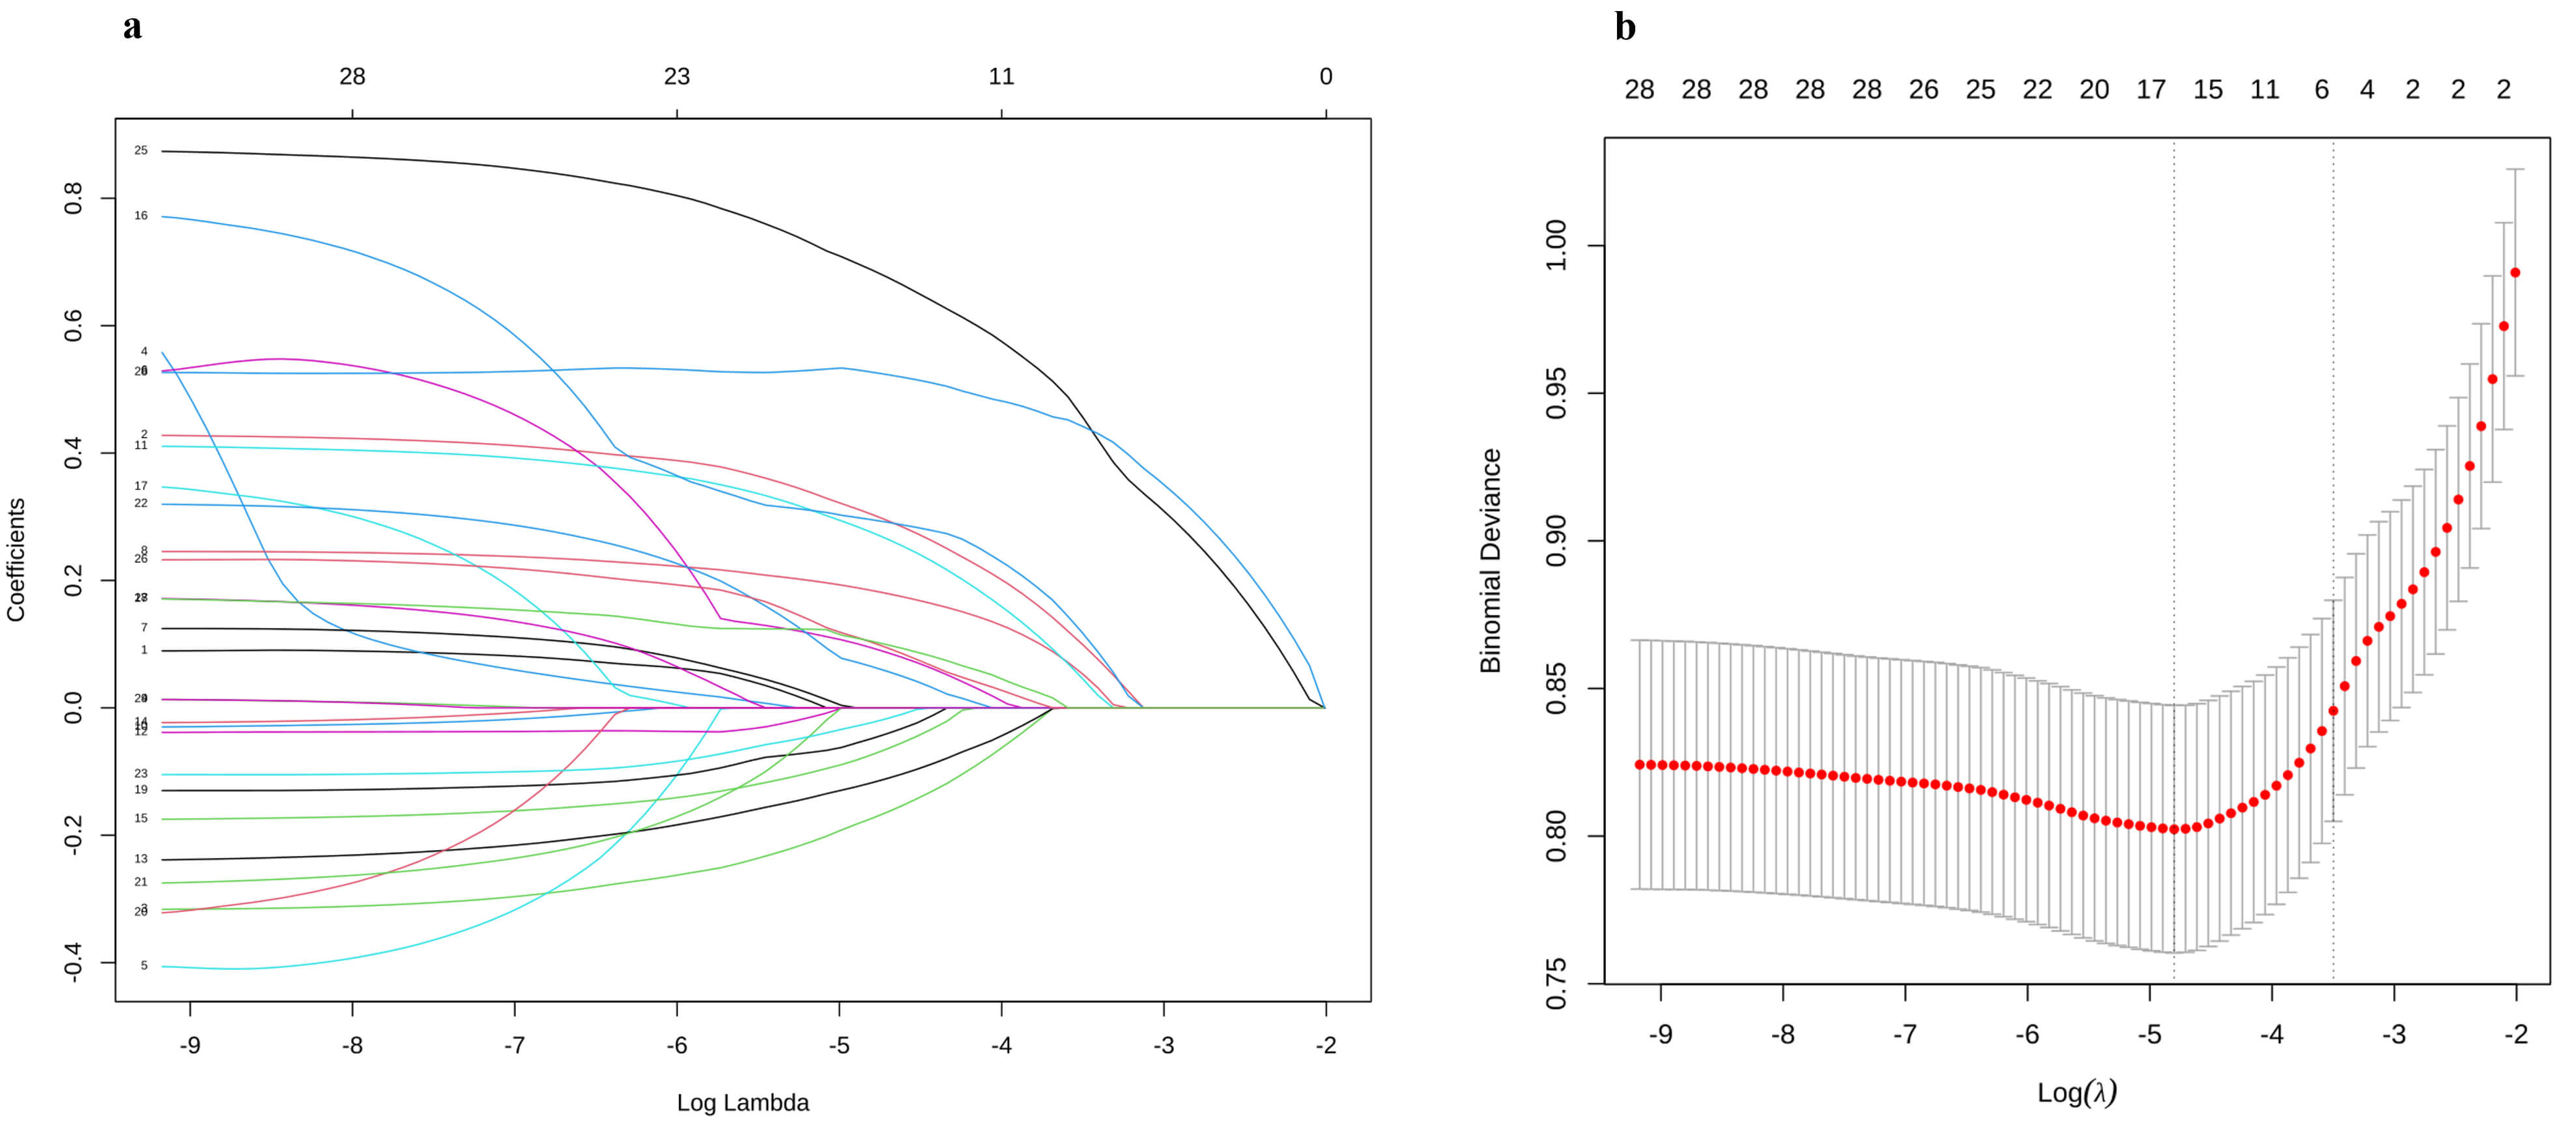 Fig. 2.
Schematic diagram of clinical feature selection. (a)
The profile of LASSO estimates for predictive variables is illustrated, where the
left vertical line marks the location of the optimal lambda, and the right
vertical line indicates the position that is one standard error distant from the
optimal lambda. (b) The graphic depicts the cross-validation curve for LASSO
regression. The left dashed vertical line indicates both the count of features
and the optimal logarithmic (lambda) value corresponding to the lowest mean
squared error.
| Variable | OR1 (95% CI1) | p-value2 |
| Age | 1.001 (0.994–1.009) | 0.732 |
| Weight (Kg) | 1.015 (1.008–1.021) | |
| Heart rate (beats/min) | 0.998 (0.993–1.004) | 0.546 |
| Systolic blood pressure (mmHg) | 1.002 (1.000–1.007) | 0.272 |
| Diastolic blood pressure (mmHg) | 1.003 (0.997–1.010) | 0.324 |
| Mean blood pressure (mmHg) | 1.005 (0.998–1.011) | 0.146 |
| Respiratory rate (breaths/min) | 1.011 (0.992–1.032) | 0.253 |
| SpO2 (%) | 1.024 (1.010–1.040) | 0.001 |
| Temperature (°C) | 0.992 (0.968–1.012) | 0.454 |
| White blood cells (K/uL) | 1.013 (0.996–1.031) | 0.131 |
| Platelet (K/uL) | 1.001 (1.000–1.002) | 0.229 |
| Hemoglobin (g/dL) | 1.003 (0.952–1.056) | 0.921 |
| Sodium (mEq/L) | 0.970 (0.946–0.993) | 0.011 |
| Potassium (mEq/L) | 1.055 (0.912–1.227) | 0.479 |
| Glucose (mg/dL) | 1.000 (0.999–1.002) | 0.482 |
| pH | 1.794 (0.746–4.246) | 0.190 |
| PaCO2 (mmHg) | 0.996 (0.988–1.005) | 0.402 |
| Lactate (mmol/L) | 0.986 (0.948–1.028) | 0.496 |
| Anion gap (mEq/L) | 1.009 (0.985–1.035) | 0.462 |
| Total carbon dioxide (mEq/L) | 0.997 (0.976–1.018) | 0.753 |
| Urea nitrogen (mg/dL) | 1.006 (0.999–1.012) | 0.074 |
| Creatinine (mg/dL) | 1.255 (1.119–1.434) | |
| LDH (IU/L) | 1.000 (1.000–1.000) | 0.181 |
| Magnesium (mEq/L) | 1.108 (0.830–1.499) | 0.493 |
| SOFA | 1.242 (1.199–1.289) | |
| APS III | 1.031 (1.026–1.037) | |
| SAPS II | 1.054 (1.044–1.064) | |
| OASIS | 1.106 (1.089–1.124) |
1OR, Odds Ratio; CI, Confidence Interval. 2False discovery rate correction for multiple testing. SOFA, Sequential Organ Failure Assessment; IHCA, in-hospital cardiac arrest.
| Variable | AOR1 (95% CI1) | p-value2 |
| Weight (Kg) | 1.016 (1.009–1.024) | |
| SpO2 (%) | 1.044 (1.026–1.063) | |
| Sodium (mEq/L) | 0.947 (0.919–0.975) | |
| SOFA | 1.134 (1.083–1.190) | |
| OASIS | 1.080 (1.059–1.103) |
1AOR, Adjusted Odds Ratio; CI, Confidence Interval.
2False discovery rate correction for multiple testing.
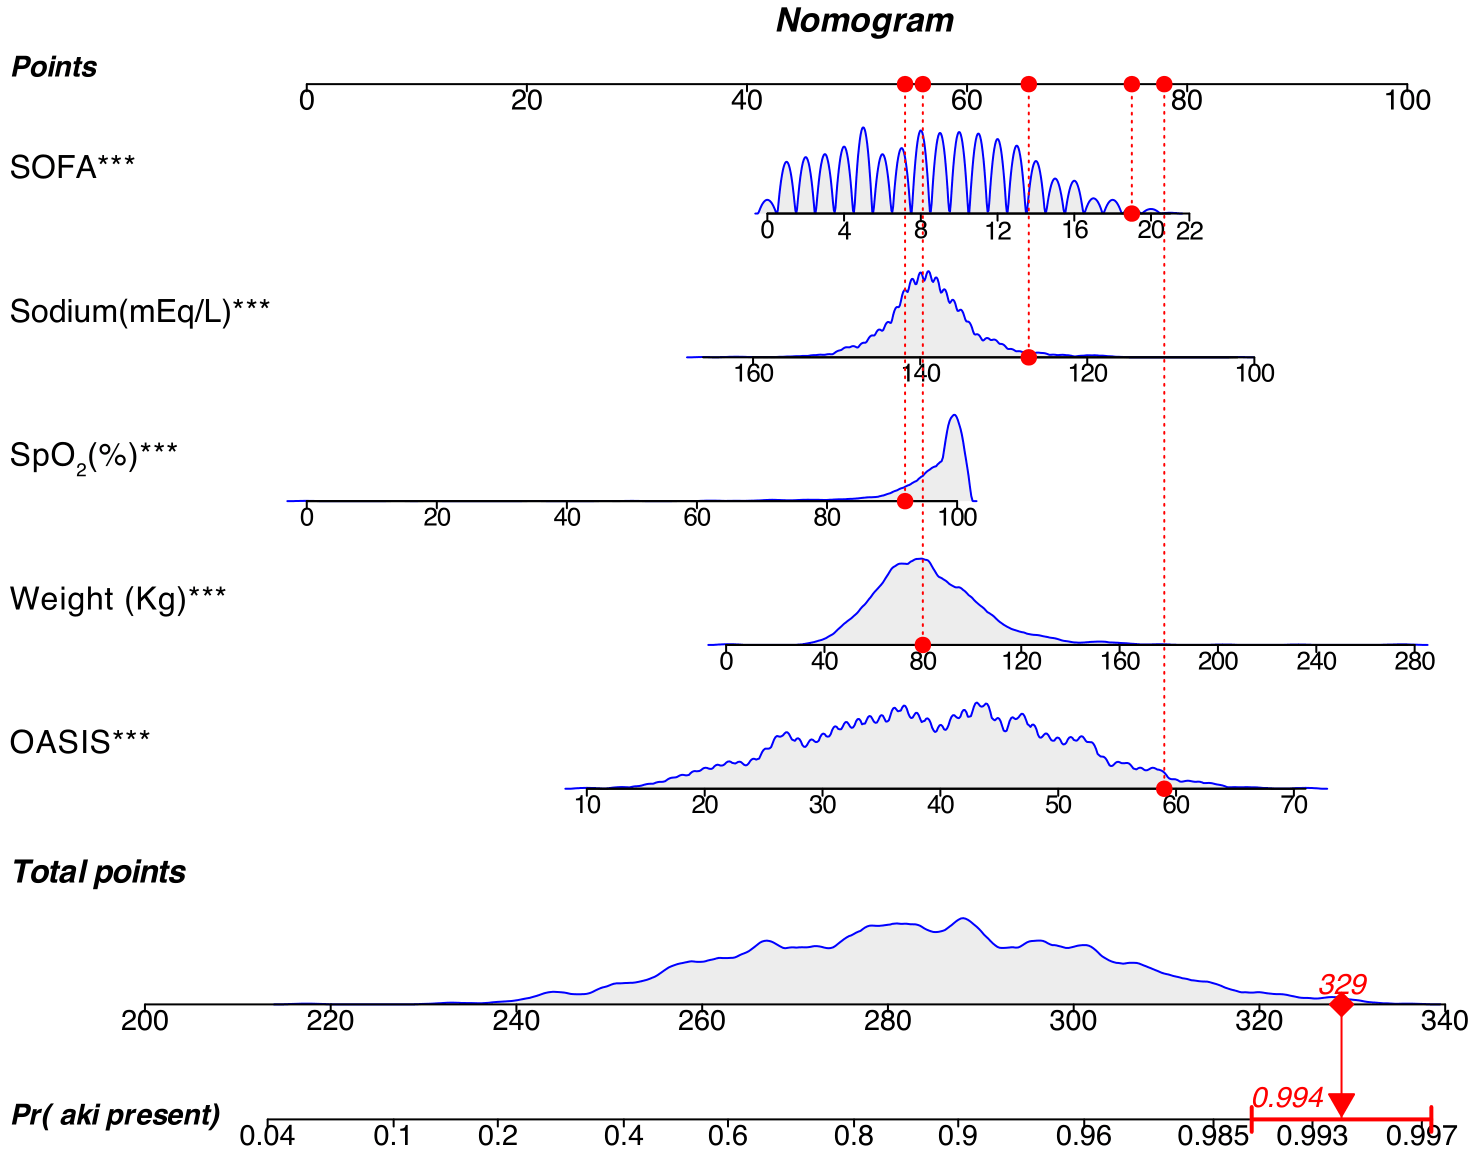 Fig. 3.
Nomogram developed for the prediction of AKI incidence in
patients with IHCA. The nomogram assigns scores to each variable, enabling the
assessment of AKI probability by summing the scores associated with the patient’s
specific values. The red dot represents a selected positive patient within the
cohort, with a cumulative score of 329 (p = 0.994), indicating a 99.4%
probability of AKI occurrence for this patient. SOFA, Sequential Organ Failure
Assessment; OASIS, Oxford Acute Severity of Illness Score; AKI, acute kidney
injury; IHCA, in-hospital cardiac arrest. ***p
ROC analysis assessed model discrimination using AUC calculations. The prediction model showed strong discriminative ability for CA-AKI in the training data and testing dataset with AUC values of 0.920 and 0.875, respectively (Fig. 4a,b). The training dataset showed specificity, sensitivity, and Youden index values of 0.940, 0.757, and 0.697. The test dataset showed corresponding values of 0.837, 0.781, and 0.618. Strong concordance was observed between predicted and actual probabilities in both the training and testing sets (Fig. 5a,b).
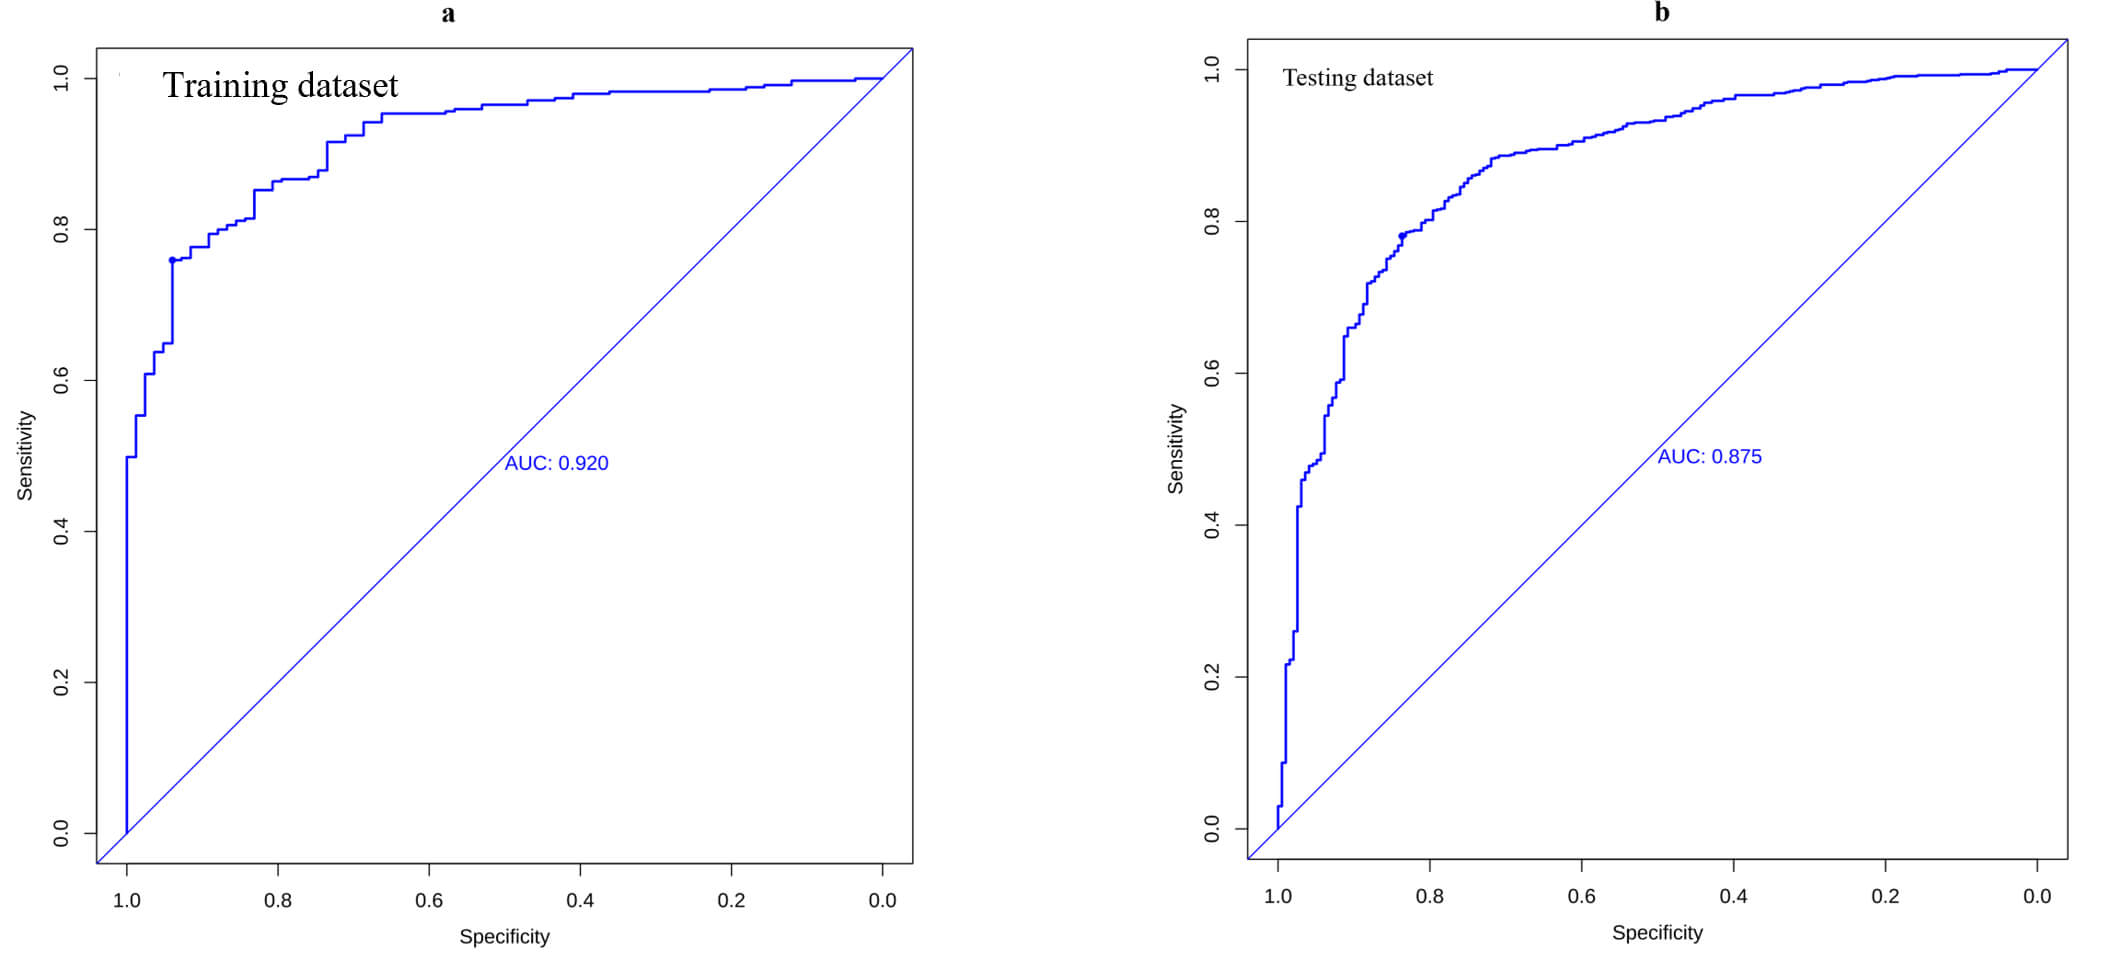 Fig. 4.
ROC analyses. The model showed good discrimination for CA-AKI, with areas under the curves (AUCs) of 0.920 in the training dataset (a) and 0.875 in the testing dataset (b). CI, confidence interval; ROC, receiver operating; AUC, area under the curve.
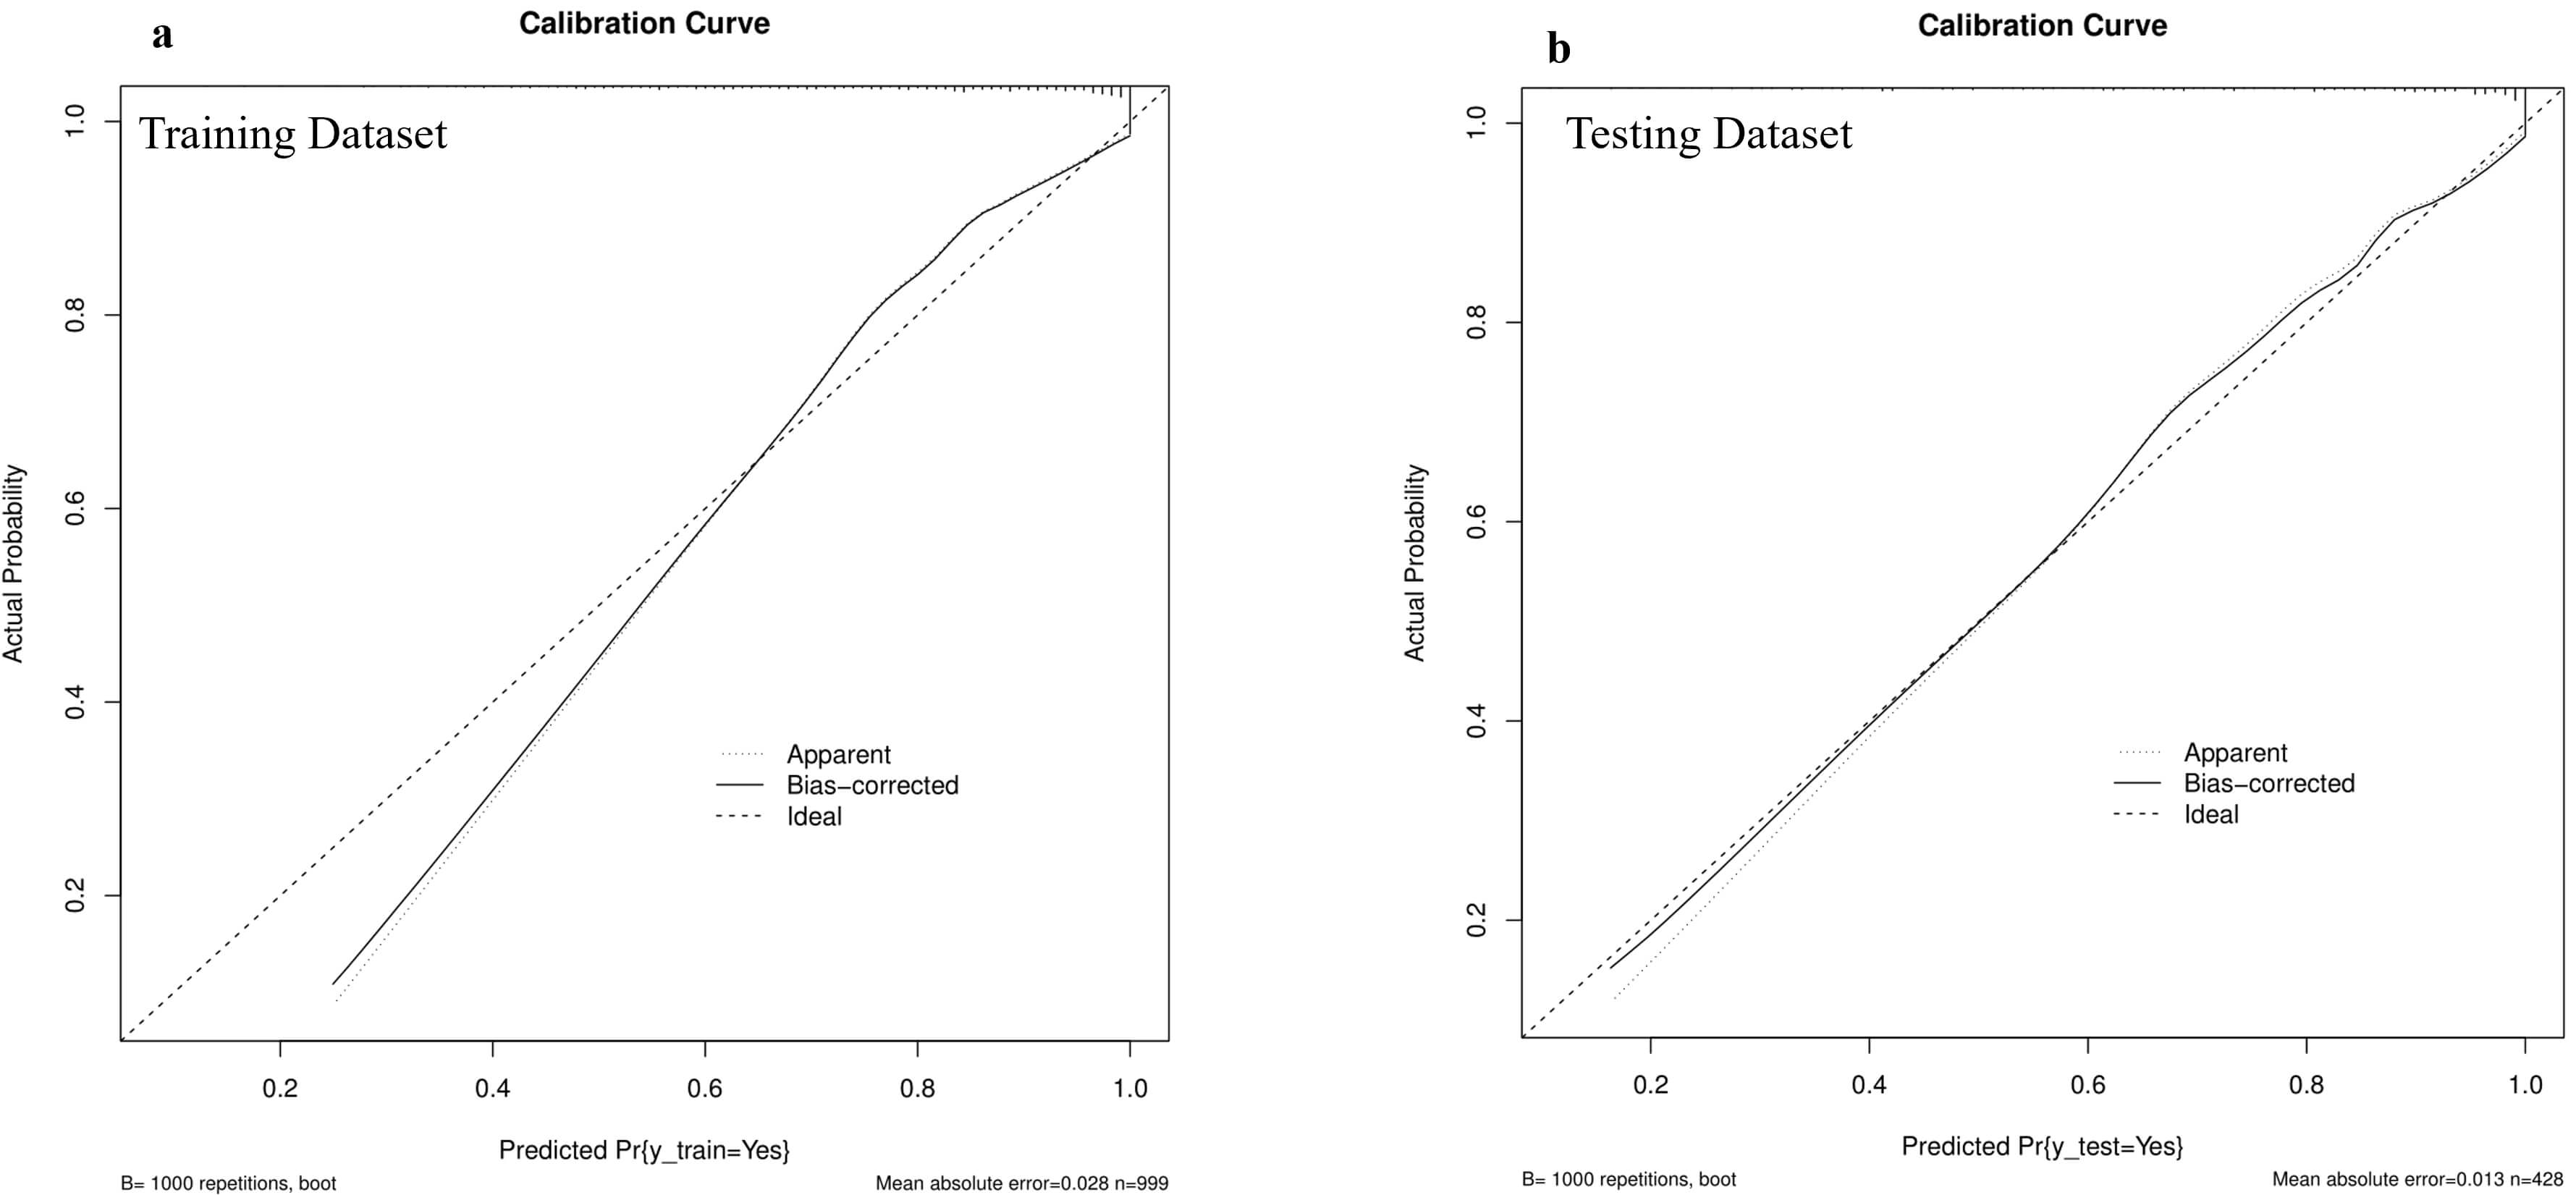 Fig. 5.
Calibration plots in the training and testing datasets. Calibration plots showed high accuracy in predicting absolute risk, as evidenced by the results of (a) the training dataset and (b) the testing dataset.
DCA and clinical impact curves (CIC) were used to assess the clinical
usefulness. The DCA demonstrated that the predictive model provided a net benefit
across nearly all threshold probabilities, confirming its clinical utility across
a range of high-risk thresholds. At lower risk thresholds (e.g.,
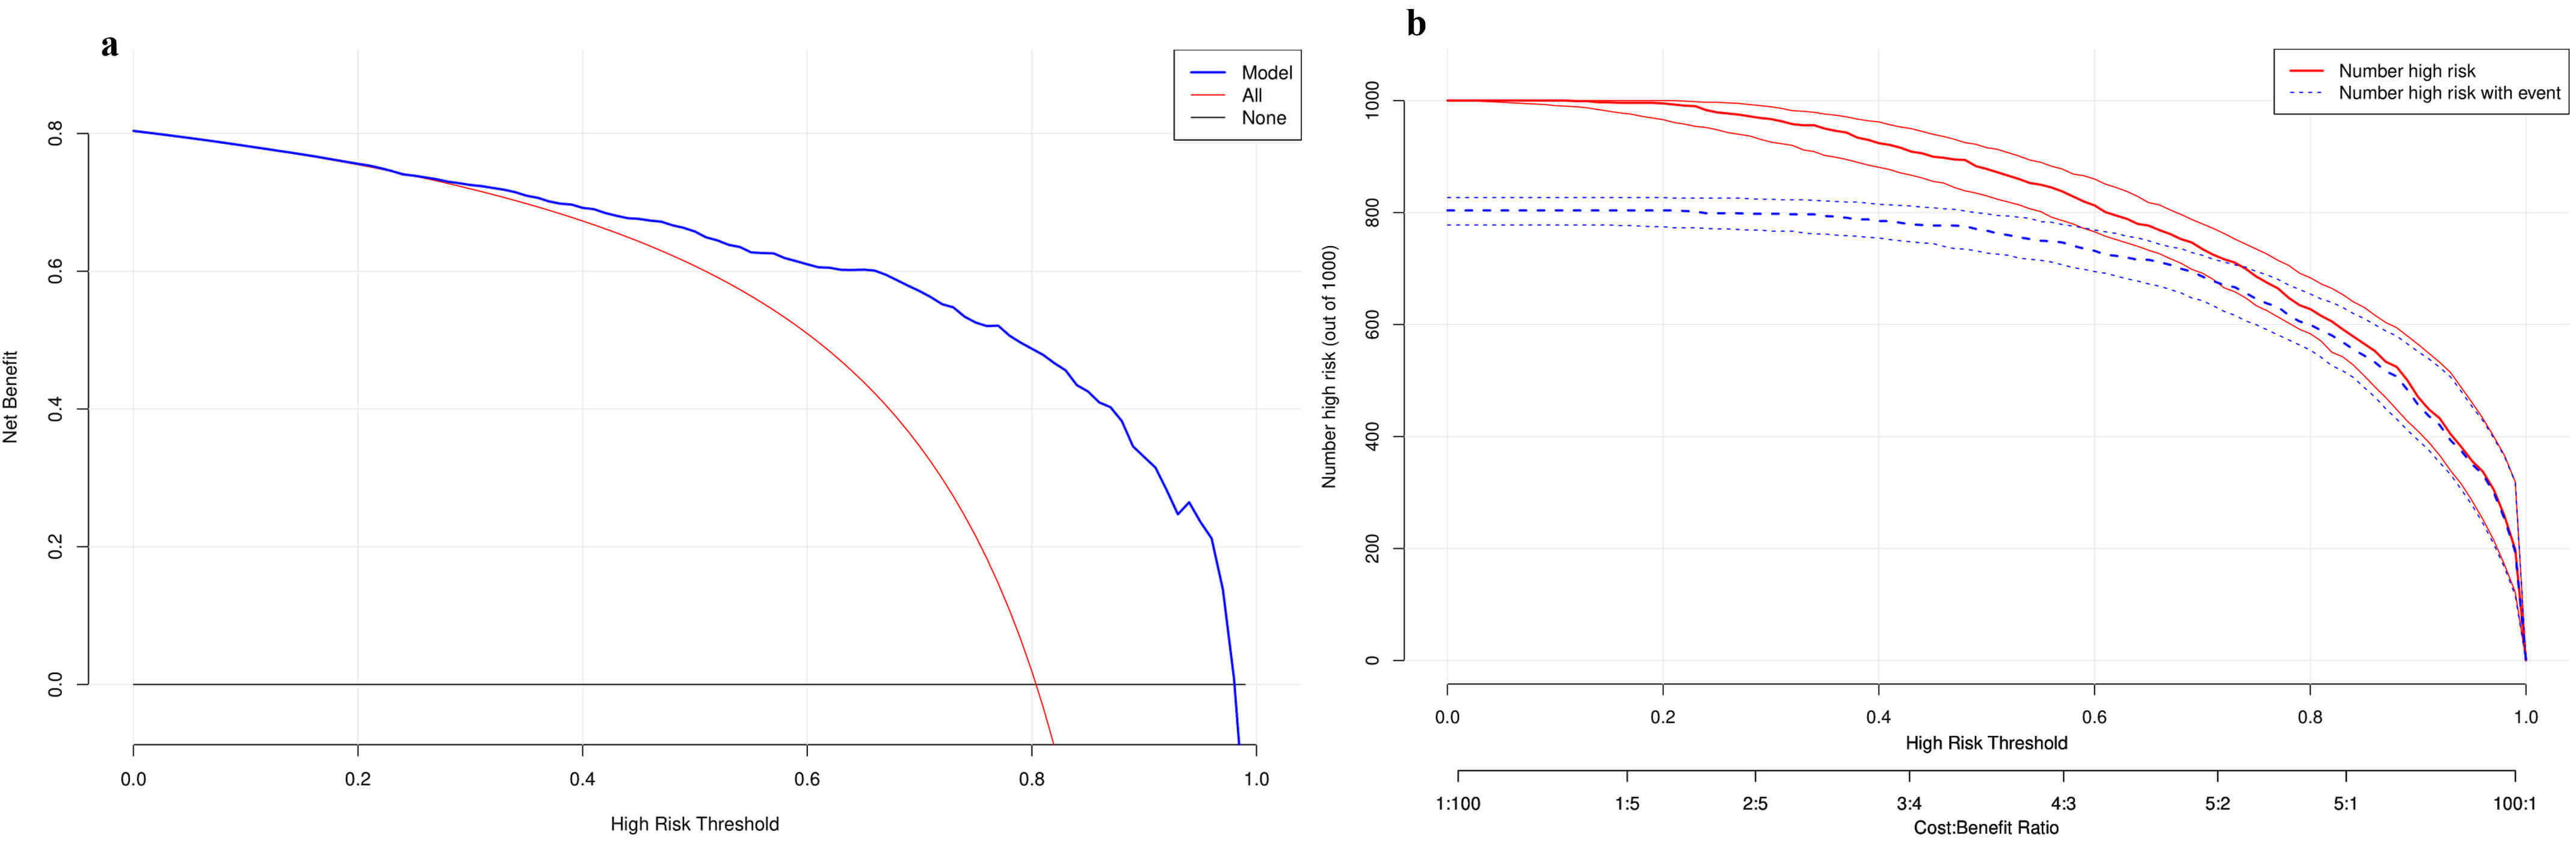 Fig. 6.
Decision curve analysis and clinical impact curve in testing in training dataset. (a) Decision curve analysis. (b) Clinical impact curve.
Using MIMIC-IV data, we developed a well-calibrated CA-AKI prediction model with routinely available clinical variables.
The model incorporated five accessible predictors (weight, SpO2, sodium, SOFA, OASIS) and demonstrated clinical utility via DCA/CIC analysis, enabling early high-risk CA-AKI identification and improved clinical decisions.
Demographic indicators are important variables in predictive models. This study found that body weight is positively correlated with the occurrence of CA-AKI. Overweight, as the second major risk factor for cardiovascular diseases [15], can significantly increase the risk of conditions such as hypertension, acute coronary syndrome (ACS), diabetes, and dyslipidemia, all of which are important predisposing factors for CA [16]. A recent study revealed that among patients with ACS, the overall incidence of sudden cardiac arrest (SCA) is as high as 17.5% [17]. Obesity can affect renal function through obesity-related glomerulopathy (ORG) and alterations in renal hemodynamics. Activation of the renin-angiotensin-aldosterone system (RAAS), hypertension, renal lipotoxicity mediated by adipokines, and activation of the nucleotide-binding oligomerization domain-like receptor pyrin domain-containing 3 (NLRP3) inflammasome can all exacerbate renal damage [18]. Therefore, an increase in body weight not only elevates the risk of CA but also promotes the occurrence of AKI through multiple mechanisms. A study conducted at Santo Bortolo Hospital in Italy included 142 patients with CA-AKI. The results showed that the body mass index (BMI) of these patients was 25.2 (23.8–27.7), falling within the overweight range [19]. This result is consistent with the conclusion of our study, which indicates that body weight is positively correlated with the occurrence of CA-AKI.
Vital signs are one of the most commonly used and important indicators in predictive models. A growing body of animal experimental and clinical data suggests that immediate inhalation of 100% oxygen CA is prone to causing hyperoxemia. Elevated oxygen partial pressure can increase the production of oxygen-free radicals, exacerbate reperfusion injury, and be associated with unfavorable neurological outcomes. Although some studies have adjusted the target SpO2 for patients with OHCA after return of spontaneous circulation (ROSC) from 98–100% down to 90–94%, this adjustment has not significantly improved the discharge survival rate [20]. Excessive oxygen administration can also disrupt the balance between the production and clearance of reactive oxygen species within the kidneys, promoting cell apoptosis, inflammatory cascades, and renal tissue fibrosis, thus providing a pathological basis for AKI [21]. A recent study found that in comatose OHCA patients, those who simultaneously received a lower mean arterial pressure and a lenient oxygen delivery strategy had a significantly higher risk of AKI [22]. In this study, we observed a negative correlation between SpO2 levels and the incidence of CA-AKI, indicating that precise control of oxygenation targets in the management of vital signs for IHCA patients may be a crucial step in reducing renal injury and improving long-term prognosis.
During the construction of predictive models, laboratory indicators are often used as surrogate markers to indirectly reflect clinical outcomes. Sodium metabolism disorders are extremely common in the ICU, yet they are rarely incorporated into the prognostic assessment of CA. Current data show that among comatose CA patients who have achieved ROSC, approximately 20% already exhibit hyponatremia upon admission to the ICU, while hypernatremia is rare. One study has demonstrated that even after adjustments, hyponatremia remains associated with a reduced probability of attaining a favorable functional outcome at 180 days [23]. The underlying mechanism for these findings is that sodium ions are involved in the electrical conduction of myocardial cells. Severe hyponatremia can induce paroxysmal bradyarrhythmias, which may subsequently lead to pulseless electrical activity or even CA [24]. The kidneys are a key organ for regulating water-electrolyte balance. In clinical practice, AKI often coexists with sodium metabolism disorders. When renal function is impaired, both urine dilution and concentration functions may be affected. Abnormalities in urine dilution function, coupled with excessive water intake by the patient, can result in an excess of water in the body, leading to dilutional hyponatremia. Conversely, if the urine concentration function is impaired and the patient has insufficient water intake, excessive water loss from the body can occur, resulting in hypernatremia. These conditions underscore the critical role of the kidneys in regulating water and sodium balance, particularly during AKI, when impaired renal function significantly affects the metabolic equilibrium of sodium and water. Although existing literature has reported a linear relationship between the coefficient of variation in serum sodium levels and the risk of AKI, the causal relationship between the two remains unclear [25]. In cases of AKI, the incidence of sodium metabolism disorders ranges from 22.5% to 24.6%, and patients with such disorders face a significantly higher risk of mortality [26]. Marahrens et al. [27] found that serum sodium levels were associated with the risk of in-hospital mortality in AKI patients, with hypernatremic patients exhibiting a higher mortality risk. Additionally, another study also indicated that both hyponatremia and hypernatremia were associated with poor outcomes in AKI patients [28]. In this study, we observed a negative correlation between serum sodium levels and the risk of CA-AKI. In summary, sodium metabolism disorders are not only related to the occurrence of AKI but also closely associated with the prognosis of CA patients. Therefore, for patients with sodium metabolism disorders, close monitoring of their cardiac rhythm and renal function is crucial to promptly identify and manage potential risks.
In clinical practice, various scoring systems are frequently incorporated as
predictive variables into clinical prediction models. The APACHE II score is the
most widely used disease severity scoring system in ICUs worldwide [29]. However,
it requires the collection of 12 physiological and laboratory indicators, along
with 2 disease-related variables [30], making data acquisition time-consuming and
not conducive to early, rapid assessment. The SOFA score, on the other hand, is
used to quantify organ dysfunction. Studies have shown that the SOFA score is an
independent risk factor for mortality in elderly ICU patients [31] and can
objectively assess the severity of the post-cardiac arrest syndrome (PCAS) [32].
When combined with blood lactate levels, the SOFA score demonstrates improved
predictive performance for the discharge survival rate of PCAS patients [33]. A
study conducted by the University of Science and Technology of China, which
included 347 patients with CA (197 cases in the CA-AKI group and 150 cases in the
no CA-AKI group), revealed that although there was no statistically significant
difference in the SOFA scores between the AKI group and the no-AKI group (11.294
This prediction model has several advantages in the management and prognosis of patients with CA. First, it is helpful for the early detection of CA-AKI patients. One study have found that whether the condition of patients with severe AKI can improve and recover early has a significant impact on their survival rates, hospitalization rates, and other outcomes [37]. The remission time of AKI is related to the long-term prognosis of patients. Research has shown that if AKI resolved within 7 days, the 1-year survival rate exceeded 90%. In contrast, the 1-year survival rate after discharge was only 77% [38]. Therefore, early identification of CA-AKI through prediction models is crucial for promptly adopting intervention measures. Early intervention can prevent adverse neurological outcomes, reduce disability rates, and improve survival rates. Second, it is helpful for the rational allocation of clinical resources. This prediction model aids in the rational allocation of clinical resources, such as dialysis machines and intensive care unit beds, thereby enabling more efficient use of limited medical resources and improving patient outcomes. Moreover, continuous refinement of the model based on real-world feedback can further enhance its performance and clinical utility.
This study has certain limitations. Despite the large sample size of the MIMIC-IV database, there may still be implicit data entry errors and selection bias; therefore, we have conducted rigorous cleaning and processing of extreme values and missing data. Second, since this study is retrospective, further prospective studies are needed to enhance the clinical practicality and effectiveness of the predictive model we have constructed. Third, in this study, we employed LASSO regression for variable screening; however, it should be noted that this method may have the limitation of excessively compressing variable coefficients. Fourth, it is important to emphasize that the validation of the nomogram is confined to internal assessment, which highlights the necessity of conducting external validation to determine its performance and reliability.
This research has identified a set of independent predictors closely linked to the occurrence of AKI in patients with IHCA who were admitted to the ICU. These predictors encompassed a range of factors, specifically weight, SpO2, sodium, SOFA, and OASIS. The prediction model that was developed based on these predictors demonstrated promising predictive results, accurately forecasting the likelihood of the development of AKI. Moreover, it exhibited significant clinical utility in the risk evaluation of AKI among ICU-admitted IHCA patients, aiding the medical staff in making more informed treatment decisions.
Future studies should not only deploy this model across diverse clinical environments but also rigorously validate its efficacy in a broader spectrum of settings to ensure its generalizability and widespread applicability. It would also be worthwhile to investigate the feasibility of integrating this model into electronic health records (EHR) or real-time clinical decision-support systems, which could offer a practical and forward-looking perspective for future research endeavors.
The datasets supporting the findings of this study are available from the corresponding author upon reasonable request.
HA, ZL, YN designed the research study and formulated the research plan. GX, KH, and JD carried out the research, completing the collection of experimental data and conducting all related experimental procedures. TT and GH analyzed the experimental data, interpreted the research results, and provided critical insights into the data discussion. HA drafted the original manuscript. All authors contributed to the critical revision of the manuscript for important intellectual content, and participated in the discussion and refinement of the study’s core conclusions. XY and HF as corresponding authors, supervised the entire research process, provided overall guidance on the study design and manuscript revision, and finalized the research conclusions. All authors read and approved the final version of the manuscript to be published. All authors have participated sufficiently in the work and agreed to be accountable for all aspects of the work, ensuring that any questions related to the accuracy or integrity of the work are appropriately investigated and resolved.
This study is a secondary analysis of the MIMIC IV database and does not require additional ethical approval. The study was conducted in accordance with the Declaration of Helsinki. The database contains de identified data without any protected health information, and informed consent was waived due to the use ofde-identified data.
We appreciate the researchers at the MIT Laboratory for Computational Physiology for publicly sharing the MIMIC-IV clinical database.
This work was supported by the National Key Research and Development Program of China (2021YFC3002200, 2021YFC3002202), the Postgraduate Research and Innovation Program of Tianjin Municipal Education Commission (2022BKY113), the Chunshui discipline construction fund of China (302-0704000002), and the National Key Research and Development Program of China (2023ZD0505500, 2023ZD0505504).
The authors declare no conflict of interest.
Supplementary material associated with this article can be found, in the online version, at https://doi.org/10.31083/RCM47434.
References
Publisher’s Note: IMR Press stays neutral with regard to jurisdictional claims in published maps and institutional affiliations.