


 , Jun Chen 1,*
1 Sinopharm Dongfeng General Hospital (Hubei Clinical Research Center of Hypertension), Hubei Key Laboratory of Wudang Local Chinese Medicine Research, Hubei University of Medicine, 442000 Shiyan, Hubei, China
2 Geriatrics Department, Sinopharm Dongfeng Huaguo Hospital, 442000 Shiyan, Hubei, China
3 The Second Clinical School, Hubei University of Medicine, 442000 Shiyan, Hubei, China
4 School of Public Health, Hubei University of Medicine, 442000 Shiyan, Hubei, China
†These authors contributed equally.
Abstract
Regulatory T cells (Tregs) play pivotal roles in immune homeostasis; however, the association between Tregs and the pathogenesis of coronary heart disease (CHD) remains unclear. Thus, this study aimed to investigate the relationships among Tregs, glucagon-like peptide-1 receptor (GLP-1R) expression, and CHD risk, with a focus on the severity of coronary artery stenosis and inflammatory cytokine dynamics.
A total of 130 CHD patients (stratified by the Gensini score into low-/high-risk stenosis subgroups) and 70 non-CHD controls were enrolled in this case–control study. Peripheral blood Tregs (CD4+CD25+FoxP3+) and GLP-1R+ Tregs were quantified via flow cytometry. Plasma cytokines interleukin-2 (IL-2), interleukin-4 (IL-4), interleukin-6 (IL-6), interleukin-10 (IL-10), interleukin-35 (IL-35), and tumor necrosis factor-alpha (TNF-α) were measured. Multivariate logistic regression and receiver operating characteristic (ROC) analyses were employed to evaluate the associations between Treg subsets and clinical outcomes; meanwhile, the Spearman correlation was used to assess the relationships between cytokines.
CHD patients presented with significantly lower proportions of total Tregs (p < 0.001) and GLP-1R+ Tregs (p = 0.013) compared to controls, with further reductions in the high-risk stenosis subgroups. Multivariate analysis identified both Tregs (CHD: odds ratio (OR) = 0.752; p < 0.001; stenosis: OR = 0.760; p = 0.021) and GLP-1R+ Tregs (CHD: OR = 0.859; p = 0.013; stenosis: OR = 0.840; p = 0.040) as independent predictors. The ROC analysis demonstrated diagnostic utility for Tregs (CHD: area under the curve (AUC) = 0.663; stenosis: AUC = 0.635) and GLP-1R+ Tregs (CHD: AUC = 0.600; stenosis: AUC = 0.619). The GLP-1R+ Treg proportion was positively correlated with anti-inflammatory IL-35 (r = 0.185, p = 0.016) and inversely correlated with IL-4 (r = –0.150, p = 0.047).
Reduced Treg frequency and impaired GLP-1R expression on Tregs are independently associated with CHD susceptibility and stenosis progression, potentially mediated by dysregulation of inflammatory cytokines. The GLP-1R pathway in Tregs represents a novel immunomodulatory target for therapeutic intervention in CHD.
Keywords
- coronary heart disease (CHD)
- glucagon-like peptide-1 receptor (GLP-1R)
- regulatory T cells (Tregs)
- coronary artery stenosis severity
- immunomodulation
Coronary atherosclerotic heart disease (CHD), a chronic inflammatory disorder with autoimmune underpinnings [1], is now widely conceptualized as a pathology driven by dysregulated immune-inflammatory crosstalk. Accumulating evidence has solidified the centrality of inflammatory and immune dysregulation in CHD pathogenesis [2, 3], establishing immunomodulation as a transformative therapeutic frontier in cardiovascular medicine. Regulatory T cells (Tregs) mediate cardioprotective effects in CHD through dual mechanisms: suppressing excessive immune-inflammatory responses [4, 5, 6] facilitating cardiovascular tissue repair [7]. Notably, Tregs are preferentially enriched in atherosclerotic (As) plaques, where they critically mediate inflammation resolution and plaque destabilization—processes indispensable for As regression [8]. Experimental models have revealed that antibody-driven Treg depletion in mice completely negates intensive lipid-lowering therapy-induced plaque regression, abolishing both inflammatory resolution and structural plaque stabilization [9, 10]. Studies have demonstrated that modulating the abundance and functional activity of Tregs effectively suppresses systemic inflammatory responses and inhibits immune cell activation, thereby attenuating the progression of As lesions [11, 12, 13]. However, direct clinical translation of Treg-targeted strategies into CHD therapeutics still faces multiple unresolved challenges.
The glucagon-like peptide-1 receptor (GLP-1R) pathway, a highly scrutinized therapeutic target for type 2 diabetes and obesity [14, 15, 16], exerts multifunctional cardiometabolic benefits through its activation. Specifically, GLP-1R agonism reprograms cardiomyocyte glucose metabolism, attenuates the oxidative stress burden, and suppresses apoptosis signaling, collectively reducing the myocardial infarction area and enhancing cardiac functional recovery. These mechanisms underpin its glycemic control [17], cardioprotective actions (via endothelial stabilization, infarct size limitation, and ventricular remodeling mitigation) [18, 19, 20], and immune-modulatory effects [21, 22]. Recent cutting-edge investigations have revealed that GLP-1R is most highly expressed in induced Tregs, while retaining robust functional integrity in mediating immunomodulatory responses [23]. Preclinical murine models have demonstrated that pharmacological activation of the GLP-1R pathway potentiates the anti-inflammatory efficacy of Tregs through quantitative expansion of Treg populations [24]. However, the pathophysiological relevance of GLP-1R signaling in human Tregs and its mechanistic crosstalk with CHD pathogenesis remain unresolved. In this study, we leveraged multiparametric flow cytometry to quantitatively assess the abundance of Tregs and their glucagon-like GLP-1R expression profiles, coupled with correlative analyses, to investigate their associations with CHD susceptibility and coronary artery stenosis severity. Our findings provide novel immunomodulatory insights into CHD pathogenesis and establish a preclinical evidence base for future therapeutic strategies targeting the Treg-GLP-1R axis to mitigate atherosclerotic cardiovascular complications.
This single-center observational study consecutively enrolled 200 patients who presented with chest pain at Dongfeng General Hospital between September 2023 and May 2024. The study protocol was approved by the Institutional Review Board of Sinopharm Dongfeng General Hospital, Hubei University of Medicine, Shiyan, China in compliance with the Declaration of Helsinki. (Approval No. LW-2024-049). Written informed consent was obtained from all participants prior to enrollment.
Patients were classified into two groups based on quantitative coronary
angiography (QCA): the CHD group (n = 130), with
The exclusion criteria were as follows: (1) metabolic disorders, such as
secondary diabetes mellitus or gestational diabetes mellitus; (2) pharmacological
interference, such as current or recent use of systemic hormonal therapies,
including thyroid hormone replacement or glucocorticoids, which may interfere
with immune-metabolic homeostasis; (3) immune dysregulation, such as a history of
established autoimmune/inflammatory disorders (including but not limited to
rheumatoid arthritis); (4) organ dysfunction, such as severe cardiac
insufficiency (left ventricular ejection fraction (LVEF)
All participants underwent diagnostic coronary angiography using standard
techniques. The severity of coronary artery stenosis was quantified using the
Gensini scoring system (based on the 2019 guidelines [25]), which accounts for
both the degree of luminal narrowing and the anatomical significance of the
affected vessels. The Gensini score was calculated as follows: Gensini score =
lesion 1 (severity score
Standardized Blood Collection: Peripheral venous blood (7 mL) was collected from
all participants immediately prior to coronary angiography via sterile
venipuncture of the radial vein after an overnight fast (
Sample Processing Workflow: 2 mL of whole blood was centrifuged at 400
Freshly isolated PBMCs were stained with the following antibody cocktail for
surface markers (30 min, room temperature): PerCP-conjugated anti-human CD4
(Clone RPA-T4, BioLegend, #300528), PE-conjugated anti-human CD25 (Clone BC96,
BioLegend, #302606), and Alexa Fluor 488-conjugated anti-human GLP-1R (Clone
358903, R&D Systems, #FAB6292G). Intracellular FoxP3-stained cells were
fixed/permeabilized using the FoxP3/Transcription Factor Staining Buffer Set
(BioLegend, #420801) and stained with Alexa Fluor 647-conjugated anti-FoxP3
(Clone 236A/E7, BioLegend, #320214) for 45 min at room temperature. Cytokine
levels interleukin-2 (IL-2), interleukin-4 (IL-4), interleukin-6 (IL-6),
interleukin-10 (IL-10), interleukin-35 (IL-35), and tumor necrosis
factor-alpha (TNF-
Using NovoExpress software (version1.3.4, Santa, Clara, CA, USA), cells or cytokines are automatically collected and analyzed. Treg cells are defined as CD4+CD25+Foxp3+ T cells. Lymphocyte populations (lymphocytes) are gated based on FSC-SSC, followed by gating for CD4+ T cells. From the CD4+ T-cell population, CD25+Foxp3+ Treg cells were identified, and the number of CD4+CD25+Foxp3+ Treg cells relative to that of CD4+ T cells was determined. From the CD4+CD25+Foxp3+ Treg cell population, CD4+CD25+Foxp3+ Treg cells expressing GLP-1R were gated, and their percentage was calculated (see Supplementary Fig. 1). For the detection of Treg cells and their GLP-1R expression levels, each sample was collected until 10,000 Treg cells or 500 µL of PBMC suspension was obtained to ensure sufficient statistical power for rare population analysis. The termination condition for collecting cytokines was set at capturing 150 microspheres or reaching a sample volume of 100 µL.
For all variables, normality assumptions were checked with the Shapiro-Wilk
test. Normally distributed continuous variables are expressed as
the means
Demographic and clinical characteristics of the study cohorts are presented in
Table 1. Compared with controls, patients with CHD presented a significantly
greater prevalence of hypertension (CHD vs. non-CHD: 59.23% vs. 38.57%,
| Variable | Non-CHD group (n = 70) | CHD group (n = 130) | p value | |
| Male sex, n (%) | 40 (57.14%) | 87 (66.92%) | 1.878 | 0.171 |
| Smoking history, n (%) | 19 (27.14%) | 56 (43.08%) | 4.929 | 0.026 |
| Alcohol consumption, n (%) | 14 (20.00%) | 29 (22.31%) | 0.144 | 0.705 |
| Hypertension, n (%) | 27 (38.57%) | 77 (59.23%) | 7.780 | 0.005 |
| Age, years | 59 (53, 65) | 64 (57, 70) | –3.037 | 0.002 |
| Waist circumference, cm | 90.13 |
93.34 |
–2.196 | 0.029 |
| Body mass index (BMI), kg/m2 | 24.47 |
24.94 |
–0.911 | 0.363 |
| hs-CRP, mg/L | 0.97 (0.53, 2.49) | 1.33 (0.62, 3.71) | –1.231 | 0.218 |
| Total cholesterol, mmol/L | 4.47 |
4.52 |
–0.325 | 0.745 |
| Triglycerides, mmol/L | 1.72 (1.01, 2.21) | 1.62 (1.20, 2.19) | –0.797 | 0.438 |
| HDL-C, mmol/L | 1.16 |
1.12 |
0.842 | 0.402 |
| LDL-C, mmol/L | 2.48 |
2.62 |
–1.114 | 0.267 |
HDL-C, high-density lipoprotein cholesterol; LDL-C, low-density lipoprotein cholesterol; hs-CRP, high-sensitivity c-reactive protein.
Comparative immunophenotypic analysis demonstrated significant alterations in
Treg cell dynamics among CHD patients. The frequency of circulating regulatory T
cells (Tregs, CD4+CD25+FoxP3+) was substantially reduced in the
CHD cohort compared with that in the non-CHD control group (Fig. 1A). In the
non-CHD group, the proportion of Treg cells was 5.93%, whereas in the CHD group,
it was 3.50%. The difference was highly statistically significant (Fig. 1B).
This depletion was further accentuated in CHD patients with high-risk coronary
stenosis (Gensini score
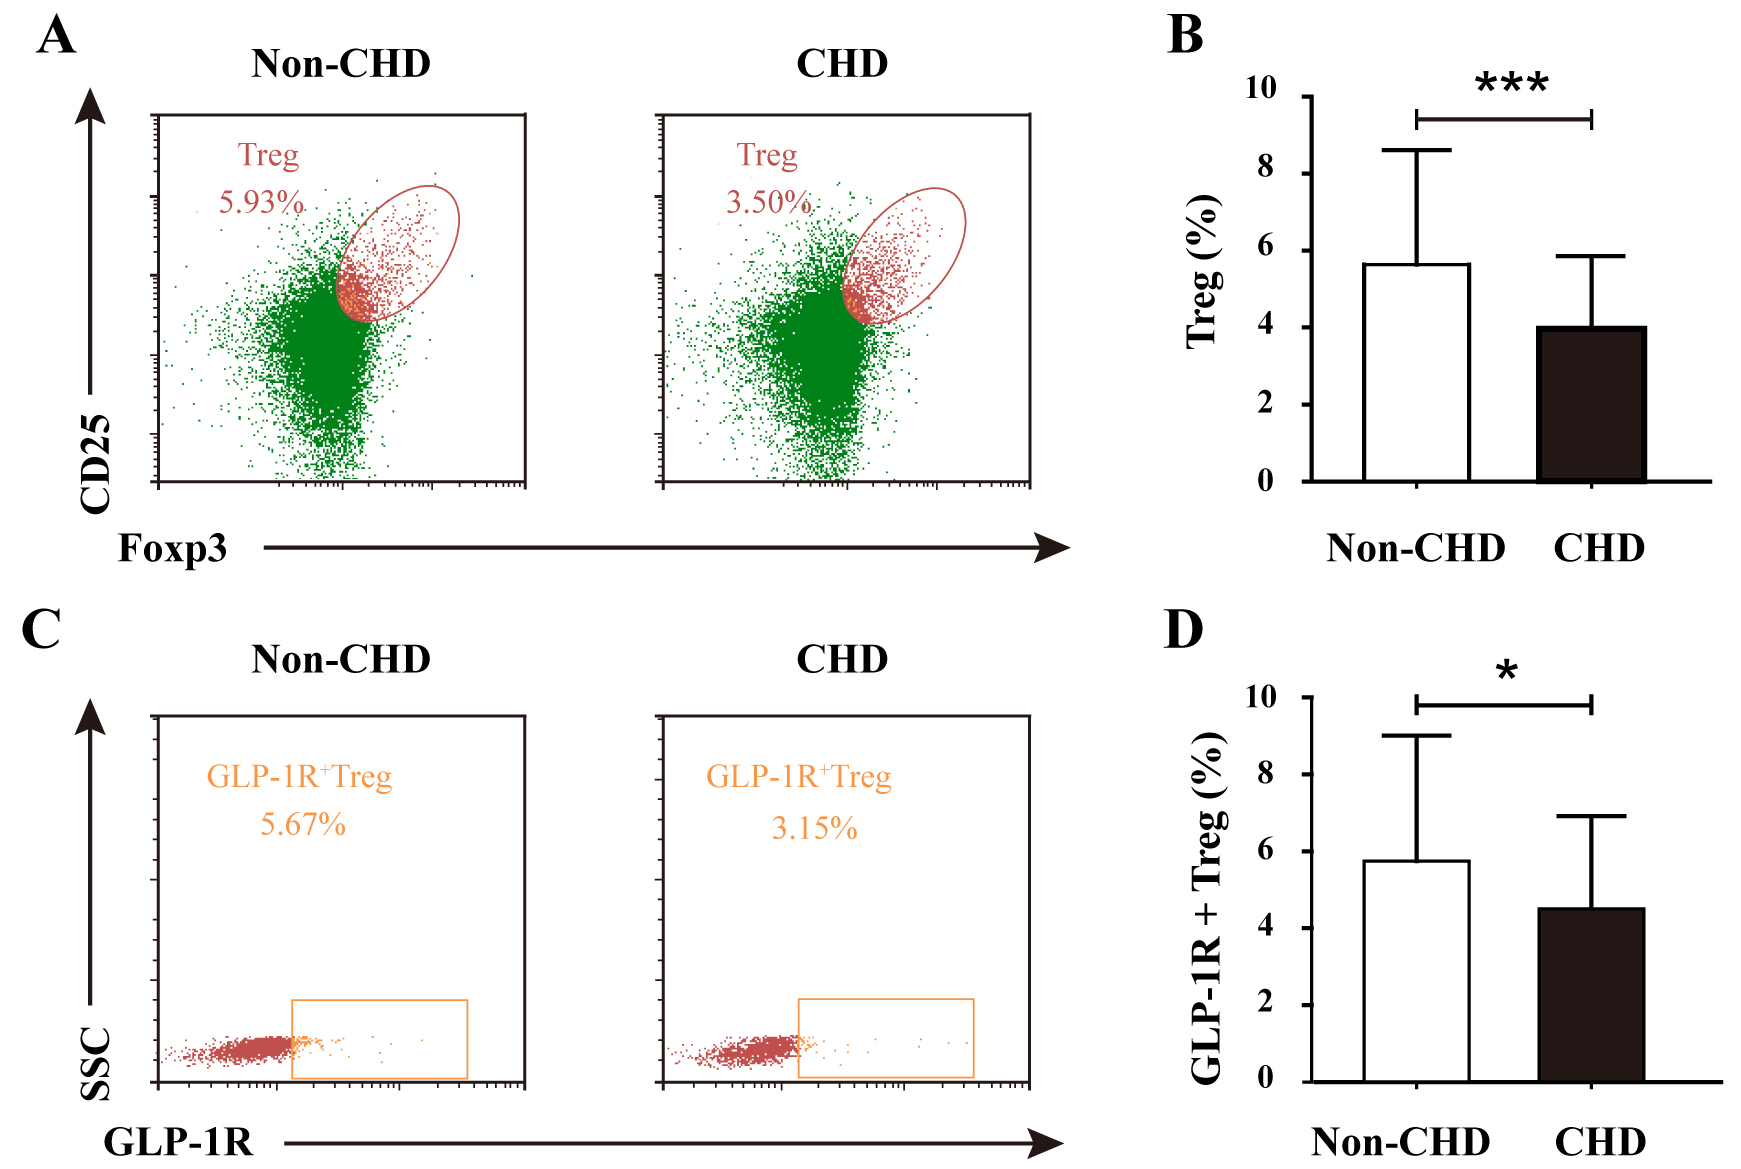 Fig. 1.
Comparative analysis of Treg frequency and GLP-1R+ Treg
subsets in non-CHD and CHD groups. (A) Representative flow cytometry
plots gating CD4+CD25+FoxP3+ Tregs in the non-CHD and CHD groups.
(B) Quantification of Treg frequency (% of CD4+ T cells) demonstrating
significant reduction in the CHD groups (***p
Notably, the immunoregulatory defect extended to the subset of Tregs expressing
glucagon-like peptide-1 receptor (GLP-1R+ Tregs). In the non-CHD group, the
proportion of GLP-1R+ Treg double-positive cells was 5.67% compared with
3.15% in the CHD group (Fig. 1C). The proportion of GLP-1R+ Tregs was
significantly greater in the non-CHD group than in the CHD group (Fig. 1D).
Stratification by stenosis severity revealed a progressive decline in
GLP-1R+ Treg representation, with high-risk patients displaying
significantly lower levels than their low-risk counterparts (p
These findings collectively suggest a dual defect in both Treg abundance and functional GLP-1R-mediated immunomodulatory capacity, potentially contributing to sustained inflammatory activation in coronary atherosclerosis.
Univariate logistic regression revealed a significant inverse correlation
between Treg frequency and CHD risk (OR = 0.749, 95% CI: 0.657–0.854; p
Univariate logistic regression revealed that a reduced GLP-1R+ Treg frequency (% of total Tregs) was significantly associated with elevated CHD risk (OR = 0.852, 95% CI: 0.765–0.948, p = 0.003). Additional risk factors included smoking history (OR = 2.031, 95% CI: 1.081–3.817, p = 0.028), hypertension (OR = 2.314, 95% CI: 1.276–4.195, p = 0.006), advanced age (OR = 1.050, 95% CI: 1.017–1.084, p = 0.003), and increased waist circumference (OR = 1.035, 95% CI: 1.003–1.069, p = 0.031). After adjusting for sex, lipid profiles, and the aforementioned covariates, the inverse correlation between GLP-1R+ Treg frequency and CHD risk remained robust (adjusted OR = 0.859, 95% CI: 0.762–0.969, p = 0.013) (Table 2), confirming its role as an independent protective factor against coronary atherosclerosis.
| Variable | Univariate analysis | Multifactor analysis | ||||
| OR (95% CI) | p | OR (95% CI) | p | |||
| GLP-1R+ Treg | –0.161 | 0.852 (0.765, 0.948) | 0.003 | –0.152 | 0.859 (0.762, 0.969) | 0.013 |
| Sex | –0.417 | 0.659 (0.362, 1.198) | 0.172 | 0.044 | 1.045 (0.428, 2.554) | 0.923 |
| Smoking history | 0.709 | 2.031 (1.081, 3.817) | 0.028 | 0.934 | 2.546 (1.022, 6.337) | 0.045 |
| Alcohol history | 0.138 | 1.149 (0.561, 2.351) | 0.705 | –0.301 | 0.740 (0.292, 1.875) | 0.525 |
| Hypertension | 0.839 | 2.314 (1.276, 4.195) | 0.006 | 0.867 | 2.380 (1.194, 4.745) | 0.014 |
| Age | 0.049 | 1.050 (1.017, 1.084) | 0.003 | 0.066 | 1.069 (1.027, 1.112) | 0.001 |
| Waist circumference | 0.035 | 1.035 (1.003, 1.069) | 0.031 | 0.025 | 1.025 (0.978, 1.074) | 0.298 |
| Body mass index | 0.039 | 1.040 (0.956, 1.132) | 0.362 | 0.029 | 1.029 (0.902, 1.174) | 0.669 |
| hs-CRP | 0.008 | 1.008 (0.979, 1.038) | 0.605 | 0.001 | 1.000 (0.969, 1.032) | 0.989 |
| Total cholesterol | 0.048 | 1.049 (0.787, 1.398) | 0.744 | –0.690 | 0.501 (0.223, 1.129) | 0.095 |
| Triglycerides | 0.168 | 1.183 (0.854, 1.640) | 0.312 | 0.288 | 1.334 (0.852, 2.088) | 0.208 |
| HDL-C | –0.434 | 0.648 (0.256, 1.641) | 0.360 | 0.531 | 1.701 (0.428, 6.761) | 0.451 |
| LDL-C | 0.188 | 1.206 (0.867, 1.679) | 0.266 | 0.965 | 2.624 (1.085, 6.345) | 0.032 |
OR, odds ratios.
ROC curve analysis demonstrated that GLP-1R+ Treg frequency (% of total
Tregs) exhibited modest discriminative capacity for differentiating CHD patients
from non-CHD controls, with an AUC of 0.600 (95% CI: 0.514–0.685, p =
0.032) (Fig. 2A). While the AUC value suggests limited standalone diagnostic
utility, its statistical significance (p
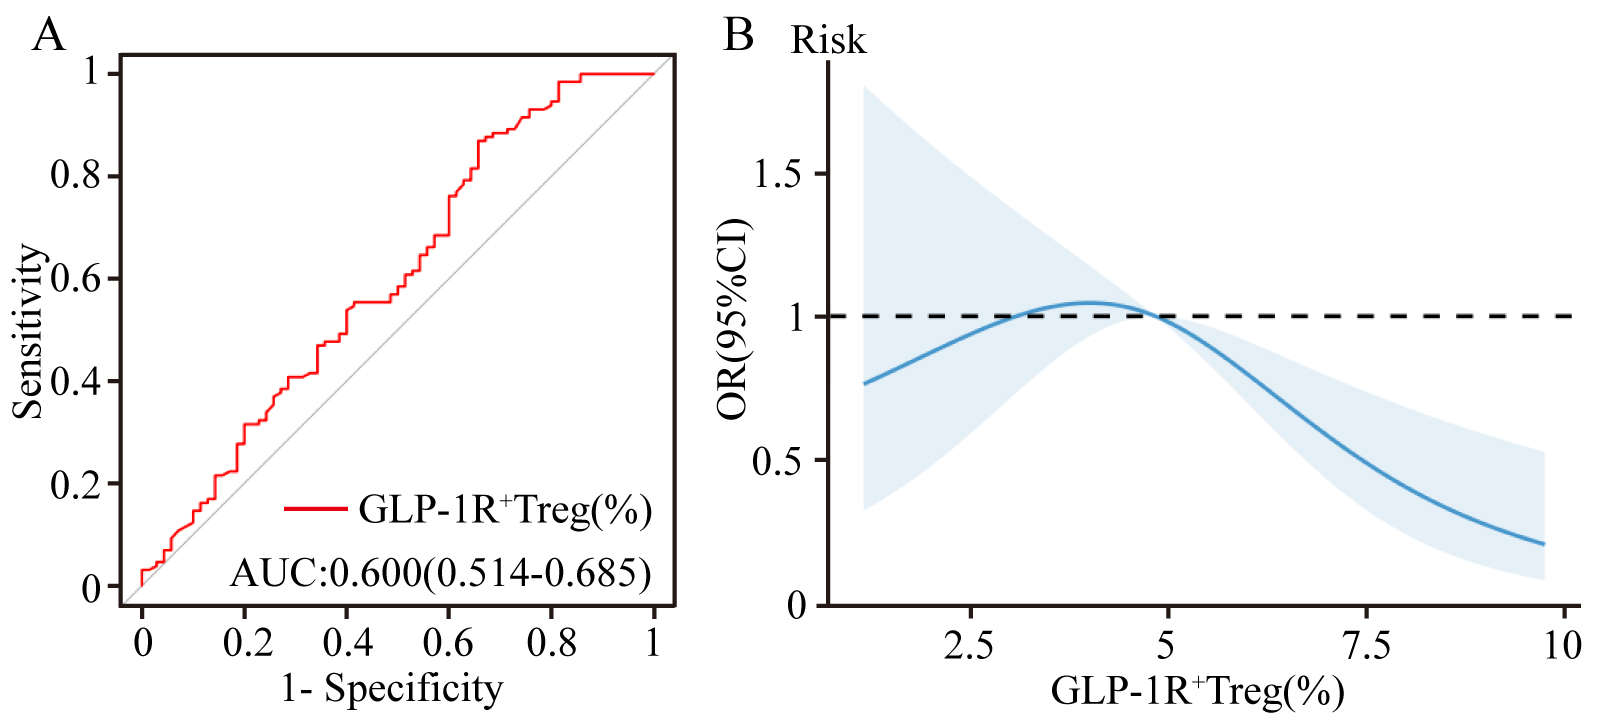 Fig. 2.
Predictive and dose-response relationships of GLP-1R+ Tregs in CHD risk assessment. (A) Receiver operating characteristic (ROC) curve analysis evaluating the discriminative capacity of the GLP-1R+ Treg frequency (% of total Tregs) for CHD risk stratification (AUC: 0.600). (B) Restricted cubic spline (RCS) model illustrating the nonlinear inverse association between GLP-1R+ Treg frequency and CHD risk.
Patients with CHD were stratified into low-risk (n = 68) and high-risk (n = 62)
subgroups based on the median Gensini score. Baseline characteristics of both
groups are presented in Table 3. No statistically significant differences were
observed between the low-risk and high-risk groups across all evaluated
parameters (all p
| Variable | Low-Risk CHD (n = 68) | High-Risk CHD (n = 62) | p | |
| Male sex, n (%) | 42 (61.76%) | 45 (72.58%) | 1.714 | 0.190 |
| Smoking history, n (%) | 27 (39.71%) | 29 (46.77%) | 0.661 | 0.416 |
| Alcohol consumption, n (%) | 11 (16.18%) | 18 (29.03%) | 3.093 | 0.079 |
| Hypertension, n (%) | 42 (61.76%) | 35 (56.45%) | 0.379 | 0.538 |
| Age, years | 62.71 |
65.26 |
2.919 | 0.121 |
| Waist circumference, cm | 92.00 (85.00, 98.75) | 93.50 (85.00, 101.25) | –1.790 | 0.073 |
| Body mass index (BMI), kg/m2 | 24.80 |
25.09 |
5.626 | 0.642 |
| hs-CRP, mg/L | 1.13 (0.61, 2.94) | 1.51 (0.64, 4.18) | –1.325 | 0.185 |
| Total cholesterol, mmol/L | 4.25 (3.67, 5.21) | 4.54 (3.70, 5.29) | –0.905 | 0.366 |
| Triglycerides, mmol/L | 1.60 (1.13, 2.05) | 1.80 (1.23, 2.42) | –1.656 | 0.098 |
| HDL-C, mmol/L | 1.15 (0.91, 1.33) | 1.09 (0.87, 1.27) | –1.042 | 0.297 |
| LDL-C, mmol/L | 2.52 |
2.73 |
1.653 | 0.188 |
Flow cytometry was used to analyze the proportions of regulatory T cells (Tregs)
and GLP-1R+ Tregs in the low-risk and high-risk CHD groups. As shown in Fig. 3A, the proportion of Treg cells, determined by the coexpression of CD25 and
Foxp3, was 4.47% in the low-risk CHD group and 3.32% in the high-risk CHD
group. As shown in Fig. 3C, based on the expression of SSC and GLP-1R, the
proportion of GLP-1R+ Treg cells was 5.41% in the low-risk CHD group and
1.83% in the high-risk CHD group. Statistical analysis was conducted to evaluate
the differences in the proportions of Treg and GLP-1R+ Treg cells between
the two groups. The results revealed a significant difference in the proportion
of Treg cells between the low-risk CHD group and high-risk CHD group (p
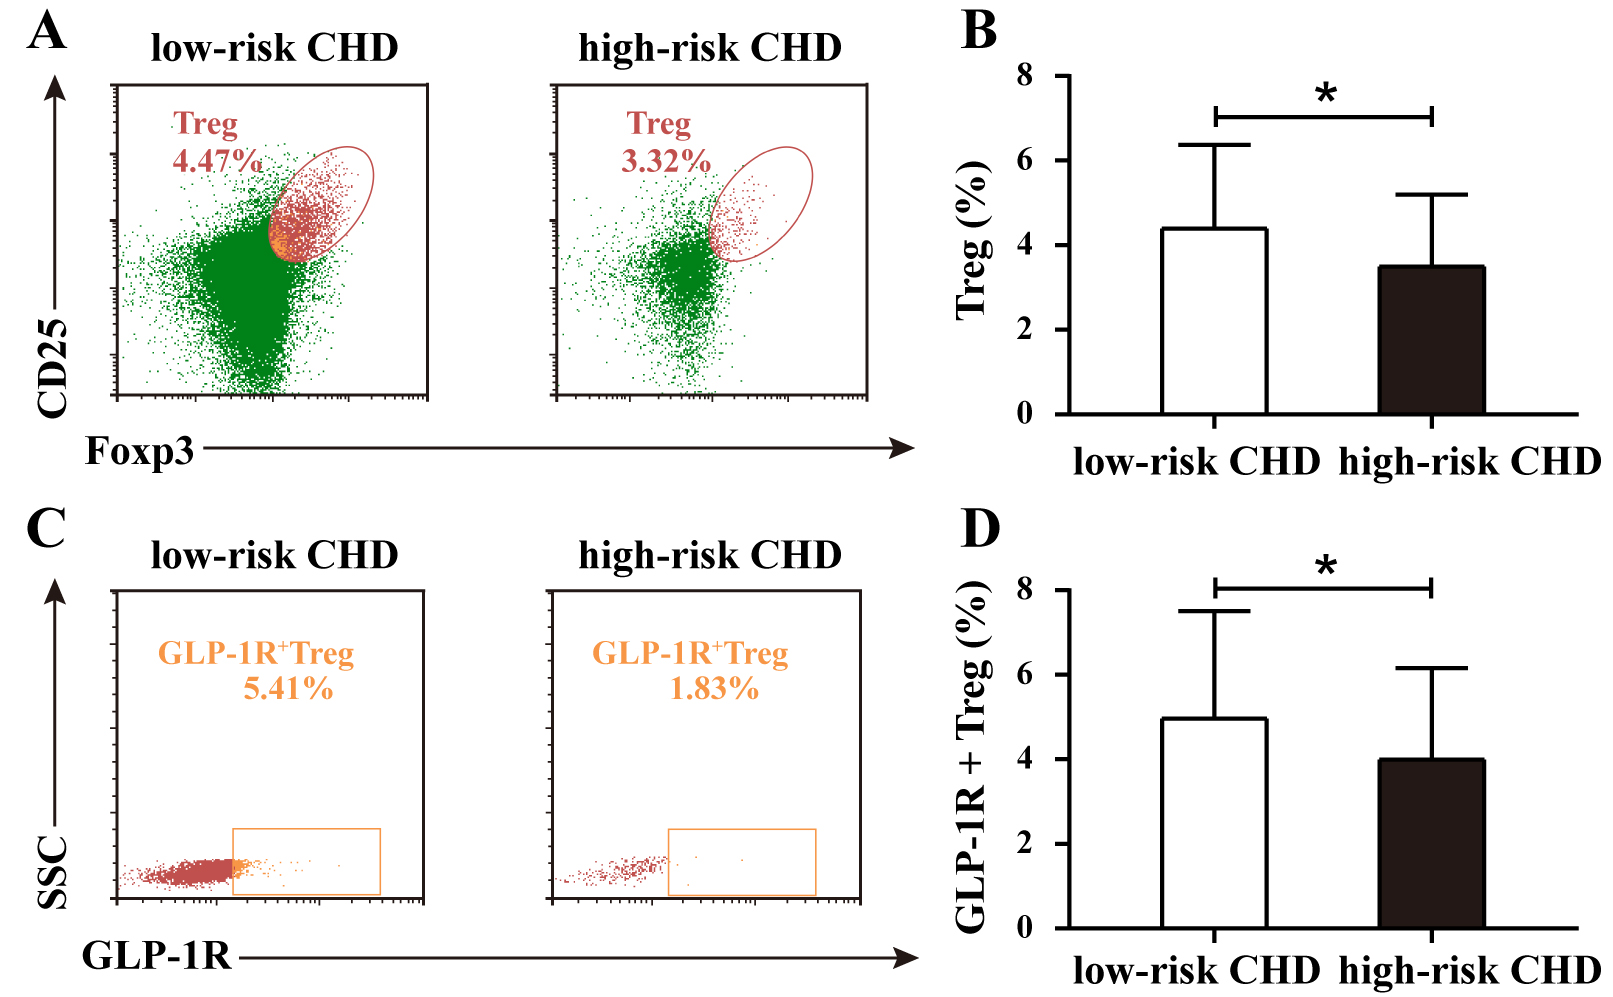 Fig. 3.
Proportions of Treg and GLP-1R+ Treg cells in low-risk and
high-risk CHD groups. (A) Representative flow cytometry plots of Treg
proportions in low-risk and high-risk CHD groups. (B) Comparative analysis of
Treg proportions between the low-risk CHD group and high-risk
CHD group. (C) Representative flow cytometry plots of GLP-1R+ Treg
proportions in low-risk and high-risk CHD groups. (D) Comparative analysis of
GLP-1R+ Treg cell proportions between groups. Data are expressed as the
means
Univariate analysis identified that Treg cell depletion was a significant predictor of advanced stenosis (OR: 0.762, p = 0.009). Multivariate adjustment for demographic and metabolic confounders preserved this association (adjusted OR: 0.760, p = 0.021) (Supplementary Table 2), highlighting the independent protective role of Treg cells. ROC analysis supported their discriminatory capacity (AUC: 0.635, 95% CI: 0.539–0.731) (Supplementary Fig. 3A), whereas RCS modeling revealed a nonlinear inverse relationship between Treg proportions and stenosis severity (Supplementary Fig. 3B), underscoring their therapeutic potential in halting atherosclerosis.
Univariate logistic regression revealed a protective role of GLP-1R+ Treg cells against coronary stenosis (OR: 0.840, p = 0.023). Multivariate adjustment for demographic and clinical confounders preserved this association (adjusted OR: 0.840, p = 0.040), underscoring GLP-1R signaling as a potential modulator of plaque stability. For detailed regression coefficients, refer to Table 4. ROC analysis demonstrated that the proportion of GLP-1R+ Tregs moderately predicted stenosis severity (AUC: 0.619, 95% CI: 0.521–0.717; Fig. 4A). RCS modeling further revealed a dose-dependent protective effect: each incremental increase in GLP-1R+ Treg proportions was correlated with attenuated stenosis severity (Fig. 4B), implicating GLP-1R signaling as a therapeutic target to decelerate coronary atherosclerosis.
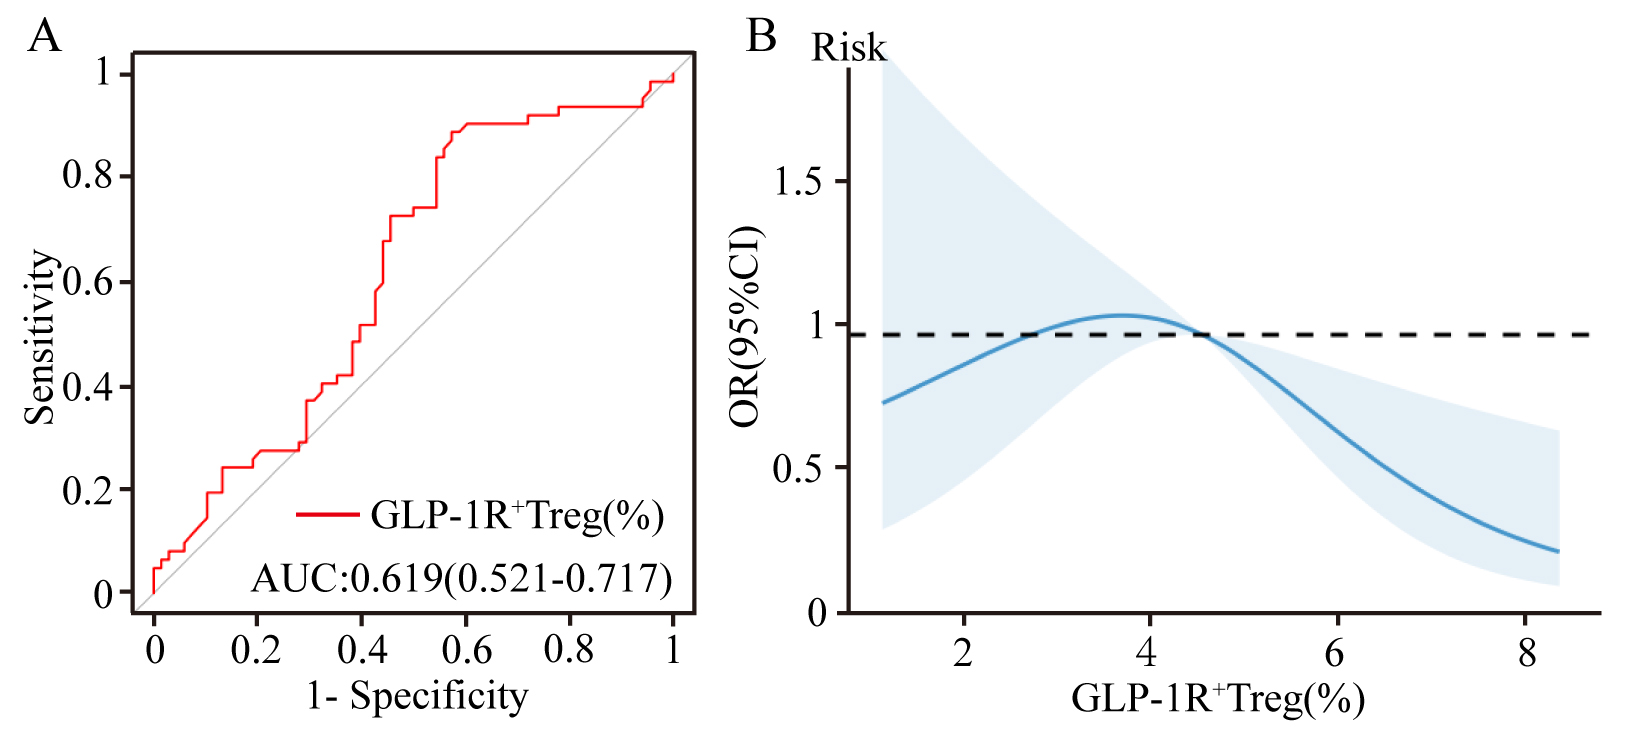 Fig. 4.
Predictive and dose-response relationship of GLP-1R+ Treg cells proportions with coronary stenosis severity. (A) ROC curve evaluating GLP-1R+ Treg cell proportions in predicting stenosis severity (AUC: 0.619). (B) Restricted cubic spline plot illustrating the inverse association between GLP-1R+ Treg proportions and stenosis severity. ROC, receiver operating characteristic; AUC, area under the curve.
| Variable | Univariate analysis | Multifactor analysis | ||||
| OR (95% CI) | p | OR (95% CI) | p | |||
| GLP-1R+ Treg | –0.174 | 0.840 (0.724, 0.976) | 0.023 | –0.174 | 0.840 (0.712, 0.992) | 0.040 |
| Sex | –0.494 | 0.610 (0.291, 1.282) | 0.172 | –0.362 | 0.697 (0.240, 2.026) | 0.507 |
| Smoking history | 0.289 | 1.334 (0.665, 2.677) | 0.417 | –0.136 | 0.872 (0.334, 2.282) | 0.781 |
| Alcohol history | 0.751 | 2.120 (0.909, 4.945) | 0.082 | 0.484 | 1.622 (0.593, 4.434) | 0.346 |
| Hypertension | –0.220 | 0.802 (0.398, 1.617) | 0.538 | –0.362 | 0.696 (0.310, 1.564) | 0.381 |
| Age | 0.030 | 1.030 (0.992, 1.070) | 0.122 | 0.062 | 1.064 (1.012, 1.119) | 0.015 |
| Waist circumference | 0.019 | 1.019 (0.983, 1.056) | 0.307 | –0.001 | 0.999 (0.945, 1.056) | 0.967 |
| Body mass index | 0.024 | 1.024 (0.928, 1.130) | 0.634 | 0.068 | 1.070 (0.922, 1.241) | 0.371 |
| hs-CRP | 0.033 | 1.034 (0.969, 1.103) | 0.315 | 0.032 | 1.032 (0.959, 1.110) | 0.398 |
| Total cholesterol | 0.175 | 1.191 (0.830, 1.710) | 0.343 | –0.294 | 0.745 (0.225, 2.471) | 0.631 |
| Triglycerides | 0.316 | 1.371 (0.941, 1.997) | 0.100 | 0.443 | 1.557 (0.896, 2.705) | 0.116 |
| HDL-C | –0.834 | 0.434 (0.121, 1.566) | 0.203 | –0.161 | 0.851 (0.155, 4.690) | 0.853 |
| LDL-C | 0.261 | 1.298 (0.880, 1.914) | 0.188 | 0.576 | 1.779 (0.531, 5.957) | 0.350 |
To investigate the regulatory role of GLP-1R+ Treg cells in cytokine
networks, correlation analyses were performed between their proportions and key
cytokine levels in the study cohort. A statistically significant negative
correlation was observed between GLP-1R+ Treg cells and interleukin-4 (IL-4)
levels (r = –0.150, p = 0.047; Fig. 5B), whereas a significant positive
correlation was detected with interleukin-35 (IL-35) levels (r = 0.185,
p = 0.016; Fig. 5E). No significant associations were found with other
cytokines, including interleukin-2 (IL-2; r = –0.003, p = 0.967; Fig. 5A), interleukin-6 (IL-6; r = 0.023, p = 0.759; Fig. 5C), interleukin-10
(IL-10; r = 0.030, p = 0.695; Fig. 5D), or tumor necrosis factor-alpha
(TNF-
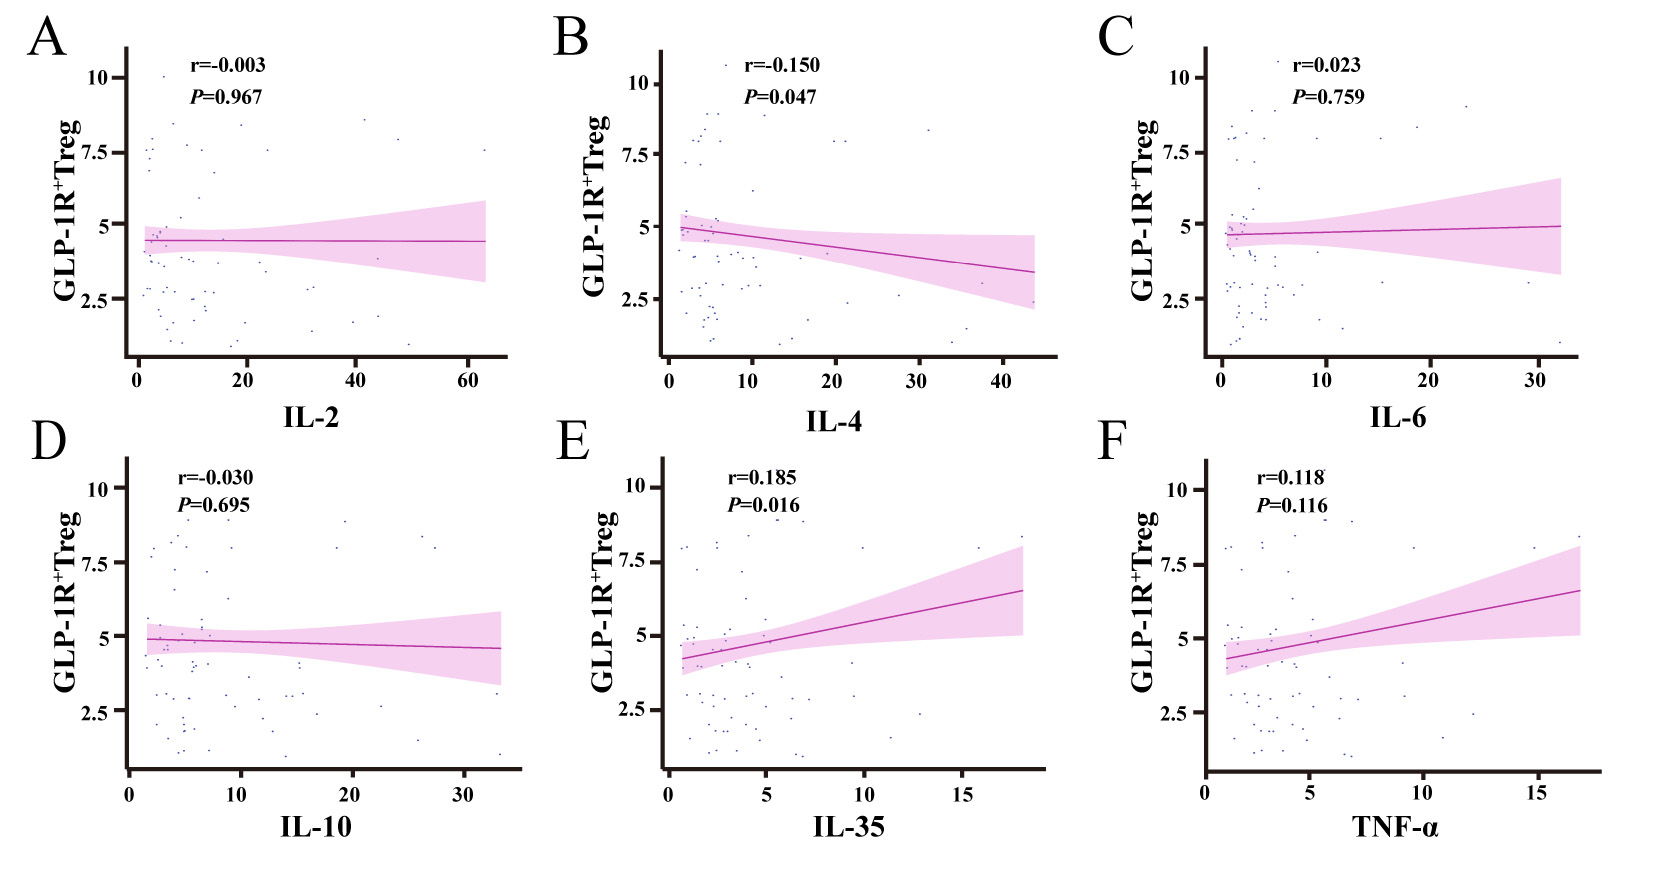 Fig. 5.
Correlation analysis between GLP-1R+ Treg cell proportions
and cytokine levels. (A) No significant correlation was observed between
GLP-1R+ Treg proportions and IL-2 levels (p
To our knowledge, this study is the first to demonstrate that reduced proportions of Treg cells and diminished GLP-1R expression on Treg cells are independently associated with an increased risk of CHD and greater coronary artery stenosis severity. Individuals with lower Treg cell levels and impaired GLP-1R signaling exhibited a significantly elevated risk of CHD incidence and accelerated plaque progression, highlighting their dual role as predictive biomarkers and pathogenic contributors.
Consistent with prior studies in chronic coronary syndrome [22], our findings revealed a significant reduction in circulating Treg cell proportions among CHD patients. This Treg deficiency was inversely associated with CHD risk, aligning with clinical evidence linking low Treg levels to heightened susceptibility to acute coronary syndrome [26]. Preclinical studies further corroborate these observations: Treg depletion exacerbates atherogenesis in hypercholesterolemic mice [27], whereas Treg expansion attenuates atherosclerotic plaque burden [28] and even induces plaque regression [29]. Collectively, these data support the hypothesis that elevated Treg cell levels may mitigate CHD risk by slowing atherosclerotic progression through immunomodulatory mechanisms.
Our study revealed a significant reduction in circulating GLP-1R+ Treg cell proportions among CHD patients compared with those of non-CHD controls, with lower GLP-1R+ Treg levels correlated inversely with CHD risk. Emerging evidence suggests that GLP-1R signaling plays a pivotal role in immune regulation [30]. Preclinical studies have demonstrated that GLP-1 receptor agonists (GLP-1RAs) enhance Treg cell frequency in obese diabetic mice [16] and high-fat diet-induced models [24]. Notably, GlP-1R-/- mice exhibit markedly reduced Treg proportions in lymph nodes and peripheral blood compared those in wild-type (GlP-1R+/+) littermates, underscoring the necessity of intact GLP-1R signaling for Treg homeostasis and immunosuppressive function [21]. These findings collectively imply that elevated GLP-1R expression on Treg cells may confer protection against CHD by modulating both Treg abundance and functional efficacy. Both univariate and multivariate logistic regression analyses demonstrated that reduced proportions of Treg cells and diminished GLP-1R expression on Treg cells were independently associated with increased coronary artery stenosis severity in CHD patients. ROC curve analysis further confirmed the moderate discriminatory capacity of Treg proportions and GLP-1R+ Treg levels for stenosis severity. RCS models revealed a nonlinear inverse dose-response relationship: individuals with lower Treg proportions or impaired GLP-1R signaling exhibited significantly aggravated stenosis. Based on these findings, it can be hypothesized that GLP-1RA may play a potential role in CHD by partially activating GLP-1R on the surface of Treg cells, which in turn affects the number and function of Treg cells. Therefore, more in-depth studies are necessary to verify whether GLP-1R+ Tregs may serve as modifiable immunotherapeutic targets for CHD.
The progressive decline in Treg cell levels during coronary plaque progression may arise from multiple mechanisms: (1) Impaired Treg Generation: Dysfunctional thymic Treg production and metabolic reprogramming induced by hyperlipidemia [31]. (2) Enhanced Apoptosis: oxidative stress [32] or epigenetic dysregulation of Foxp3 [33] increased susceptibility to apoptosis [34]. (3) Phenotypic Shifts: Altered immunosuppressive capacity of Tregs in advanced atherosclerosis [11, 35]. Severe coronary stenosis exacerbates myocardial ischemia, triggering inflammatory activation and reactive oxygen species (ROS) overproduction [36]. Conversely, GLP-1R activation counteracts these pathways by suppressing pro-inflammatory cytokines and enhancing antioxidant defenses [20, 37], suggesting a feedback loop where GLP-1R+ Treg loss amplifies plaque instability.
Treg cells exert immunosuppressive effects via cell-cell contact and secretion
of inhibitory cytokines, including interleukin-10 (IL-10) [38, 39], IL-35 [40],
and transforming growth factor-beta (TGF-
This study has several limitations. First, the relatively small sample size may introduce selection bias and limit the generalizability of our findings. Second, the cross-sectional design precludes causal inference between Treg cell proportions, GLP-1R+ Treg levels, and CHD risk or stenosis severity. Future large-scale, multicenter prospective cohort studies are warranted to validate these associations. Moreover, the use of single-time-point blood samples may not fully capture the dynamic changes in Treg cell populations and their GLP-1R expression over time. Longitudinal studies with repeated measurements would be valuable to address this limitation. Finally, our analysis focused on circulating Treg cells rather than plaque-infiltrating Treg populations, which may exhibit distinct GLP-1R expression patterns and functional dynamics. Despite these limitations, our study provides important insights into the potential role of Treg cells and GLP-1R signaling in CHD pathogenesis and highlights the need for further investigation in this area.
This study demonstrates that reduced levels of Treg cells and diminished GLP-1R expression on Treg cells are closely associated with the incidence of CHD and independently correlated with the severity of coronary artery stenosis. The GLP-1R signaling pathway in Treg cells may hold potential as a novel immunomodulatory therapeutic target for CHD, offering a dual strategy to mitigate both metabolic dysfunction and inflammatory plaque progression.
The datasets used and analyzed during the current study are available from the corresponding author on reasonable request.
MZL and JC designed the research study. MZL and JC participated in the drafting of the manuscript and the critical revision of important intellectual content. MY, XLL, KW, TY, HQ, LC, WWW, XWM, HDY and HX performed the research, interpreted the relevant literatures and contributed to the manuscript writing. AHM and MMY made significant contributions to data acquisition, analysis, and interpretation. MZL, JC, MMY and AHM revised content of the article and finalized the manuscript. All authors read and approved the final manuscript. All authors have participated sufficiently in the work and agreed to be accountable for all aspects of the work.
The study was carried out in accordance with the guidelines of the Declaration of Helsinki and approved by the Ethics Committee of Sinopharm Dongfeng General Hospital, Hubei University of Medicine, Shiyan, China in compliance with the Declaration of Helsinki. (Approval No. LW-2024-049). All participants provided informed consent.
Not applicable.
This work was supported by the Innovative Research Program for Graduates of Hubei University of Medicine (No. YC2023029), the Faculty Development Grants from Hubei University of Medicine (2018QDJZR04), Hubei Key Laboratory of Wudang Local Chinese Medicine Research (Hubei University of Medicine) (Grant No. WDCM2024020), and Advantages Discipline Group (Medicine) Project in Higher Education of Hubei Province (2021–2025) (Grant No. 2025XKQT41).
The authors declare no conflict of interest.
Supplementary material associated with this article can be found, in the online version, at https://doi.org/10.31083/RCM39927.
References
Publisher’s Note: IMR Press stays neutral with regard to jurisdictional claims in published maps and institutional affiliations.