


 , Yanting Pang 1,2,†, Yiqiu Yang 2,3, Jun Teng 2,4,*
 , Qian Lin 1,*
1 Department of Cardiology, Dongzhimen Hospital, Beijing University of Chinese Medicine, 100700 Beijing, China
2 Graduate School, Beijing University of Chinese Medicine, 100029 Beijing, China
3 Department of Hematology and Oncology, Dongzhimen Hospital, Beijing University of Chinese Medicine, 100700 Beijing, China
4 Respiratory Disease Center, Dongzhimen Hospital, Beijing University of Chinese Medicine, 100700 Beijing, China
†These authors contributed equally.
Abstract
Immunotherapy has redefined the treatment era for metastatic non-small cell lung cancer (NSCLC); therefore, this study aimed to explore trends in survival and cardiovascular disease (CVD) mortality risk before and after the widespread adoption of immunotherapy.
This research utilized information from the Surveillance, Epidemiology, and End Results (SEER) program of the National Cancer Institute and the Wide-Ranging Online Data for Epidemiologic Research (CDC-WONDER) database from the Centers for Disease Control and Prevention. The study population comprised patients with metastatic NSCLC from the pre- (2011–2014) and post-immunotherapy (2016–2019) periods. Survival determinants and CVD mortality trends were analyzed using propensity score matching, Kaplan–Meier survival analyses, competing risk models, and accelerated failure time (AFT) models.
A total of 78,028 metastatic NSCLC patients were enrolled in the study, with significant improvements noted in overall survival (OS) and cancer-specific survival (CSS) in the later stages of immunotherapy. The AFT model analysis identified treatment modality, pathological subtype, metastatic site, and some non-medical factors as survival determinants. The interaction analyses revealed that the survival differences among certain subgroups intensified in the post-immunotherapy period. Despite the lack of significant differences in CVD mortality and subgroup composition between the two periods, CVD mortality risk remained high compared with the general U.S. population.
Survival of patients with metastatic NSCLC has improved significantly since the introduction of immunotherapy. However, survival differences between some subpopulations continue to intensify, while CVD mortality risk also remains a key concern.
Keywords
- non-small cell lung cancer
- SEER database
- immunotherapy
- cardiovascular mortality risk
- accelerated failure time model
- CDC-WONDER database
Lung cancer remains the leading cause of cancer-related mortality in the United States, accounting for an estimated 125,070 deaths in 2024 alone, with non-small cell lung cancer (NSCLC) comprising approximately 85% of all cases [1, 2]. Despite advancements in early screening and diagnostic strategies, the incidence of advanced and metastatic NSCLC remains substantial [3, 4]. A major turning point in NSCLC treatment occurred with the approval and integration of immune checkpoint inhibitors (ICIs) into clinical practice around 2015, which has since transformed the therapeutic landscape and extended survival in select patient populations [5]. However, the degree of benefit from these therapeutic advances appears to vary across subgroups, underscoring the importance of understanding survival determinants in the evolving treatment era.
Survival outcomes in metastatic NSCLC are influenced by a range of clinical and non-clinical factors. Clinical variables such as age, sex, tumor histology, metastatic sites, and treatment modalities (e.g., chemotherapy, radiotherapy) are well-documented contributors to prognosis [6]. Equally important, yet less frequently studied in temporal contexts, are non-medical factors including race, socioeconomic status, marital status, and geographic location [7, 8]. These determinants may interact with medical care access, treatment adherence, and psychosocial support, contributing to outcome disparities. Given the dynamic nature of both therapeutic innovation and health equity over time, investigating how these determinants evolve across distinct treatment eras is crucial for optimizing care strategies in metastatic NSCLC.
In addition to survival disparities, emerging treatment-related toxicities—particularly cardiovascular disease (CVD)—have raised new concerns in the immunotherapy era [9, 10]. CVD in this population may stem from both shared risk profiles (e.g., aging, smoking) and therapy-induced cardiotoxicity [11, 12]. Although some studies have assessed CVD mortality risk across treatment modalities, their scope has often been limited by short follow-up periods and narrow population subsets [13, 14, 15]. Therefore, leveraging real-world data to evaluate trends in both survival determinants and CVD mortality before and after the adoption of immunotherapy can offer valuable insights for patient stratification and long-term care planning. The present study aims to (1) examine the temporal evolution of survival determinants in metastatic NSCLC and (2) update the evidence on CVD mortality risk using data from the Surveillance, Epidemiology, and End Results (SEER) Program and the Centers for Disease Control and Prevention Wide-Ranging Online Data for Epidemiologic Research (CDC-WONDER) databases.
This study employed the November 2022 Submission dataset from the SEER Program, US National Cancer Institute, to aggregate population-based cancer data across 17 registries, covering about 26.5% of the US population. Heart disease mortality data for the US populace were derived from the CDC-WONDER database (underlying cause of death, 1999–2020). The Ethics Committee of Dongzhimen Hospital, Beijing University of Chinese Medicine granted the ethical exemption, citing the anonymization and public availability of the data from both databases.
Employing the International Classification of Diseases for Oncology, Third Edition (ICD-O-3) as delineated in Supplementary Table 1, this research identified individuals with a single primary NSCLC in the SEER database across pre- (2011–2014) and post-immunotherapy (2016–2019) periods, totaling 204,038 patients. Cohorts were categorized by immunotherapy period, adhering to consistent exclusion criteria: Tumor, Node, Metastasis (TNM) stages I–III or unspecified, surgical treatment, unrecorded or zero survival months, and ages outside 18–84 (Supplementary Fig. 1). For comparative analysis, CVD mortality data for the U.S. population aged 18–84 were extracted from the CDC-WONDER database for 2011–2014 and 2016–2019, respectively, to match the pre- and post-immunotherapy periods in the SEER NSCLC cohort and minimize year- and population-related bias.
The extracted demographic and clinical parameters encompassed age (18–84
years), sex (female, male), race (white, black, other), laterality (left, right,
other), pathology subtype (lung adenocarcinoma (LUAD), lung squamous cell
carcinoma (LUSC), other), metastasis site (bone, brain, liver, lung), therapeutic
approaches (radiotherapy, chemotherapy), marital status (married, other), median
household income (
Our investigation’s primary outcomes of interest were overall survival (OS) and cancer-specific survival (CSS), alongside assessing cardiovascular risk across pre- and post-immunotherapy periods through the lens of CVD mortality. OS refers to the time from diagnosis to any-cause death, CSS to cancer-caused death, and Survival Time to the period from diagnosis to death or last follow-up (December 31, 2020). CVD mortality was determined based on the underlying cause of death recorded in death certificates, as documented in the SEER and CDC-WONDER databases and classified according to ICD-10 codes, including diseases of the heart (I01–I02, I05–I09, I20–I28, I30–I52), hypertension without heart disease (I10–I15), cerebrovascular diseases (I60–I69), other diseases of arteries, arterioles, and capillaries (I70–I78), and other unspecified disorders of the circulatory system (I95–I99) [16].
Continuous variables were described using mean
Given that several covariates violated the proportional hazards assumption (as
assessed by Schoenfeld residuals and visual inspection), we adopted an
accelerated failure time (AFT) model to evaluate survival duration. Among tested
distributions (lognormal, Weibull, exponential), the lognormal AFT model provided
the best fit, based on the lowest Akaike Information Criterion (AIC) and Bayesian
Information Criterion (BIC) values (Supplementary Fig. 2, Supplementary
Table 2). This model facilitates interpretation beyond the constraints of the
proportional hazards assumption. In this context, the exponentiated coefficients
are expressed as time ratios (TRs), which quantify how a given covariate alters
the predicted survival duration. Specifically, a TR
CVD mortality age distribution disparities necessitated the computation of a
weighted mean for CVD mortality, adjusting for age distribution weights to
furnish an accurate CVD death risk comparison in NSCLC patients versus the
general U.S. population. R (version 4.5.1; R Core Team, R Foundation for
Statistical Computing, Vienna, Austria) was used for all statistical
computations, employing two-sided tests and considering p
A total of 78,028 patients with single primary stage IV NSCLC were included,
with an average age of (66.1
| Variables | Original Data | PSM Data | |||||||||
| Pre | Post | Total | Test Statistic | p value | Pre | Post | Test Statistic | p value | SMD | ||
| n = 40,135 | n = 37,893 | n = 78,028 | (t, χ2)* | n = 33,481 | n = 33,481 | (t, χ2) | |||||
| Age (mean (SD)) | 65.8 (10.3) | 66.5 (10.0) | 66.1 (10.2) | –10.366 | 66.0 (10.3) | 66.2 (10.0) | –2.493 | 0.013 | 0.019 | ||
| Sex (%) | 13.217 | 0.001 | 0.981 | ||||||||
| Female | 18,034 (44.9) | 17,519 (46.2) | 35,553 (45.6) | 15,251 (45.6) | 15,255 (45.6) | ||||||
| Male | 22,101 (55.1) | 20,374 (53.8) | 42,475 (54.4) | 18,230 (54.4) | 18,226 (54.4) | ||||||
| Race (%) | 137.290 | 1.996 | 0.369 | 0.011 | |||||||
| White | 30,917 (77.0) | 28,193 (74.4) | 59,110 (75.8) | 25,312 (75.6) | 25,408 (75.9) | ||||||
| Black | 5206 (13.0) | 4916 (13.0) | 10,122 (13.0) | 4469 (13.3) | 4346 (13.0) | ||||||
| Others | 4012 (10.0) | 4784 (12.6) | 8796 (11.3) | 3700 (11.1) | 3727 (11.1) | ||||||
| Laterality (%) | 16.562 | 4.468 | 0.107 | 0.016 | |||||||
| Left | 15,388 (38.3) | 14,671 (38.7) | 30,059 (38.5) | 12,965 (38.7) | 12,948 (38.7) | ||||||
| Right | 21,788 (54.3) | 20,710 (54.7) | 42,498 (54.5) | 18,063 (54.0) | 18,215 (54.4) | ||||||
| Others | 2959 (7.4) | 2512 (6.6) | 5471 (7.0) | 2453 (7.3) | 2318 (6.9) | ||||||
| Hist (%) | 456.779 | 39.995 | 0.049 | ||||||||
| LUAD | 24,324 (60.6) | 25,321 (66.8) | 49,645 (63.6) | 20,943 (62.6) | 21,612 (64.6) | ||||||
| LUSC | 7628 (19.0) | 6931 (18.3) | 14,559 (18.7) | 6401 (19.1) | 6313 (18.9) | ||||||
| Others | 8183 (20.4) | 5641 (14.9) | 13,824 (17.7) | 6137 (18.3) | 5556 (16.6) | ||||||
| Radiation (%) | 25.063 | 0.850 | 0.357 | 0.007 | |||||||
| No/Unknown | 20,912 (52.1) | 20,423 (53.9) | 41,335 (53.0) | 17,809 (53.2) | 17,929 (53.5) | ||||||
| Yes | 19,223 (47.9) | 17,470 (46.1) | 36,693 (47.0) | 15,672 (46.8) | 15,552 (46.5) | ||||||
| Chemotherapy (%) | 117.901 | 3.390 | 0.066 | 0.014 | |||||||
| No/Unknown | 15,541 (38.7) | 16,121 (42.5) | 31,662 (40.6) | 13,491 (40.3) | 13,726 (41.0) | ||||||
| Yes | 24,594 (61.3) | 21,772 (57.5) | 46,366 (59.4) | 19,990 (59.7) | 19,755 (59.0) | ||||||
| DX.bone (%) | 116.474 | 2.277 | 0.131 | 0.012 | |||||||
| No/Unknown | 24,424 (60.9) | 21,618 (57.1) | 46,042 (59.0) | 19,878 (59.4) | 19,685 (58.8) | ||||||
| Yes | 15,711 (39.1) | 16,275 (42.9) | 31,986 (41.0) | 13,603 (40.6) | 13,796 (41.2) | ||||||
| DX.brain (%) | 61.455 | 1.331 | 0.249 | 0.009 | |||||||
| No/Unknown | 28,959 (72.2) | 26,374 (69.6) | 55,333 (70.9) | 23,951 (71.5) | 23,815 (71.1) | ||||||
| Yes | 11,176 (27.8) | 11,519 (30.4) | 22,695 (29.1) | 9530 (28.5) | 9666 (28.9) | ||||||
| DX.liver (%) | 2.326 | 0.127 | 2.841 | 0.092 | 0.013 | ||||||
| No/Unknown | 33,098 (82.5) | 31,090 (82.0) | 64,188 (82.3) | 27,423 (81.9) | 27,591 (82.4) | ||||||
| Yes | 7037 (17.5) | 6803 (18.0) | 13,840 (17.7) | 6058 (18.1) | 5890 (17.6) | ||||||
| DX.lung (%) | 0.825 | 0.364 | 1.272 | 0.259 | 0.009 | ||||||
| No/Unknown | 28,101 (70.0) | 26,645 (70.3) | 54,746 (70.2) | 23,302 (69.6) | 23,437 (70.0) | ||||||
| Yes | 12,034 (30.0) | 11,248 (29.7) | 23,282 (29.8) | 10,179 (30.4) | 10,044 (30.0) | ||||||
| MaritalStatus (%) | 0.000 | 0.993 | 0.174 | 0.676 | 0.003 | ||||||
| Married | 20,601 (51.3) | 19,448 (51.3) | 40,049 (51.3) | 17,207 (51.4) | 17,152 (51.2) | ||||||
| Others | 19,534 (48.7) | 18,445 (48.7) | 37,979 (48.7) | 16,274 (48.6) | 16,329 (48.8) | ||||||
| Income (%) | 1677.066 | 38.447 | 0.048 | ||||||||
| USD 50,000- | 6919 (17.2) | 4831 (12.7) | 11,750 (15.1) | 5298 (15.8) | 4820 (14.4) | ||||||
| USD 50,000–USD 75,000 | 21,620 (53.9) | 16,830 (44.4) | 38,450 (49.3) | 16,720 (49.9) | 16,596 (49.6) | ||||||
| USD 75,000+ | 11,596 (28.9) | 16,232 (42.8) | 27,828 (35.7) | 11,463 (34.2) | 12,065 (36.0) | ||||||
| County (%) | 1.079 | 0.299 | 0.761 | 0.383 | 0.007 | ||||||
| Metropolitan | 34,076 (84.9) | 32,274 (85.2) | 11,678 (15.0) | 28,286 (84.5) | 28,203 (84.2) | ||||||
| Nonmetropolitan | 6059 (15.1) | 5619 (14.8) | 66,350 (85.0) | 5195 (15.5) | 5278 (15.8) | ||||||
*t test for continuous variables, Pearson’s
Before PSM, Kaplan-Meier survival analysis revealed that patients in the
pre-immunotherapy period experienced significantly declined OS compared to those
in the post-immunotherapy period (p
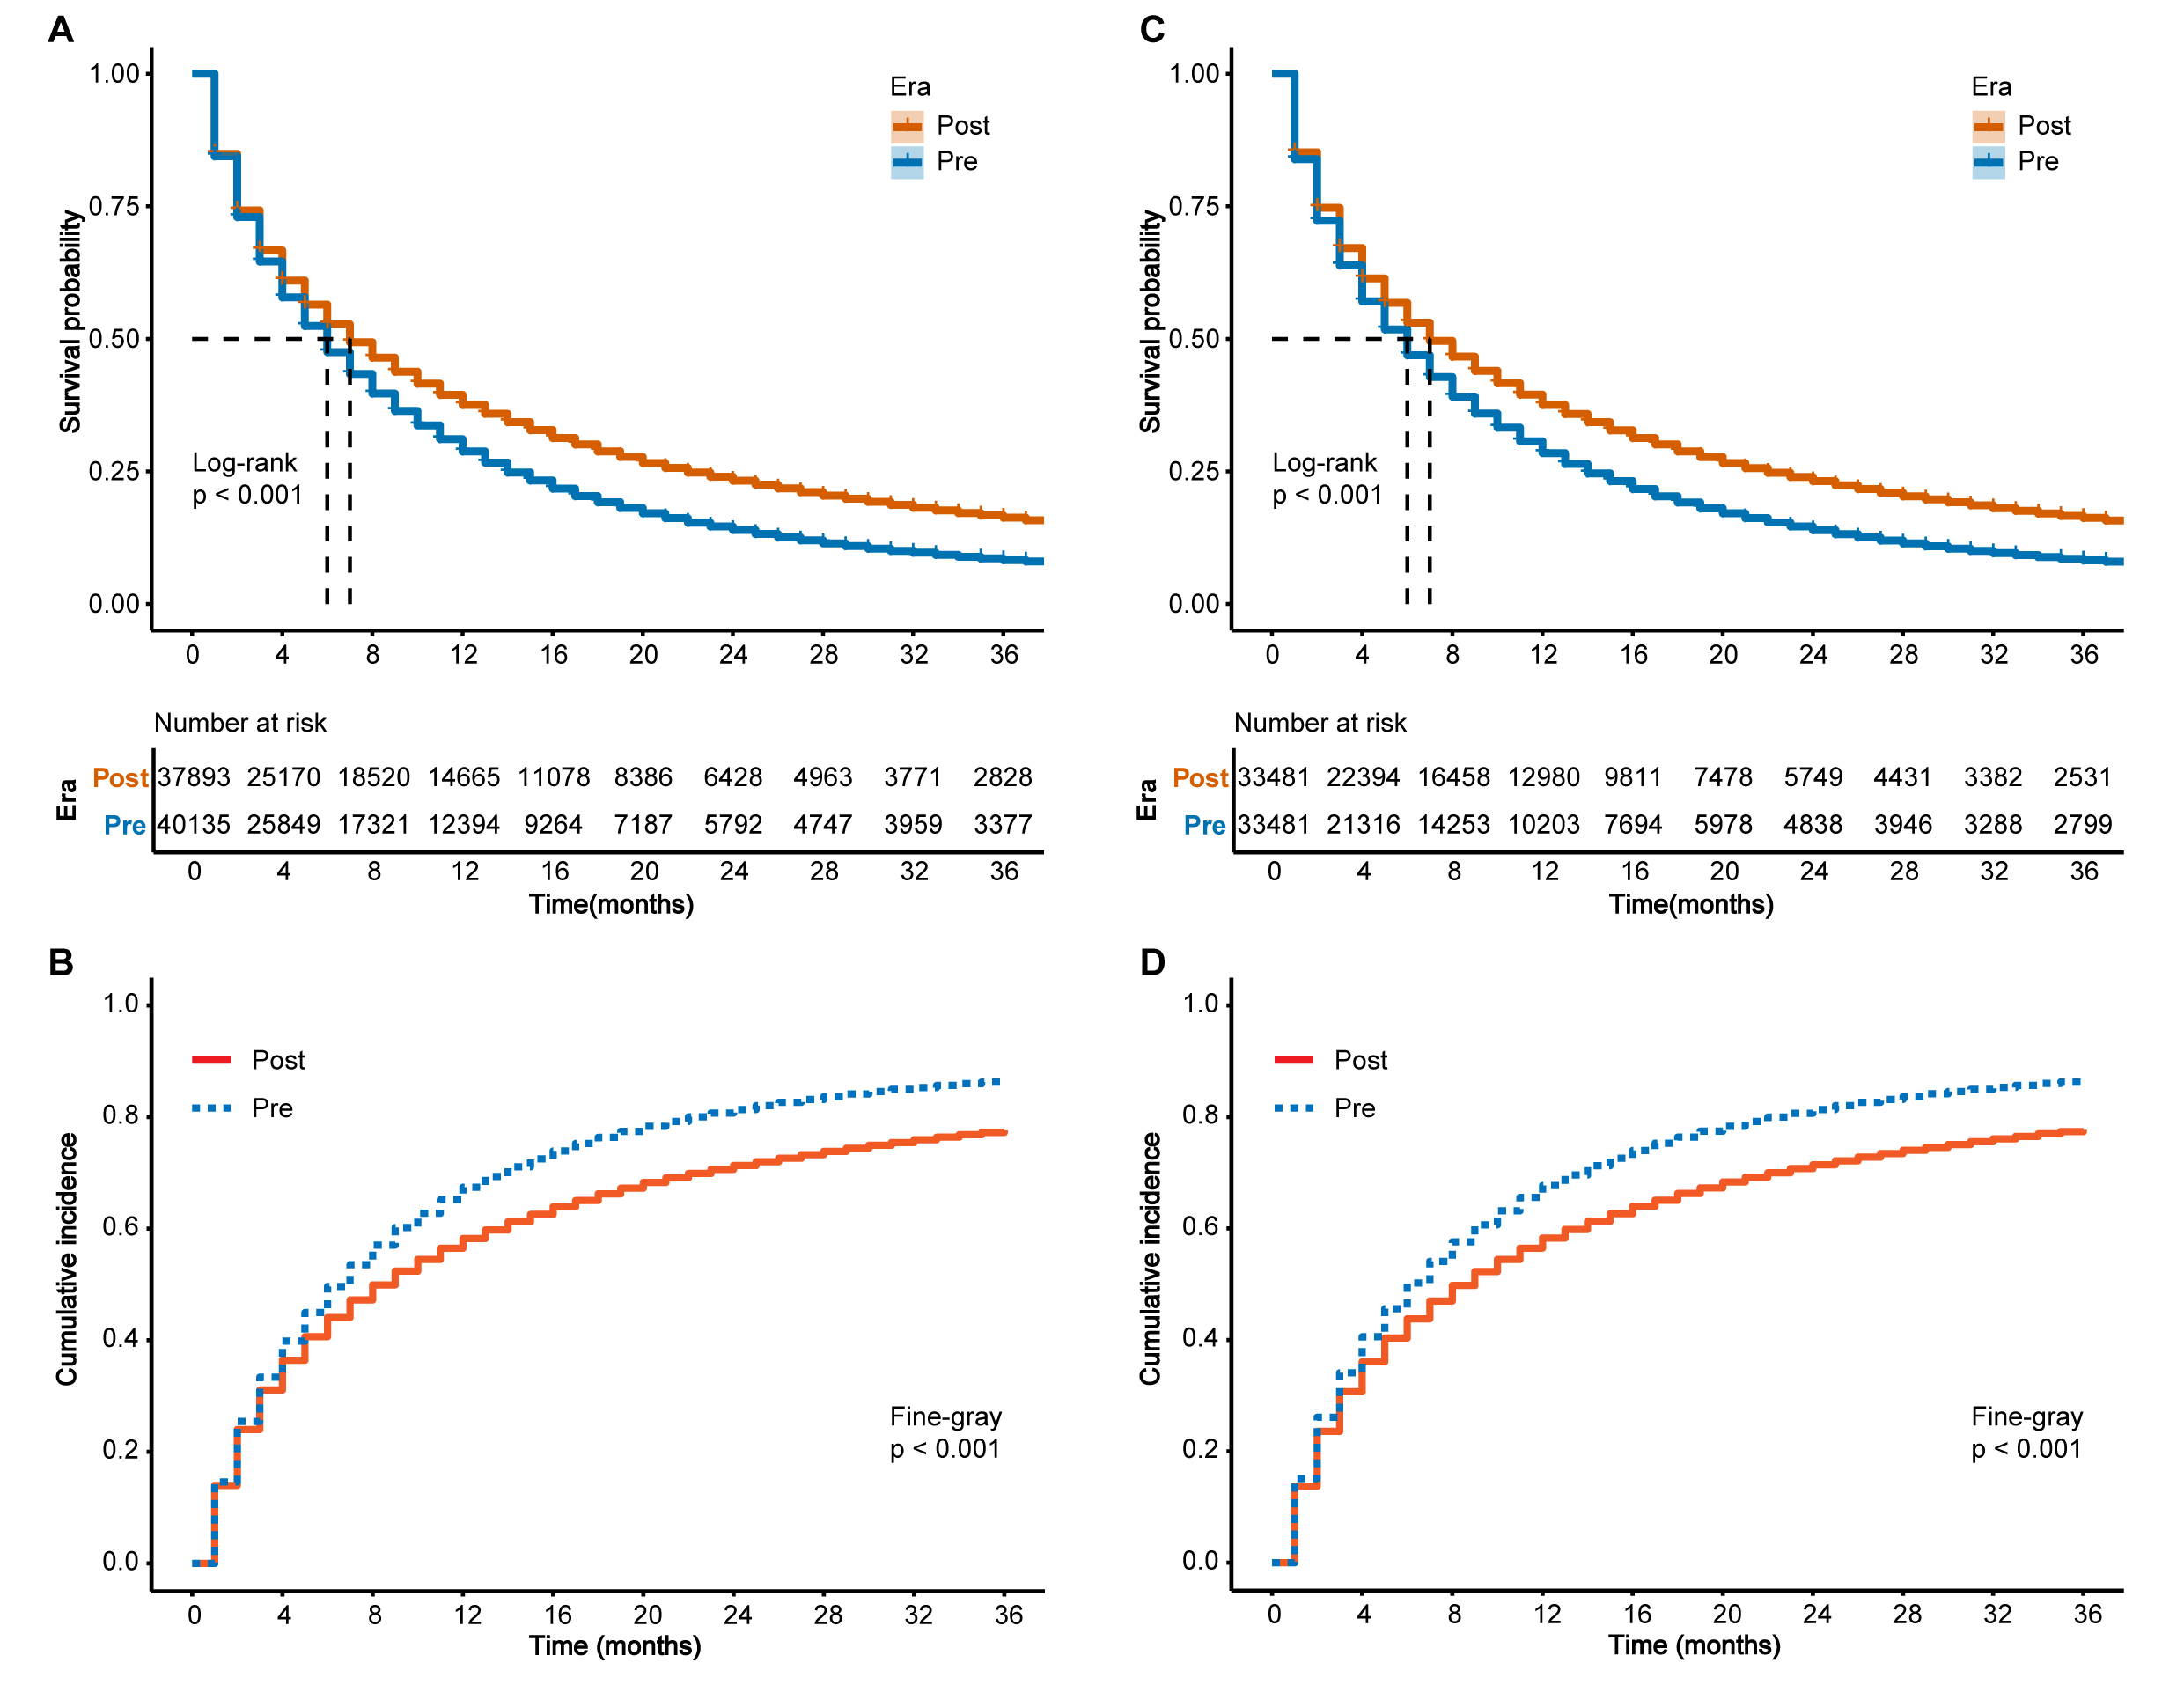 Fig. 1.
Kaplan–Meier survival curves and competing risk models in patients with metastatic non-small cell lung cancer (NSCLC), before and after propensity score matching (PSM). (A) Kaplan–Meier curves for overall survival (OS) before PSM. (B) Competing risk model for cancer-specific survival (CSS) before PSM. (C) Kaplan–Meier curves for OS after PSM. (D) Competing risk model for CSS after PSM. Log-rank and Fine–Gray tests were used to assess statistical significance. Pre, pre-immunotherapy period; Post, post-immunotherapy period.
Univariate and multivariate AFT analyses on post-PSM data for OS and CSS (Tables 2,3) revealed significant factors affecting survival: age, period, sex, race,
laterality, pathology subtype, treatment approaches (radiotherapy, chemotherapy),
metastasis site (bone, brain, liver), marital status, median household income,
and geographic location of residence (p
| Variables | Univariable | Multivariable | |||||||||||
| Estimate | Std.Err. | Z value | TR | 95% CI | p value | Estimate | Std.Err. | Z value | TR | 95% CI | p value | ||
| Age | –0.019 | 0.001 | –38.163 | 0.981 | 0.980, 0.982 | –0.012 | 0.000 | –24.879 | 0.988 | 0.988, 0.989 | |||
| Era | |||||||||||||
| Post | 0.240 | 0.010 | 22.938 | 1.271 | 1.245, 1.297 | 0.238 | 0.009 | 26.281 | 1.269 | 1.247, 1.292 | |||
| Sex | |||||||||||||
| Male | –0.267 | 0.010 | –25.536 | 0.766 | 0.750, 0.782 | –0.239 | 0.009 | –25.730 | 0.788 | 0.773, 0.802 | |||
| Race | |||||||||||||
| Black | –0.044 | 0.015 | –2.829 | 0.957 | 0.929, 0.987 | 0.005 | 0.002 | 0.014 | 0.154 | 1.002 | 0.975, 1.030 | 0.877 | |
| Others | 0.487 | 0.017 | 28.840 | 1.628 | 1.575, 1.683 | 0.337 | 0.015 | 22.315 | 1.401 | 1.360, 1.443 | |||
| Laterality | |||||||||||||
| Right | –0.024 | 0.011 | –2.220 | 0.976 | 0.955, 0.997 | 0.026 | –0.037 | 0.010 | –3.836 | 0.964 | 0.946, 0.982 | ||
| Others | –0.150 | 0.021 | –7.041 | 0.861 | 0.826, 0.898 | –0.073 | 0.019 | –3.959 | 0.929 | 0.896, 0.964 | |||
| Hist | |||||||||||||
| LUSC | –0.357 | 0.014 | –26.427 | 0.700 | 0.682, 0.719 | –0.222 | 0.012 | –18.209 | 0.801 | 0.782, 0.821 | |||
| Others | –0.354 | 0.014 | –25.314 | 0.702 | 0.683, 0.722 | –0.194 | 0.012 | –15.758 | 0.824 | 0.804, 0.844 | |||
| Radiation | |||||||||||||
| Yes | 0.081 | 0.010 | 7.726 | 1.084 | 1.062, 1.107 | 0.072 | 0.010 | 7.037 | 1.075 | 1.054, 1.097 | |||
| Chemotherapy | |||||||||||||
| Yes | 1.126 | 0.010 | 117.563 | 3.083 | 3.026, 3.141 | 1.028 | 0.010 | 107.262 | 2.796 | 2.744, 2.849 | |||
| DX.bone | |||||||||||||
| Yes | –0.288 | 0.011 | –27.262 | 0.750 | 0.735, 0.766 | –0.328 | 0.010 | –34.230 | 0.721 | 0.707, 0.734 | |||
| DX.brain | |||||||||||||
| Yes | –0.149 | 0.012 | –12.903 | 0.862 | 0.843, 0.881 | –0.248 | 0.011 | –22.156 | 0.780 | 0.763, 0.797 | |||
| DX.liver | |||||||||||||
| Yes | –0.445 | 0.013 | –33.009 | 0.641 | 0.624, 0.658 | –0.366 | 0.012 | –30.575 | 0.693 | 0.677, 0.710 | |||
| DX.lung | |||||||||||||
| Yes | –0.003 | 0.011 | –0.284 | 0.997 | 0.975, 1.019 | 0.777 | — | — | — | — | — | — | |
| MaritalStatus | |||||||||||||
| Others | –0.221 | 0.010 | –21.203 | 0.802 | 0.786, 0.818 | –0.121 | 0.009 | –12.982 | 0.886 | 0.870, 0.902 | |||
| Income | |||||||||||||
| USD 50,000–USD 75,000 | 0.156 | 0.015 | 10.238 | 1.168 | 1.134, 1.204 | 0.051 | 0.015 | 3.334 | 1.053 | 1.021, 1.085 | |||
| USD 75,000+ | 0.382 | 0.016 | 23.911 | 1.465 | 1.420, 1.511 | 0.135 | 0.017 | 7.911 | 1.145 | 1.107, 1.184 | |||
| County | |||||||||||||
| Metropolitan | 0.192 | 0.014 | 13.435 | 1.212 | 1.179, 1.247 | 0.063 | 0.015 | 4.203 | 1.065 | 1.034, 1.097 | |||
Abbreviations: OS, overall survival; AFT, accelerated failure time; Std.Err., Standard Error; TR, time ratio; CI, confidence interval; LUAD, lung adenocarcinoma; LUSC, lung squamous cell carcinoma; PSM, propensity score matching; Hist, histology; DX, diagnosis of metastasis; Post, post-immunotherapy period.
| Variables | Univariable | Multivariable | |||||||||||
| Estimate | Std.Err. | Z value | TR | 95% CI | p value | Estimate | Std.Err. | Z value | TR | 95% CI | p value | ||
| Age | –0.019 | 0.001 | –35.198 | 0.982 | 0.981, 0.983 | –0.011 | 0.000 | –22.761 | 0.989 | 0.988, 0.990 | |||
| Era | |||||||||||||
| Post | 0.257 | 0.011 | 23.706 | 1.293 | 1.266, 1.321 | 0.255 | 0.009 | 27.084 | 1.290 | 1.267, 1.314 | |||
| Sex | |||||||||||||
| Male | –0.261 | 0.011 | –24.079 | 0.770 | 0.754, 0.787 | –0.232 | 0.010 | –24.132 | 0.793 | 0.778, 0.808 | |||
| Race | |||||||||||||
| Black | –0.031 | 0.016 | –1.913 | 0.970 | 0.940, 1.001 | 0.056 | 0.010 | 0.014 | 0.721 | 1.010 | 0.982, 1.040 | 0.471 | |
| Others | 0.503 | 0.018 | 28.658 | 1.654 | 1.598, 1.712 | 0.350 | 0.016 | 22.347 | 1.420 | 1.377, 1.464 | |||
| Laterality | |||||||||||||
| Right | –0.027 | 0.011 | –2.354 | 0.974 | 0.952, 0.996 | 0.019 | –0.039 | 0.010 | –3.933 | 0.962 | 0.943, 0.981 | ||
| Others | –0.146 | 0.022 | –6.621 | 0.864 | 0.827, 0.902 | –0.069 | 0.019 | –3.611 | 0.933 | 0.898, 0.969 | |||
| Hist | |||||||||||||
| LUSC | –0.352 | 0.014 | –25.150 | 0.703 | 0.684, 0.723 | –0.222 | 0.013 | –17.598 | 0.801 | 0.781, 0.821 | |||
| Others | –0.357 | 0.014 | –24.628 | 0.700 | 0.680, 0.720 | –0.195 | 0.013 | –15.299 | 0.823 | 0.802, 0.843 | |||
| Radiation | |||||||||||||
| Yes | 0.060 | 0.011 | 5.569 | 1.062 | 1.040, 1.085 | 0.067 | 0.011 | 6.253 | 1.069 | 1.047, 1.091 | |||
| Chemotherapy | |||||||||||||
| Yes | 1.118 | 0.010 | 112.449 | 3.060 | 3.000, 3.120 | 1.025 | 0.010 | 103.022 | 2.786 | 2.732, 2.841 | |||
| DX.bone | |||||||||||||
| Yes | –0.311 | 0.011 | –28.461 | 0.732 | 0.717, 0.748 | –0.345 | 0.010 | –34.766 | 0.708 | 0.695, 0.722 | |||
| DX.brain | |||||||||||||
| Yes | –0.172 | 0.012 | –14.441 | 0.842 | 0.822, 0.862 | –0.264 | 0.012 | –22.770 | 0.768 | 0.751, 0.786 | |||
| DX.liver | |||||||||||||
| Yes | –0.466 | 0.014 | –33.460 | 0.627 | 0.610, 0.645 | –0.380 | 0.012 | –30.644 | 0.684 | 0.668, 0.701 | |||
| DX.lung | |||||||||||||
| Yes | –0.003 | 0.012 | –0.259 | 0.997 | 0.974, 1.020 | 0.796 | — | — | — | — | — | — | |
| MaritalStatus | |||||||||||||
| Others | –0.211 | 0.011 | –19.548 | 0.810 | 0.793, 0.827 | –0.114 | 0.010 | –11.780 | 0.892 | 0.875, 0.909 | |||
| Income | |||||||||||||
| USD 50,000–USD 75,000 | 0.146 | 0.016 | 9.222 | 1.157 | 1.121, 1.193 | 0.038 | 0.016 | 2.399 | 1.039 | 1.007, 1.072 | 0.016 | ||
| USD 75,000+ | 0.377 | 0.017 | 22.721 | 1.457 | 1.411, 1.505 | 0.126 | 0.018 | 7.106 | 1.134 | 1.096, 1.175 | |||
| County | |||||||||||||
| Metropolitan | 0.195 | 0.015 | 13.163 | 1.216 | 1.181, 1.252 | 0.068 | 0.016 | 4.374 | 1.071 | 1.038, 1.104 | |||
Abbreviations: CSS, cancer-specific survival; AFT, accelerated failure time; TR, time ratio; CI, confidence interval; LUAD, lung adenocarcinoma; LUSC, lung squamous cell carcinoma; PSM, propensity score matching; Hist, histology; DX, diagnosis of metastasis; Post, post-immunotherapy period.
By analyzing the interaction between the period and other variables, we further
evaluated the temporal evolution of variables that influence the survival
outcomes of patients with metastatic NSCLC. In the post-immunotherapy periods,
unspecified tumor locations, non-LUAD, bone metastases, and non-marital status
were associated with shorter OS and CSS (all p
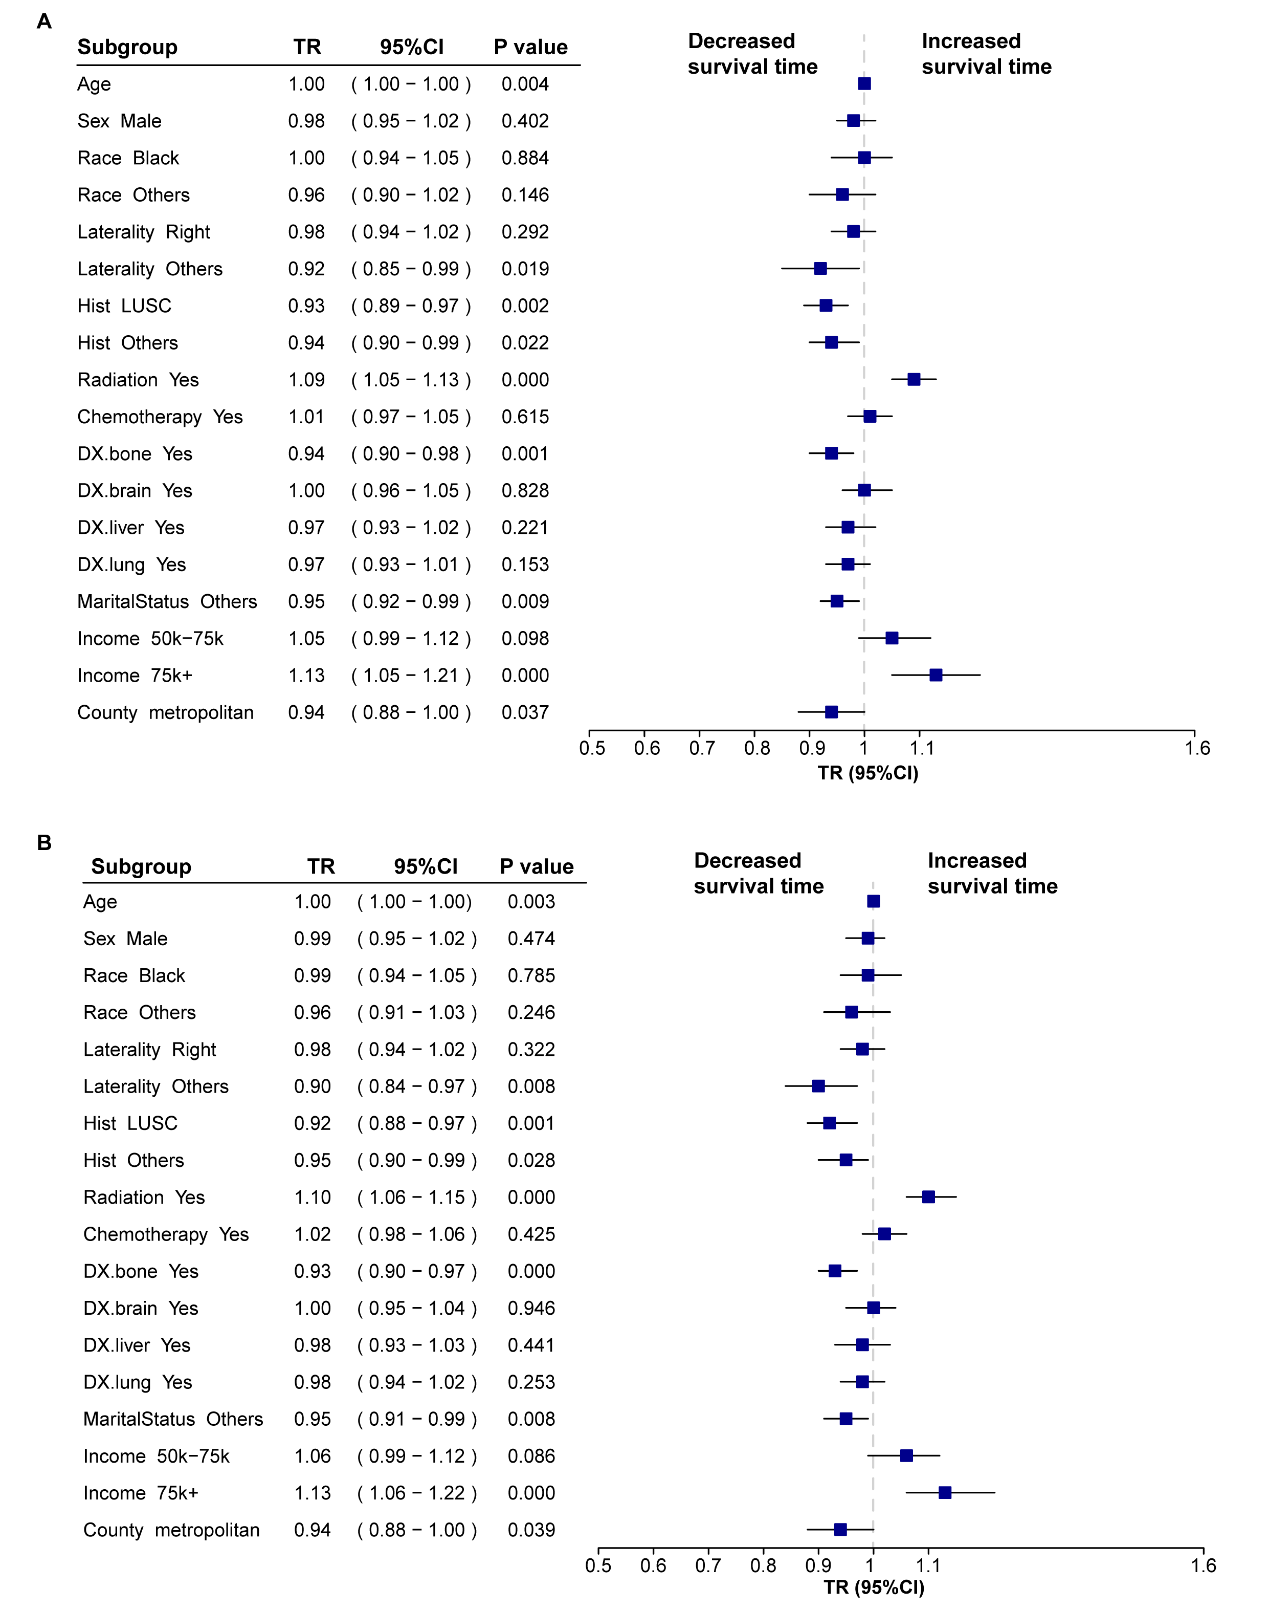 Fig. 2.
Forest plots of subgroup interaction assessments for survival
time in metastatic non-small cell lung cancer (NSCLC). (A) Forest plot for
overall survival (OS). (B) Forest plot for cancer-specific survival (CSS). Time
ratios (TR) and 95% confidence intervals (CI) were derived from the accelerated
failure time (AFT) model. Each subgroup reflects the interaction term “Era
(Post)
Kaplan-Meier analyses were conducted pre- and post-PSM, demonstrating higher CVD
survival rates post-immunotherapy (p
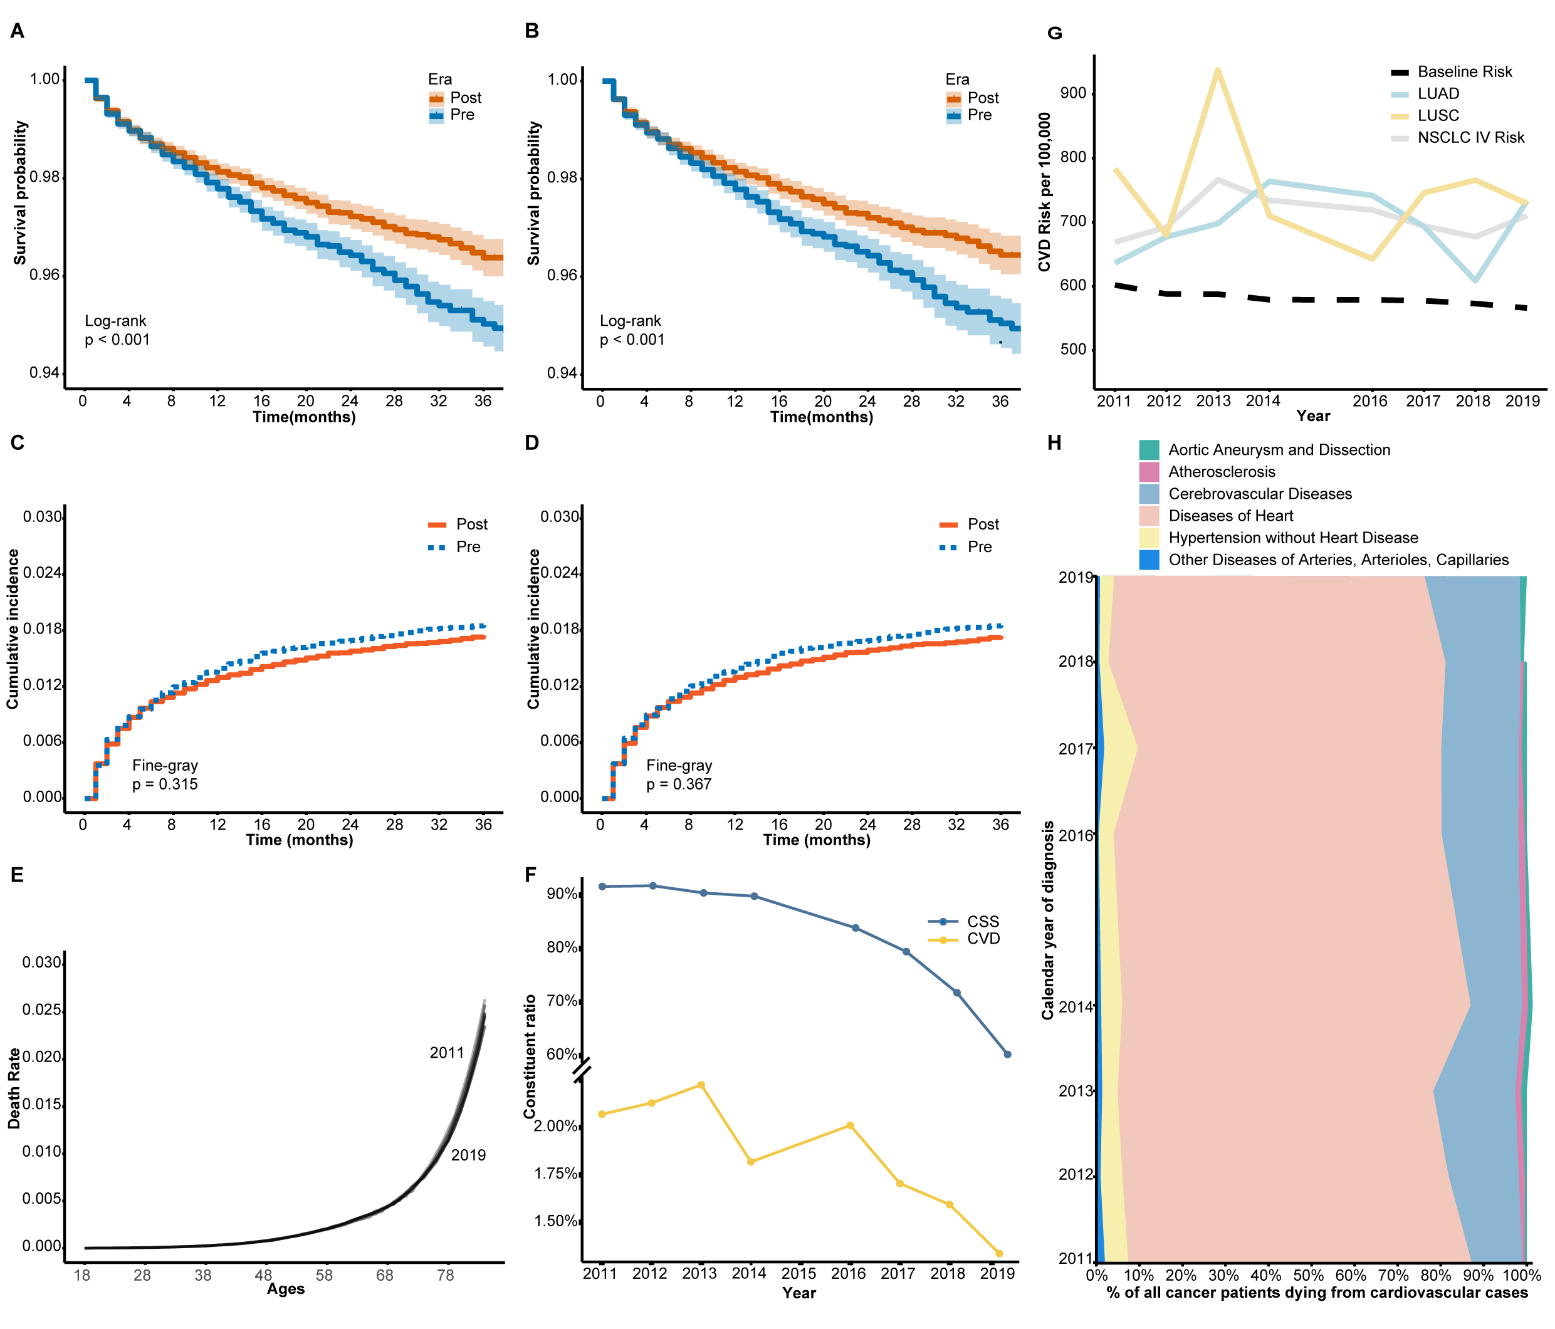 Fig. 3.
Cardiovascular disease (CVD) mortality and cancer-specific survival (CSS) trends in patients with metastatic non-small cell lung cancer (NSCLC) during the pre- and post-immunotherapy periods. (A) Kaplan–Meier curves of CVD-specific survival before propensity score matching (PSM). (B) Kaplan–Meier curves after PSM. (C) Cumulative incidence of CVD mortality before PSM using competing risk analysis. (D) Cumulative incidence of CVD mortality after PSM. (E) Age-specific CVD mortality rates in the general U.S. population aged 18–84, derived from the CDC-WONDER database. Data are shown for two time periods: 2011–2014 and 2016–2019, aligned with the pre- and post-immunotherapy eras in the SEER NSCLC cohort. These curves provide reference baselines for interpreting age-related CVD mortality patterns. (F) Annual trends in cancer-specific survival (CSS) and CVD mortality rates in metastatic NSCLC (SEER database). (G) Annual CVD mortality risk for different NSCLC subtypes (LUAD, LUSC, and overall stage IV NSCLC) vs. baseline population risk (CDC-WONDER). (H) Proportional distribution of CVD-related causes of death among metastatic NSCLC patients (2011–2019). Abbreviations: CSS, cancer-specific survival; CVD, cardiovascular disease; LUAD, lung adenocarcinoma; LUSC, lung squamous cell carcinoma; PSM, propensity score matching; CDC-WONDER, Centers for Disease Control and Prevention Wide-Ranging Online Data for Epidemiologic Research; SEER, Surveillance, Epidemiology, and End Results Program.
The approval of nivolumab marked a pivotal transition into the immunotherapy period for metastatic NSCLC treatment [21]. While previous studies have extensively explored the efficacy and safety of immunotherapy, this study is the first to analyze the evolution of survival determinants in metastatic NSCLC in the pre-and post-immunotherapy period and to update the CVD mortality risk assessments [13, 15, 22]. It reveals that the divergent effects of pathology type, tumor metastasis site, marital status, radiotherapy, and economic status on survival outcomes were significantly more pronounced in the post-immunotherapy period. In addition, while no period-specific differences in CVD mortality risk were identified, it remained elevated in metastatic NSCLC patients compared to the general US population. The study highlights the need to update clinical practice and health management strategies and to promote multidisciplinary integrated management in the period of immunotherapy.
Compared with previous studies [23, 24], this study observed a decline in OS for both LUSC and LUAD patients (Supplementary Table 3)—especially notable in the post-immunotherapy period—this outcome may be attributed to the study’s only focus on Stage IV NSCLC patients, and including those who received no treatment [3]. Nevertheless, the survival benefit of patients in the post-immunotherapy period was still significantly higher.
While earlier studies have assessed the efficacy of immunotherapy, our study did not attempt to determine its direct impact due to the absence of treatment-specific data in the SEER database. Instead, we used the term “post-immunotherapy period” as a temporal marker reflecting population-level treatment evolution, including—but not limited to—the broader adoption of immune checkpoint inhibitors. Accordingly, the observed improvements in survival should be interpreted in the context of multifactorial systemic advances, and no causal attribution to immunotherapy was made.
Multivariate AFT analyses identified vital variables that significantly impacted survival prognosis in patients with metastatic NSCLC, with consistent directionality and approximate effect strengths on OS and CSS (Tables 2,3). Radiation therapy and chemotherapy, as essential components of the first-line treatment regimen for metastatic NSCLC, provide significant survival benefits. However, extrapulmonary metastases still pose an additional survival risk to patients [25]. Notably, the dose-response relationship, influenced by lung volume differences in radiation therapy, may increase survival risks for patients with non-left lateralized [26]. In addition, consistent with most prior studies, patients with stage IV NSCLC with non-LUAD pathologic types face more significant survival challenges, partly because of the lower response rate to novel therapies, such as targeted therapies, in this group. Currently, epidermal growth factor receptor (EGFR) and kirsten rat sarcoma viral oncogene homolog (KRAS) mutations associated with targeted therapies predominantly occur in LUAD, and the study and identification of non-LUAD driver genes have lagged relatively behind [27]. Although the emergence of immunotherapy has mitigated this problem to some extent, the search for effective second-line therapeutic strategies after the failure of first-line therapy remains an urgent problem.
Our study describes the evolutionary trajectory of survival determinants in two periods, where advanced age, non-LUAD, bone metastases, and non-marital status increase the survival risk. At the same time, the protective effects of radiotherapy and higher economic levels are elevated. This indicates that although improvements in medical technology, such as radiotherapy, are extending survival for NSCLC patients, these advancements also highlight how variations in treatment regimen suitability across different patient subgroups—LUAD versus non-LUAD, with or without bone metastases—are intensifying disparities in survival outcomes. Furthermore, it’s critical to acknowledge that not all identified factors are amenable to clinical intervention or control for the benefit of metastatic NSCLC patients. Non-medical factors, including age, sex, marital status, economic standing, and geographical location, also play a pivotal role in the holistic management of these patients. The differentiation in social age structure [5], economic level [8], and emotional support [28] presented by these factors exacerbates the divergent effects of patient survival outcomes, suggesting that non-medical factors are worth considering when constructing an overall management framework for patients with metastatic NSCLC [7].
Several previous studies have evaluated the potential CVD mortality risk of multiple treatment regimens for metastatic NSCLC, including radiation, chemotherapy, immunotherapy, and combination therapies, but conclusions have varied significantly between studies [11, 12]. With future changes in the combination of treatment regimens and improvements in monotherapy techniques, treatment-related CVD mortality risk will continue to be evaluated. Our study provides another observational perspective, analyzing the evolutionary trajectory of CVD mortality risk across different periods in metastatic NSCLC through comparative analysis. This trajectory of change has been previously analyzed from this perspective by Bishnoi et al. [29] and Jiao et al. [30], who came to similar conclusions: the risk of CVD mortality in metastatic NSCLC did not increase in the post-immunotherapy period and even declined compared with the pre-immunization period. Our study provides additional evidence that CVD mortality risk was not significantly different in the pre- and post-immunotherapy periods but showed a downward trend, and it was noted that the composition of CVD subgroups remained stable. However, caution is warranted when interpreting the apparent ’reduction’ in CVD mortality risk among patients with metastatic NSCLC. On the one hand, as treatment regimens for metastatic NSCLC have become more complex and personalized, patients tend to receive longer-term cardiac medications and cardiovascular monitoring, which may reduce the incidence of malignant CVD mortality risk. On the other hand, the potential combined risk of patients was assessed before receiving chemotherapy, radiotherapy, and immunotherapy, which may have precluded patients with higher cardiovascular risk from receiving these treatments [31]. However, these explanations still need to be further validated by future studies. Given that patients with metastatic NSCLC still have a higher risk of CVD mortality compared to the general U.S. population, it is crucial to develop cardio-oncology teams to provide holistic support and continuous surveillance for cancer patients undergoing various treatment regimens.
This study has several limitations. First, it was a retrospective analysis based on the SEER and CDC-WONDER databases, which may introduce selection bias. Second, although immunotherapy has become a key component of first-line treatment for stage IV NSCLC in the post-immunotherapy era, the SEER database lacks detailed information on immunotherapy, chemotherapy, and radiation therapy. As a result, treatment-specific analyses could not be performed. Third, data on targeted therapies, comorbidities, and risk factors such as smoking and alcohol use were unavailable, limiting our ability to adjust for potential confounders. Moreover, as with treatment and comorbidity data, cause-of-death information in SEER is derived from death certificates and may be subject to misclassification. For example, patients with advanced NSCLC may be recorded as having died from lung cancer even when the proximate cause was non-oncologic. Finally, due to reporting delays, our analyses may not fully reflect trends after 2020.
By analyzing the evolutionary trajectory of survival factors and CVD mortality risk in patients with metastatic NSCLC in the pre-and post-immunotherapy periods, this study found that the divergent effects of factors such as pathological type, location of tumor metastasis, marital status, radiotherapy, and economic status on survival outcomes were enhanced in the post-immunotherapy period. Although there was no significant difference in CVD mortality risk between groups, a downward trend was observed. Further studies are needed to analyze the underlying mechanisms quantitatively. Considering the complexity and personalization of metastatic NSCLC treatment, narrowing the differences in survival benefits across patient subgroups and enhancing multidisciplinary collaboration in oncological cardiology may be a continuing concern for the future.
The data presented in the manuscript are derived from the SEER databases (https://seer.cancer.gov/) and the CDC-WONDER database (https://wonder.cdc.gov/).
The study was conceived and designed by JX, JT, and QL. The initial draft of the manuscript was prepared by JX and JT, and substantially revised by YP. Data collection and software development were conducted by JT, with data management support from YP. The project was supervised and validated by JX, YP, and YY, who also contributed to formal data analysis. All authors contributed to the conception and editorial changes in the manuscript. All authors critically reviewed the manuscript, approved the final version for publication, and agreed to be accountable for all aspects of the work.
The Ethics Committee of Dongzhimen Hospital, Beijing University of Chinese Medicine granted the ethical exemption, citing the anonymization and public availability of the data from SEER databases and CDC-WONDER database. As this article is a retrospective study, patient informed consent statement was waived. All procedures complied with institutional guidelines and the principles of the Declaration of Helsinki.
The data utilized in this investigation were obtained from the SEER and CDC-WONDER database.
This work was supported by the High-Level TCM Discipline Construction Project of the National Administration of TCM of China (zyyzdxk-2023253) and the Innovative Development Project for Young Physicians of the Professional Committee of Respiratory Disease Drug Research of China Association of Traditional Chinese Medicine (No. HXQNJJ-2023-014).
The authors declare no conflict of interest.
During the preparation of this work, the authors used ChatGPT provided by OpenAI in order to enhance the linguistic accuracy of the manuscript. After using this tool, the authors reviewed and edited the content as needed and take full responsibility for the content of the publication.
Supplementary material associated with this article can be found, in the online version, at https://doi.org/10.31083/RCM39296.
References
Publisher’s Note: IMR Press stays neutral with regard to jurisdictional claims in published maps and institutional affiliations.