


 , Raisa V. Dorzhieva 1, Kristina V. Kopeva 1, Ayana S. Dasheeva 1, Andrew V. Mochula 1, Elena V. Grakova 1, Konstantin V. Zavadovsky 1
1 Cardiology Research Institute, Tomsk National Research Medical Center, Russian Academy of Sciences, 634012 Tomsk, Russia
Abstract
Studies have demonstrated that patients with non-obstructive coronary artery disease (NOCAD) have an increased risk of myocardial infarction and all-cause mortality, particularly due to coronary microvascular dysfunction (CMD). Moreover, the features of atherosclerotic plaque can affect myocardial blood flow (MBF); however, data on these findings remain limited. Therefore, this study aimed to assess the impact of quantitative coronary computed tomography angiography (CCTA)-derived atherosclerotic plaque features on myocardial perfusion and MBF in NOCAD patients measured using dynamic cadmium–zinc–telluride single-photon emission computed tomography (CZT-SPECT).
Based on the CCTA results, a total of 49 NOCAD patients (stenosis <50%, 29 men, mean age 57.4 ± 9.0 years) were included in the study. In addition to estimating stenosis severity, the plaque volume (mm3) and burden (%) were measured using the coronary bed and separately by structural components (non-calcified, soft-tissue, fibrous, calcified). All patients underwent dynamic CZT-SPECT to assess stress and resting MBF and myocardial flow reserve (MFR).
Based on the MFR values, patients were divided into two groups: Group 1 consisted of patients with reduced MFR (<2.0, n = 20), and Group 2 consisted of those with normal MFR (≥2.0, n = 29). Not all patients had severe myocardial perfusion abnormalities, as determined by standard myocardial perfusion imaging indexes. Analysis of the CCTA data demonstrated that small volumes and burdens of atherosclerotic plaques were characteristic of patients. Stress was significantly correlated with total plaque volume (Spearman's rank correlation coefficient (ρ) = –0.402) and burden (ρ = –0.374), as well as non-calcified plaque volume (ρ = –0.341) and burden (ρ = –0.314). Rest significantly correlated with total plaque volume (ρ = –0.504) and burden (ρ = –0.432), and non-calcified plaque volume (ρ = –0.471) and burden (ρ = –0.433). Meanwhile, MFR and standard indexes of myocardial perfusion impairment did not exhibit significant associations with quantitative CCTA parameters. Multivariate logistic regression analysis revealed that only total plaque volume (odds ratio 1.01; 95% confidence interval 1.005–1.030; p < 0.001) was an independent predictor of reduced stress-related MBF of less than 1.5 mL/min/g.
Total plaque volume, derived from quantitative CCTA data, represents an independent predictor of reduced stress-related MBF of less than 1.5 mL/min/g, as obtained using dynamic CZT-SPECT, even in the absence of obstructive coronary artery disease (CAD).
Keywords
- atherosclerotic plaque features
- non-obstructive coronary artery disease
- coronary microvascular dysfunction
- myocardial perfusion
- myocardial blood flow
- myocardial flow reserve
- coronary computed tomography angiography
- dynamic CZT-SPECT
Perspectives on non-obstructive coronary artery disease (NOCAD) have changed over the past decade. The prevalence of patients with NOCAD has been increasing in relation to obstructive coronary artery disease (CAD) [1]. Studies have demonstrated that patients with NOCAD have a high risk of myocardial infarction and all-cause mortality, compared to those without evidence of CAD on coronary computed tomography angiography (CCTA) [2, 3]. Moreover, when the calcified plaque burden is similar, the risk of major adverse cardiovascular events is comparable for both NOCAD and obstructive CAD patients [4]. Thus, the current paradigm of CAD management, which focuses on flow-limiting obstructive stenosis, is imperfect since a relationship exists between myocardial ischemia and coronary atherosclerosis, even in the absence of flow-limiting stenosis [5]. A Working Group for the European Society of Cardiology has suggested that approximately two-thirds of patients with suspected CAD and NOCAD may experience disease progression and the development of complications due to the presence of coronary microvascular dysfunction (CMD) [6]. Additionally, the 2024 European Society of Cardiology guidelines categorize patients with ischemia or angina in the context of NOCAD as a distinct subgroup of chronic coronary syndromes [7]. Consequently, a growing necessity exists to extend beyond anatomical evaluations of the coronary bed and to conduct comprehensive investigations into myocardial microcirculation.
CCTA is a modern, non-invasive tool that can identify coronary stenosis and quantify the extent of plaques. Comprehensive CCTA image processing software enables the assessment of total plaque volume and the burden of different plaque types, including calcified, non-calcified, and low-attenuation plaques [8].
Parameters of CCTA-derived coronary atherosclerosis correlate with myocardial ischemia on gated myocardial perfusion obtained by single-photon emission computed tomography (SPECT) in obstructive CAD patients [9, 10, 11]. Moreover, recent advances in the myocardial dynamic SPECT technique can enable the assessment of myocardial blood flow (MBF) and myocardial flow reserve (MFR) using cadmium–zinc–telluride single-photon emission computed tomography (CZT-SPECT) gamma cameras. The high diagnostic performance of this technique in assessing obstructive CAD and ischemia has been confirmed through the use of invasive coronary angiography, invasive fractional flow reserve (FFR), and positron emission tomography (PET) as reference methods [12, 13, 14, 15, 16]. However, data regarding the use of CZT-SPECT in NOCAD patients to identify those at increased cardiac risk due to CMD remain limited. Moreover, a gap exists in research concerning the associations between CCTA-based plaque quantification and MBF and MFR evaluations in NOCAD patients derived from dynamic CZT-SPECT. Patients with NOCAD who have decreased stress MBF and MFR are at higher risk for CMD and may benefit from additional risk stratification as well as a personalized, modern, and more intensive medication strategy.
Therefore, this study aimed to assess the influence of quantitative CCTA-derived atherosclerotic plaque features on myocardial perfusion and MBF obtained by dynamic CZT-SPECT in NOCAD patients.
From 2021 to 2023, 2400 low-risk patients with suspected CAD underwent CCTA according to clinical indications [7, 17, 18]. A total of 960 NOCAD patients (stenosis
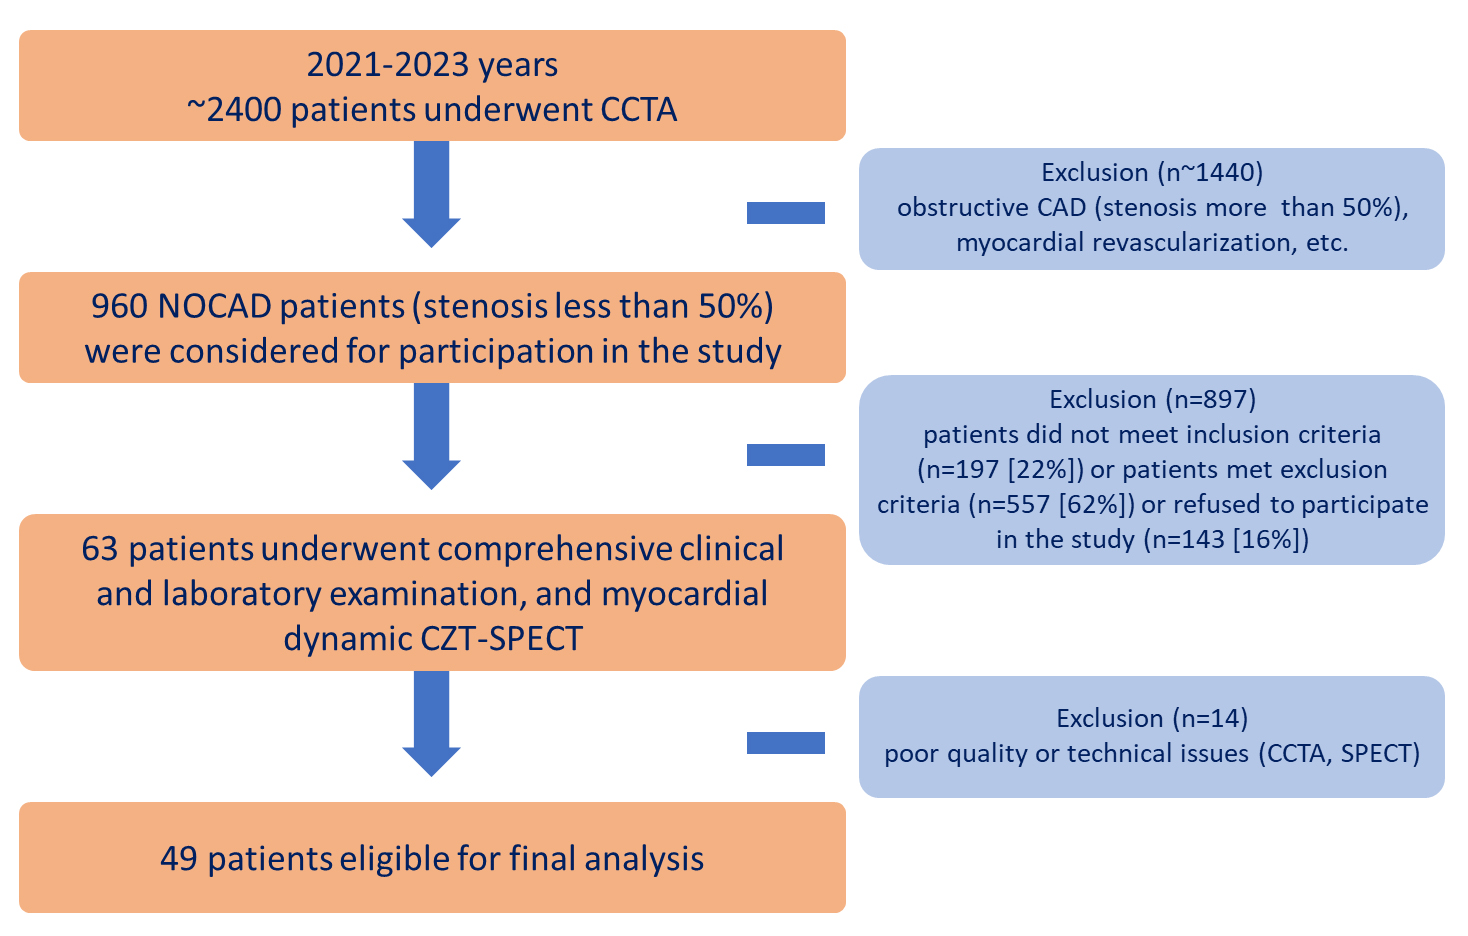 Fig. 1.
 Flowchart of the study design. CAD, coronary artery disease; CCTA, coronary computed tomography angiography; CZT, cadmium–zinc–telluride detectors; n, number of patients; NOCAD, non-obstructive coronary artery disease; SPECT, single-photon emission computed tomography.
The inclusion criteria were NOCAD (
A total of 49 patients were enrolled in the final analysis. All patients underwent a comprehensive clinical examination, which included a medical history, blood tests (complete blood count, blood biochemistry test, lipid profile, hemostasis panel), electrocardiography, echocardiography, CCTA, and myocardial dynamic CZT-SPECT perfusion imaging with the assessment of MBF and MFR. Image processing was performed at the Core Facility “Medical Genomics”.
All CCTA was performed using a hybrid system Discovery NM/CT 570c (GE Healthcare, Milwaukee, WI, USA), equipped with a 64-detector row computed tomography scanner.
A non-enhanced prospective electrocardiographic-gated (ECG) axial scan was triggered at 75% of the R–R interval to measure the coronary artery calcium score. The scanning was performed from the tracheal bifurcation to the level of the diaphragm with breath-holding (6–8 sec) using the following parameters: 2.5 mm slice thickness, 400 ms gantry rotation time, 120 kV tube voltage, 200 mA tube current.
For CCTA, blocker medication was administered (if not contraindicated) with a heart rate
Reconstruction of CCTA data was performed at 45% and 75% of the R–R interval using the following parameters: 0.625 mm slice thickness and 0.625 mm interslice interval. Reconstructed images were transferred into a post-processing workstation, Advanced Workstation 4.7 (GE Healthcare, Milwaukee, WI, USA), and were evaluated by two readers blinded to the clinical data. Reconstructed images were assessed by using CardIQ Xpress 2.0 (GE Healthcare, Milwaukee, WI, USA). Reveal software was used for the axial images, curved multiplanar reformations, and cross-sectional analysis, with manual corrections performed as needed.
The calcium score was calculated using SmartScore 4.0 software (GE Healthcare, Milwaukee, WI, USA) according to the method described by Agatston et al. [19].
Only segments without significant artefacts were used for further CCTA analyses. Only segments with a diameter of
CCTA data were analyzed using dedicated software, PlaqID, of the CardIQ Xpress 2.0 Package (GE Healthcare, Milwaukee, WI, USA). Automated delineation of the lumen to vessel wall boundaries, as well as vessel wall to perivascular adipose tissue boundaries, was performed, followed by manual adjustment, for each coronary artery equal to or more than 2 mm in diameter. Quantitative plaque analysis was performed at both vessel-based and patient-based levels. The following quantitative variables were calculated: lumen (mm3); total volume (mm3); total plaque volume (mm3); non-calcified plaque volume (as a sum of soft-tissue and fibrous plaque volumes, mm3); soft-tissue plaque volume (mm3); fibrous plaque volume (mm3); calcified plaque volume (mm3); total plaque burden (as ratio plaque volume to the sum of lumen volume plus plaque volume
The preparation process of the patients, study protocol, data acquisition, and analysis have been previously published [21, 22, 23]. The mean time interval between CCTA and myocardial dynamic CZT-SPECT was 11.1
Myocardial dynamic CZT-SPECT consisted of two stages of examination: (1) Dynamic recording of the first passage of the radiopharmaceutical bolus through the heart chambers and myocardium to determine quantitative scintigraphic parameters; (2) myocardial perfusion imaging: 60 minutes after the first stage to assess standard indexes of perfusion impairment.
A rest–stress two-day protocol using the radiopharmaceutical agent 99mTc-methoxy-isobutyl-isonitrile (LLC “Diamed”, Russian Federation) was performed in all patients. A pharmacological stress test was performed using adenosine triphosphate (LLC “Ellara”, Russian Federation) infusion at a dosage of 160 mcg/kg/min over 4 minutes [24]. The total effective radiation dose of the study ranged from 4.4 to 7.5 mSv.
All studies were analyzed on the dedicated workstation Xeleris 4.0 (GE Healthcare, Haifa, Israel) using the Corridor 4DM SPECT and 4DM Reserve v.2017 (INVIA, Ann Arbor, MI, USA) software. The one-compartment (single-component) model (1CAC) with attenuation correction was used for quantitative analysis.
Following post-processing, the following quantitative scintigraphic parameters were obtained: stress myocardial blood flow (stress MBF), rest myocardial blood flow (rest MBF), MFR, and flow difference (FD), as well as standard indexes of myocardial perfusion impairment: summed stress score (SSS), summed rest score (SRS), and summed difference score (SDS), as well as parameters of LV contractility: ejection fraction (EF), end diastolic volume (EDV), and end systolic volume (ESV).
Next, patients were divided into two groups based on the MFR values obtained from dynamic CZT-SPECT: (1) reduced MFR
The local intra- and inter-observer reproducibility of CZT SPECT stress MBF and MFR was estimated in our previous study [29].
All two-dimensional (2D, B-real-time) transthoracic echocardiography was performed using an ultrasound scanner with enhanced visualization, Philips Affiniti 70 (Philips, Netherlands). The following LV contractility echocardiographic parameters were obtained: EF, EDV, and ESV. A preserved LV systolic function was considered if LV EF
Patients had blood drawn for testing on the same day as the first stage of dynamic CZT-SPECT. The following blood test parameters were obtained: complete blood count (leukocytes, platelets, hemoglobin), blood biochemistry test (fasting glucose, estimated glomerular filtration rate, C-reactive protein), lipid profile (total cholesterol, low-density lipoprotein cholesterol, high-density lipoprotein cholesterol, triglycerides, non-high-density lipoprotein cholesterol), and hemostasis panel (international normalized ratio, activated partial thromboplastin time, fibrinogen).
Statistical analysis and graphical images were generated using the statistical software R, version 4.3.3 (R Foundation for Statistical Computing, Vienna, Austria), and Jamovi, version 2.2.5.0 (The Jamovi Project, Australia). The distribution of continuous variables was calculated using the Shapiro–Wilk test. Normally distributed continuous variables are presented as the mean value (M) and standard deviation (SD), while non-normally distributed ones are presented as the median (Me) and interquartile range (25th and 75th percentiles). Categorical variables are presented as counts and percentages—n (%). The Mann–Whitney criteria were employed to perform statistical comparisons between the two groups. Categorical variables were compared using the Pearson’s chi-squared test with continuity correction, if necessary, or the Fisher’s exact test. Spearman’s rank correlation coefficient (
A total of 49 patients (stenosis
The clinical and demographic characteristics of the patients did not differ between the groups (Table 1). Since patients were enrolled in the study at the early stages of the disease, these patients did not receive optimal medical therapy at the time of inclusion in the study. The groups did not differ significantly in the frequency of prescribed drugs. Subsequently, the treatment was corrected, and guided-derived medical therapy was prescribed in accordance with current clinical recommendations [7, 17, 18].
| Parameters | Total patients, n = 49 | Group 1: reduced MFR (MFR | Group 2: normal MFR (MFR | p-value | |
| Age, years | 57.4 | 56.3 | 58.2 | 0.60 | |
| Male sex, n (%) | 29 (59%) | 9 (45%) | 20 (69%) | 0.09 | |
| Arterial hypertension, n (%) | 46 (94%) | 19 (95%) | 27 (93%) | 1.00 | |
| Dyslipidemia, n (%) | 26 (53%) | 11 (55%) | 15 (52%) | 0.82 | |
| Current smoking, n (%) | 15 (31%) | 4 (20%) | 11 (38%) | 0.18 | |
| BMI, kg/m2 | 29.0 (27.1; 31.6) | 29.2 (27.2; 32.1) | 29.0 (27.1; 31.2) | 0.74 | |
| Type 2 diabetes mellitus, n (%) | 2 (4%) | 1 (5%) | 1 (3%) | 1.00 | |
| Echocardiography data | |||||
| EF, % | 65.0 (64.0; 67.0) | 65.0 (64.0; 67.3) | 65.0 (64.0; 67.0) | 0.97 | |
| EDV, mL | 107.0 (93.5; 121.0) | 102.0 (96.5; 114.0) | 112.0 (91.5; 125.0) | 0.21 | |
| ESV, mL | 37.0 (33.0; 45.0) | 35.0 (32.0; 39.5) | 41.0 (33.5; 46.0) | 0.09 | |
| Drug therapy | |||||
| Beta-blockers, n (%) | 22 (45%) | 9 (45%) | 13 (45%) | 0.99 | |
| ACE inhibitors, n (%) | 16 (33%) | 7 (35%) | 9 (31%) | 0.77 | |
| ARBs, n (%) | 10 (20%) | 3 (15%) | 7 (24%) | 0.68 | |
| Diuretics, n (%) | 10 (20%) | 5 (25%) | 5 (17%) | 0.76 | |
| Calcium channel blockers, n (%) | 14 (29%) | 4 (20%) | 10 (35%) | 0.27 | |
| Antiplatelet agents, n (%) | 20 (41%) | 9 (45%) | 11 (38%) | 0.62 | |
| Anticoagulants, n (%) | 4 (8%) | 0 | 4 (14%) | 0.23 | |
| Lipid-lowering therapy, n (%) | 26 (53%) | 10 (50%) | 16 (55%) | 0.72 | |
Table footnotes: All data are presented as the median and interquartile range (IQR), expressed as Me (Q25; Q75), as the mean
Patients with reduced MFR exhibited a significantly lower level of activated partial thromboplastin time compared to those with normal MFR. Other blood parameters were found to be negligible (Table 2).
| Parameters | Total patients, n = 49 | Group 1: reduced MFR (MFR | Group 2: normal MFR (MFR | p-value |
| TC, mmol/L | 4.70 (3.94; 5.99) | 5.18 (4.21; 6.01) | 4.62 (3.86; 5.34) | 0.36 |
| LDL-C, mmol/L | 2.80 (1.80; 3.61) | 2.85 (1.80; 3.72) | 2.80 (1.80; 3.50) | 0.51 |
| HDL-C, mmol/L | 1.31 (1.13; 1.59) | 1.33 (1.21; 1.71) | 1.30 (1.03; 1.54) | 0.24 |
| TG, mmol/L | 1.60 (0.92; 2.22) | 1.70 (0.91; 2.16) | 1.58 (1.10; 2.24) | 0.98 |
| Non-HDL-C, mmol/L | 3.56 (2.42; 4.54) | 3.55 (2.73; 4.59) | 3.56 (2.16; 4.31) | 0.54 |
| Fasting glucose, mmol/L | 5.88 (5.49; 6.22) | 5.74 (5.38; 6.09) | 6.03 (5.56; 6.30) | 0.08 |
| eGFR, mL/min/1.73 m2 | 76.20 (67.90; 87.20) | 82.00 (67.20; 96.50) | 75.30 (67.90; 80.20) | 0.20 |
| CRP, mg/L | 3.10 (2.50; 4.00) | 3.00 (2.50; 3.90) | 3.30 (2.50; 3.80) | 0.77 |
| Leukocytes, 109/L | 6.30 (5.47; 7.13) | 6.19 (5.48; 7.11) | 6.40 (5.50; 7.13) | 0.98 |
| Platelets, 109/L | 244.00 (195.00; 291.00) | 250.00 (207.00; 298.00) | 225.00 (193.00; 271.00) | 0.54 |
| Hemoglobin, g/L | 144.00 (132.00; 153.00) | 144.00 (130.00; 152.00) | 142.00 (135.00; 153.00) | 0.80 |
| INR | 0.95 (0.91; 1.00) | 0.96 (0.92; 0.98) | 0.94 (0.92; 1.02) | 0.90 |
| APTT, sec | 27.50 (26.10; 30.30) | 26.30 (25.50; 28.80) | 28.80 (26.90; 30.80) | 0.03 |
| Fibrinogen, g/L | 2.92 (2.63; 3.34) | 2.90 (2.59; 3.45) | 2.92 (2.64; 3.29) | 0.85 |
Table footnotes: All data are presented as the median and interquartile range (IQR), expressed as Me (Q25; Q75). APTT, activated partial thromboplastin time; CRP, C-reactive protein; eGFR, estimated glomerular filtration rate; HDL-C, high-density lipoprotein cholesterol; INR, international normalized ratio; LDL-C, low-density lipoprotein cholesterol; MFR, myocardial flow reserve; n, number of patients; NOCAD, non-obstructive coronary artery disease; non-HDL-C, non-high-density lipoprotein cholesterol; TC, total cholesterol; TG, triglycerides.
The dynamic CZT-SPECT results are presented in Table 3. Patients did not exhibit severe myocardial perfusion abnormalities, as determined by standard myocardial perfusion imaging indexes. Patients with reduced MFR had significantly lower stress MBF and FD, and higher rest MBF compared to the group with normal MFR.
| Parameters | Total patients, n = 49 | Group 1: reduced MFR (MFR | Group 2: normal MFR (MFR | p-value | |
| Standard indexes of myocardial perfusion imaging | |||||
| SSS | 1.0 (0.0; 2.0) | 1.5 (0.0; 3.0) | 0.0 (0.0; 2.0) | 0.24 | |
| SRS | 0.0 (0.0; 0.0) | 0.0 (0.0; 0.0) | 0.0 (0.0; 0.0) | 0.40 | |
| SDS | 0.0 (0.0; 2.0) | 1.5 (0.0; 3.0) | 0.0 (0.0; 2.0) | 0.22 | |
| Myocardial blood flow and reserve parameters | |||||
| Stress MBF, mL/min/g | 1.59 (1.28; 1.93) | 1.48 (1.13; 1.68) | 1.65 (1.42; 2.21) | 0.042 | |
| Rest MBF, mL/min/g | 0.76 (0.56; 0.95) | 1.01 (0.82; 1.14) | 0.62 (0.44; 0.77) | ||
| FD, mL/min/g | 0.81 (0.47; 1.21) | 0.43 (0.15; 0.65) | 1.02 (0.88; 1.43) | ||
Table footnotes: All data are presented as the median and interquartile range (IQR), expressed as Me (Q25; Q75). CZT, cadmium–zinc–telluride detectors; FD, flow difference; MBF, myocardial blood flow; MFR, myocardial flow reserve; n, number of patients; NOCAD, non-obstructive coronary artery disease; SDS, summed difference score; SPECT, single-photon emission computed tomography; SRS, summed rest score; SSS, summed stress score.
Analysis of the CCTA data demonstrated that patients were characterized by small atherosclerotic plaque volumes and burdens, which aligns with data reported in a large international cohort study [30]. Patients with a normal MFR presented only significantly higher calcium scores (Table 4). The study utilized exclusively coronary atherosclerosis volume and burden parameters, demonstrating good (0.75
| Parameters | Total patients, n = 49 | Group 1: reduced MFR (MFR | Group 2: normal MFR (MFR | p-value |
| Maximum stenosis, % | 35.0 (20.0; 40.0) | 32.5 (20.0; 46.3) | 35.0 (25.0; 40.0) | 0.91 |
| Calcium score, Agatston units | 19.0 (0.0; 68.0) | 0.0 (0.0; 62.0) | 30.0 (4.0; 102.0) | 0.02 |
| Lumen, mm3 | 1924.0 (1366.0; 2351.0) | 1657.0 (1419.0; 2101.0) | 1945.0 (1375.0; 2397.0) | 0.45 |
| General volume, mm3 | 1938.0 (1509.0; 2418.0) | 1685.0 (1555.0; 2266.0) | 2186.0 (1490.0; 2471.0) | 0.34 |
| Total plaque volume, mm3 | 51.9 (0.0; 137.0) | 13.6 (0.0; 131.0) | 68.3 (31.2; 135.0) | 0.10 |
| Total plaque burden, % | 2.9 (0.0; 7.0) | 0.6 (0.0; 6.6) | 3.8 (1.3; 7.2) | 0.18 |
| Non-calcified plaque volume, mm3 | 36.3 (0.0; 132.0) | 16.7 (0.0; 104.0) | 49.6 (27.9; 134.0) | 0.08 |
| Non-calcified plaque burden, % | 2.3 (0.25; 5.9) | 0.6 (0.0; 4.8) | 3.8 (1.6; 6.4) | 0.07 |
| Soft tissue plaque volume, mm3 | 0.1 (0.0; 10.7) | 0.0 (0.0; 5.0) | 1.6 (0.0; 23.2) | 0.09 |
| Soft tissue plaque burden, % | 0.01 (0.0; 0.5) | 0.0 (0.0; 0.1) | 0.1 (0.0; 0.7) | 0.07 |
| Fibrous plaque volume, mm3 | 34.3 (0.0; 110.0) | 9.4 (0.0; 91.5) | 38.4 (27.8; 114.0) | 0.08 |
| Fibrous plaque burden, % | 2.0 (0.0; 5.2) | 0.4 (0.0; 4.2) | 2.6 (1.2; 5.2) | 0.10 |
| Calcified plaque volume, mm3 | 3.5 (0.0; 19.0) | 1.5 (0.0; 17.8) | 3.7 (0.6; 17.1) | 0.47 |
| Calcified plaque burden, % | 0.2 (0.0; 0.9) | 0.1 (0.0; 0.8) | 0.2 (0.03; 0.8) | 0.60 |
Table footnotes: All data are presented as the median and interquartile range (IQR), expressed as Me (Q25; Q75). MFR, myocardial flow reserve; n, number of patients; NOCAD, non-obstructive coronary artery disease.
Stress and rest MBF values are associated with total and non-calcified (soft-tissue and fibrous) plaque volume and burden. Interestingly, MFR, FD, and standard indexes of myocardial perfusion impairment were not significantly associated with quantitative CCTA parameters. The heatmap graph of associations regarding atherosclerotic plaque features and MBF in NOCAD patients is shown in Fig. 2.
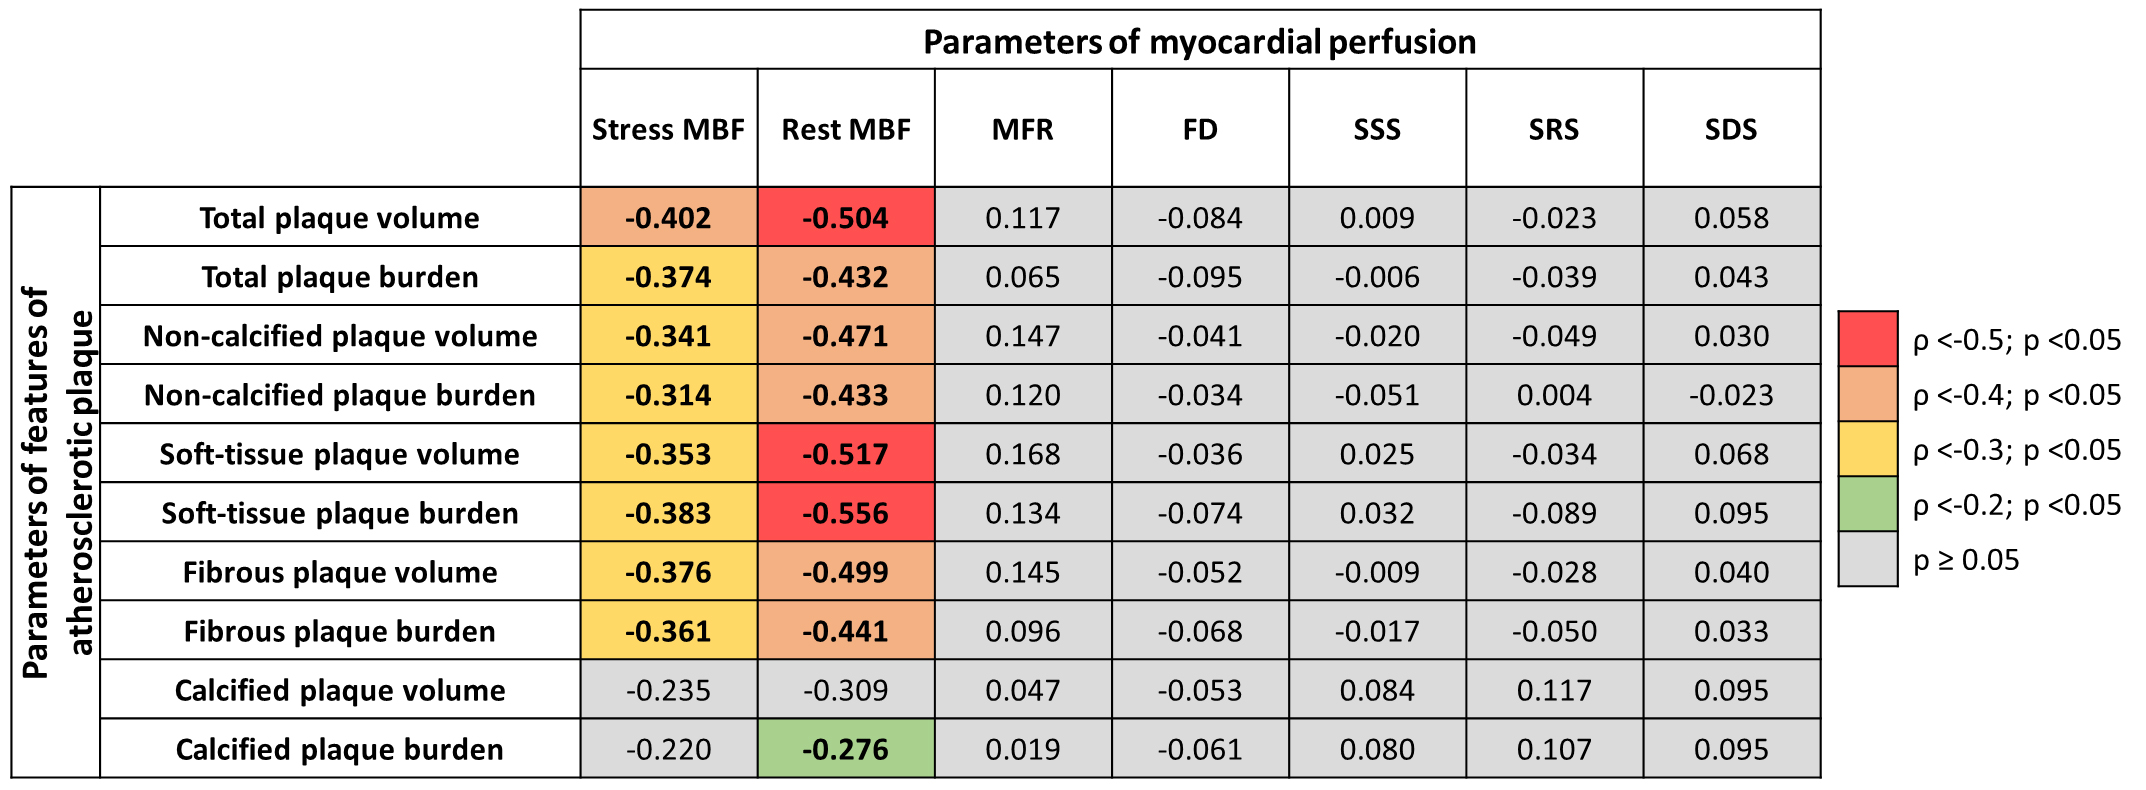 Fig. 2.
 A heatmap graph of associations between atherosclerotic plaque features and myocardial blood flow in NOCAD patients.
Based on the univariate logistic regression analysis results, the following quantitative CCTA parameters were predictors of reduced stress MBF of less than 1.5 mL/min/g: total plaque volume (OR 1.01; 95% CI 1.00–1.02; p = 0.006); total plaque burden (OR 1.21; 95% CI 1.05–1.40; p = 0.009); non-calcified plaque volume (OR 1.01; 95% CI 1.00–1.02; p = 0.007); non-calcified plaque burden (OR 1.22; 95% CI 1.04–1.43; p = 0.013); soft-tissue plaque volume (OR 1.07; 95% CI 1.01–0.12; p = 0.018); fibrous plaque volume (OR 1.01; 95% CI 1.00–1.02; p = 0.008); fibrous plaque burden (OR 1.27; 95% CI 1.06–1.52; p = 0.009). Additional covariates, such as age, sex, risk factors, laboratory markers of lipid profile, complete blood count, blood biochemistry tests, hemostasis panel, echocardiographic parameters of left ventricular contractility, and other coronary computed tomography angiography characteristics, were not significant predictors of a reduced stress MBF of less than 1.5 mL/min/g (Supplementary Table 2). Based on the stepwise multivariate logistic regression analysis result, adjusted for age, sex, and aforementioned clinical, laboratory, and echocardiographic characteristics, only total plaque volume (OR 1.01; 95% CI 1.005–1.030; p
The representative clinical case of the NOCAD patient with reduced stress MBF is shown in Fig. 3.
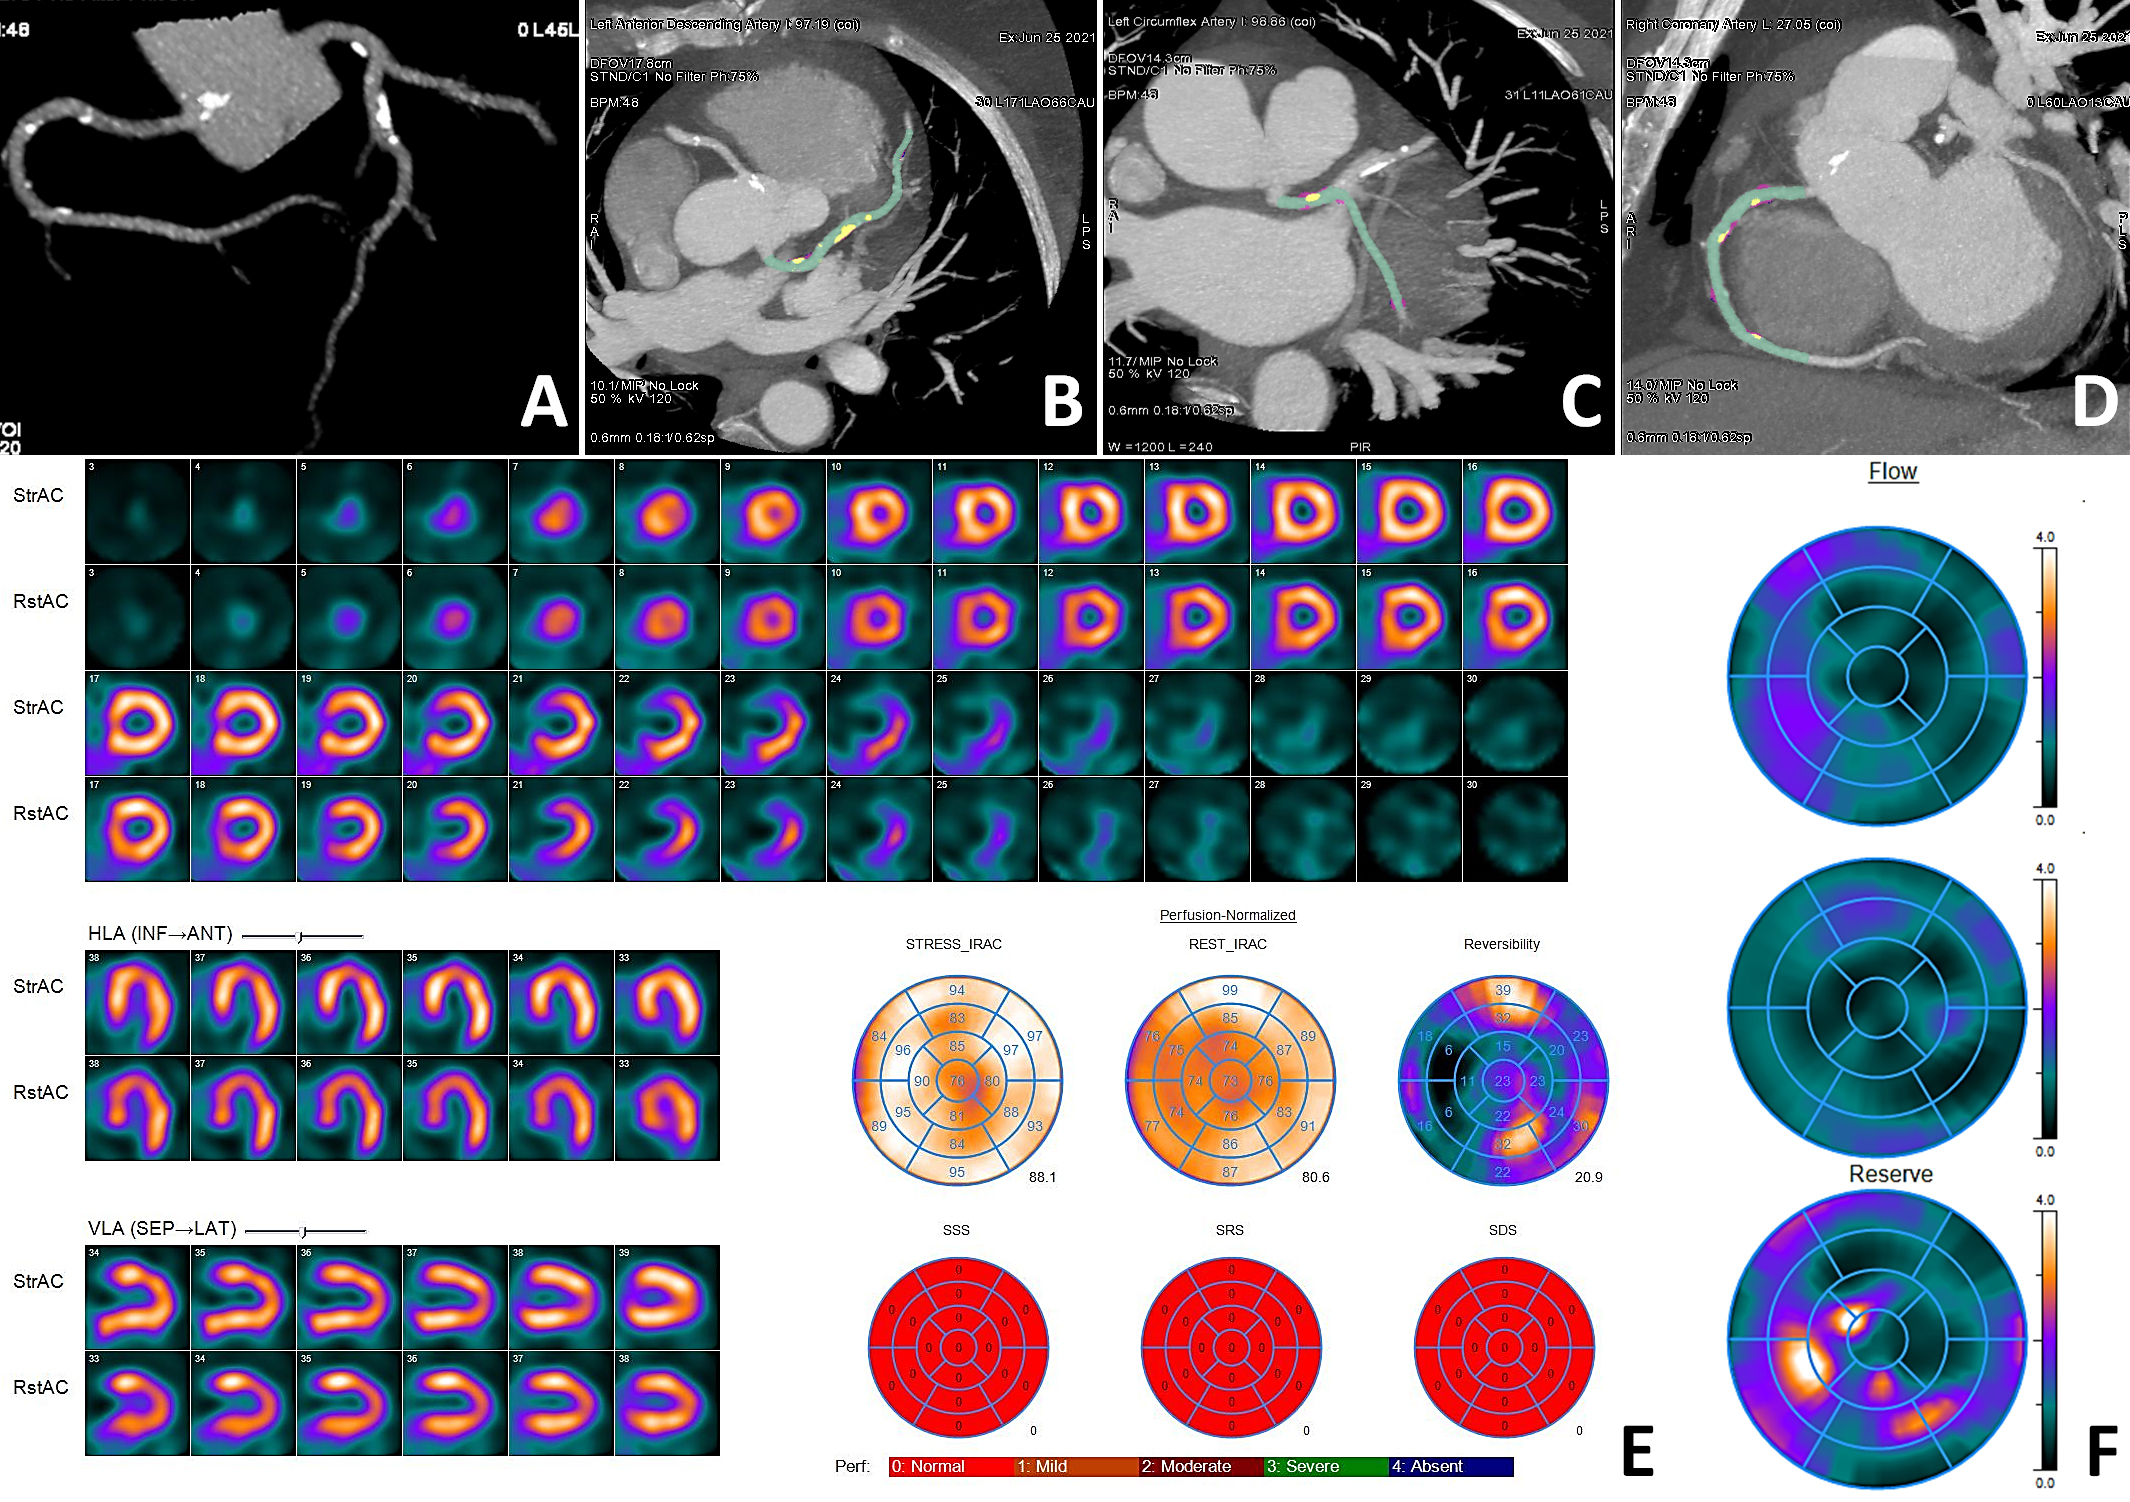 Fig. 3.
 Clinical case of a NOCAD patient with reduced stress MBF. Patient K., female, 56 years old, arterial hypertension, dyslipidemia. CCTA ((A) three-dimensional reconstruction of the coronary tree; (B) MIP of the LAD; (C) MIP of the LCX; (D) MIP of the RCA): diffuse NOCAD; maximum stenosis 40% in the proximal segment of the LAD; total plaque volume 288.2 mm3; total plaque burden 15.2%; non-calcified plaque volume 239.1 mm3; non-calcified plaque burden 12.6%; soft tissue plaque volume 9.5 mm3; soft tissue plaque burden 0.5%; fibrous plaque volume 229.6 mm3; fibrous plaque burden 12.1%; calcified plaque volume 49.1 mm3; calcified plaque burden 2.6%. MPI (E): normal myocardial perfusion; SSS 0; SRS 0; SDS 0. Myocardial dynamic CZT-SPECT (F): reduced stress MBF 0.91 mL/min/g, rest MBF 0.74 mL/min/g, reduced MFR 1.23, FD 0.17 mL/min/g. Green indicates the lumen of the coronary arteries, yellow indicates the calcified structural components of the plaque, and purple indicates the fibrous structural components of the plaque. CAD, coronary artery disease; CCTA, coronary computed tomography angiography; CZT, cadmium–zinc–telluride detectors; FD, flow difference; LAD, left anterior descending artery; LCX, left circumflex artery; MBF, myocardial blood flow; MIP, maximum intensity projection; MFR, myocardial flow reserve; MPI, myocardial perfusion imaging; NOCAD, non-obstructive coronary artery disease; RCA, right coronary artery; SDS, summed difference score; SPECT, single-photon emission computed tomography; SRS, summed rest score; SSS, summed stress score.
The results of this exploratory study support the notion that CCTA-derived total plaque volume is an independent predictor of a reduced stress MBF of less than 1.5 mL/min/g obtained by dynamic CZT-SPECT, even in the absence of obstructive CAD. Non-calcified (soft-tissue and fibrous) plaque volume and burden were linked with impaired MBF compared with calcified components. These findings support the concept that plaque volume and burden cause myocardial perfusion abnormalities to a greater extent than the degree of stenosis. Moreover, non-calcified plaques, in contrast to calcified ones, were associated with more severe myocardial perfusion abnormalities. These findings are significant in the context of developing an effective treatment strategy and improving prognoses.
Several studies have shown that the influence of stenosis severity on MBF may not be certain [4, 31, 32]. For instance, Schuijf et al. [31] reported that 15% of the patients with no stenosis
The non-calcified plaque contains a significant amount of cholesterol, making the plaque susceptible to rupture and potentially leading to cardiac events [35]. Recent studies have reported that components in an atherosclerotic plaque, such as lipid necrotic core, low-density non-calcified plaque, may predict myocardial ischemia or decrease MBF [12, 36, 37]. Diaz-Zamudio et al. [36] demonstrated this in a cohort of 184 patients with suspected CAD who underwent hybrid CCTA and stress and rest myocardial perfusion imaging scans on the CZT camera.
A low-density non-calcified plaque burden has been associated with ischemia in vessels with stenosis of 30–69% [36]. A similar result has been reported with FFR derived from CCTA for the detection of myocardial ischemia. Gaur et al. [37] found that a low-density non-calcified plaque volume of
Interestingly, the current study revealed no correlation between calcified plaque volume and MBF. This finding aligns with the results of Feuchtner et al. [39], who investigated 106 patients with NOCAD undergoing both CCTA and FFR. The authors revealed that an increasing plaque density, in particular calcified lesions, is associated with declining ischemia. Although it is well known that the influence of calcification on the plaque can be different, namely, leading to stability or rupture of the plaque. Wu et al. [40] described the mechanisms through which calcifications may play a positive role in plaque stability, and their negative effect depends on the localization of calcifications within the plaque. This finding warrants further investigation in future studies.
The main limitations of this study stem from the single-center design and relatively small sample size, which limit the diversity of patients and the spectrum of disease severity, reduce statistical power, and increase the risk of type II errors—potentially affecting the generalizability of the findings. Thus, this study can be considered preliminary and hypothesis-generating. Larger, multi-center studies with more heterogeneous populations are needed to validate and generalize these findings.
Total plaque volume, derived from quantitative CCTA data, is an independent predictor of a reduced stress MBF of less than 1.5 mL/min/g obtained by dynamic CZT-SPECT, even in the absence of obstructive CAD. These findings suggest that total plaque volume may serve as an early marker of CMD related to atherosclerosis in NOCAD patients, potentially identifying those at increased risk of developing CMD. The combined quantitative assessment of CCTA parameters and stress MBF could enhance the stratification of cardiovascular risk in the NOCAD population. Nonetheless, further studies are needed to obtain more data related to CZT MBF assessment, which could lead to the development of a model for early and accurate risk assessment of clinical status, treatment dynamics, and the likelihood of major adverse cardiovascular events.
1CAC, the one-compartment (single-component) model; CAD, coronary artery disease; CI, 95% confidence interval; CMD, coronary microvascular dysfunction; CCTA, coronary computed tomography angiography; CZT, cadmium-zinc-telluride; ECG, electrocardiographic-gated; EDV, end diastolic volume; EF, ejection fraction; ESV, end systolic volume; FD, flow difference; FFR, fractional flow reserve; ICC, intraclass correlation coefficient; LV, left ventricular; MBF, myocardial blood flow; MFR, myocardial flow reserve; NOCAD, non-obstructive coronary artery disease; OR, odds ratio; PET, positron emission tomography; SDS, summed difference score; SPECT, single-photon emission computed tomography; SRS, summed rest score; SSS, summed stress score.
The datasets used and analyzed during the current study are available from the corresponding author on reasonable request.
ANM and KVZ designed the research study. ANM, RVD, KVK, ASD, AVM, EVG, and KVZ performed the research. ANM, and RVD analyzed the data. ANM, RVD, KVK, and KVZ wrote the manuscript. All authors read and approved the final manuscript. All authors contributed to the conception and editorial changes in the manuscript. All authors have participated sufficiently in the work and agreed to be accountable for all aspects of the work.
The research protocol was approved by the Local Ethical Committee of Cardiology Research Institute, Tomsk National Research Medical Center, Russian Academy of Sciences (protocol No. 204, dated 18 November 2020), and all of the participants provided signed informed consent. The study responded to the Declaration of Helsinki for all human research.
Not applicable.
This research received no external funding.
The authors declare no conflict of interest.
Supplementary material associated with this article can be found, in the online version, at https://doi.org/10.31083/RCM39291.
References
Publisher’s Note: IMR Press stays neutral with regard to jurisdictional claims in published maps and institutional affiliations.