


 , Yu Song 3
1 Department of Heart Failure, TEDA International Cardiovascular Hospital, Tianjin University, 300457 Tianjin, China
2 Department of Cardiology, TEDA International Cardiovascular Hospital, Tianjin University, 300457 Tianjin, China
3 Department of CCU, TEDA International Cardiovascular Hospital, Tianjin University, 300457 Tianjin, China
4 Department of Cardiology, Shanghai Fourth People's Hospital, 200434 Shanghai, China
†These authors contributed equally.
Abstract
To perform a comprehensive assessment of the predictive value of soluble growth stimulator gene 2 protein (sST2) in predicting in-hospital Killip classes II–IV among patients with acute ST-segment elevation myocardial infarction (STEMI). This study aimed to provide more precise prognostic insights for informed clinical decision-making.
A retrospective cohort study was performed. The clinical records of STEMI patients admitted to Tianjin TEDA International Cardiovascular Hospital and who received primary percutaneous coronary intervention (PPCI) within 24 hours of symptom onset from July 2021 to March 2023 were analyzed. Statistical methodologies, including univariate and multivariate analyses, were applied to identify potential risk factors associated with the development of in-hospital Killip classes II–IV and to construct a reliable prediction model.
Among a total of 232 enrolled STEMI patients, 50 experienced Killip classes II–IV during their hospitalisation. Compared to those with Killip class I, the Killip class II-IV patients presented with significantly elevated sST2 concentrations and a higher heart rate (HR) at the first visit. In contrast, the left ventricular ejection fraction (LVEF) and estimated glomerular filtration rate (eGFR) values in these patients were significantly lower. Multivariate logistic regression analysis revealed that an sST2 level >77.3 ng/mL (odds ratio (OR) = 2.813, 95% confidence interval (CI): 1.201–6.586, p = 0.017), a first-visit HR >94 bpm (OR = 7.286, 95% CI: 2.778–19.106, p < 0.001), an LVEF <50% (OR = 3.336, 95% CI: 1.458–7.631, p = 0.004), and an eGFR <84 mL/(min·1.73 m2) (OR = 3.807, 95% CI: 1.556–9.316, p = 0.003) were independent risk factors for the occurrence of in-hospital Killip classes II–IV in STEMI patients treated with PPCI. Receiver operating characteristic (ROC) curve analysis, along with decision curve analysis (DCA), indicated that the combined predictive model integrating sST2, first-visit HR, LVEF, and eGFR exhibited a significantly stronger predictive ability compared to any single parameter.
In STEMI patients undergoing PPCI, the combination of sST2, first-visit HR, LVEF, and eGFR can effectively predict patients with Killip classes II–IV during hospitalisation, which may contribute to early intervention and improved patient outcomes.
Keywords
- ST-segment elevation acute myocardial infarction
- primary percutaneous coronary intervention
- soluble growth stimulator gene 2 protein
- Killip class
Currently, cardiovascular disease ranks as the leading cause of mortality globally. Acute ST-segment elevation myocardial infarction (STEMI) remains one of the most serious acute manifestations of coronary artery disease [1]. Over the past few decades, significant advancements have been made in the management of STEMI, particularly with the widespread accessibility of primary percutaneous coronary intervention (PPCI). However, the in-hospital mortality rate for STEMI patients still ranges between 5% and 8%, and the 1-year mortality rate can be as high as 14.3% [2]. Following myocardial infarction, cardiomyocytes experience impaired energy metabolism. Concurrently, inflammatory responses, oxidative stress, ischemia-reperfusion injury, myocardial hypertrophy, and fibrosis occur. These factors collectively result in abnormal myocardial remodelling and facilitate the progression of heart failure (HF) [3]. The typical clinical manifestations include dyspnea, pulmonary rales, peripheral edema, and elevated B-type natriuretic peptide (BNP) levels. Therefore, the early identification of high-risk features of HF is crucial for improving the prognosis of STEMI patients. Growth stimulator gene 2 (ST2) belongs to the interleukin (IL)-1 receptor family and has two subtypes: transmembrane (ST2L) and soluble (sST2). ST2L binds to IL-33 and has cardioprotective effects. These effects mainly include anti-myocardial fibrosis, inhibition of cardiac hypertrophy, reduction of apoptosis, and improvement of cardiac function. During HF, the secretion of sST2 increases. It then competitively binds to IL-33, thereby reducing the cardioprotective effects of the ST2L-IL-33 complex. Both domestic and international HF guidelines have suggested [4, 5] that sST2, an indicator of myocardial fibrosis, is valuable for the risk stratification and prognostic assessment of HF patients. However, there is a paucity of information regarding the use of sST2 to predict the development of Killip class II-IV during hospitalisation in STEMI patients treated with PPCI. Therefore, the objective of this study was to investigate the predictive efficacy of sST2 for the development of Killip class II-IV during the hospitalisation of STEMI patients.
This study retrospectively evaluated a total of 232 patients who presented to the Tianjin TEDA International Cardiovascular Hospital within 24 h of symptom onset between July 2021 and March 2023. These patients were diagnosed with STEMI and received PPCI. The diagnostic criteria for STEMI were derived from the 2017 guidelines for the diagnosis and treatment of STEMI by the European Society of Cardiology (ESC) [6].
Upon arrival at the emergency department of Chest Pain Centre, once the diagnosis of STEMI was confirmed, the catheterization laboratory was promptly activated, and emergency coronary angiography (CAG) was promptly carried out. The criteria for intraoperative PCI were based on the 2021 Guidelines for Coronary Revascularisation jointly published by the American College of Cardiology (ACC), American Heart Association (AHA), and Society of Cardiovascular Angiography and Interventions (SCAI) [7]. Both pre-operative and post-operative treatments were standardized in accordance with the ESC 2017 guidelines for the diagnosis and treatment of STEMI [6]. A flowchart of patient enrollment is presented in Fig. 1.
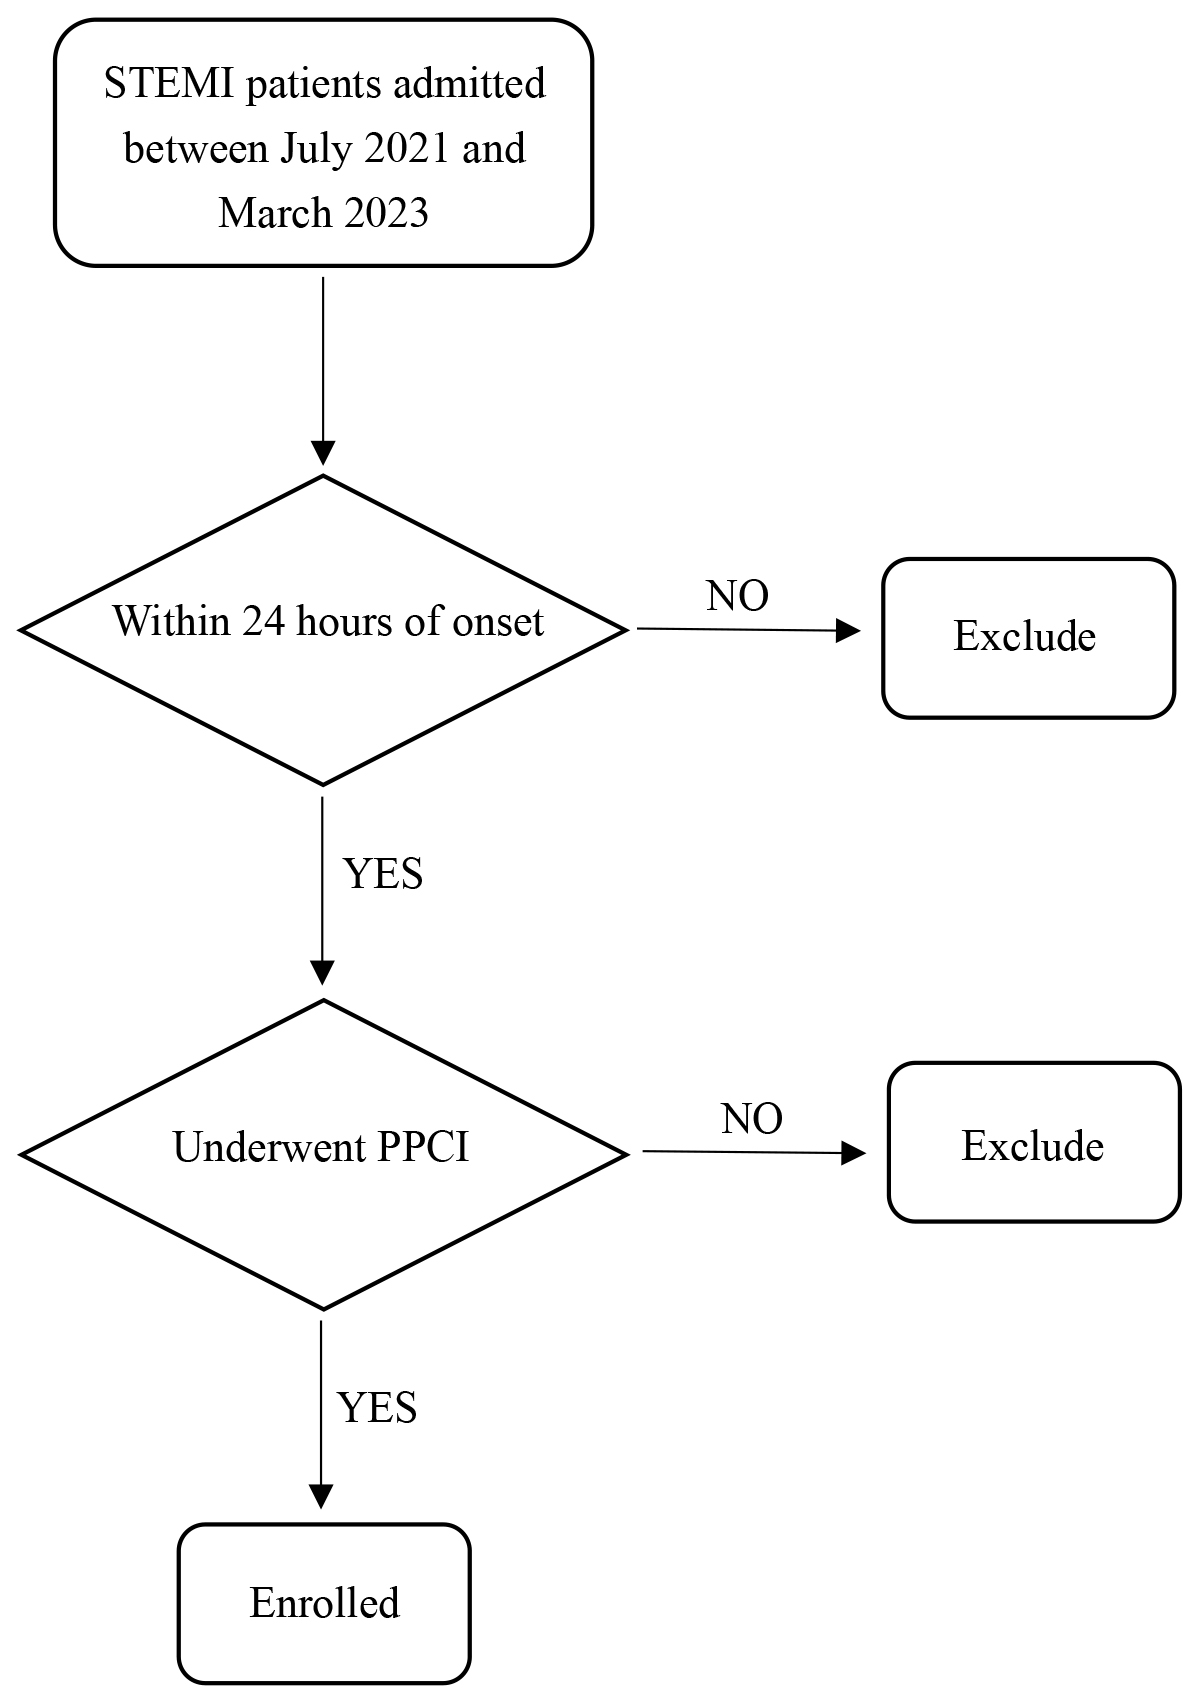 Fig. 1.
 Flow diagram of patient enrollment. STEMI, ST-segment elevation myocardial infarction; PPCI, primary percutaneous coronary intervention.
The study was approved by the ethics committee of the Tianjin TEDA International Cardiovascular Hospital (ethical approval number: [2023]-0310-1).
General information: This included gender, age, and body mass index (BMI).
Medical history: Information regarding the onset time of the disease, history of hypertension, diabetes mellitus, smoking status, and alcohol consumption was collected.
Initial vital signs: Temperature, heart rate (HR), respiratory rate (RR), blood pressure (BP), and oxygen saturation were recorded.
Intraoperative data: Door-to-wire time (D-to-W time), infarct-related artery (IRA), IRA pre-PCI thrombolysis in myocardial infarction (TIMI) flow grade, IRA post-PCI TIMI flow grade and the number of stents implanted were collected.
Laboratory tests: Cardiac biomarkers, including high-sensitivity troponin I (cTNI), myoglobin (MYO), and creatine kinase-MB isoenzyme (CK-MB), arterial blood gas analysis, full blood count, renal function tests, liver function tests, electrolyte assays, lipid profiles, random blood glucose (RBG) measurement, C-reactive protein (CRP) determination, sST2 quantification, N-terminal B-type natriuretic peptide precursor (NT-proBNP) assessment, thyroid function tests, bedside cardiac ultrasound examinations, and holter monitor were conducted. All of the above tests (excluding the holter monitor) were completed within 24 hours of admission, while the ambulatory electrocardiogram was completed within 48 hours of admission. The estimated glomerular filtration rate (eGFR) was calculated using the modified simplified modification of diet in renal disease (MDRD) formula.
All sST2 blood samples collected at 12 hours post-PPCI. The study protocol specified that 5 mL of venous blood was collected from each patient using serum separation gel tubes containing clot activator. Following collection, samples were centrifuged at 2095
In accordance with the 2017 guideline for the diagnosis and treatment of STEMI by the ESC [6], the Killip cardiac function classification was applied to STEMI patients. Patients were categorized into two groups based on Killip classification: class I vs. class II–IV. By comparing the clinical parameters of the two groups of patients, independent predictors of in-hospital Killip class II–IV in STEMI patients were screened out. Subsequently, a prediction model was established and evaluated.
Normality was evaluated by Kolmogorov-Smirnov test (
The optimal cut-off values of the variables were calculated using the receiver operating characteristic curve (ROC curve), with Youden’s index (Youden’s index = sensitivity + specificity-1) serving as the criterion. Univariate logistic regression and least absolute shrinkage and selection operator (LASSO) regression were utilized to screen for risk factors of heart failure in STEMI patients treated with PPCI. Covariance analysis was performed on the univariate analysis of variance indices, and the screened risk factors were incorporated into multivariate logistic regression to establish a prediction model.
The efficacy of the prediction model was evaluated using ROC curve analysis and decision curve analysis (DCA). Statistical analyses were performed using SPSS 26 (IBM Corporation, Armonk, NY, USA) and R 4.1 (R Foundation for Statistical Computing, Vienna, Austria; glmnet, rmda packages). A p-value
Among the 232 patients, 190 (81.9%) were male and 42 (18.1%) were female, with a mean age of 59.6
| Variable | Total (n = 232) | Killip class I (n = 182) | Killip class II–IV (n = 50) | p | |
| Age (years) | 59.6 | 58.7 | 62.6 | 0.041 | |
| Women (%) | 42 (18.1) | 33 (18.1) | 9 (18.0) | 0.983 | |
| BMI (Kg/m2) | 24.9 (23.3, 27.0) | 25.2 (23.5, 27.1) | 24.4 (22.5, 25.9) | 0.096 | |
| Current smoking (%) | 114 (49.1) | 92 (50.5) | 22 (44.0) | 0.412 | |
| Drinking history (%) | 48 (20.7) | 33 (18.1) | 15 (30.0) | 0.067 | |
| Hypertension (%) | 130 (56.0) | 102 (56.0) | 28 (56.0) | 0.996 | |
| Diabetes (%) | 54 (23.3) | 38 (20.9) | 16 (32.0) | 0.099 | |
| Onset time (h) | 3.0 (2.0, 5.0) | 3.0 (2.0, 5.0) | 3.3 (2.0, 5.8) | 0.538 | |
| First vital signs | |||||
| HR (times/minute) | 73 (62, 86) | 71 (61, 80) | 87 (67, 102) | ||
| RR (times/minute) | 18 (17, 20) | 18 (18, 20) | 20 (17, 20) | 0.241 | |
| SBP (mmHg) | 141 (123, 157) | 142 (124, 158) | 136 (118, 153) | 0.125 | |
| DBP (mmHg) | 86 (76, 98) | 85 (76, 98) | 86 (76, 97) | 0.963 | |
| MAP (mmHg) | 104 (94, 116) | 105 (94, 117) | 102 (89, 115) | 0.566 | |
| SpO2 (%) | 98 (97, 99) | 98 (97, 99) | 98 (97, 99) | 0.073 | |
| D-to-W time (min) | 56 (79, 75) | 57 (94, 76) | 55 (48, 68) | 0.221 | |
| IRA | |||||
| LM (%) | 4 (1.7) | 0 (0.0) | 4 (8.0) | 0.001 | |
| LAD (%) | 120 (51.7) | 87 (47.8) | 33 (66.0) | ||
| LCX (%) | 18 (7.8) | 17 (9.3) | 1 (2.0) | ||
| RCA (%) | 89 (38.4) | 77 (42.3) | 12 (24) | ||
| Intermediate branch (%) | 1 (0.4) | 1 (0.5) | 0 (0) | ||
| IRA pre-PCI TIMI flow grade | |||||
| Class 0 (%) | 41 (17.7) | 34 (18.7) | 7 (14.0) | 0.636 | |
| Class 1 (%) | 14 (6.0) | 12 (6.6) | 2 (4.0) | ||
| Class 2 (%) | 25 (10.8) | 18 (9.9) | 7 (14.0) | ||
| Class 3 (%) | 152 (65.5) | 118 (64.8) | 34 (68.0) | ||
| IRA Pos-PCI TIMI flow grade | |||||
| Class 2 (%) | 7 (3.0) | 2 (1.1) | 5 (10.0) | 0.005 | |
| Class 3 (%) | 225 (97.0) | 180 (98.9) | 45 (90.0) | ||
| Number of stents implanted | |||||
| 1 (%) | 193 (83.2) | 154 (84.6) | 39 (78.0) | 0.256 | |
| 2 (%) | 37 (15.9) | 27 (14.8) | 10 (20.0) | ||
| 2 (0.9) | 1 (0.5) | 1 (2.0) | |||
| LVEF (%) | 53 | 55 | 48 | ||
| LV-Dds (mm) | 46 (44, 48) | 46 (44, 48) | 46 (43, 49) | 0.616 | |
| NT-proBNP (pg/mL) | 1088 (368, 1815) | 940 (314, 1483) | 1570 (817, 2971) | ||
| cTnI (pg/mL) | 25.6 (21.4, 26.7) | 25.6 (16.7, 26.7) | 25.6 (25.4, 26.6) | 0.112 | |
| MYO (ng/mL) | 104.5 (53.0, 297.6) | 93.5 (48.5, 217.7) | 251.2 (90.2, 539.6) | ||
| CK-MB (ng/mL) | 146.7 (68.5, 288.0) | 136.7 (57.2, 262.4) | 206.5 (113.0, 288.0) | 0.003 | |
| WBC (109/L) | 9.9 (8.4, 12.3) | 9.8 (8.3, 12.2) | 11.1 (9.0, 14.1) | 0.023 | |
| N% | 74.1 | 73.2 | 77.1 | 0.002 | |
| RBC (1012/L) | 4.5 | 4.5 | 4.5 | 0.511 | |
| HB (g/L) | 138 | 138 | 139 | 0.559 | |
| HCT (%) | 41.3 | 41.0 | 41.7 | 0.415 | |
| PLT (109/L) | 213 (180, 253) | 218 (180, 255) | 206 (178, 247) | 0.319 | |
| CRP (mg/L) | 4.9 (2.4, 13.3) | 4.9 (2.2, 9.6) | 12.3 (3.3, 35.2) | ||
| ALP (U/L) | 78.0 (65.4, 91.0) | 77.7 (65.9, 91.3) | 84.1 (65.0, 90.0) | 0.569 | |
| ALT (U/L) | 53 (30, 74) | 45 (29, 69) | 73 (55, 113) | ||
| AST (U/L) | 196 (100, 315) | 164 (85, 259) | 340 (205, 464) | ||
| RBG (mmol/L) | 8.5 (7.0, 10.7) | 8.3 (6.9, 10.4) | 9.2 (7.3, 12.6) | 0.007 | |
| Cr (μmol/L) | 69 (59, 79) | 67 (58, 76) | 75 (65, 100) | 0.001 | |
| BUN (mmol/L) | 6.0 (5.0, 7.0) | 5.8 (4.9, 7.0) | 7.7 (5.4, 9.7) | ||
| UA (μmol/L) | 346 (285, 402) | 345 (284, 388) | 363 (292, 441) | 0.097 | |
| eGFR [mL/(min | 106.7 (82.3, 129.3) | 108.1 (89.5, 130.9) | 86.8 (57.4, 119.9) | 0.004 | |
| K+ (mmol/L) | 3.9 (3.7, 4.2) | 3.9 (3.7, 4.2) | 4.1 (3.8, 4.6) | 0.005 | |
| NA+ (mmol/L) | 139 (138, 141) | 139 (138, 141) | 139 (137, 141) | 0.081 | |
| CL– (mmol/L) | 105 (105, 107) | 106 (103, 108) | 103 (102, 106) | 0.001 | |
| TP (g/L) | 65 (63, 68) | 65 (62, 67) | 66 (64, 71) | 0.011 | |
| ALB (g/L) | 39 (38, 41) | 40 (38, 41) | 39 (37, 41) | 0.159 | |
| GLO (g/L) | 26 (24, 28) | 25 (23, 27) | 28 (26, 31) | ||
| TCHOL (mmol/L) | 4.5 (4.0, 5.1) | 4.5 (4.0, 5.1) | 4.6 (4.0, 5.3) | 0.658 | |
| TG (mmol/L) | 1.5 (1.0, 2.2) | 1.6 (1.0, 2.4) | 1.3 (0.9, 2.0) | 0.193 | |
| LDL-C (mmol/L) | 2.9 (2.4, 3.4) | 2.87 (2.4, 3.4) | 3.0 (2.4, 3.6) | 0.705 | |
| HDL-C (mmol/L) | 1.0 (0.8, 1.2) | 1.0 (0.8, 1.1) | 1.0 (0.9, 1.2) | 0.059 | |
| sST2 (ng/mL) | 47.8 (27.2, 92.6) | 40.0 (25.1, 77.6) | 90.1 (44.3, 185.6) | ||
| TSH (mIU/L) | 1.1 (0.7, 1.9) | 1.1 (0.7, 1.9) | 1.2 (0.7, 1.9) | 0.583 | |
| LAC (mmol/L) | 1.8 (1.3, 2.5) | 1.7 (1.2, 2.3) | 2.1 (1.5, 3.2) | 0.006 | |
| Holter monitor | |||||
| Mean HR (bpm) | 71 (66, 82) | 69 (64, 78) | 82 (72, 89) | ||
| Max HR (bpm) | 106 (97, 115) | 104 (95, 114) | 113 (103, 121) | 0.001 | |
| Total ventricular rhythms (times) | 53 (5, 1226) | 37 (4, 724) | 180 (8, 2026) | 0.119 | |
| Total atrial rhythms (times) | 48 (9, 335) | 44 (9, 320) | 57 (9, 640) | 0.300 | |
| Max RR (s) | 1.3 (1.2, 1.5) | 1.4 (1.2, 1.5) | 1.2 (1.0, 1.4) | 0.002 | |
Note: BMI, body mass index; HR, heart rate; RR, respiratory rate; SBP, systolic blood pressure; DBP, diastolic blood pressure; MAP, mean arterial pressure; SpO2, oxygen saturation; IRA, infarct-related artery; LM, left main coronary artery; LAD, left anterior descending branch; LCX, left circumflex branch; RCA, right coronary artery; LVEF, left ventricular ejection fraction; LV-Dds, left ventricular end-diastolic inner diameter; NT-proBNP, N-terminal B-type natriuretic peptide precursor; cTnI, high-sensitivity troponin I; MYO, myoglobin; CK-MB, creatine kinase-MB isoenzyme; WBC, white blood cell count; N%, neutrophil percentage; RBC, red blood cell; HB, haemoglobin; HCT, hematocrit; PLT, platelet count; CRP, C-reactive protein; ALP, alkaline phosphatase; ALT, alanine aminotransferase; AST, aspartate aminotransferase; RBG, random blood glucose; Cr, creatinine; BUN, blood urea nitrogen; UA, uric acid; eGFR, estimated glomerular filtration rate; TP, total protein; ALB, albumin; GLO, globulin; TCHOL, total cholesterol; TG, triglycerides; LDL-C, low-density lipoprotein cholesterol; HDL-C, high-density lipoprotein cholesterol; sST2, soluble growth-stimulating expressed gene 2 protein; TSH, thyrotropin; LAC, lactate; D-to-W, door-to-wire; PCI, percutaneous coronary intervention; TIMI, thrombolysis in myocardial infarction.
The area under the curve (AUC) of the ROC curves for the first-visit HR, NT-proBNP, eGFR, sST2, and mean HR (holter) were analyzed individually. The Youden’s Index was utilized to determine the optimal cut-off values. The results are presented in Table 2.
| Variable | AUC | 95% CI | Cutoff value | Youden’s index | Specificity | Sensitivity | p |
| First-visit HR (bpm) | 0.681 | 0.587–0.776 | 94 | 0.378 | 91.8% | 46.0% | |
| NT-proBNP (pg/mL) | 0.668 | 0.580–0.756 | 1367.05 | 0.309 | 70.9% | 60.0% | |
| eGFR [mL/(min | 0.634 | 0.540–0.729 | 84 | 0.297 | 79.7% | 50.0% | 0.004 |
| sST2 (ng/mL) | 0.729 | 0.649–0.809 | 77.3 | 0.364 | 76.4% | 60.0% | |
| Mean HR (holter) (bpm) | 0.726 | 0.646–0.806 | 74 | 0.390 | 67.0% | 72.0% |
Note: AUC, area under the curve; CI, confidence interval; HR, heart rate; NT-proBNP, N-terminal B-type natriuretic peptide precursor; eGFR, estimated glomerular filtration rate; sST2, soluble growth-stimulating expressed gene 2 protein; ROC, receiver operating characteristic.
Logistic regression was performed to conduct a univariate analysis of each factor. The results indicated that the factors significantly influencing the occurrence of heart failure were as follows: first-visit HR, IRA, IRA Post-PCI TIMI flow grade, LVEF, NT-proBNP, MYO, CK-MB, WBC, N%, CRP, ALT, AST, RBG, eGFR, sST2, LAC, mean HR (holter), and max HR (holter). The detailed data can be found in Table 3.
| Variable | Wald χ2 | OR | SE | 95% CI | p | |
| Age (per SD years) | 3.121 | 0.263 | 1.301 | 0.149 | 0.972–1.743 | 0.077 |
| First-visit HR | 33.040 | 2.250 | 9.484 | 0.391 | 4.404–20.423 | |
| IRA (LM & LAD) | 10.207 | 1.134 | 3.108 | 0.355 | 1.550–6.231 | 0.001 |
| IRA Post-PCI TIMI flow grade | 7.285 | 2.303 | 10.000 | 0.853 | 1.879–53.230 | 0.007 |
| LVEF | 20.090 | 1.508 | 4.518 | 0.336 | 2.336–8.737 | |
| NT-proBNP | 14.673 | 1.269 | 3.556 | 0.331 | 1.858–6.804 | |
| MYO (per IQR ng/mL) | 7.290 | 0.134 | 1.144 | 0.050 | 1.038–1.261 | 0.007 |
| CK-MB (per 100 ng/mL) | 7.115 | 0.526 | 1.692 | 0.197 | 1.150–2.490 | 0.008 |
| WBC (per 5 | 9.945 | 0.689 | 1.992 | 0.218 | 1.298–3.056 | 0.002 |
| N% (per SD) | 9.363 | 0.518 | 1.679 | 0.169 | 1.205–2.339 | 0.002 |
| CRP (per 10 mg/L) | 16.175 | 0.377 | 1.457 | 0.094 | 1.213–1.751 | |
| ALT (per 40 U/L) | 13.931 | 0.473 | 1.606 | 0.127 | 1.252–2.059 | |
| AST (per 200 U/L) | 23.267 | 1.072 | 2.923 | 0.222 | 1.890–4.519 | |
| RBG (per 5 mmol/L) | 7.092 | 0.499 | 1.647 | 0.187 | 1.141–2.379 | 0.008 |
| eGFR | 16.375 | 1.366 | 3.919 | 0.338 | 2.022–7.594 | |
| sST2 | 21.905 | 1.579 | 4.849 | 0.337 | 2.503–9.392 | |
| LAC (per 2 IQR mmol/L) | 8.246 | 0.701 | 2.015 | 0.244 | 1.249–3.250 | 0.004 |
| Mean HR (holter) | 20.184 | 1.557 | 4.744 | 0.347 | 2.405–9.358 | |
| Max HR (holter) (per 20 bpm) | 10.140 | 0.634 | 1.885 | 0.199 | 1.276–2.785 | 0.001 |
| Max RR (holter) (per IQRs) | 3.252 | –0.319 | 0.727 | 0.177 | 0.514–1.028 | 0.071 |
Note: OR, odds ratio; CI, confidence interval; HR, heart rate; IRA, infarct-related artery; LM, left main coronary artery; LAD, left anterior descending branch; LVEF, left ventricular ejection fraction; NT-proBNP, N-terminal B-type natriuretic peptide precursor; MYO, myoglobin; CK-MB, creatine kinase-MB isoenzyme; WBC, white blood cell count; N%, neutrophil percentage; CRP, C-reactive protein; ALT, alanine aminotransferase; AST, aspartate aminotransferase; RBG, random blood glucose; eGFR, estimated glomerular filtration rate; sST2, soluble growth-stimulating expressed gene 2 protein; LAC, lactate; SD, standard deviation; IQR, interquartile spacing; PCI, percutaneous coronary intervention; TIMI, thrombolysis in myocardial infarction; RR, respiratory rate; STEMI, ST-segment elevation myocardial infarction.
Eighteen statistically significant variables mentioned above were incorporated into the LASSO regression analysis. Additionally, age, gender, BMI, history of hypertension, diabetes mellitus, smoking history, and history of alcohol consumption were simultaneously included in the LASSO regression analysis for correction. When the smallest mean squared error occurred at
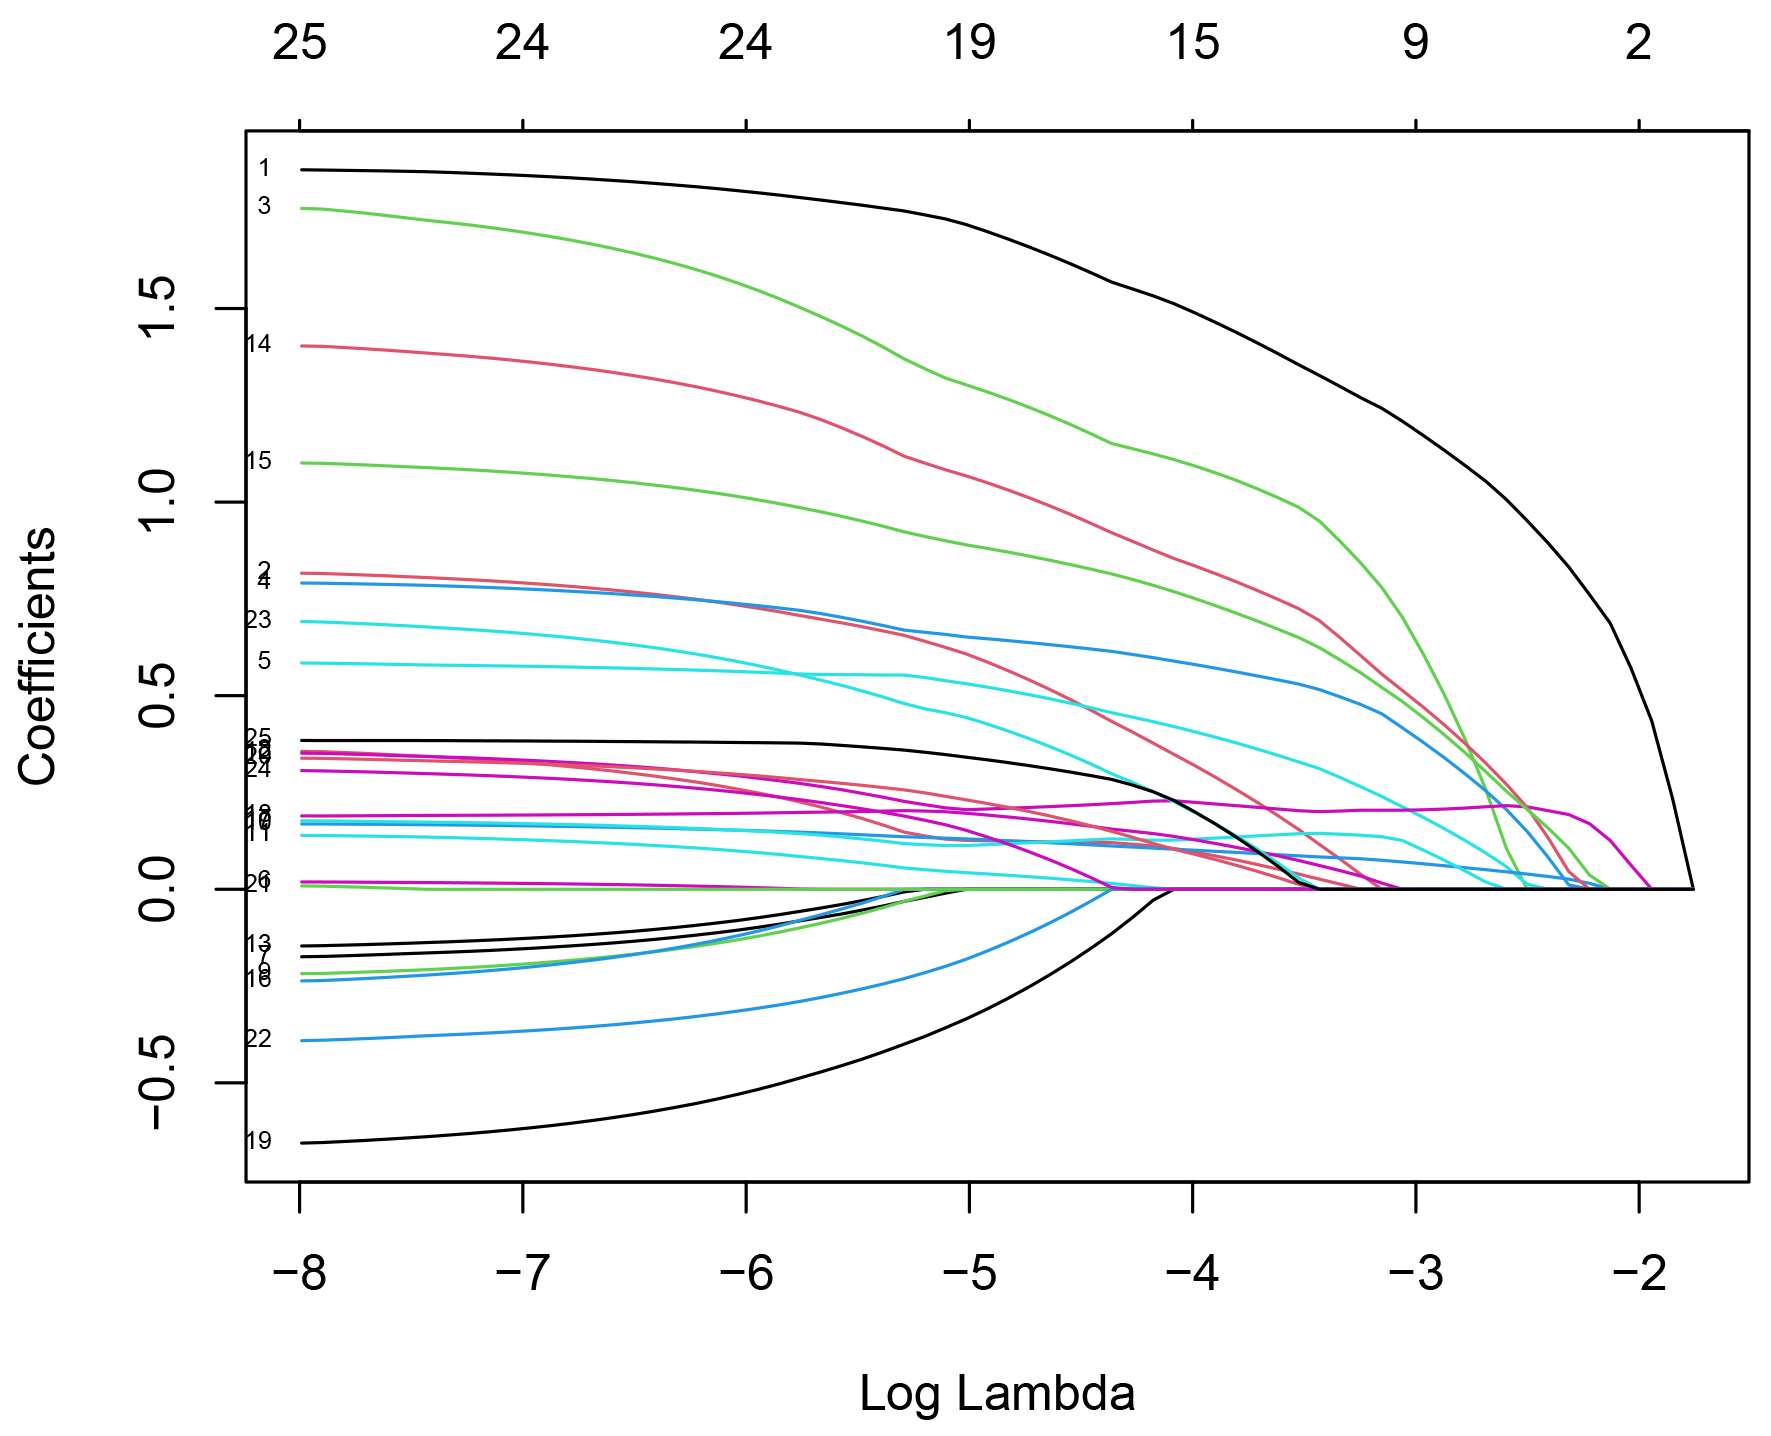 Fig. 2.
 LASSO regression coefficient relationship. Note: The horizontal axis below represents log(
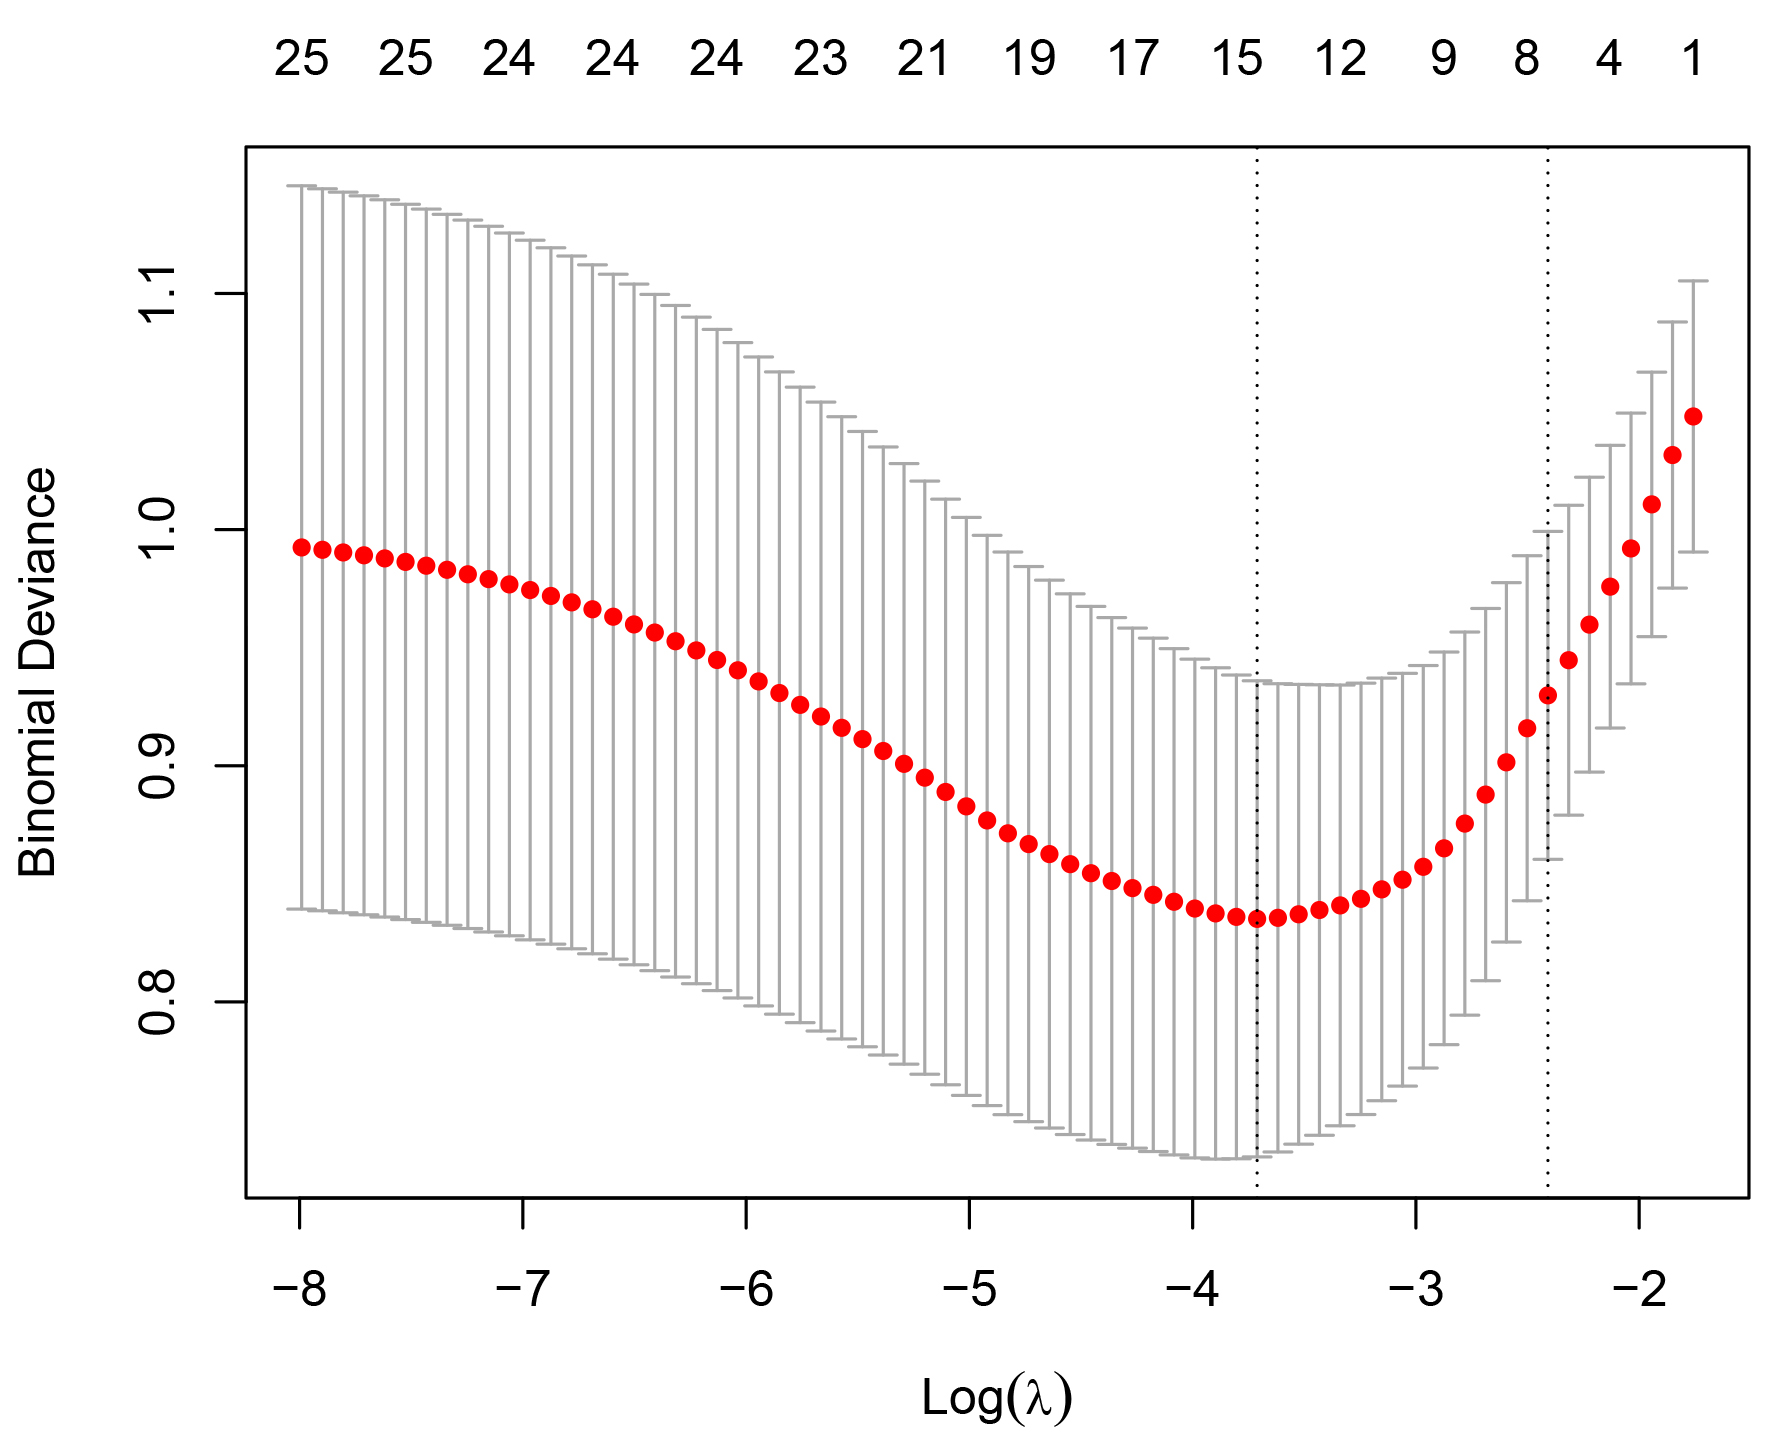 Fig. 3.
 LASSO regression coefficient relationship. Note: The dashed vertical lines represent the minimum mean square error and the distance minimum mean square error plus one standard error (optimal solution). The log(
Variables including first-visit HR
| Variable | Tol | VIF |
| First-visit HR | 0.834 | 1.199 |
| LVEF | 0.903 | 1.107 |
| CRP (per 10 mg/L) | 0.833 | 1.201 |
| ALT (per 40 U/L) | 0.792 | 1.263 |
| eGFR | 0.879 | 1.138 |
| sST2 | 0.799 | 1.251 |
Note: Tol, tolerance; VIF, variance inflation factor; HR, heart rate; bpm, beats/minute; LVEF, left ventricular ejection fraction; CRP, C-reactive protein; ALT, alanine aminotransferase; eGFR, estimated glomerular filtration rate; sST2, soluble growth-stimulated expressed gene 2 protein; STEMI, ST-segment elevation myocardial infarction.
A multifactorial analysis was conducted by incorporating the above-mentioned six variables into a logistic regression equation. The analysis revealed that an sST2 level
| Variable | Wald χ2 | OR | SE | 95% CI | p | |
| sST2 | 5.678 | 1.034 | 2.813 | 0.434 | 1.201–6.586 | 0.017 |
| First-visit HR | 16.299 | 1.986 | 7.286 | 0.492 | 2.778–19.106 | |
| LVEF | 8.140 | 1.205 | 3.336 | 0.422 | 1.458–7.631 | 0.004 |
| eGFR | 8.571 | 1.337 | 3.807 | 0.457 | 1.556–9.316 | 0.003 |
Note: OR, odds ratio; CI, confidence interval; sST2, soluble growth-stimulated expressed gene 2 protein; HR, heart rate; LVEF, left ventricular ejection fraction; eGFR, estimated glomerular filtration rate; STEMI, ST-segment elevation myocardial infarction.
When sST2 was combined with the first-visit HR, LVEF, and eGFR to predict the development of Killip class II-IV in STEMI patients treated with PPCI, the AUC was 0.846 (95% CI: 0.778–0.915), with a p-value of
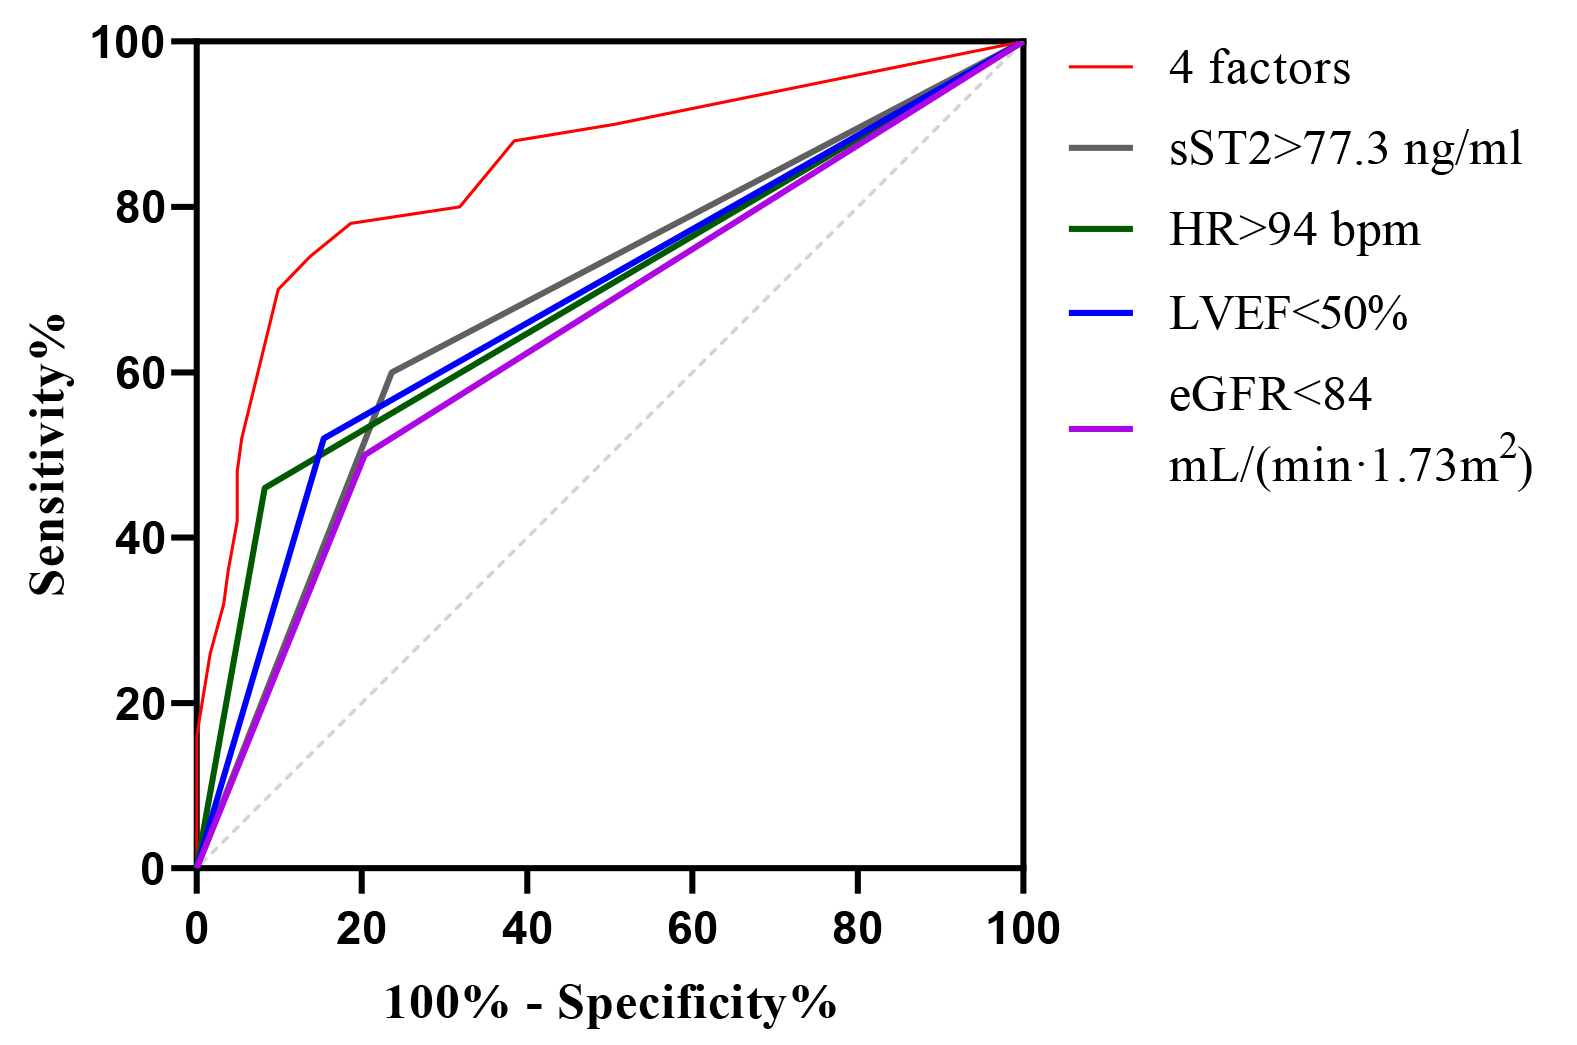 Fig. 4.
 ROC curve analysis of sST2, HR, LVEF, and eGFR alone and in combination for predictive modeling. ROC, receiver operating characteristic; sST2, soluble growth-stimulated expressed gene 2 protein; HR, heart rate; LVEF, left ventricular ejection fraction; eGFR, estimated glomerular filtration rate.
| Variable | AUC | SE | 95% CI | Sensitivity (%) | Specificity (%) | p |
| 4 factors | 0.846 | 0.034 | 0.778–0.915 | 70.0 | 89.6 | |
| sST2 | 0.682 | 0.045 | 0.594–0.769 | 60.0 | 76.4 | |
| First-visit HR | 0.689 | 0.047 | 0.596–0.782 | 46.0 | 91.8 | |
| LVEF | 0.683 | 0.045 | 0.593–0.774 | 56.0 | 78.0 | |
| eGFR | 0.648 | 0.046 | 0.557–0.739 | 50.0 | 79.7 | 0.001 |
Note: AUC, area under the curve; ROC, receiver operating characteristic; CI, confidence interval; sST2, soluble growth-stimulated expressed gene 2 protein; LVEF, left ventricular ejection fraction; eGFR, estimated glomerular filtration rate; HR, heart rate.
The four-marker model (purple dashed line) showed clinical utility when its net benefit exceeded the “all-intervention” (gray solid line) and “no-intervention” (black horizontal line) thresholds, with superior net benefit at threshold probabilities of 0.09–0.81 (Fig. 5). This wide threshold probability range suggests substantial clinical value for the model’s application in practice.
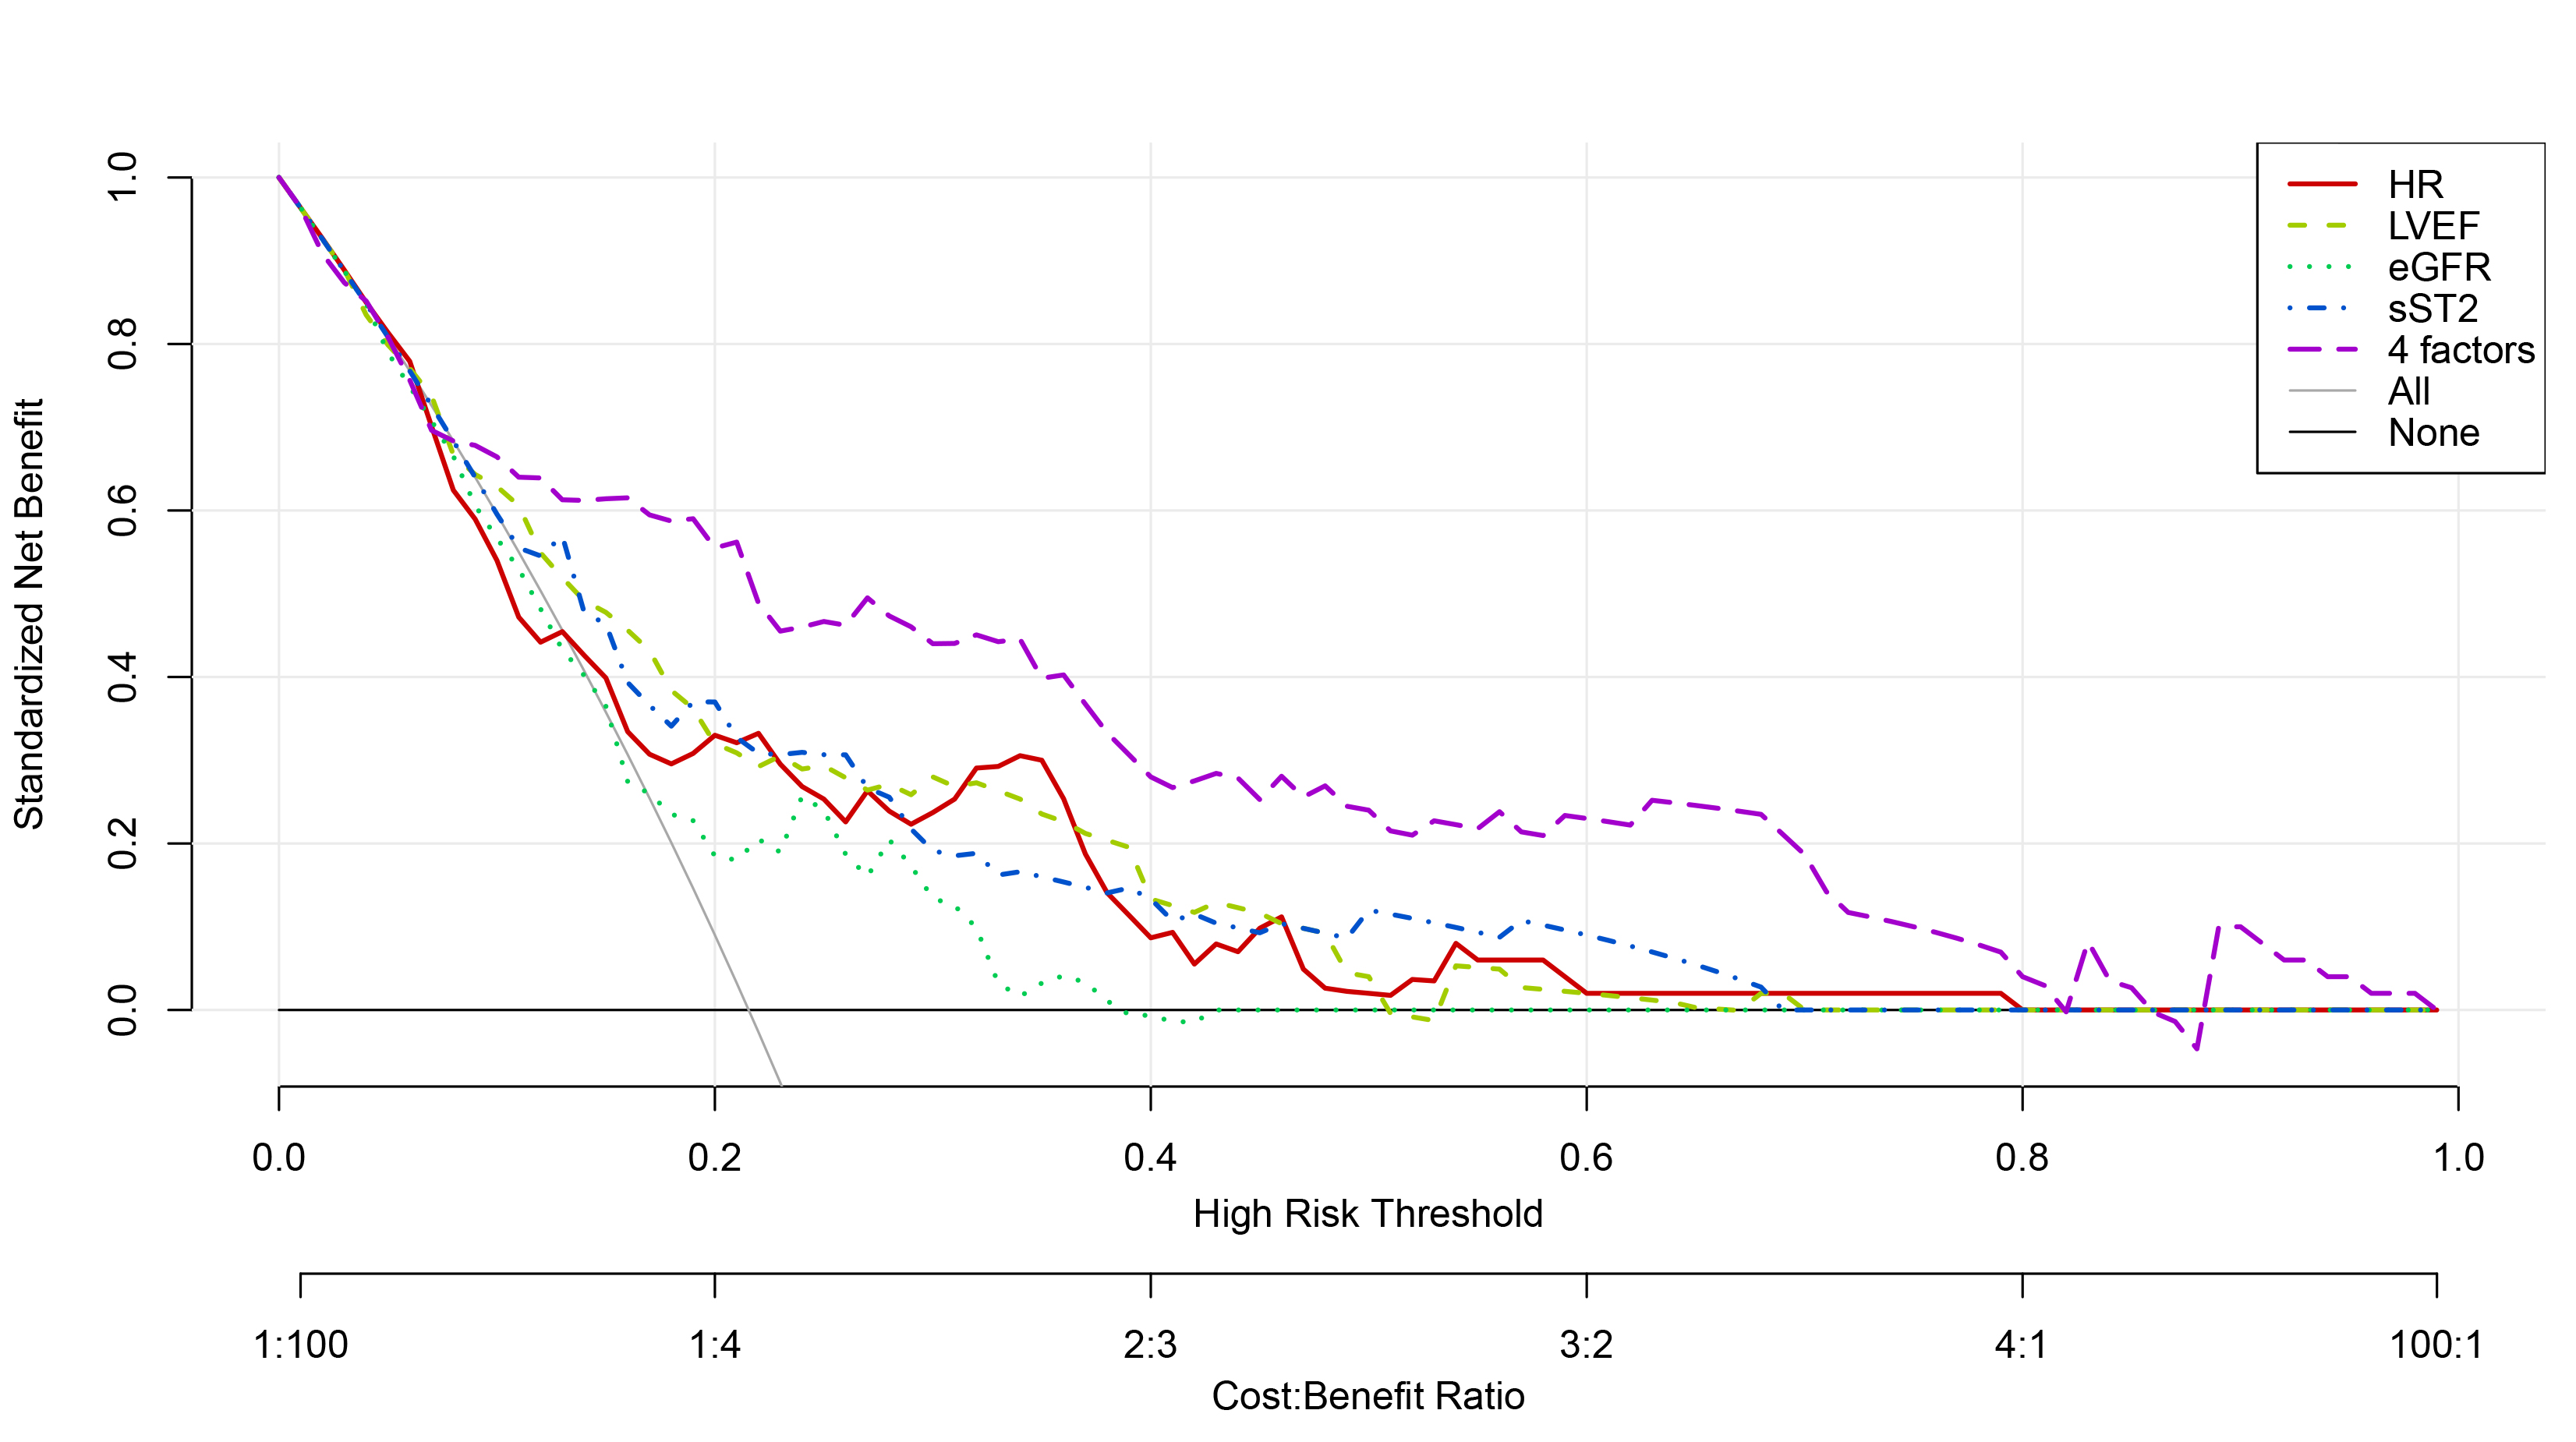 Fig. 5.
 Decision curves of sST2, HR, LVEF, eGFR alone and in combination to predict Killip class II-IV in-hospital in PPCI-treated STEMI patients. sST2, soluble growth-stimulated expressed gene 2 protein; HR, heart rate; LVEF, left ventricular ejection fraction; eGFR, estimated glomerular filtration rate; PPCI, primary percutaneous coronary intervention; STEMI, ST-segment elevation myocardial infarction.
In this study, by analyzing the relationship between clinical indicators and the development of Killip class II–IV during hospitalisation in STEMI patients treated with PPCI, we demonstrated that sST2 was an independent predictor of in-hospital Killip class II–IV development in STEMI patients. Moreover, the predictive efficacy of the combination of sST2, first-visit HR, LVEF, and eGFR was superior to that of any single indicator.
Compared to other biomarkers such as NT-proBNP, the advantage of sST2 lies in its concentration being unaffected by age, renal function, intravascular volume, BMI, or atrial fibrillation [8]. This relative independence from common heart failure comorbidities implies its potential superiority in the prediction of heart failure [8]. NT-proBNP is a traditional and internationally recognized biomarker for heart failure but was not included in the final predictive model of this study. We considered two reasons for the lower-than-expected admission NT-proBNP levels in our study patients, which may have compromised its ability to objectively predict heart failure outcomes. First, the BMI of STEMI patients included in this study was generally high. The median BMI for all patients was 24.87 kg/m2, with non-heart failure patients having a median BMI of 25.16 kg/m2 and heart failure patients a median BMI of 24.14 kg/m2 (no statistically significant difference between the groups). A BMI between 24.0 and 27.9 is classified as overweight. A study has confirmed that NT-proBNP levels are inversely correlated with BMI [9], possibly due to hemodilution, increased degradation of NT-proBNP by adipose tissue, and alterations in ventricular function. Second, acute myocardial infarction (AMI) patients often experience significant diaphoresis due to severe pain before hospitalisation or reduced oral intake, leading to intravascular volume depletion upon admission. Consequently, myocardial mechanical stress may not be significantly increased, resulting in normal or only mildly elevated NT-proBNP levels in the early hospital phase.
The IL-33-ST2L pathway can immunologically inhibit the development of atherosclerosis via helper T-cell 2 and macrophage 2 phenotype responses. Conversely, high levels of sST2 may promote plaque progression [10]. Therefore, sST2 can be regarded as a marker for both early and late post-infarction remodelling. Jenkins et al. [11] classified a cohort of 1401 AMI patients into three cardiovascular risk classes according to early sST2 values. Class 2 (37
Acute kidney injury (AKI) and chronic kidney disease (CKD) are indicators of poor prognosis in AMI. As renal function deteriorates, numerous metabolic pathways are disrupted. These include alterations in cardiac volume and pressure status, accelerated atherosclerosis, electrolyte metabolism disorders, the presence of uremic toxins, and oxidative stress, all of which can reduce cardiac function and lead to heart failure [13]. The present study revealed that eGFR levels were significantly lower in the heart failure group compared to the non-heart failure group, and renal insufficiency was an independent risk factor for in-hospital heart failure in STEMI patients. This is consistent with previous studies. Yandrapalli et al. [14] found that among 237,549 AMI survivors, 13.8% had concurrent AKI, 16.5% had concurrent CKD, and 3.4% had concurrent end-stage renal disease (ESRD). Moreover, in-hospital heart failure was more prevalent among AMI patients with renal insufficiency. In patients with renal insufficiency, elevated fibroblast growth factor levels are associated with an increased risk of left ventricular hypertrophy, which is related to diastolic dysfunction, HF, and death [15].
It is widely recognized that the admission heart rate is an important predictor of in-hospital mortality in patients with acute coronary syndrome (ACS). Jensen et al. [16] proposed that a heart rate
Our study has several limitations. We acknowledge that Killip class II–IV serves as a clinical severity indicator rather than a definitive HF diagnosis, which ideally requires comprehensive assessment incorporating biomarkers (BNP/NT-proBNP) and imaging studies. This may introduce diagnostic misclassification bias. As a single-center study with limited sample size, external validation through multicenter cohorts is needed. Unmeasured confounders (e.g., socioeconomic factors, medication adherence) were not systematically assessed. In future studies, we plan to implement this risk stratification tool in clinical practice to guide personalized treatment decisions and ultimately improve patient outcomes.
This study verifies that sST2 is an independent predictor for the development of in-hospital Killip class II-IV in STEMI patients. The combination of sST2, first-visit HR, LVEF, and eGFR can enhance the predictive value of Killip class II–IV development in STEMI patients, facilitating early risk stratification and has the potential to improve outcomes in these patients.
The datasets used and analyzed during the current study are available from the corresponding author on reasonable request.
YZ, GYD, YS and RJ designed the research study. YZ, FD and YFZ performed data collection. YZ, YQZ and MG analyzed the data. YZ, GYD and RJ drafted the manuscript. All authors contributed to critical revision of the manuscript for important intellectual content. All authors read and approved the final manuscript. All authors have participated sufficiently in the work and agreed to be accountable for all aspects of the work.
The study was carried out in accordance with the guidelines of the Declaration of Helsinki and approved by the ethics committee of the TEDA International Cardiovascular Hospital (ethical approval number: [2023]-0310-1). Due to the retrospective design of the study, the requirement for written informed consent from patients was waived.
American Journal Experts, part of Springer Nature, performed English polishing.
National Key Clinical Specialty Construction Project — “Breaking Barriers” Action Construction Project for the Improvement of Medical Quality in Tianjin; Construction Project of Key Medical Disciplines (Specialties) in Tianjin - Science (Cardiology) - TJYXZDXK - 020A; Demonstration Project for the Reform and High - quality Development of Public Hospitals in Tianjin Binhai New Area; Science and Technology Project of Tianjin Binhai New Area Health Commission (2022BWKQ006).
The authors declare no conflict of interest.
References
Publisher’s Note: IMR Press stays neutral with regard to jurisdictional claims in published maps and institutional affiliations.