


 , Ningjing Chen 2, Hanjing Jiang 1, Jian Li 1, Kailin Zheng 1, Jingting Chen 1, Yunsu Wang 1,*
 , Jun Chen 1,*
1 Department of Cardiology, Xiamen Hospital of Traditional Chinese Medicine, Fujian University of Traditional Chinese Medicine, 361015 Xiamen, Fujian, China
2 Department of Breast Surgery, Xiamen Hospital of Traditional Chinese Medicine, Fujian University of Traditional Chinese Medicine, 361015 Xiamen, Fujian, China
Abstract
The hemoglobin, albumin, lymphocyte, and platelet (HALP) score represents a meaningful predictor in many cardiovascular diseases. However, the predictive utility of this score for the outcome of patients admitted to the intensive care unit (ICU) due to acute myocardial infarction (AMI) has yet to be fully elucidated.
Information from the Medical Information Mart for Intensive Care (MIMIC)-IV v3.1 database was used to analyze the association between the HALP score and 90 days and 365 days all-cause mortality in critically ill patients with AMI. Patients were grouped according to the calculated HALP quartiles. Cox proportional hazards regression analysis and restricted cubic spline (RCS) analysis were performed to assess the association between the HALP score and mortality risk. A recursive algorithm identified the HALP inflection point, thus defining high and low HALP groups for the Kaplan–Meier survival analysis. Subgroup analyses analyzed the robustness across clinical strata. Furthermore, predictive models based on machine learning algorithms that included the HALP score were constructed to estimate 90 days mortality. The performance of the models was evaluated using the area under the receiver operating characteristic curve (AUC).
A total of 818 AMI patients were included. The analysis revealed mortality rates of 31% at 90 days and 40% at 365 days. Elevated HALP values were independently linked to a reduced risk of death. In fully adjusted models, patients in the top HALP quartile exhibited significantly lower all-cause mortality at 90 days (hazard ratio (HR) = 0.68; 95% confidence interval (CI): 0.47–0.99; p = 0.047) and 365 days (HR = 0.66; 95% CI: 0.47–0.90; p = 0.011). A nonlinear, inverse “L-shaped” association was observed, with an inflection point identified at a HALP value of 19.41. Below this value, each unit increase in the HALP score reduced mortality risk by 2.4%–2.7%. The Kaplan–Meier curves confirmed an improved survival above the threshold. Meanwhile, the subgroup analyses revealed a generally consistent association between the HALP score and mortality, except for age, where a significant interaction was observed (p = 0.003), indicating a stronger protective effect in older patients. Machine learning analyses supported the robustness and predictive value of the HALP score, with a maximum AUC of 0.7804.
The HALP score is significantly associated with all-cause mortality among critically ill individuals suffering from AMI.
Keywords
- HALP score
- acute myocardial infarction
- intensive care unit
- MIMIC-IV database
- machine learning
Over recent decades, cardiovascular diseases represent a primary cause of mortality worldwide. In the year 2021, these conditions were responsible for an estimated 20.5 million deaths worldwide. Of these, around 8.99 million were due to ischemic cardiovascular conditions such as acute myocardial infarction (AMI) [1, 2]. AMI is a particularly severe and frequent presentation of ischemic heart disease. The incidence of AMI increases markedly with age, affecting as many as 9.5% of individuals over the age of 60 years [3]. Critically ill patients in the intensive care unit (ICU) often exhibit a range of intricate health issues and coexisting risk factors. Studies indicate that approximately 4%–14% of ICU patients experience AMI during hospitalization [4]. Despite these observations, there is still only limited research on prognostic indicators and risk stratification in critically ill patients with AMI. It is therefore imperative to conduct additional studies allowing a deeper understanding of this high-risk cohort. Timely recognition and proper management of identified risk factors are essential for lowering the mortality rate in this patient population.
AMI involves complex immunological and inflammatory responses. Previous studies have suggested that combined biomarkers, including the Systemic Immune-Inflammation Index [5], Systemic Inflammatory Response Index [6], neutrophil-to-lymphocyte ratio (NLR) [7], Prognostic Nutritional Index [8], and Controlling Nutritional Status score [9], may have superior prognostic value for AMI compared with single inflammatory or nutritional markers alone [10].
The Hemoglobin, Albumin, Lymphocyte, and Platelet (HALP) score was first proposed as a prognostic tool for various types of cancers [11, 12, 13]. Recent studies have also demonstrated prognostic utility for HALP in various cardiovascular conditions, such as acute heart failure [14], coronary artery disease [15], patients undergoing percutaneous coronary intervention (PCI) [16], and individuals recovering from coronary artery bypass grafting (CABG) [17]. This evidence has increased the acceptance of HALP as a composite marker reflecting both systemic inflammation and nutritional state in the field of cardiovascular medicine. However, only limited research has been directed at specifically evaluating the prognostic relevance of the HALP score in individuals diagnosed with AMI. This gap is particularly pronounced for the high-risk subpopulation of critically ill patients with AMI, whose complex pathophysiology and management in ICU necessitates more precise risk stratification tools. Considering that AMI is accompanied by significant immune-inflammatory activation and nutritional disturbances [18, 19], we hypothesized that the HALP score may be a robust prognostic tool for predicting outcomes in this cohort. Consequently, the aim of our study was to evaluate the association between HALP score and all-cause mortality among critically ill patients with AMI.
All patient information for this analysis was obtained from the Medical Information Mart for Intensive Care (MIMIC)-IV version 3.1 database (http://physionet.org/content/mimiciv/3.1/). The database comprises a vast collection of de-identified electronic health records on critically ill patients admitted to the ICU at Beth Israel Deaconess Medical Center during 2008–2022. It includes a wide range of patient-specific information, including demographic details, diagnostic classifications, vital parameters, laboratory findings, medication usage, and discharge status [20]. Investigator ZC obtained access to the MIMIC-IV database (ID: 14336451) after fulfilling the training requirements of the Collaborative Institutional Training Initiative (CITI) program.
The study cohort comprised 9084 adults aged
 Fig. 1.
Patient screening flow from the Medical Information Mart for Intensive Care (MIMIC)-IV database. ICU, intensive care unit.
Using pgAdmin4 (version 8.12; pgAdmin Development Team, Chicago, IL, USA) and
SQL, 7 categories of data were extracted: demographics, vital signs, laboratory
indicators, underlying comorbidities, medication usage, clinical interventions,
and severity scores. A full summary of all included variables is available in
Supplementary Table 1. Only the initial lab values collected in the
first 24 h following ICU admission were included in the analysis. Variables in
which data was missing for
The main outcome assessed in this study was 90 days all-cause mortality. 365 days all-cause mortality was the secondary outcome.
The HALP score was calculated according to the following formula [21]:
hemoglobin (g/L)
Normality testing of all continuous variables indicated they did not follow a normal distribution. Therefore, they were presented as medians and interquartile ranges (IQRs), and the Kruskal–Wallis rank-sum test was used for comparisons between groups. Categorical data were summarized by frequencies (percentages), with group differences assessed via Pearson’s chi-square test.
All variables incorporated into the model were examined for potential
multicollinearity. To reduce multicollinearity, variables exhibiting a variance
inflation factor of
To explore potential nonlinear trends, restricted cubic spline (RCS) analysis was employed to examine the link between the HALP score and all-cause mortality. When a statistically significant nonlinear association was found, a recursive algorithm was used to determine the inflection point for the HALP score in relation to 90 days and 365 days mortality. For a deeper analysis of the link between the HALP score and mortality, segmented Cox regression models were fitted separately for the ranges below and above the identified turning point. Based on this inflection point, patients were then divided into low- and high-HALP groups. Kaplan–Meier (KM) survival analysis was conducted to compare the occurrence of outcomes between these groups.
In addition, subgroup evaluations were carried out among populations defined
according to age, gender, AF, hypertension, CHF, and diabetes. Interaction
effects between the HALP score and each stratification variable were evaluated
through likelihood ratio testing. All statistical computations were performed
using R software (version 4.4.3; R Foundation for Statistical Computing, Vienna,
Austria), with statistical significance set at a two-sided p-value of
The dataset was randomly partitioned into a training cohort (70% of data) and a
validation cohort (30% of data). In the training cohort, feature selection was
performed using LASSO regression, with five-fold cross-validation to determine
the optimal
To optimize the performance of each model, hyperparameters were systematically tuned using a grid search strategy combined with five-fold cross-validation. The basis for selecting the final hyperparameters was to maximize the mean area under the receiver operating characteristic curve (AUC) during the cross-validation process. The specific hyperparameter tuning ranges and the final selected values for each model are detailed in Supplementary Table 3. The developed models included support vector machine, elastic net (ENet), decision tree, Light Gradient Boosting Machine (LightGBM), ridge regression, multilayer perceptron (MLP), RF, k-nearest neighbors, extreme gradient boosting (XGBoost) algorithms, and Stacking ensemble algorithms. Discrimination was measured by calculating the AUC.
Furthermore, the clinical utility of various models was assessed using decision curve analysis (DCA). Calibration curves were also generated to evaluate the concordance between predicted probabilities and observed results. To enhance model interpretability and facilitate clinical translation, SHapley Additive exPlanations (SHAP) were utilized to interpret the predictions of the optimal model.
A final cohort of 818 patients with AMI met the criteria for inclusion in this
analysis. The median age of participants in the study cohort was 71 years (IQR:
62–80), with males accounting for 62% of the population. Participants were
allocated to one of four groups according to the quartile distribution of their
HALP scores upon ICU admission: Q1 (HALP
| Characteristic | Overall (n = 818) | Q1 (HALP |
Q2 (9.7 |
Q3 (19.71 |
Q4 (HALP |
p-value | |
| Age (years) | 71 (62, 80) | 71 (62, 80) | 72 (62, 81) | 70 (61, 80) | 70 (62, 78) | 0.449 | |
| Gender, n (%) | 0.212 | ||||||
| Female | 314 (38%) | 81 (40%) | 79 (39%) | 87 (43%) | 67 (33%) | ||
| Male | 504 (62%) | 124 (60%) | 125 (61%) | 117 (57%) | 138 (67%) | ||
| Race, n (%) | 0.486 | ||||||
| Black | 71 (8.7%) | 14 (6.8%) | 20 (9.8%) | 23 (11%) | 14 (6.8%) | ||
| White | 475 (58%) | 117 (57%) | 116 (57%) | 122 (60%) | 120 (59%) | ||
| Others | 272 (33%) | 74 (36%) | 68 (33%) | 59 (29%) | 71 (35%) | ||
| Heart rate (bpm) | 87 (75, 101) | 92 (78, 104) | 88 (78, 106) | 87 (75, 98) | 83 (73, 96) | 0.002 | |
| RR (bpm) | 20 (16, 25) | 21 (17, 26) | 20 (17, 25) | 20 (17, 25) | 20 (16, 23) | 0.008 | |
| SBP (mmHg) | 118 (104, 137) | 120 (104, 138) | 115 (103, 134) | 120 (104, 138) | 120 (105, 138) | 0.527 | |
| DBP (mmHg) | 69 (59, 81) | 68 (59, 81) | 68 (58, 82) | 70 (59, 79) | 70 (59, 82) | 0.912 | |
| SPO2 (%) | 97 (94, 100) | 97 (94, 100) | 97 (93, 99) | 97 (94, 99) | 98 (95, 100) | 0.090 | |
| Hemoglobin (g/dL) | 10.65 (8.80, 12.70) | 9.10 (7.80, 11.00) | 10.45 (9.00, 11.85) | 11.40 (9.70, 13.55) | 11.70 (9.50, 13.50) | ||
| Albumin (g/dL) | 3.20 (2.80, 3.60) | 2.90 (2.50, 3.30) | 3.10 (2.70, 3.50) | 3.40 (2.90, 3.70) | 3.50 (3.00, 3.80) | ||
| Lymph (109/L) | 1.07 (0.65, 1.70) | 0.44 (0.29, 0.74) | 0.87 (0.69, 1.20) | 1.30 (0.98, 1.71) | 1.92 (1.53, 2.71) | ||
| Platelet (109/L) | 198 (141, 255) | 226 (166, 317) | 208 (167, 263) | 197 (144, 243) | 155 (99, 214) | ||
| INR | 1.30 (1.10, 1.50) | 1.30 (1.20, 1.60) | 1.30 (1.20, 1.55) | 1.25 (1.10, 1.50) | 1.20 (1.10, 1.60) | 0.106 | |
| PH | 7.36 (7.29, 7.42) | 7.35 (7.28, 7.41) | 7.37 (7.29, 7.42) | 7.37 (7.28, 7.42) | 7.37 (7.32, 7.42) | 0.312 | |
| PTT (S) | 34 (28, 51) | 31 (27, 40) | 34 (28, 47) | 36 (28, 58) | 35 (29, 66) | ||
| WBC (109/L) | 13 (9, 17) | 12 (9, 17) | 13 (10, 17) | 13 (9, 17) | 12 (9, 18) | 0.161 | |
| PCO2 (mmHg) | 41 (35, 47) | 41 (35, 49) | 40 (35, 48) | 40 (35, 46) | 41 (36, 45) | 0.768 | |
| Cr (mg/dL) | 1.30 (0.90, 2.10) | 1.60 (1.00, 3.10) | 1.40 (0.90, 2.40) | 1.30 (0.90, 1.80) | 1.10 (0.80, 1.60) | ||
| Potassium (mmol/L) | 4.30 (3.90, 4.70) | 4.30 (3.90, 4.90) | 4.30 (3.90, 4.70) | 4.30 (3.90, 4.80) | 4.10 (3.80, 4.50) | 0.036 | |
| Sodium (mmol/L) | 138 (136, 141) | 138 (134, 141) | 138 (136, 141) | 139 (136, 141) | 139 (136, 141) | 0.017 | |
| BUN (mg/dL) | 26 (16, 46) | 36 (20, 59) | 29 (18, 46) | 24 (16, 42) | 20 (14, 36) | ||
| Lactate (mmol/L) | 1.90 (1.30, 3.00) | 1.90 (1.30, 2.90) | 1.80 (1.30, 3.10) | 1.95 (1.30, 3.00) | 1.90 (1.30, 3.20) | 0.712 | |
| GLU (mg/dL) | 147 (113, 207) | 154 (111, 209) | 142 (116, 204) | 151 (120, 206) | 140 (105, 196) | 0.449 | |
| PO2 (mmHg) | 66 (41, 122) | 55 (38, 93) | 66 (41, 115) | 64 (41, 120) | 86 (49, 234) | ||
| Anion gap (mmol/L) | 15 (13, 18) | 16 (13, 19) | 15 (13, 18) | 15 (13, 18) | 15 (12, 17) | 0.197 | |
| Neuts (109/L) | 10 (7, 15) | 10 (7, 15) | 11 (7, 15) | 10 (8, 15) | 10 (6, 14) | 0.295 | |
| AF, n (%) | 368 (45%) | 103 (50%) | 92 (45%) | 89 (44%) | 84 (41%) | 0.287 | |
| CA, n (%) | 167 (20%) | 44 (21%) | 45 (22%) | 37 (18%) | 41 (20%) | 0.765 | |
| CKD, n (%) | 320 (39%) | 95 (46%) | 93 (46%) | 68 (33%) | 64 (31%) | ||
| CHF, n (%) | 506 (62%) | 131 (64%) | 135 (66%) | 119 (58%) | 121 (59%) | 0.290 | |
| COPD, n (%) | 180 (22%) | 59 (29%) | 43 (21%) | 36 (18%) | 42 (20%) | 0.044 | |
| Diabetes, n (%) | 360 (44%) | 94 (46%) | 82 (40%) | 89 (44%) | 95 (46%) | 0.583 | |
| Hypertension, n (%) | 370 (45%) | 100 (49%) | 70 (34%) | 92 (45%) | 108 (53%) | 0.001 | |
| Sepsis, n (%) | 596 (73%) | 171 (83%) | 156 (76%) | 129 (63%) | 140 (68%) | ||
| Stroke, n (%) | 126 (15%) | 27 (13%) | 29 (14%) | 35 (17%) | 35 (17%) | 0.588 | |
| Aspirin, n (%) | 539 (66%) | 111 (54%) | 129 (63%) | 138 (68%) | 161 (79%) | ||
| Beta-blockers, n (%) | 481 (59%) | 122 (60%) | 104 (51%) | 123 (60%) | 132 (64%) | 0.046 | |
| Clopidogrel, n (%) | 156 (19%) | 37 (18%) | 50 (25%) | 37 (18%) | 32 (16%) | 0.124 | |
| Statin, n (%) | 540 (66%) | 111 (54%) | 132 (65%) | 143 (70%) | 154 (75%) | ||
| CRRT, n (%) | 78 (9.5%) | 24 (12%) | 23 (11%) | 14 (6.9%) | 17 (8.3%) | 0.273 | |
| Invasive MV, n (%) | 396 (48%) | 96 (47%) | 101 (50%) | 101 (50%) | 98 (48%) | 0.933 | |
| Noninvasive MV, n (%) | 21 (2.6%) | 5 (2.4%) | 10 (4.9%) | 4 (2.0%) | 2 (1.0%) | 0.077 | |
| APS-III | 48 (35, 65) | 55 (42, 69) | 50 (38, 61) | 43 (32, 58) | 43 (32, 63) | ||
| CCI | 6 (5, 9) | 7 (5, 9) | 7 (5, 9) | 6 (5, 8) | 6 (4, 8) | ||
| GCS | 15 (14, 15) | 15 (14, 15) | 15 (14, 15) | 15 (14, 15) | 15 (14, 15) | 0.253 | |
| SAPS-II | 41 (31, 52) | 44 (34, 54) | 42 (34, 50) | 39 (29, 50) | 40 (31, 52) | 0.004 | |
| SOFA | 6 (3, 10) | 7 (4, 10) | 6 (4, 9) | 5 (3, 10) | 7 (3, 10) | 0.229 | |
| 90 days mortality, n (%) | 250 (31%) | 75 (37%) | 70 (34%) | 53 (26%) | 52 (25%) | 0.024 | |
| 365 days mortality, n (%) | 330 (40%) | 99 (48%) | 87 (43%) | 75 (37%) | 69 (34%) | 0.013 | |
HALP, Hemoglobin, Albumin, Lymphocyte, and Platelet; RR, respiratory rate; SBP, systolic blood pressure; DBP, diastolic blood pressure; SPO2, peripheral capillary oxygen saturation; Hb, hemoglobin; INR, international normalized ratio; PH, potential of hydrogen; PTT, partial thromboplastin time; WBC, white blood cell count; PCO2, partial pressure of carbon dioxide; Cr, creatinine; BUN, blood urea nitrogen; GLU, glucose; PO2, partial pressure of oxygen; AF, atrial fibrillation; CA, cancer; CKD, chronic kidney disease; CHF, congestive heart failure; COPD, chronic obstructive pulmonary disease; CRRT, continuous renal replacement therapy; MV, mechanical ventilation; APS-III, acute physiology score III; CCI, Charlson comorbidity index; GCS, Glasgow coma scale; SAPS-II, simplified acute physiology score II; SOFA, sequential organ failure assessment.
Patients in the highest HALP quartile (Q4) were generally younger and included a greater proportion of males compared to the lowest quartile (Q1). The Q4 group also showed higher levels of albumin, hemoglobin, lymphocyte count, sodium, and PTT. In contrast, patients in Q4 had lower heart rate, RR, platelet count, international normalized ratio (INR), creatinine (Cr), blood urea nitrogen (BUN), potassium, GLU, anion gap, and Acute Physiology Score III (APS-III). Additionally, the prevalence of AF, CA, CHF, and sepsis was lower in Q4, along with less use of beta-blockers and clopidogrel.
In comparison with the other quartiles, the Q4 group had a lower mortality rate at all evaluated time points. The 90 days mortality rates were 37%, 34%, 26%, and 25% for Q1 to Q4, respectively (p = 0.024), while the mortality rates at 365 days were 48%, 43%, 37%, and 34%, respectively (p = 0.013).
The association between the HALP score and mortality risk was investigated using
Cox proportional hazards regression analysis, as shown in Table 2. In the
unadjusted analysis (Model 1), the highest HALP quartile (Q4) was associated with
a significantly reduced risk of 90 days mortality relative to the lowest quartile
(Q1), with a hazard ratio (HR) of 0.66 and 95% confidence interval (CI) of
0.46–0.94 (p = 0.020). The association with reduced risk persisted
following adjustment for age and gender in Model 2 (HR = 0.65, 95% CI:
0.46–0.92; p = 0.016). The reduced risk was still apparent following
complete adjustment for comorbidities, laboratory findings, and medication use in
Model 3 (HR = 0.68, 95% CI: 0.47–0.99; p = 0.047). A very similar
association was also evident for 365 days mortality (Table 2). The trend analysis
demonstrated a significant dose-response pattern, where higher HALP quartiles
were linked with a stepwise decrease in all-cause mortality risk (all p
for trend
| Variables | Model 1 | Model 2 | Model 3 | ||||
| HR (95% CI) | p-value | HR (95% CI) | p-value | HR (95% CI) | p-value | ||
| 90 days mortality | |||||||
| HALP quartile | |||||||
| Q1 | 1.00 (Reference) | 1.00 (Reference) | 1.00 (Reference) | ||||
| Q2 | 0.95 (0.68 |
0.737 | 0.91 (0.66 |
0.567 | 0.84 (0.60 |
0.298 | |
| Q3 | 0.69 (0.48 |
0.035 | 0.67 (0.49 |
0.040 | 0.66 (0.46 |
0.029 | |
| Q4 | 0.66 (0.46 |
0.020 | 0.65 (0.46 |
0.016 | 0.68 (0.47 |
0.047 | |
| p for trend | 0.005 | 0.006 | 0.022 | ||||
| 365 days mortality | |||||||
| HALP quartile | |||||||
| Q1 | 1.00 (Reference) | 1.00 (Reference) | 1.00 (Reference) | ||||
| Q2 | 0.87 (0.65 |
0.341 | 0.83 (0.63 |
0.218 | 0.80 (0.60 |
0.152 | |
| Q3 | 0.71 (0.52 |
0.023 | 0.70 (0.52 |
0.022 | 0.69 (0.50 |
0.020 | |
| Q4 | 0.63 (0.47 |
0.004 | 0.62 (0.46 |
0.003 | 0.66 (0.47 |
0.011 | |
| p for trend | 0.006 | ||||||
Model 1: Crude.
Model 2: Adjusted for Age and Gender.
Model 3: Adjusted for Age, Gender, Race, RR, SBP, DBP, SPO2, WBC, PCO2, Potassium, Sodium, GLU, Anion gap, lactate, PTT, AF, CA, CKD, CHF, COPD, Diabetes, Hypertension, Stroke, Clopidogrel, Beta-blockers, Statin, Invasive MV, and Noninvasive MV.
HR, Hazard Ratio; CI, Confidence Interval.
The RCS analysis suggested a possible nonlinear relationship linking the HALP
score to all-cause mortality at each time point (both p for nonlinear
 Fig. 2.
Restricted cubic spline (RCS) analysis of the association between Hemoglobin, Albumin, Lymphocyte, and Platelet (HALP) score and all-cause mortality at 90 days (A) and 365 days (B).
To further explore this nonlinear relationship, we applied both conventional and
two-piece Cox proportional hazards models, as shown in Table 3. Log-likelihood
ratio tests confirmed a superior statistical fit for the two-piece model
(p
| 90 days mortality | HR (95% CI), p-value | |
| Inflection point | 19.41 | |
| Fitting model by two-piecewise linear regression | ||
| HALP |
0.973 (0.952 | |
| HALP |
1.000 (1.000 | |
| p for Log-likelihood ratio | 0.013 | |
| 365 days mortality | HR (95% CI), p-value | |
| Inflection point | 19.41 | |
| Fitting model by two-piecewise linear regression | ||
| HALP |
0.976 (0.957 | |
| HALP |
1.000 (1.000 | |
| p for Log-likelihood ratio | 0.012 | |
HALP, Hemoglobin, Albumin, Lymphocyte, and Platelet; HR, Hazard Ratio; CI, Confidence Interval.
For the KM survival analysis, patients were stratified into high and low HALP groups using the inflection point of 19.41 as the threshold (Fig. 3). The low HALP score group had significantly worse 90 days survival relative to the high HALP group (p = 0.002). A comparable and statistically significant result was also observed for 365 days all-cause mortality.
 Fig. 3.
Kaplan–Meier survival curves for all-cause mortality at 90 days (A) and 365 days (B) of patients with high and low Hemoglobin, Albumin, Lymphocyte, and Platelet (HALP) score.
We next performed subgroup analyses to determine whether the link between the
HALP score and 90 days and 365 days all-cause mortality was consistent across
different clinical subgroups. These analyses stratified patients by age, gender,
hypertension, diabetes, AF, and CHF (Fig. 4). A significantly lower risk of
90 days mortality was associated with higher HALP scores in individuals aged
 Fig. 4.
Subgroup analysis for the association between 90 days (A) or 365 days (B) all-cause mortality and Hemoglobin, Albumin, Lymphocyte, and Platelet (HALP) score.
We carried out two additional analyses to determine if the prognostic value of HALP is disproportionately driven by any single component.
First, a dominance analysis was performed to evaluate the comparative importance
of each HALP component. As shown in Supplementary Table 5, albumin
accounted for 77.8% of the overall predictive contribution, followed by
hemoglobin (13.5%), platelets (7.9%), and lymphocytes (0.8%). This result
indicates that albumin is the primary contributor to the prognostic value of the
HALP score. Second, to test for potential synergistic or antagonistic effects,
interaction terms between HALP components were incorporated into a multivariable
Cox regression model. None of the interaction terms (e.g., albumin
As shown in Fig. 5, LASSO regression was applied to the training cohort to
identify the most relevant predictive features. During model construction,
five-fold cross-validation was utilized to determine the optimal penalty
parameter (
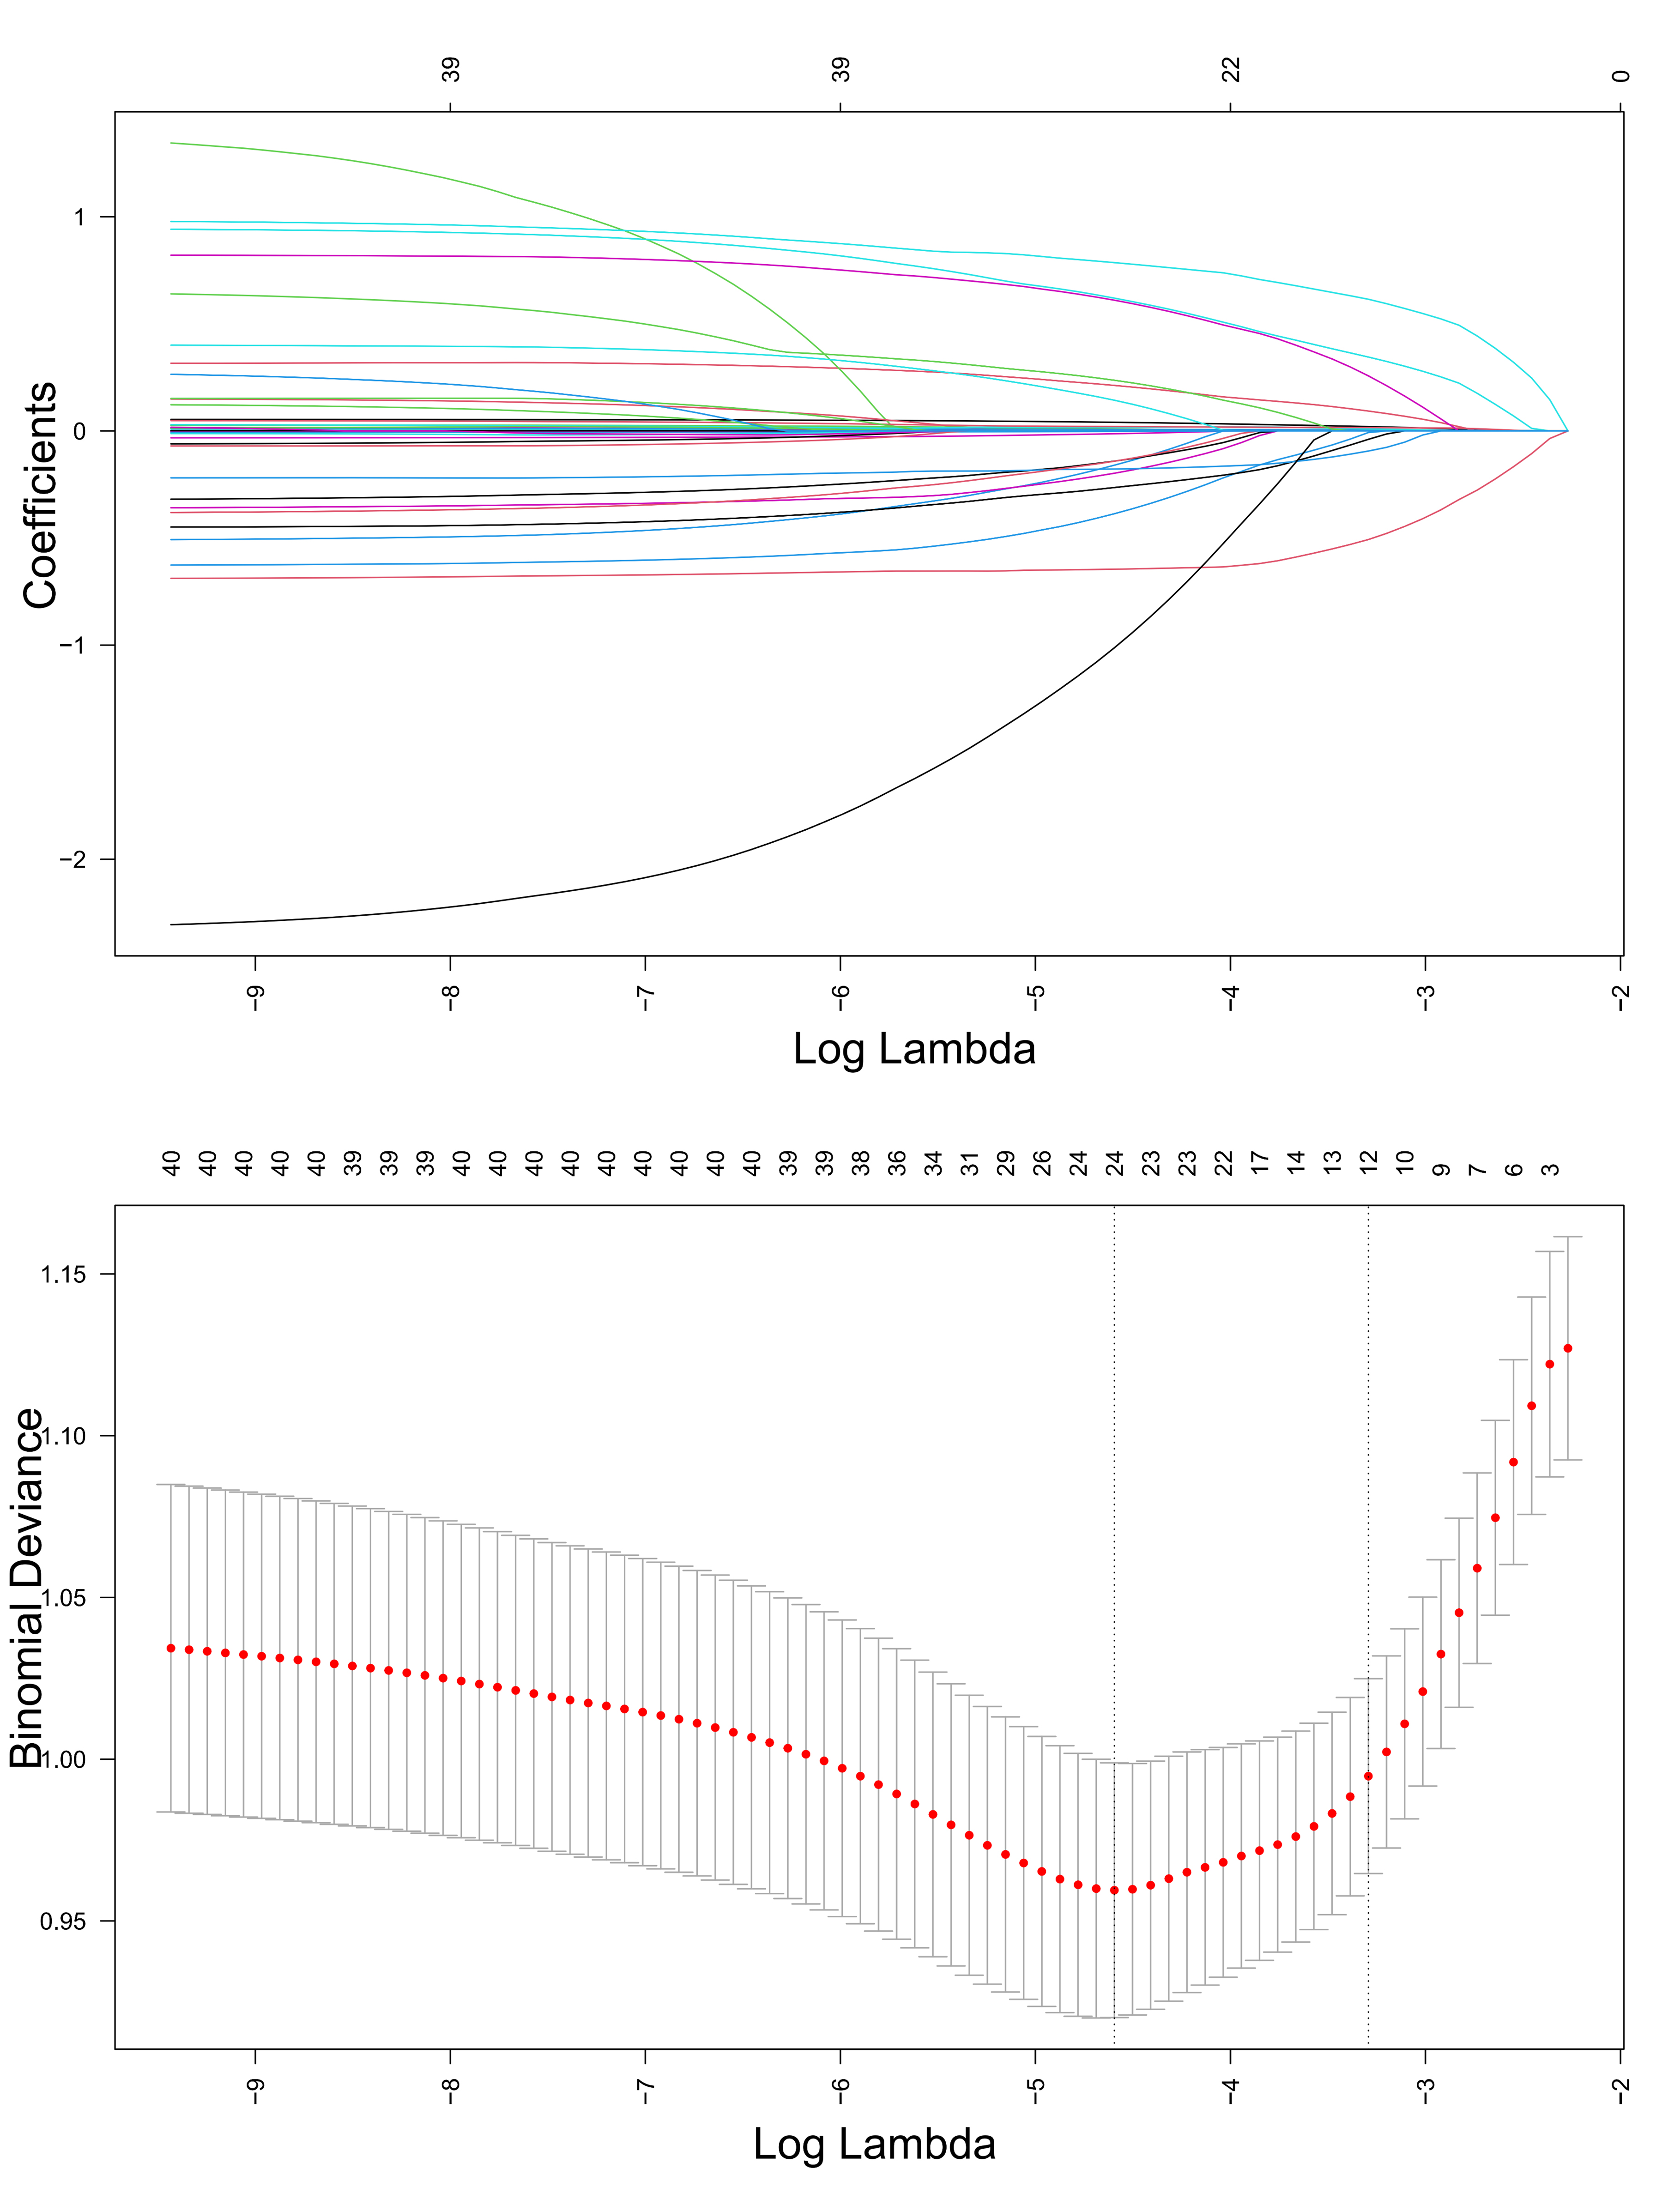 Fig. 5.
Least absolute shrinkage and selection operator (LASSO) regression-based screening of variables.
The receiver operating characteristi (ROC) curves for different machine learning algorithms evaluated on the test dataset are shown in Fig. 6A, with their predictive performance assessed by the AUC. Ranked from highest to lowest AUC, the models performed as follows: ENet = 0.7804, MLP = 0.7768, ridge regression = 0.7690, RF = 0.7676, and Stacking = 0.7627. These results indicate that ENet, MLP, and ridge regression showed relatively superior predictive performance. Fig. 6B presents the calibration curves for each model on the test set. Among them, RF and XGBoost demonstrated the closest alignment with the ideal reference line and achieved the lowest Brier scores (0.1767 and 0.1828, respectively), indicating better predictive consistency and calibration. Fig. 6C illustrates the results of DCA for all models. Across a range of threshold probabilities, each model provided a clear net clinical benefit over the “treat-all” and “treat-none” strategies, further supporting the potential clinical utility and value of these predictive models.
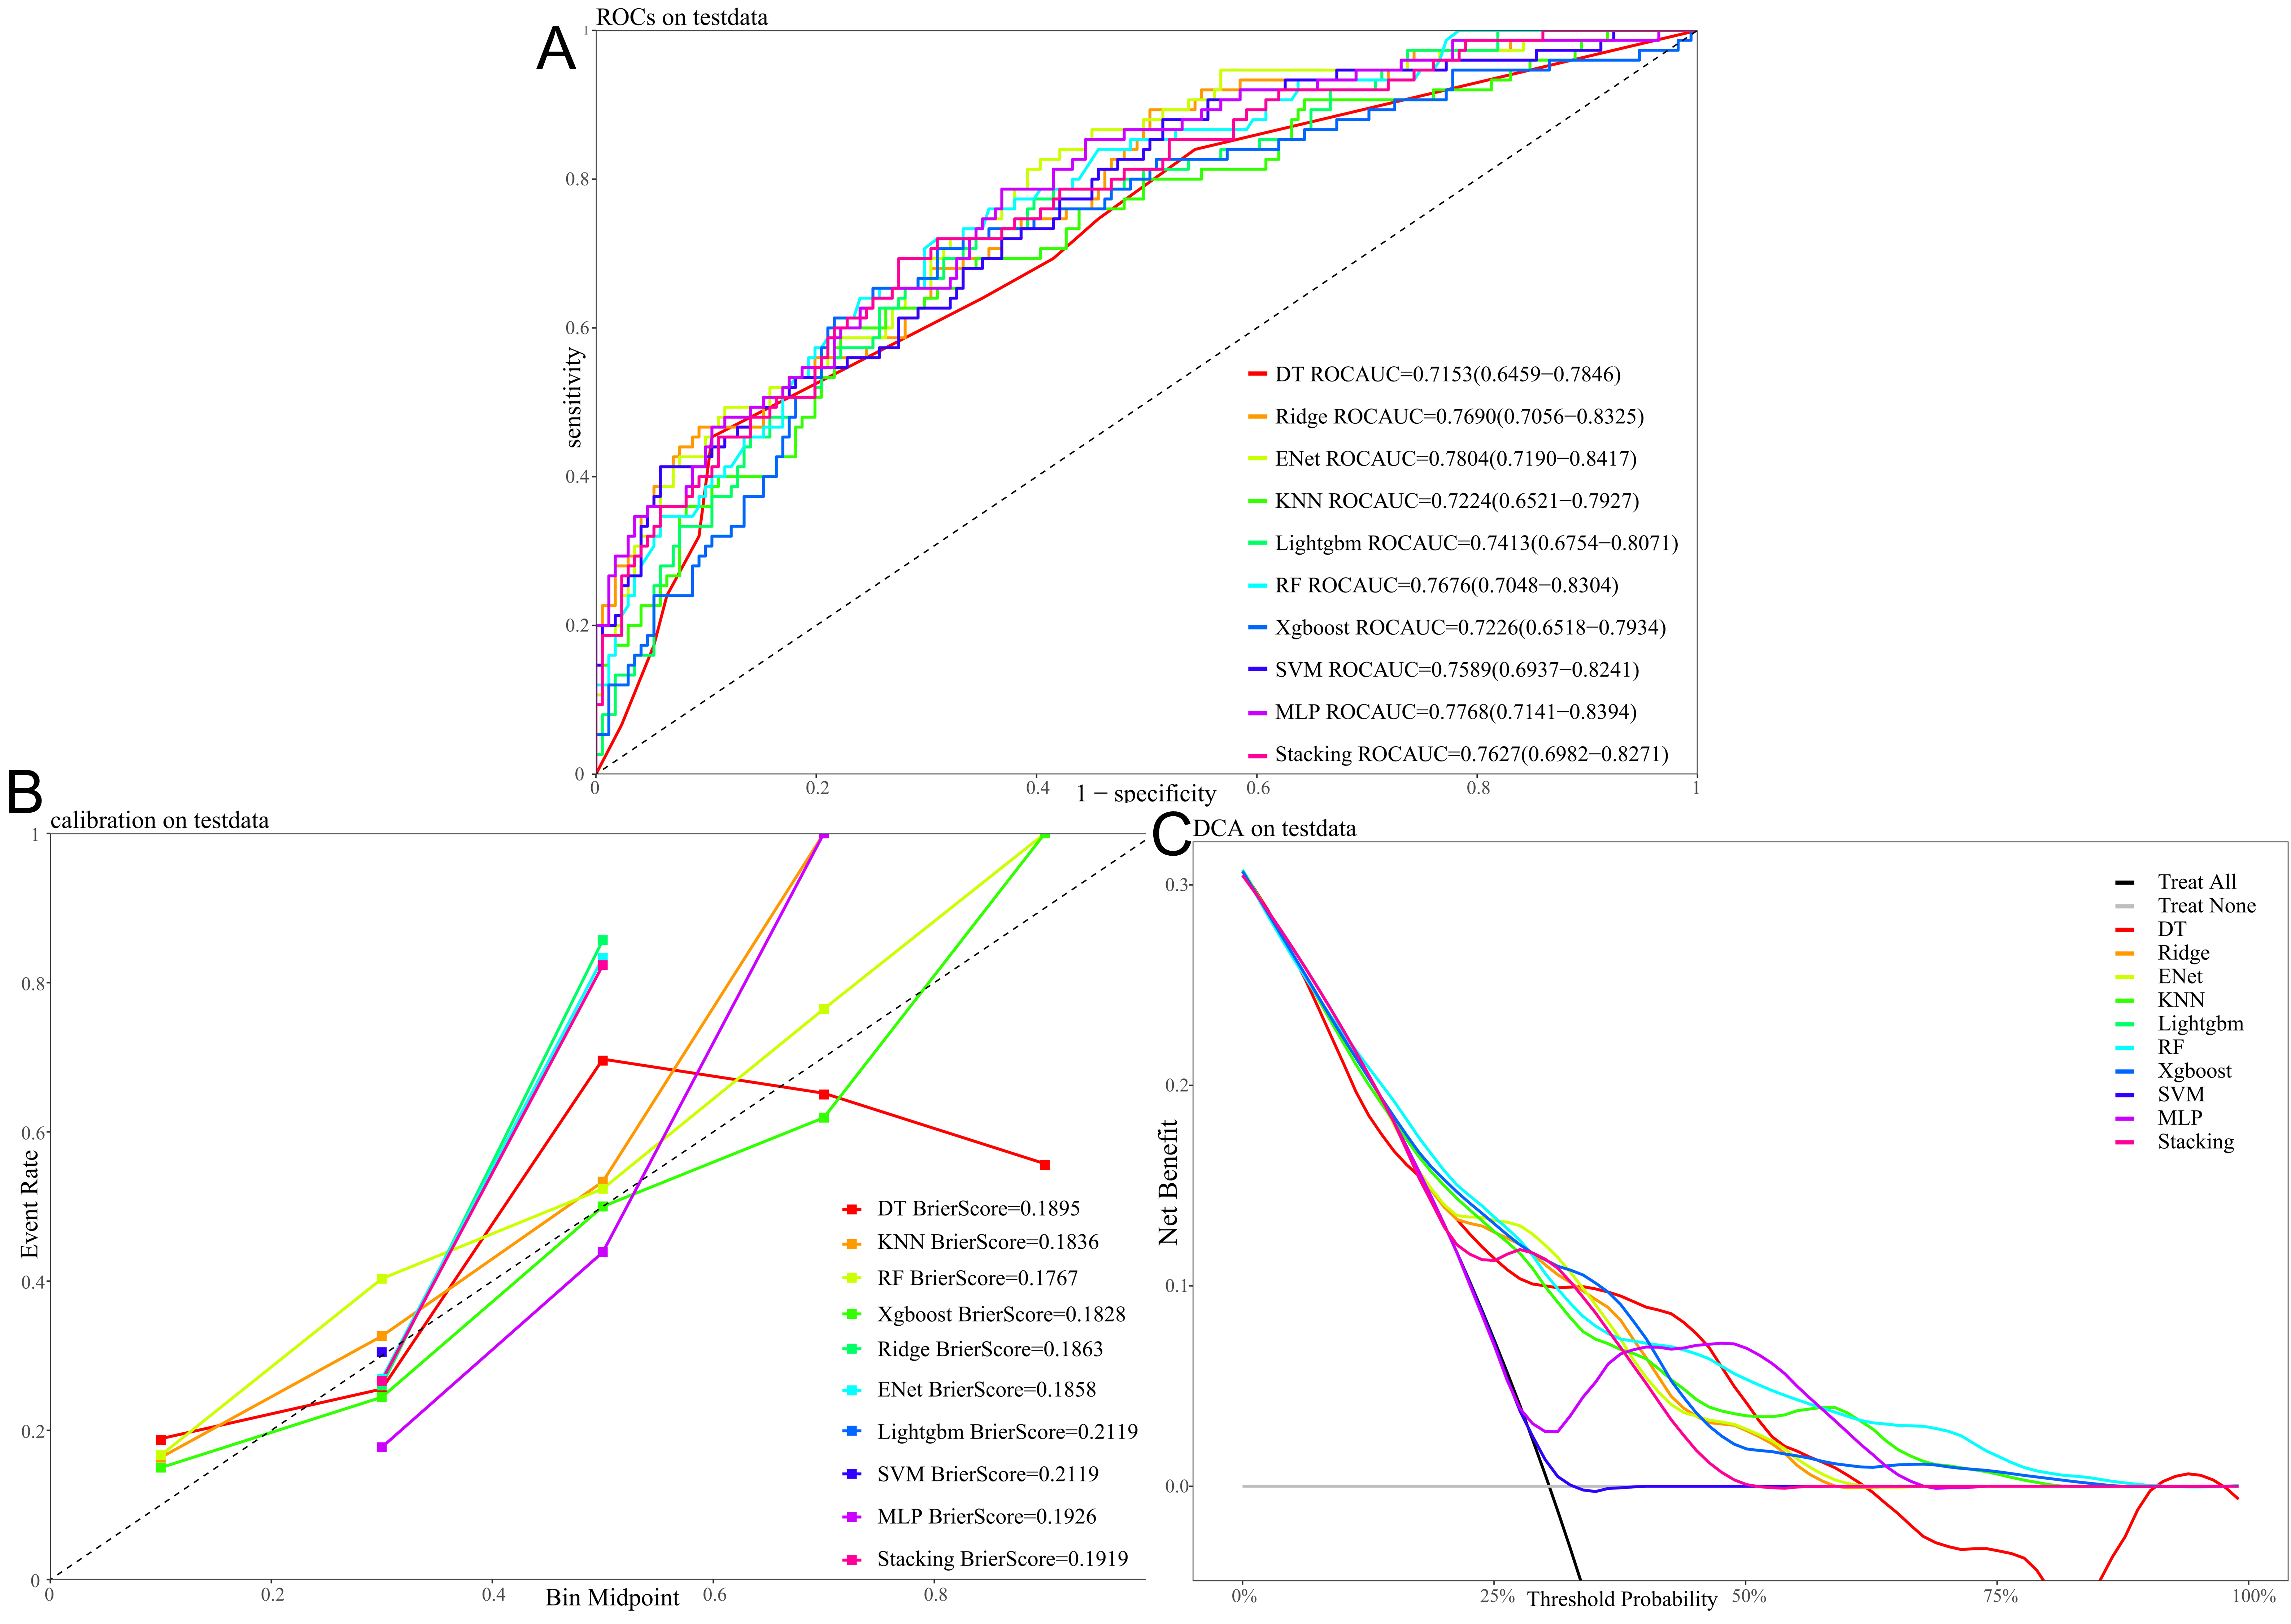 Fig. 6.
Performance and clinical utility of different machine learning models for predicting 90 days all-cause mortality with the test dataset. (A) Receiver operating characteristic (ROC) curves, with the area under the curve (AUC) value for each model. (B) Calibration curves, with the Brier score indicating the calibration performance for each model. (C) Decision curve analysis (DCA), showing the net benefit of using each model across a range of threshold probabilities.
To assess whether our ENet model offers an improvement over existing risk
stratification tools, we compared its performance against models based on the
Charlson Comorbidity Index (CCI) and Glasgow coma scale (GCS) alone. As shown in
Supplementary Table 7, the addition of HALP and other variables to our
ENet model led to significant improvements in both net reclassification and
discrimination in the validation set. A significant improvement was observed
compared to the CCI model (NRI = 0.445, p
To enhance the clinical applicability of our best-performing model (ENet), we utilized SHAP to interpret the model’s predictions at both the global and individual levels. The SHAP summary figure (Supplementary Fig. 2) depicts the relative impact of each variable on the prediction of mortality. Variables such as admission age, BUN, lactate, CRRT use, and HALP had the highest impact on the model output. Of note, elevated HALP scores demonstrated a consistent association with a lower predicted risk, further supporting its inverse relationship with mortality. This interpretation was based on the ENet model, which achieved the highest AUC among all the machine learning algorithms evaluated in this study. The global importance ranking based on mean absolute SHAP values is shown in Supplementary Fig. 3. HALP ranked among the top predictive features, thus confirming its clinical value beyond conventional predictors. Such explainability visualizations can assist clinicians in understanding the relative importance of different risk factors, as well as enhancing trust in machine learning-driven decision support tools. Ultimately, the integration of HALP into a transparent, interpretable model framework may facilitate risk stratification and individualized treatment planning in ICU patients with AMI.
In this study, we conducted a comprehensive examination of the link between HALP
score and all-cause mortality in critically ill AMI patients. We found a
significant association between higher HALP score and reduced risk of mortality
at both 90 days and 365 days follow-up periods. Multivariable Cox regression models
revealed that individuals with HALP scores in the upper quartile (Q4) had a
significantly lower risk of death compared to those in Q1, with an HR of 0.68 for
90 days mortality and 0.66 for 365 days mortality (both p
Immune-inflammatory mechanisms are pivotal in driving the progression of AMI and determining its prognosis. Following the onset of AMI, a robust immune-inflammatory response is triggered, resulting in substantial release of damage-associated molecular patterns. These facilitate the recruitment and infiltration of neutrophils, monocytes, and macrophages into the infarcted myocardium [22, 23]. During this phase, neutrophils exacerbate the local myocardial injury by releasing proteolytic enzymes and reactive oxygen species via degranulation, thereby expanding the infarct size and initiating maladaptive left ventricular remodeling [24]. Macrophages further amplify local inflammation, thereby exacerbating ventricular dilatation and dysfunction [25]. Concurrently, hospitalized AMI patients frequently exhibit nutritional deficits, such as hypoalbuminemia and anemia, which impair immune function, reduce resistance to inflammatory damage, and diminish the capacity for tissue regeneration [26]. Studies have demonstrated that malnutrition significantly increases mortality in AMI patients and is an independent predictor of poor outcomes [27]. Thus, the exaggerated immune-inflammatory response following AMI directly exacerbates myocardial injury and adverse remodeling, while concurrent nutritional deficiencies weaken the body’s immune defence and repair mechanisms. Together, these synergistic effects contribute substantially to poor patient outcomes.
The HALP score functions as a composite biomarker that simultaneously captures
both immune-inflammatory activity and nutritional condition. Our findings
demonstrate a nonlinear relationship of the HALP score with mortality in
critically ill AMI patients. This was identified as an inverse “L-shaped” curve
by RCS analysis. A significant inflection point was detected at a HALP score of
19.41, below which the risk of mortality declined sharply with each unit increase
in HALP. After this threshold, the risk of mortality stabilized. The threshold
effect provides a clinically actionable cutoff, allowing stratification of ICU
patients into low- and high-risk groups at the time of admission. Such early risk
stratification can facilitate timely nutritional support, anti-inflammatory
interventions, and intensive monitoring. The observed nonlinear relationship
underscores the combined impact of immune-inflammatory responses and nutritional
status on patient prognosis. Firstly, a lower HALP score suggests dual impairment
of immune function and nutritional status. Lymphopenia diminishes the body’s
capacity to effectively regulate and suppress inflammation. Previous studies have
indicated that AMI patients with lower lymphocyte counts and higher NLR have a
significantly increased risk of long-term mortality. Furthermore, impaired
peripheral T-lymphocyte function has been shown to exacerbate myocardial
ischemia-reperfusion injury [28, 29]. Concurrently, platelets not only contribute
to coronary artery and microvascular thrombosis during AMI, but also exacerbate
inflammation and reperfusion injury. This inflammatory-thrombotic interaction is
recognized as a critical contributor to adverse outcomes in AMI [30, 31].
Increased platelet levels typically indicate a cytokine-driven acute-phase
response that promotes inflammation, most notably interleukin-6, leading to a
hypercoagulable and pro-inflammatory state [32]. Compared to patients with
moderate platelet counts (250–349 K/µL), those with higher counts
(
Of note, our analysis of subgroups identified a significant interaction between
the HALP score and age in relation to 365 days mortality. The protective effect of
a high HALP score was markedly stronger in patients aged
In summary, a low HALP score reflects an impaired immune defense and poor
nutritional reserves, resulting in uncontrolled inflammatory responses and
oxidative stress. This weakened immune state further increases the patients’
susceptibility to complications such as infections, while hindering myocardial
repair, delaying functional recovery, and ultimately worsening patient prognosis.
Conversely, when the HALP score exceeds a certain threshold, it indicates a
relatively favorable immune and nutritional status. Beyond this point, further
increases in HALP score provide diminishing marginal benefit in terms of
prognosis, representing a plateau in its predictive utility. Moreover, recent
findings indicate that certain glucose-lowering drugs, such as GLP-1 receptor
agonists and SGLT2 inhibitors, may provide cardioprotective effects in AMI,
irrespective of their glycemic control function. These agents exhibit
anti-inflammatory and endothelial-stabilizing properties, which may interact with
nutritional and inflammatory pathways reflected in the HALP score [42]. Although
not addressed in the present study, this evolving therapeutic landscape warrants
further investigation. Compared to previous studies, our work offers several
novel insights. Pannu [43] emphasized the theoretical advantages of HALP and
CALLY as systemic indices to supplement traditional ACS risk models, but provided
no primary data from critically ill cohorts. Yılmaz et al. [44]
focused on elderly AMI patients (
Nonetheless, this study has several limitations that should be taken into consideration. First, a key limitation is the selection bias associated with the exclusion of 73.8% of patients who lacked HALP data. Because the patients included in the study cohort were more unwell and had higher mortality, our findings on the prognostic value of the HALP score apply mainly to this high-risk group and may not generalize to less severe AMI populations. Second, due to a substantial amount of missing data for inflammatory biomarkers and lipid profiles in the database, these variables could not be incorporated into our analysis. This absence may limit a more comprehensive understanding of the immune and metabolic pathways involved in AMI, potentially affecting the completeness of our predictive models. Third, the retrospective and single-center design of the study is a further limitation, with the findings being susceptible to selection bias and residual confounding, thus restricting our ability to establish causality. Fourth, this was a retrospective, single-center study based on a U.S. tertiary academic hospital cohort, with patients limited to those admitted to the ICU for AMI. Caution is warranted when extrapolating the findings to AMI populations outside the ICU, in resource-limited settings, or in different healthcare systems. Furthermore, the findings may not fully apply to patients with specific clinical subtypes, such as ST-elevation or non-ST-elevation MI. Lastly, the HALP score in this study was calculated from lab values obtained during the initial 24 h of the patient’s stay in ICU. This may reflect acute physiological stress rather than chronic nutritional or inflammatory status. Therefore, caution is warranted when interpreting HALP as a modifiable biomarker. To overcome these shortcomings, future investigations should focus on large-scale, prospective studies conducted at multiple centers. Such a design would be instrumental in validating our findings across more heterogeneous AMI populations, including non-ICU patients and those from different healthcare systems. This would enhance the generalizability of our findings and reduce selection bias. Furthermore, additional studies should aim for the systematic collection of serial HALP measurements alongside a comprehensive panel of inflammatory and metabolic biomarkers. Such an approach is crucial for mitigating confounding factors and better elucidating the temporal dynamics and causal role of the HALP score in AMI prognosis.
The present study validates the HALP score as an independent predictor of mortality for patients with AMI. Moreover, machine learning models incorporating the HALP score showed strong performance in predicting mortality risk, further highlighting its potential utility in clinical decision-making. These results support use of the HALP score as a practical, economical, and objective tool for early risk stratification and outcome prediction in critically ill patients with AMI.
HALP, hemoglobin, albumin, lymphocyte, and platelet; AMI, acute myocardial infarction; ICU, intensive care unit; MIMIC, Medical Information Mart for Intensive Care; AUC, area under the receiver operating characteristic curve; RCS, restricted cubic spline; HR, hazard ratio; CI, confidence interval; RR, respiratory rate; SBP, systolic blood pressure; DBP, diastolic blood pressure; SPO2, peripheral capillary oxygen saturation; Hb, hemoglobin; INR, international normalized ratio; PH, potential of hydrogen; PTT, partial thromboplastin time; WBC, white blood cell count; PCO2, partial pressure of carbon dioxide; Cr, creatinine; BUN, blood urea nitrogen; GLU, glucose; PO2, partial pressure of oxygen; AF, atrial fibrillation; CA, cancer; CKD, chronic kidney disease; CHF, congestive heart failure; COPD, chronic obstructive pulmonary disease; MV, mechanical ventilation; APS-III, Acute Physiology Score III; CCI, Charlson Comorbidity Index; GCS, Glasgow Coma Scale; SAPS-II, Simplified Acute Physiology Score II; SOFA, Sequential Organ Failure Assessment; SII, Systemic Immune-Inflammation Index; SIRI, Systemic Inflammatory Response Index; NLR, neutrophil-to-lymphocyte ratio; PNI, Prognostic Nutritional Index; CONUT, Controlling Nutritional Status; DAMPs, damage-associated molecular patterns; ROS, reactive oxygen species; IL-6, interleukin-6; LASSO, least absolute shrinkage and selection operator; ENet, elastic net; LightGBM, Light Gradient Boosting Machine; MLP, multilayer perceptron; RF, random forest; XGBoost, extreme gradient boosting; ROC, receiver operating characteristic; DCA, decision curve analysis; VIF, variance inflation factor.
This study analyzed publicly available datasets from the MIMIC-IV v3.1 database (http://physionet.org/content/mimiciv/3.1/).
Conceptualization: ZTC and YSW. Methodology: ZTC. Software: ZTC. Validation: HJJ, JL, and KLZ. Formal Analysis: ZTC and NJC. Data Curation: ZTC. Funding Acquisition: JC. Writing – Original Draft: ZTC and NJC. Writing – Review & Editing: HJJ, JL, KLZ, JTC, YSW, and JC. Visualization: JTC and JC. Supervision: YSW. All authors contributed to the conception and editorial changes in the manuscript. All authors have read and approved the final manuscript and agree to be accountable for all aspects of the work.
The study was carried out in accordance with the guidelines of the Declaration of Helsinki. The studies involving human participants were approved by the Institutional Review Boards (IRBs) of Beth Israel Deaconess Medical Center (Protocol No. 2001-P-001699/14) and the Massachusetts Institute of Technology (Protocol No. 0403000206). All studies were conducted in compliance with local laws and institutional guidelines. The ethics committee/IRB waived the requirement for written informed consent from participants or their legal guardians/next of kin, as the database used in this study anonymizes patient information, thus eliminating the need for informed consent.
We sincerely acknowledge the contributions of all members of the MIMIC-IV research team for their efforts in study design and data acquisition.
This research was funded by Xiamen Municipal Bureau of Science and Technology, Grant No. 3502Z20224ZD1172.
The authors declare no conflict of interest.
Supplementary material associated with this article can be found, in the online version, at https://doi.org/10.31083/RCM43942.
References
Publisher’s Note: IMR Press stays neutral with regard to jurisdictional claims in published maps and institutional affiliations.