


 , Andrada Larisa Roiban 3,4, Danusia Onișor 5,6, Nora Rat 7,8
1 Department M3/Internal Medicine I, George Emil Palade University of Medicine, Pharmacy, Science, and Technology of Târgu Mureş, 540142 Târgu Mureş, Romania
2 Diabetes, Nutrition and Metabolic Diseases Outpatient Unit, Emergency County Clinical Hospital, 540136 Târgu Mureş, Romania
3 Diabetes Compartment, Mediaș Municipal Hospital, 551030 Mediaș, Romania
4 Doctoral School of Medicine and Pharmacy, George Emil Palade University of Medicine, Pharmacy, Science, and Technology of Târgu Mureş, 540142 Târgu Mureş, Romania
5 Department ME2/Internal Medicine VII, George Emil Palade University of Medicine, Pharmacy, Science and Technology of Târgu Mureş, 540142 Târgu Mureş, Romania
6 Gastroenterology Clinic, Mureș County Clinical Hospital, 540072 Târgu Mureş, Romania
7 Department M3/Internal Medicine VI, George Emil Palade University of Medicine, Pharmacy, Science, and Technology of Târgu Mureş, 540142 Târgu Mureş, Romania
8 Department of Cardiology, Emergency County Clinical Hospital, 540136 Târgu Mureş, Romania
Abstract
Epicardial adipose tissue (EAT) is an indicator of high cardiovascular and metabolic risk. This study aimed to investigate the association between EAT thickness (EATT) and liver fibrosis and steatosis in patients with type 2 diabetes mellitus (T2DM) and metabolic dysfunction-associated steatotic liver disease (MASLD).
Patients with T2DM and MASLD underwent a complex evaluation, which included clinical, laboratory, and liver and transthoracic cardiac ultrasound assessments. The EATT was measured using the standard method. Liver fibrosis and steatosis were evaluated by several non-invasive indexes, through which patients with severe steatosis and advanced fibrosis were identified. Correlations between the EATT and markers of liver fibrosis and steatosis were evaluated by bivariate and multiple regression analyses.
In this study population of 267 T2DM patients with MASLD, the median EATT value was 7 mm. 43.8% of study patients had an EATT >7 mm. The EATT was higher in patients with advanced liver fibrosis (8.97 ± 2.88 mm vs. 7.09 ± 2.38 mm; p < 0.0001) and in those with more severe hepatic steatosis (7.69 ± 2.70 mm vs. 6.61 ± 1.88 mm; p = 0.0310). A higher percentage of patients with advanced liver fibrosis had an EATT of >7 mm (68.3% vs. 36.7%; odds ratio (OR) = 3.72 [95% confidence interval (CI): 2.02; 6.87]; p < 0.0001). In the bivariate analyses, the EATT significantly correlated with the markers of body adiposity, non-invasive indexes of liver steatosis and fibrosis, aspartate aminotransferase (ASAT), gamma glutamyl transpeptidase (GGT), diabetes duration, and pO2. The multiple regression analyses indicated that the EATT was independently associated with fibrosis-4 (FIB-4) score and body fat mass, and with serum ferritin (in fully adjusted models), while the correlation with the markers of hepatic steatosis became non-significant after adjustments for body adiposity.
T2DM patients with MASLD and markers of advanced liver fibrosis have higher EATT, which was independently associated with liver fibrosis.
Keywords
- epicardial adipose tissue
- T2DM
- MASLD
- liver fibrosis
Epicardial adipose tissue (EAT) is considered a unique visceral fat depot due to its unobstructed proximity to the myocardium and its specific transcriptome and secretome profile, which can become harmful and play a role in the pathogenesis of coronary heart disease (CHD), atrial fibrillation, or heart failure (HF) (mainly with preserved ejection fraction (EF)) [1]. The mechanisms by which EAT contributes to the pathogenesis of heart diseases are complex and include inflammation and increased secretion of pro-inflammatory adipokines, infiltration of free fatty acids and lipotoxicity, adipocyte stress, insulin resistance, release of profibrotic factors, etc., [1, 2]. In patients with diabetes mellitus (DM), hyperglycemia-associated upregulation of signaling through the binding of the advanced glycation end products to their receptors further contribute to these mechanisms by increasing oxidative stress and causing endothelial damage [1, 3].
The EAT volume and thickness were shown to be greater in subjects with CHD and in those with type 2 diabetes mellitus (T2DM) [4, 5, 6, 7]. In a single center study of 142 patients with T2DM, the ultrasound measured EAT thickness (EATT) predicted incident coronary artery disease better than other traditional risk factors [8]. Furthermore, the study by Opincariu D et al. [6] demonstrated that in patients with T2DM and acute myocardial infarction, the EATT was linked to significant ongoing inflammation and worse long-term outcomes, evidenced by lower EF, enlargement of the ventricular cavities, and development of ventricular remodeling.
In addition, enlarged EAT is also associated with the metabolic syndrome and with metabolic dysfunction-associated steatotic liver disease (MASLD) [9, 10]. MASLD is a chronic liver disease characterized by the association of hepatic steatosis with at least one cardiometabolic risk factor [11]. It includes simple liver steatosis, steatohepatitis (with various degrees of fibrosis), and hepatocellular carcinoma [11, 12]. In fact, MASLD is part of a multisystem disease and increases the long-term risk of fatal or non-fatal cardiovascular disease (CVD), independent of other risk factors [13, 14, 15]. The meta-analysis by Mantovani A et al. [15] showed that the cardiovascular risk increases significantly with more severe liver fibrosis (hazard ratio (HR): 2.50 [95% confidence interval (CI): 1.68–3.72]). Similar results were published previously by Targher G and colleagues, demonstrating that “more severe” MASLD (i.e., steatohepatitis with various amounts of fibrosis) was associated with an increased risk of fatal and non-fatal CVD events (random effect odds ratio (OR): 1.94 [95% CI: 1.17; 3.21]) [16].
We have recently reported that T2DM patients with MASLD and advanced liver fibrosis presented lower EF, cardiac hypertrophy and markers of diastolic dysfunction [17]. The study also demonstrated that more severe hepatic fibrosis was associated with progressively higher EATT. In fact, the work by Petta et al. [18] had also showed that EATT was associated with the severity of liver fibrosis in MASLD patients. However, there is scarce data regarding these correlations in patients with T2DM and MASLD. Furthermore, there are many unresolved questions regarding the complex interplay between MASLD and EAT, including the mechanisms underlying these associations or the value of EATT as a predictor of advanced liver disease. This work aimed at evaluating the association between EATT and liver fibrosis and steatosis in T2DM patients with MASLD.
T2DM patients with MASLD were enrolled from July 2022 until July 2023 in the Outpatient Unit of the Emergency County Clinical Hospital of Târgu Mureș, Romania. The details regarding the materials and methods used, including study population, clinical, laboratory and echocardiographic evaluation, were published elsewhere [17, 19]. Briefly, subjects with T2DM were included if they were 30 years of age or older and had non-alcoholic fatty liver disease (NAFLD). NAFLD definition (liver steatosis/steatohepatitis in the absence of secondary causes of hepatic disease) was used at study entry as an inclusion criterion, but in June 2023 there was a change in definition and terminology (to MASLD), which was largely used thereafter [11]. All study patients fulfilled the proposed definition of MASLD, and we therefore have adopted the new terminology to characterize this study population. The study was approved by the Ethics Committees of the Emergency County Clinical Hospital of Târgu Mureș (nr. 8120/05.04.2022), County Clinical Hospital of Târgu Mureș (nr. 4873/24.05.2022), and George Emil Palade University of Medicine, Pharmacy, Science and Technology of Târgu Mureș (nr. 1806/22.06.2022). The informed consent was signed by all patients enrolled in the study.
Information regarding demographic and medical data (including personal history, current therapy, and lifestyle) was obtained through several questionnaires. Heart rate, blood pressure, pO2, as well as several anthropometric parameters (weight, height, waist and hip circumferences) were measured by standard methods. Additional anthropometric data was obtained by using an InnerScan BC-545N segmental body composition monitor (lot nr. 5210112, Tanita; Tokyo, Japan). The assessment of hepatic steatosis was performed by ultrasonographic (US) B-mode imaging using a Hitachi Arietta v70 system (Model P95DE, Mitsubishi Electric Corporation; Kyoto, Japan) [20].
Blood was drawn in fasting conditions on the same day. The complete blood count (CBC) was analyzed immediately afterwards on a 5-part differential automated hematology equipment (Mindray BC6200, India). Serum aliquots were stored at –80 °C for subsequent analyses of multiple parameters: metabolic panel (glycated hemoglobin (HbA1c), glucose, C-peptide, uric acid, total cholesterol, low-density lipoprotein (LDL) cholesterol, high-density lipoprotein (HDL) cholesterol, triglycerides), liver panel (albumin, aspartate aminotransferase (ASAT), alanine aminotransferase (ALAT), gamma glutamyl transpeptidase (GGT), direct bilirubin), creatinine, sex hormone-binding globulin (SHBG), ferritin, haptoglobin. The analysis of the biochemical parameters was performed on a Cobas Integra 400plus equipment (Roche Diagnostics; Mannheim, Germany), by using an immunoturbidimetric method (for HbA1c, albumin and haptoglobin), and a spectrophotometric method (for glucose, uric acid, lipid panel, creatinine, and liver panel). Reagents were obtained from Roche Diagnostics (Mannheim, Germany). The C-peptide, ferritin and SHBG were measured by a solid phase, two-site chemiluminescent immunometric assay on an Immulite 2000 XPI system (Siemens Healthcare Diagnostics; Erlangen, Germany). Reagents were obtained from Siemens Healthcare Diagnostics Products Ltd. (Llanberis, UK).
The transthoracic two-dimensional echocardiographic assessment was performed within 2–3 weeks from the initial visit by an experienced cardiologist, blinded to the other aspects of the study, by using a VIVID9 XDClear equipment (GE HealthCare; GE Vingmed Ultrasound AS, Horten, Norway). The details regarding the cardiac US evaluation (performed by standard techniques in accordance with the recommendations of the ASE/EAC Guidelines) were published before [17, 21]. Here we report data related to the EATT, which was measured with the patient positioned in the left lateral decubitus. Measurements were taken perpendicularly on the free wall of the right ventricle from a parasternal long-axis view. EAT appeared as an echo-lucent space between the outer myocardial surface and the visceral layer of the pericardium. The measurement was performed at end-diastole, across three consecutive cardiac cycles, and the mean value was recorded in millimeters. EATT measurements were performed by a single experienced cardiologist, ensuring internal consistency.
The body mass index (BMI) was calculated with the formula: weight/height2 (kg/m2), and body fat mass (BFM) (kg) was computed from weight and % body fat. For the estimated glomerular filtration rate (eGFR) the CKD-EPI 2021 formula was used [22]. The Homeostatic Model Assessment (HOMA) for Insulin Resistance (HOMA-IR) was calculated with the HOMA calculator version 2.2.3 [23].
Three inflammatory indexes were calculated from the CBC data:
Neutrophil-to-Lymphocyte Ratio (NLR), Systemic Immune-Inflammation Index (SIII)
(platelet count
Liver steatosis was confirmed by US in all subjects (as was a mandatory
inclusion criterion, per NAFLD/MASLD definition). In addition, we have used
several non-invasive indexes for liver steatosis evaluation/grading: Fatty liver
index (FLI), Hepatic Steatosis Index (HSI) and Index of NASH (Non-alcoholic
steatohepatitis) (ION), using following formulas: FLI = (e0.953×loge
(TG) + 0.139×BMI + 0.718×loge (GGT) + 0.053×waist –
15.745)/(1 + e0.953×loge (TG) + 0.139×BMI +
0.718×loge (GGT) + 0.053×waist –15.745)
Liver fibrosis was estimated by several validated non-invasive indexes:
Fibrosis-4 (FIB-4) score, NAFLD-Fibrosis Score (NFS), and GGT to platelet ratio
(GPR), by using following formulas: FIB-4 = age (years)
The left ventricular (LV) mass (LVM) was calculated with the formula: LVM (g) =
0.80
Data were analyzed using descriptive statistics and the normality of
data was checked by using the Kolmogorov-Smirnov test. Results are presented as
mean
Data from 267 T2DM patients with MASLD who had a complete medical evaluation
(including echocardiography) were analyzed. The characteristics of the overall
study population were presented elsewhere [17]. The median EATT value in this
study population was 7 mm, and therefore patients were divided into two groups
(median-split): with EATT
| EATT |
EATT |
p value | ||
| (n = 117) | (n = 150) | |||
| Clinical data | ||||
| Sex (female/male) (no) | 68/49 | 78/72 | 0.3251 | |
| BMI (kg/m2) | 35.35 |
32.46 (6.02) | 0.0008 | |
| Waist circumference (cm) | 114.58 |
109.59 |
0.0005 | |
| Hip circumference (cm) | 111.45 |
105.95 (12.83) | 0.0058 | |
| % body fat | 38.07 |
35.75 (11.22) | 0.0075 | |
| Body fat mass (kg) | 36.17 |
30.30 (12.05) | 0.0004 | |
| Alcohol intake (g/day) | 0.40 (1.72) | 0.52 (3.76) | 0.1500 | |
| Smoking (yes/no) (no) | 16/101 | 12/138 | 0.1600 | |
| Systolic BP (mmHg) | 134.86 |
135.0 (20.0) | 0.9262 | |
| Diastolic BP (mmHg) | 81.0 (12.5) | 80.0 (12.5) | 0.6102 | |
| Heart rate (beats/min) | 73.0 (14.0) | 74.0 (12.25) | 0.7823 | |
| pO2 (%) | 97.0 (2.0) | 98.0 (1.0) | 0.0032 | |
| Laboratory data | ||||
| Fasting blood glucose (mg/dL) | 142.28 |
136.93 (30.52) | 0.8756 | |
| HbA1c (%) | 6.80 (1.0) | 6.90 (0.82) | 0.9987 | |
| Total cholesterol (mg/dL) | 153.20 (48.78) | 155.16 (44.64) | 0.6290 | |
| HDL cholesterol (mg/dL) | 43.51 (11.88) | 44.11 (12.25) | 0.7658 | |
| LDL cholesterol (mg/dL) | 80.85 (43.08) | 83.31 (39.29) | 0.6160 | |
| Triglycerides (mg/dL) | 154.63 (90.97) | 150.94 (84.66) | 0.7033 | |
| C-peptide (ng/mL) | 3.33 (2.18) | 3.01 (1.82) | 0.0262 | |
| HOMA-IR | 2.89 (1.78) | 2.61 (1.67) | 0.0335 | |
| Uric acid (mg/dL) | 5.87 (2.01) | 5.75 |
0.0893 | |
| Albumin (g/dL) | 4.62 (0.25) | 4.66 |
0.2846 | |
| ASAT (U/L) | 22.00 (13.15) | 19.83 (9.11) | 0.0766 | |
| ALAT (U/L) | 19.26 (18.35) | 17.73 (12.91) | 0.4743 | |
| GGT (U/L) | 31.19 (33.57) | 27.03 (21.87) | 0.0164 | |
| Direct bilirubin (mg/dL) | 0.20 (0.10) | 0.20 (0.10) | 0.6686 | |
| Ferritin (ng/mL) | 113.00 (134.05) | 79.55 (118.85) | 0.0472 | |
| Haptoglobin (g/L) | 1.69 |
1.68 |
0.8938 | |
| eGFR (mL/min/1.73 m2) | 88.30 (23.77) | 91.68 (21.91) | 0.1130 | |
| SHBG (nmol/L) | 31.80 (18.50) | 35.65 (19.8) | 0.0343 | |
| NLR | 2.027 (1.14) | 1.846 (0.97) | 0.2929 | |
| SIII | 459.29 (315.29) | 442.04 (285.32) | 0.5734 | |
| SIRI | 0.938 (0.62) | 0.867 (0.67) | 0.3647 | |
EATT, epicardial adipose tissue thickness; no, number; BMI, body mass index;
BP, blood pressure; HbA1c, glycated hemoglobin; HDL, high-density
lipoprotein; LDL, low-density lipoprotein; HOMA-IR, Homeostatic Model Assessment
for Insulin Resistance; ASAT, aspartate aminotransferase; ALAT, alanine
aminotransferase; GGT, gamma glutamyl transpeptidase; eGFR, estimated glomerular
filtration rate; SHBG, sex hormone-binding globulin; NLR,
Neutrophil-to-Lymphocyte Ratio; SIII, Systemic Immune-Inflammation Index; SIRI,
Systemic Inflammatory Response Index; data is presented as mean
Patients in the higher EATT category had a slightly lower EF (48.89
Patients with an EATT higher than 7 mm presented higher values of hepatic
steatosis indexes (FLI: 86.29
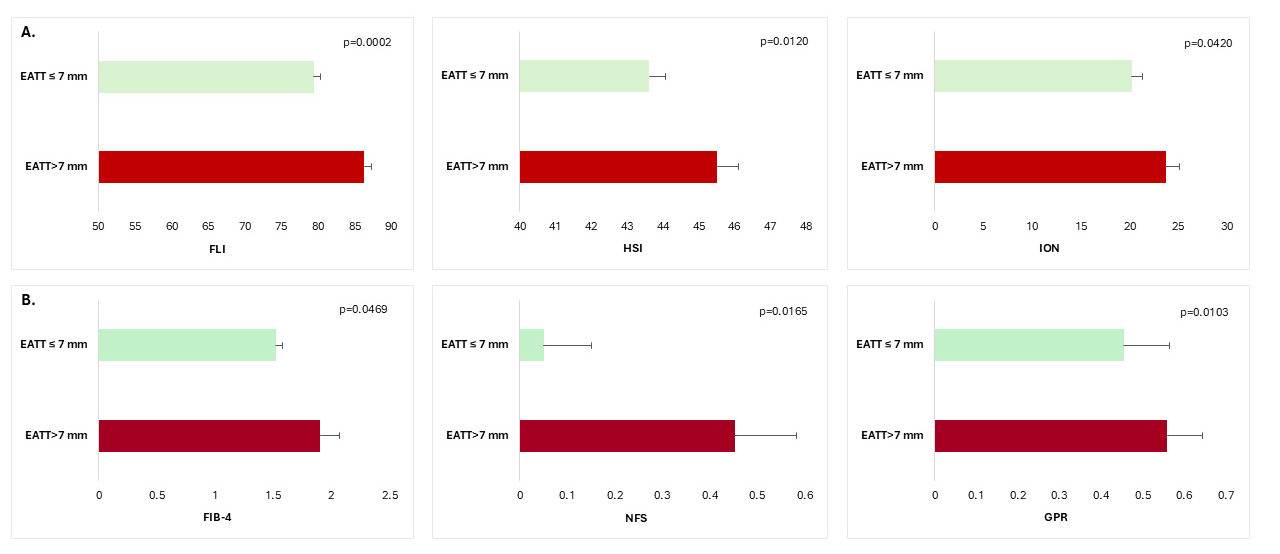 Fig. 1.
Non-invasive biomarkers of hepatic steatosis (A) and hepatic
fibrosis (B) according to EAT thickness in patients with T2DM and MASLD. FLI,
fatty liver index; HSI, hepatic steatosis index; ION, index of NASH
(Non-alcoholic steatohepatitis); FIB-4, Fibrosis-4 score; NFS, NAFLD-Fibrosis
score; GPR, gamma glutamyl transpeptidase to platelet ratio; T2DM, type 2
diabetes mellitus; MASLD, metabolic dysfunction-associated steatotic liver
disease; EAT, epicardial adipose tissue; data are means
The EATT was significantly higher in the advanced liver fibrosis group (defined
by the combination of the three fibrosis indexes) (n = 60) (8.97
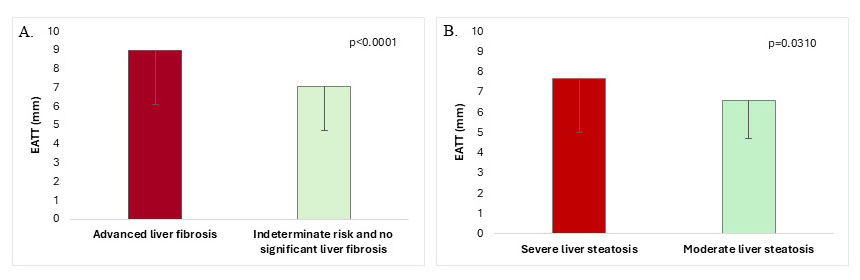 Fig. 2.
EATT in T2DM-MASLD patients with and without advanced
liver fibrosis (A) and EATT in T2DM-MASLD patients with severe vs moderate liver
steatosis (B) (data is means
To verify the approach and results, further ROC analyses were performed. For the
FIB-4, the AUROC was 0.598 ([95% CI: 0.489; 0.707], p = 0.079), for NFS
the AUROC was 0.627 ([95% CI: 0.553; 0.700], p = 0.001), for GPR was
0.619 ([95% CI: 0.551; 0.686], p = 0.001), while for the three fibrosis
indexes combined the AUROC was 0.696 ([95% CI: 0.623; 0.769], p =
0.000). The EATT value of 7.2 mm had a sensitivity of 0.683 and 1-specificity of
0.367 (Youden’s index = 0.316), while the EATT value of 7.7 mm had the same
sensitivity and the 1-specificity of 0.362 (Youden’s index = 0.321) (for all the
other calculated cut-offs, the Youden’s index was lower). Of note, in our
database only one subject had an EATT value of 7.4 mm, the rest had either
Patients with more severe hepatic steatosis had higher EATT (7.69
In the bivariate analyses EATT significantly correlated with markers of body adiposity (waist, hip circumference, BMI, % body fat), non-invasive indexes of liver steatosis (FLI, HSI) and fibrosis (NFS, GPR), ASAT, GGT, diabetes duration, and pO2 (Table 2). For FIB-4, a weak positive correlation was noted, although statistical significance was not quite reached (r = 0.12 [95% CI: –0.004; 0.24], p = 0.0504). For the rest of the variables no significant associations were observed (including ION (r = 0.12 [95% CI: –0.01; 0.24], p = 0.0598) and C-peptide (r = 0.12 [95% CI: –0.004; 0.24], p = 0.0513), for which the non-significance was borderline though).
| Correlation coefficient r [95% CI] | p value | |
| Waist circumference | 0.23 [0.11; 0.34] | 0.0002 |
| Hip circumference | 0.18 [0.06; 0.29] | 0.0036 |
| BMI | 0.20 [0.08; 0.32] | 0.0009 |
| % body fat | 0.13 [0.01; 0.25] | 0.0358 |
| Body fat mass (kg) | 0.21 [0.09; 0.32] | 0.0006 |
| NFS | 0.13 [0.01; 0.25] | 0.0312 |
| GPR | 0.18 [0.06; 0.30] | 0.0024 |
| FLI | 0.24 [0.12; 0.35] | |
| HSI | 0.16 [0.04; 0.28] | 0.0086 |
| ASAT | 0.13 [0.01; 0.25] | 0.0326 |
| GGT | 0.20 [0.08; 0.31] | 0.0012 |
| Ferritin | 0.19 [0.07; 0.31] | 0.0019 |
| Diabetes duration | –0.12 [–0.24; 0.001] | 0.0443 |
| pO2 | –0.19 [–0.30; –0.07] | 0.0020 |
BMI, body mass index; NFS, NAFLD-Fibrosis Score; GPR, GGT to platelet ratio; FLI, Fatty liver index; HSI, Hepatic Steatosis Index; ASAT, aspartate aminotransferase; GGT, gamma glutamyl transpeptidase; data are coefficient of correlation r [95% confidence interval].
Three sets of multiple regression analyses were performed to identify the parameters independently correlated with EATT. In model 1, markers of liver fibrosis (FIB-4 and NFS respectively), diabetes duration, sex, pO2, GGT, ferritin, C-peptide and SHBG were used as independent variables, in model 2 BFM was added (as these parameters were identified as significantly correlated with EATT in the bivariate analyses), while in model 3 a full adjustment was done with waist, HbA1c and HOMA-IR (instead of C-peptide) added as independent variables. The same was done for the markers of liver steatosis (FLI and HSI, respectively), except that ASAT was used instead of GGT. EATT correlated significantly with FIB-4 in all models, while NFS was independently correlated only in model 1, but after adjustment for body adiposity the correlation became non-significant. In contrast, in both fully adjusted models, serum ferritin was significantly correlated with EATT (Table 3). EATT was positively correlated with both liver steatosis indexes, but after adjustments for body adiposity the correlations became non-significant (Table 3). Instead, serum ferritin was positively correlated with EATT in the fully adjusted models.
| Independent variable | Standardized coefficient |
95% CI | t ratio | |||
| a. Hepatic fibrosis | ||||||
| Assessed by FIB-4 | ||||||
| Model 1 | FIB-4 | 0.165 [0.123]* | 0.077; 0.562 | 2.598 | ||
| R2 = 0.082; p = 0.005 | ||||||
| Model 2 | FIB-4 | 0.165 [0.122]** | 0.079; 0.561 | 2.615 | ||
| R2 = 0.096; p = 0.002 | BFM | 0.141 [0.018]* | 0.001; 0.073 | 2.014 | ||
| Model 3 | FIB-4 | 0.169 [0.122]** | 0.087; 0.566 | 2.687 | ||
| R2 = 0.122; p |
Ferritin | 0.164 [0.001]* | 0.001; 0.006 | 2.353 | ||
| Assessed by NFS | ||||||
| Model 1 | NFS | 0.131 [0.127]* | 0.012; 0.511 | 2.067 | ||
| R2 = 0.075; p = 0.009 | ||||||
| Model 2 | NFS | 0.101 [0.132] | –0.057; 0.462 | 1.536 | ||
| R2 = 0.083; p = 0.007 | ||||||
| Model 3 | NFS | 0.093 [0.132] | –0.074; 0.447 | 1.407 | ||
| R2 = 0.108; p = 0.003 | Ferritin | 0.166 [0.001]* | 0.001; 0.006 | 2.365 | ||
| b. Hepatic steatosis | ||||||
| Assessed by FLI | ||||||
| Model 1 | FLI | 0.193 [0.10]** | 0.008; 0.048 | 2.769 | ||
| R2 = 0.074; p = 0.010 | ||||||
| Model 2 | FLI | 0.147 [0.013] | –0.004; 0.047 | 1.655 | ||
| R2 = 0.077; p = 0.014 | ||||||
| Model 3 | FLI | 0.110 [0.015] | –0.012; 0.045 | 1.115 | ||
| R2 = 0.100; p = 0.007 | Ferritin | 0.152 [0.001]* | 0.000; 0.006 | 2.083 | ||
| Assessed by HSI | ||||||
| Model 1 | HSI | 0.148 [0.30]* | 0.005; 0.122 | 2.131 | ||
| R2 = 0.063; p = 0.030 | ||||||
| Model 2 | HSI | 0.057 [0.045] | –0.065; 0.114 | 0.542 | ||
| R2 = 0.068; p = 0.032 | ||||||
| Model 3 | HSI | 0.014 [0.046] | –0.085; 0.097 | 0.129 | ||
| R2 = 0.096; p = 0.011 | Ferritin | 0.159 [0.001]* | 0.000; 0.006 | 2.177 | ||
In model 1 the independent variables were FIB-4 or NFS (for liver fibrosis) and
FLI or HSI (for liver steatosis) and diabetes duration, sex, pO2, GGT (for liver
fibrosis equations) or ASAT (for liver steatosis equations), ferritin, C-peptide
and SHBG; in model 2 the body fat mass (BFM) was added to above mentioned
parameters and indexes; model 3 further adjusted for waist, HbA1c and HOMA-IR
(without C-peptide); *p
The ectopic fat accumulation is now recognized as a major risk factor for the
development of cardio-metabolic diseases, through local and systemic effects
[32]. EAT is a unique, quantifiable visceral fat depot that was previously
suggested to predict hepatic steatosis in obese individuals [33]. The
relationship between EAT and liver steatosis was previously evaluated, but less
studies investigated the association with liver fibrosis [10]. Moreover, there is
very limited data in the literature regarding this association in T2DM subjects
with MASLD. The present study is among the first to explore the relationship
between EAT and liver health in these individuals, and our findings indicate that
increased EATT (
A key finding of this study was the significant association between EATT and
liver fibrosis severity in T2DM patients with MASLD. Patients with markers of
advanced fibrosis exhibited higher EATT values compared to those without severe
fibrosis (8.97
Furthermore, EATT positively correlated with non-invasive indices of liver fibrosis and steatosis, supporting its potential role as a biomarker for liver disease. The correlation with liver steatosis appeared mediated by body adiposity, while the association with liver fibrosis (FIB-4) was independent of other factors. The lack of significant correlation with NFS after body adiposity adjustment (as opposed to FIB-4) is not entirely clear, but it might be explained by differences in the parameters used for the calculations (i.e., NFS formula included BMI, a body adiposity marker). The same might be true for the liver steatosis indices. Although it is well known that adipocytes (mainly visceral) significantly contribute to hepatic steatosis through the release of free fatty acids, pro-inflammatory cytokines/adipokines, and other mechanisms, we cannot clearly differentiate here the role of body fat distribution (total vs. visceral/EAT) in causing liver steatosis [35, 36].
These observations underscore the interconnection between metabolic dysfunction, liver health, and cardiovascular risk, which is also supported by the study of Yilmaz et al. [37], that showed a complex interplay between EATT, EAT-related adipokines, liver histology and coronary blood flow in subjects with NAFLD. This is further substantiated by the work of Turan [38] which indicated that NFS was correlated with EATT and higher cardiovascular risk, and of Liu et al. [39] reporting that the increase in EATT was associated with more severe liver steatosis, fibrosis and CVD. A relatively small prospective study of 88 adults (46 with obesity and 42 healthy controls) confirmed the positive correlations between EAT and liver fat assessed by proton density fat fraction (PDFF), but not between EAT and liver stiffness [40]. However, only six subjects in this cohort presented liver fibrosis (assessed by magnetic resonance elastography) [40].
The normal value for EATT is not well defined, especially in subjects with T2DM
and obesity, as some studies suggested a threshold of 5 mm, others of 7 mm or
higher [8, 41, 42, 43, 44]. The study by Iacobellis et al. [43] reported a
US-measured median EATT of 6.7–7 mm in individuals with overweight and class 1
and 2 obesity, and 8.9 mm in class 3 obesity (compared to a value of 4 mm in
normal-weight individuals). In our study, patients with EATT
Conversely, we have found that SHBG concentrations were lower in patients with elevated EATT. Similarly, the study by Aydogdu et al. [47] has shown a negative correlation between EATT and SHBG levels in women with polycystic ovary syndrome, and we have previously reported a negative correlation with LVMi and left atrium diameter. These results suggest a possible role of SHBG in metabolic dysregulation and cardiac health, but more in-depth research is required to fully elucidate the potential underlying pathophysiologic mechanisms.
Moreover, in all fully adjusted models of the multiple regression analyses ferritin was consistently correlated with EATT, suggesting that it might be a mediator between liver and cardiometabolic health. Serum ferritin was previously shown to be positively correlated with body adiposity, visceral adipose tissue, and EAT, and to be inversely associated with adiponectin levels in subjects with T2DM and obesity [48, 49, 50]. A causal relationship was suggested, as iron downregulated adiponectin transcription, and this was accompanied by increased insulin resistance [50]. Preclinical data also indicated that adipsin (a pericardial adipose tissue-derived adipokine) upregulated levels of ferritin heavy chain after myocardial infarction, suggesting a crosstalk between adipokines/adipocyte metabolism and iron metabolism [51]. On the other hand, serum ferritin was associated with liver inflammation and fibrosis in NAFLD patients, and hyperferritinemia was reported to be an independent predictor of MASLD-associated fibrosis in subjects with T2DM [52, 53]. Serum ferritin is a known inflammation marker, but it had been argued that it correlates with markers of cell stress and damage as well [54]. Thus, ferritin might mediate the link between visceral adipose tissue, insulin resistance and MASLD fibrosis, but further studies are needed to confirm this. The mechanisms behind EATT-liver fibrosis relationship are not entirely clear, but EATT is a highly active visceral adipose tissue depot, which releases bioactive factors, including fatty acids, proinflammatory and profibrotic factors, which may act in a paracrine or even endocrine fashion, thus playing an important role in the cardio-hepatic link [55, 56, 57].
The observed changes in echocardiographic parameters (i.e., lower EF and higher LVMi in patients with higher EATT), shed light on the cardiac implications of increased ectopic fat accumulation. These findings are consistent with studies linking visceral fat and EATT to adverse cardiovascular outcomes, underscoring the need for targeted interventions focusing on weight management in clinical practice [4, 5, 6, 58].
Overall, the findings of this study suggest that monitoring EATT could be a valuable clinical tool in managing patients with T2DM and MASLD. Identification of an increased US-measured EATT should prompt investigation of liver fibrosis status, but larger scale studies are needed to better define the significant cut-off value of EATT that would direct clinicians to further explore the liver health.
This study has several limitations. First, we could not use liver biopsy (the gold-standard method) to define steatosis or fibrosis, but instead several validated and accepted non-invasive indexes were employed. In fact, FIB-4 is the index recommended by guidelines for first-step screening for advanced liver fibrosis in individuals with T2DM [59, 60]. We have used three fibrosis biomarkers to ensure a proper selection of patients with advanced liver fibrosis, since none of them are perfect in predicting liver fibrosis [61]. Subsequent ROC analyses indicated that the AUROC was highest when this approach was used. Of course, this approach would need validation in future histology studies, as a potential misclassification of (advanced) fibrosis in the absence of histological evaluation is a possibility. In addition, similar findings were reported by the liver biopsy study of Petta et al. [18], which reassured the validity of our results. Secondly, we do not have longitudinal data to evaluate if the EATT changes would correlate with changes in liver steatosis or fibrosis. Further studies should explore this aspect, as well as the potential pathogenetic mechanisms linking EAT and liver fibrosis, and this work lays the ground for it. Thirdly, we did not have the possibility to use more advanced cardiac imaging methods (e.g., magnetic resonance or CT) for a more accurate quantification of EATT and EAT volume, yet echocardiography provides a reasonable accuracy for EATT measurement (even if it relies to some degree on the experience of the US operator), is not expansive or invasive, and is largely available in clinical practice. However, the intra-observer variability was not assessed in this study, limiting insights into reproducibility. Future studies should involve multiple observers and report metrics such as intra-class correlation coefficients (ICCs) to strengthen methodological reliability. Finally, the single-center design of this study precludes the extrapolation of the results in the general population, and certainly more studies in patients with different demographic and medical backgrounds are needed.
T2DM patients with MASLD and markers of advanced liver fibrosis have higher EATT, which was independently associated with liver fibrosis.
The datasets used and analyzed during the current study are available from the corresponding author on reasonable request.
SC designed the study, acquired, analyzed and interpreted the data, wrote part the manuscript, designed the figures; NR acquired and interpreted data and wrote part of the manuscript; ALR and DO acquired data and reviewed the paper for important intellectual content. All authors read and approved the final manuscript. All authors have participated sufficiently in the work and agreed to be accountable for all aspects of the work.
The study was carried out in accordance with the guidelines of the Declaration of Helsinki and approved by the Ethics Committees of the Emergency County Clinical Hospital of Târgu Mureș (nr. 8120/05.04.2022), County Clinical Hospital of Târgu Mureș (nr. 4873/24.05.2022), and George Emil Palade University of Medicine, Pharmacy, Science and Technology of Târgu Mureș (nr. 1806/22.06.2022). The informed consent was signed by all patients enrolled in the study.
The authors thank the members of the Department of Cardiology/Emergency County Clinical Hospital, Târgu Mureş and of the Advanced Center for Medical and Pharmaceutical Research (CCAMF) of the George Emil Palade University of Medicine, Pharmacy, Sciences and Technology of Târgu Mureș for their technical support.
This work was supported by the University of Medicine, Pharmacy, Science and Technology “George Emil Palade” of Târgu Mureș Research Grant number 10126/5/17.12.2020. The research was carried out with the support of the Advanced Center for Medical and Pharmaceutical Research (CCAMF) of the George Emil Palade University of Medicine, Pharmacy, Sciences and Technology of Târgu Mureș.
The authors declare no conflict of interest.
References
Publisher’s Note: IMR Press stays neutral with regard to jurisdictional claims in published maps and institutional affiliations.