


 , Ying Zhao 2,†, Ziyang Song 1, Yuzhu Ma 2, Jiajia Yang 2, Yu Zhang 1,*
1 Department of Radiology, The Fourth Affiliated Hospital of Soochow University (Suzhou Dushu Lake Hospital), 215124 Suzhou, Jiangsu, China
2 Department of Radiology, The First Affiliated Hospital of Soochow University, 215006 Suzhou, Jiangsu, China
†These authors contributed equally.
Abstract
Identifying the etiology of acute ischemic stroke (AIS) is critical for secondary prevention and treatment choice in stroke patients. This study aimed to investigate the dual-energy computed tomography (DECT) quantitative thrombus parameters associated with cardioembolic (CE) stroke and develop a nomogram that combines DECT and clinical data to identify CE stroke.
We retrospectively reviewed all consecutive patients from January 2020 to July 2022 with anterior circulation stroke and proximal intracranial occlusions. Patients were divided into CE stroke and non-cardioembolic (NCE) stroke groups according to the Trial of Org 10172 in Acute Stroke Treatment (TOAST) criteria. Univariable and multivariable logistic analyses were conducted, and a nomogram was developed by combining clinical and DECT variables. This nomogram was subsequently validated using an independent internal cohort of patients.
A total of 96 patients were analyzed, of which 43 (45%) were diagnosed with CE stroke. The multivariable analysis identified the following factors as being independently associated with CE stroke: normalized iodine concentration (NIC) (per 10-2 unit increase) (odds ratio (OR) = 1.598, 95% CI: 1.277–1.998; p < 0.001), gender (OR = 0.113, 95% CI: 0.028–0.446; p = 0.002), hypertension (OR = 0.204, 95% CI: 0.054–0.770; p = 0.019), and baseline National Institutes of Health Stroke Scale (NIHSS) (OR = 1.168, 95% CI: 1.053–1.296; p = 0.003). The matching nomogram displayed an area under the curve (AUC) of 0.929 in the study sample (n = 96) and 0.899 in the validation cohort (n = 29).
A nomogram that combines clinical and DECT variables can display good diagnostic performance for CE stroke.
Keywords
- acute ischemic stroke
- cardioembolic stroke
- thrombosis
- dual-energy CT
- nomogram
Acute ischemic stroke (AIS) is one of the major diseases causing disability and death. Ischemic stroke, especially intracranial large blood vessel occlusion, imposes a large financial burden on society and families due to its poor prognosis [1]. Identifying the etiology of AIS is therefore of great significance for the selection of secondary prevention measures and treatment choices. For secondary prevention, anticoagulant drugs such as warfarin are preferred for cardioembolic (CE) [2] stroke. Compared to non-cardioembolic (NCE) thrombi, CE thrombi are increasingly considered to be more difficult to remove, with catheter aspiration often used as a supplemental method to stent retrieval during mechanical thrombectomy [3, 4, 5, 6]. This may be due to a stiffer thrombus and greater friction coefficient [7]. It is therefore important to identify the source of thrombi early, allowing for timely treatment with mechanical thrombectomy. Atrial fibrillation (AF) is the main cause of CE stroke, but some AF is not discovered until the left atrial appendage thrombi are shed off. No documented prior history of AF increases the difficulty in identifying CE stroke at admission due to the limitation of emergency electrocardiograms (ECGs) on detecting paroxysmal AF. CE stroke can also be triggered by other cardiogenic causes, such as patent foramen ovalis. Therefore, other indicators besides AF are needed to identify CE stroke.
Some readily available clinical indicators can help to diagnose the etiology of stroke. CE stroke is more common in women with high baseline National Institutes of Health Stroke Scale (NIHSS) [8, 9, 10, 11]. Patients with hypertension often progress to NCE, mainly large artery atherosclerosis (LAA) stroke. Compared to NCE thrombi, CE thrombi usually have higher thrombus permeability, which indicates the ability of contrast agents to permeate the irregular space in the thrombus [12, 13]. Conventional permeability is evaluated as the increased thrombus attenuation between noncontrast computed tomography (NCCT) and CT angiography (CTA) images [14, 15]. This method requires precise co-registration, which is time-consuming and difficult to achieve in clinical practice, as well as being prone to inevitable measurement error [16]. Dual-energy CT (DECT) generates iodine overlay maps based on material decomposition technology. It can directly obtain the penetration amount of the contrast agent by displaying the iodine concentration (IC) in the thrombus [17, 18, 19]. The IC of the thrombus was normalized to the IC of the contralateral normal vessel to derive a normalized IC (NIC) value, thereby eliminating the potential effect of individual circulation differences on the IC of the lesion. The NIC of the thrombus is a new permeability parameter that is assessed using iodine overlay maps alone without the co-registration process. Therefore, we hypothesized that NIC may have higher clinical value for identifying CE stroke, with a simpler operation process and less measurement error. In addition, previous studies have suggested that there were differences in the thrombus composition between CE and NCE stroke [13, 20, 21, 22]. CE thrombi consist of fewer red blood cells (RBCs) and more fibrin/platelet (FP) conglomerations, while the opposite is seen for NCE thrombi. DECT allows the operator to analyze how the material-specific attenuation varies with X-ray photon energy [23]. We suspected that DECT could distinguish between thrombi with similar X-ray attenuation but different histopathologic compositions by atomic numbers and spectral attenuation curves, as represented by the effective atomic number (Zeff) and slope (
The aims of this study were therefore to identify quantitative DECT thrombus parameters that are associated with CE stroke, and to subsequently combine these variables with clinical data in a nomogram to identify CE stroke.
The study was approved by the hospital’s Ethics Committee and the requirement for individual consent was waived due to the retrospective design of the study (Approval number: 2022 the 59th). We retrospectively reviewed consecutive patients admitted to our hospital between January 2020 and July 2022 for acute anterior circulation stroke and proximal intracranial occlusions, and who received multimodal DECT scans at admission (n = 131 patients). The exclusion criteria were: (a) poor image quality (images with motion or metal artifacts that affected the measurements); (b) patients received treatment before CT scanning; (c) clinical data were insufficient to determine the sources of thrombi (patients without ECG-monitoring for at least 24 hours or echocardiogram); and (d) the CT showed calcification in the vascular walls surrounding thrombi which could interfere with thrombus assessment. Thirty-five patients were excluded based on these criteria, leaving 96 patients who were finally enrolled in the study. Fig. 1 presents a flowchart of the study enrollment.
 Fig. 1.
 Flowchart for enrollment of the study sample and validation cohort. AIS, acute ischemic stroke; CE, cardioembolic; NCE, non-cardioembolic; LAA, atherosclerotic; SOE, other determined etiology; CT, computed tomography.
NCCT and dual-energy CTA (DECTA) were conducted upon admission using a 256-slice CT scanner (Revolution CT, GE Healthcare, Chicago, IL, USA). NCCT (conventional helical mode): tube voltage 120 kVp, tube current 320 mA. DECTA (Gemstone Spectral Imaging [GSI] mode): rapid tube voltage switching between 80 and 140 kVp within the duration of a single rotation, triggered when the CT numbers at the ascending aorta rose to 120 HU by utilizing an automated bolus-tracking technology, contrast agent (Iopamidol, 370 mg/mL, Bayer, Leverkusen, Germany) at 1 mL/kg of body weight injected at 5 mL/s. DECTA images were imported into the machine-equipped workstation (AW VolumeShare 7) for analysis. Iodine overlay maps, water overlay maps, and Zeff maps were generated with a 0.63 mm slice thickness. Spectral attenuation curves were also generated.
All DECTA images were assessed on the AW VolumeShare 7 workstation by two experienced and trained neuroradiologists who were blinded to the clinical data. Disagreements with regard to measurements were settled by consensus between the two readers. The NIC, water concentration (WC) and Zeff were measured on iodine overlay maps, water overlay maps, and Zeff maps, respectively. Zeff maps disaplayed the effective atomic number of the substance. The slope of the spectral attenuation curve (
 Fig. 2.
 Example of thrombus dual-energy CT (DECT) variables assessment in a 77-year-old woman with occlusion of the left middle cerebral artery and cardioembolic (CE) stroke. The three ROIs on the thrombus were labeled as L1, L2, and L3. The normalized iodine concentration (NIC), water concentration (WC), effective atomic number (Zeff) and slope (
 Fig. 3.
 Example of thrombus dual-energy CT (DECT) variables assessment in a 56-year-old man with occlusion of the right middle cerebral artery and non-cardioembolic (NCE) stroke. The normalized iodine concentration (NIC), water concentration (WC), effective atomic number (Zeff) and slope (
Two experienced and trained observers assessed the stroke etiology according to the Trial of Org 10172 in Acute Stroke Treatment (TOAST) classification based on clinical data [24]. Patients were assigned to two groups according to this classification: CE stroke (TOAST 2) and NCE stroke (TOAST 1 and 4).
Statistical analysis was performed using SPSS version 20.0 (IBM Corp, Armonk, NY, USA) and R version 4.1.3 (R Foundation for Statistical Computing, Vienna, Austria). Continuous variables were compared using the Student’s t-test or Mann Whitney U test, and categorical variables were compared using the
The independent validation cohort consisted of 29 patients admitted consecutively to the same hospital between August 2022 and July 2023. Patients from this cohort met the same inclusion and exclusion criteria as patients from the study cohort.
All statistical tests were performed using a two-tailed approach, with the significance threshold defined as p
Of 131 patients who were initially reviewed, 96 patients fulfilled the inclusion criteria and were subsequently enrolled in the study sample. The median age was 71 years (interquartile range [IQR], 58 to 76 years) and 61% (n = 59) of patients were men. Of the 96 patients, 43 (45%) had CE stroke, 52 (54%) had LAA stroke and 1 (1%) had stroke caused by other determined etiology (SOE). Table 1 presents the clinical and DECT characteristics of the CE and NCE stroke groups. Compared to patients with NCE stroke, patients with CE stroke had significantly greater NIC (0.104
| Characteristic | Study sample | Comparison with validation cohort | |||||
| CE group | NCE group | p value | Study sample | Validation cohort | p value | ||
| No. of patients, n (%) | 43 (45) | 53 (55) | - | 96 | 29 | - | |
| Gender | 0.002 | 0.693 | |||||
| No. of women, n (%) | 24 (56) | 13 (25) | 37 (39) | 10 (34) | |||
| No. of men, n (%) | 19 (44) | 40 (75) | 59 (61) | 19 (66) | |||
| Age (yr), median (IQR) | 72 (62–76) | 70 (57–76) | 0.295 | 71 (58–76) | 73 (60–80) | 0.336 | |
| Baseline NIHSS, median (IQR) | 14 (11–19) | 8 (4–13) | 11 (5–17) | 8 (4–13) | 0.109 | ||
| Time from symptom onset to CT (min), median (IQR) | 180 (120–300) | 180 (120–300) | 0.759 | 180 (120–300) | 223 (115–435) | 0.381 | |
| Diabetes mellitus, n (%) | 5 (12) | 17 (32) | 0.018 | 22 (23) | 8 (28) | 0.606 | |
| Hypertension, n (%) | 21 (49) | 38 (72) | 0.022 | 59 (61) | 21 (72) | 0.281 | |
| Dyslipidemia, n (%) | 23 (53) | 33 (62) | 0.386 | 56 (58) | 17 (59) | 0.978 | |
| Smoking history, n (%) | 4 (9) | 19 (36) | 0.002 | 23 (24) | 6 (21) | 0.715 | |
| Atrial fibrillation, n (%) | 36 (84) | 3 (6) | 39 (41) | 11 (38) | 0.795 | ||
| NIC, mean | 0.104 | 0.051 | 0.075 | 0.068 | 0.471 | ||
| WC (mg/cm3), mean | 1033.25 | 1030.92 | 0.156 | 1031.96 | 1024.24 | ||
| Zeff, mean | 8.01 | 7.90 | 0.009 | 7.95 | 7.94 | 0.913 | |
| 0.79 | 0.59 | 0.007 | 0.68 | 0.67 | 0.935 | ||
Abbreviations: CE, cardioembolic; NCE, non-cardioembolic; NIHSS, National Institutes of Health Stroke Scale; NIC, normalized iodine concentration; WC, water concentration; Zeff, effective atomic number;
Table 2 presents the findings of univariable and multivariable analysis of the baseline clinical and DECT variables. The multivariable analysis identified four variables that were significantly associated with CE stroke: NIC (per 10-2 unit increase) (OR = 1.598, 95% CI: 1.277–1.998, p
| Univariable model | Multivariable model | |||
| Odds ratio (95% CI) | p value | Odds ratio (95% CI) | p value | |
| Gender* | 0.257 (0.108–0.613) | 0.002 | 0.113 (0.028–0.446) | 0.002 |
| Baseline NIHSS | 1.165 (1.080–1.257) | 1.168 (1.053–1.296) | 0.003 | |
| Diabetes mellitus | 0.279 (0.093–0.834) | 0.022 | … | 0.364 |
| Hypertension | 0.377 (0.162–0.878) | 0.024 | 0.204 (0.054–0.770) | 0.019 |
| Smoking history | 0.184 (0.057–0.593) | 0.005 | … | 0.540 |
| NIC, per 10-2 unit increase | 1.490 (1.267–1.752) | 1.598 (1.277–1.998) | ||
| Zeff | 17.751 (1.887–167.009) | 0.012 | … | 0.317 |
| 5.136 (1.487–17.743) | 0.010 | … | 0.339 | |
Abbreviations: NIHSS, National Institutes of Health Stroke Scale; NIC, normalized iodine concentration; Zeff, effective atomic number;
*Female is used as a reference. Diabetes mellitus, smoking history, Zeff, and λHU were not retained in the final multivariable model during the backward stepwise selection process, and hence, Odds Ratios were not applicable to these four variables and were marked with an ellipsis (…).
 Fig. 4.
 Nomogram for the identification of cardioembolic (CE) stroke identification based on combined clinical and dual-energy CT (DECT) features. Each factor was assigned a numerical value ranging from 0 to 100, with the total score being the sum of scores for all factors. The total score was mapped to the probability axis at the bottom of the model, providing a visual representation of the estimated probability of CE stroke.
Using the nomogram, the AUC for identifying CE stroke in the study sample was 0.929 (95% CI: 0.881–0.977, p
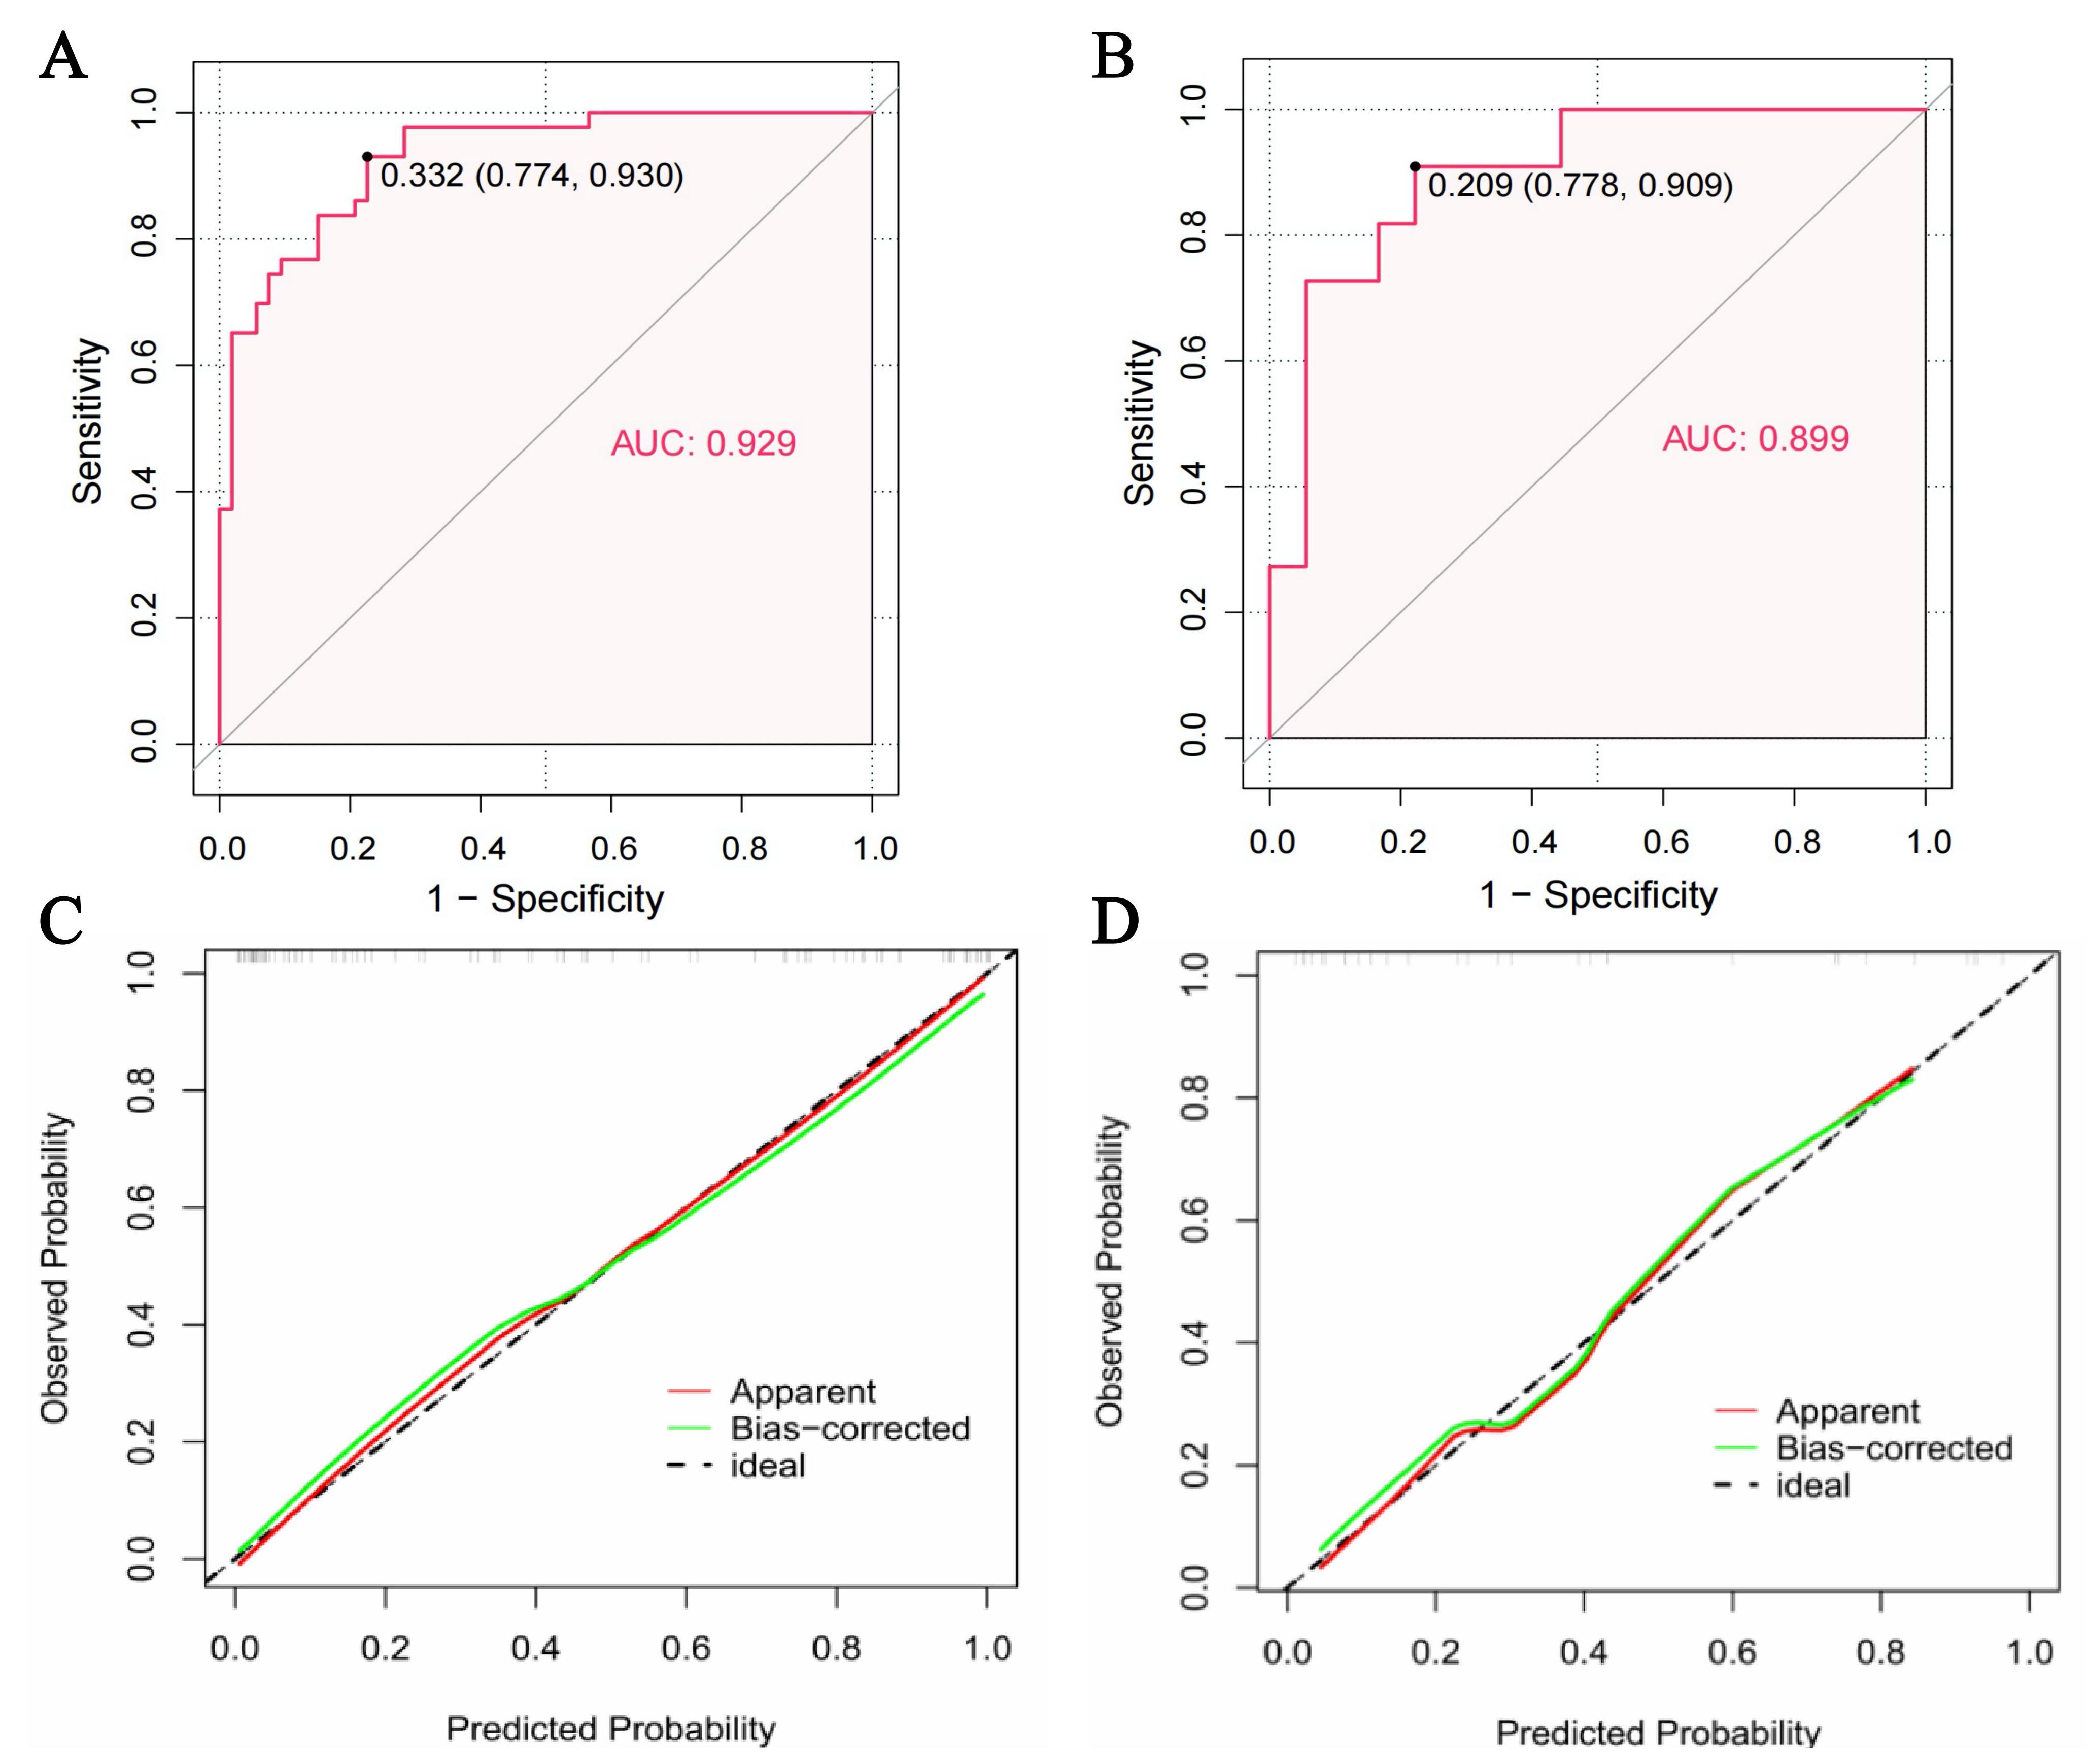 Fig. 5.
 The performance of the nomogram. (A,B) Area under curve (AUC) of the model for the identification of cardioembolic (CE) stroke in the study sample (A) and validation cohort (B). The solid black dots indicated optimal cutoff points, with adjacent numerical values representing the corresponding specificity and sensitivity. The model demonstrated strong diagnostic accuracy in identifying CE stroke in both the study sample and the validation cohort. (C,D) Calibration curves of the model in the study sample (C) and validation cohort (D).
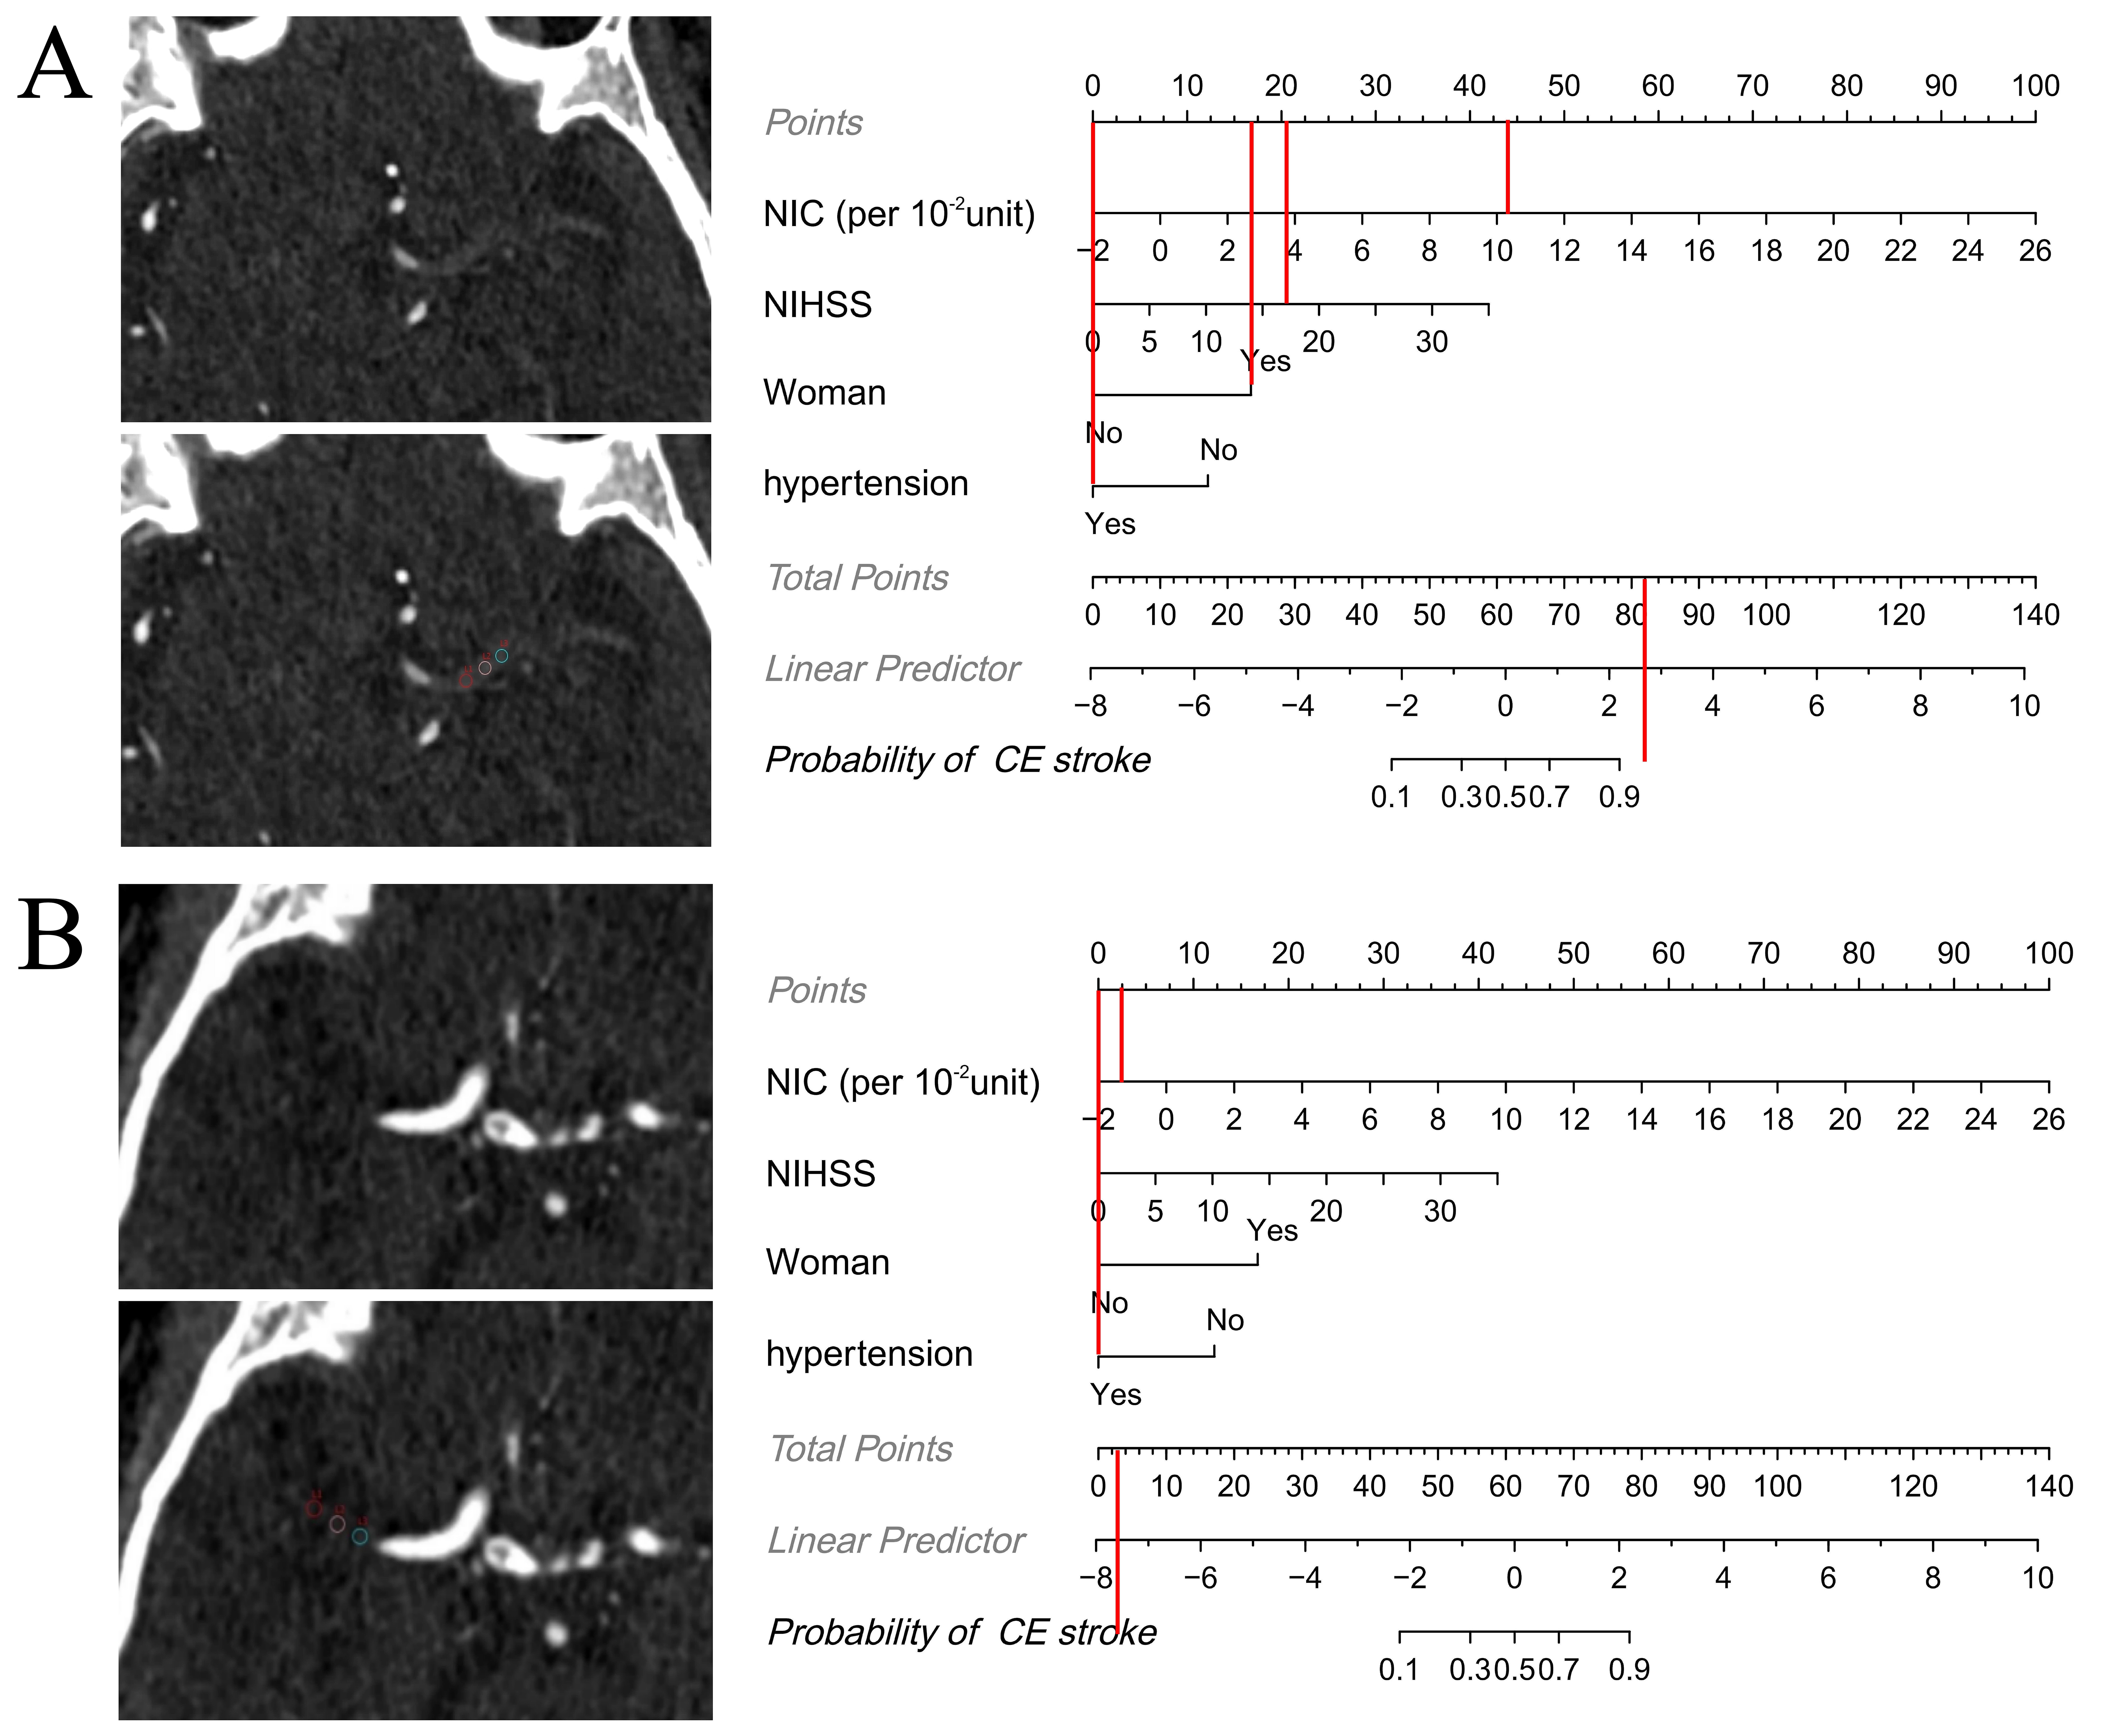 Fig. 6.
 Examples showing how the nomogram can be applied in clinical practice. The figures demonstrate the step-by-step process of computing the probability of cardioembolic (CE) stroke using the nomogram. (A) Axial iodine overlay maps in a 77-year-old woman with a National Institutes of Health Stroke Scale (NIHSS) level of 17 at admission. Normalized iodine concentration (NIC) (per 10-2 unit) = 10.2, hypertension = “yes”. The total score was 82, which maps to a CE stroke probability of greater than 0.9. The patient had a CE stroke according to Trial of Org 10172 in Acute Stroke Treatment (TOAST), which was consistent with the nomogram result. (B) Axial iodine overlay maps in a 56-year-old man with a NIHSS level of 0 at admission. NIC (per 10-2 unit) = –1.4, hypertension = “yes”. The total score was 2.5, which maps to a CE stroke probability of less than 0.1. The patient had an atherosclerotic (LAA) stroke according to TOAST, which was consistent with the nomogram result.
Using AF, the AUC for identifying CE stroke in the study sample was 0.869 (95% CI: 0.800–0.938), which was lower but not significantly different to the AUC of the nomogram (Z = 1.515; p = 0.130).
Determining the source of thrombi in stroke patients is of great value for the selection of secondary prevention and treatment methods [2, 3, 4, 5, 6]. AF is an important diagnostic proof of CE stroke while paroxysmal AF is usually difficult to be detected by emergency ECG at admission because the ECG shows normal results during non-episodic periods of paroxysmal AF. Studies have shown that thrombus permeability parameters assessed on conventional NCCT and CTA scans can help to predict CE stroke [12, 13], but this approach is heavily dependent on accurate image co-registration. In the event that co-registration is unsuccessful, measurement errors are unavoidable [16]. Moreover, the measurement process is complex and time-consuming, thus limiting its clinical utility. On the other hand, DECT can produce iodine overlay maps that directly assess the thrombus permeability, thereby eliminating the image co-registration process [17, 18, 19]. This approach offers greater simplicity, efficiency, and precision in clinical settings. Moreover, DECT can provide additional tissue information due to the acquisition of high- and low-energy data which may be helpful in identifying the source of thrombi [25, 26]. The current study aimed to construct a nomogram model based on DECT to determine the etiology of stroke when the AF history is unknown, or when the stroke is caused by other cardiogenic causes. We found the following: (a) NIC, Zeff,
Thrombi consist of FP, RBCs, a small number of white blood cells (WBCs), and other components that are cross-linked to form irregular gaps. Together, these constitute the histological basis of thrombus permeability [20]. In agreement with previous studies [12, 13], we observed higher permeability in CE thrombi with greater NIC (CE vs NCE: 0.104
The present study also found that Zeff and
This research also found that CE stroke was more commonly seen in female patients with increased baseline NIHSS and without hypertension. Studies on gender differences in stroke have generally found that women are more likely to suffer from CE stroke, whereas men are more likely to suffer from LAA stroke due to higher rates of smoking and drinking [8, 9]. Zotter et al. [10] and Guglielmi et al. [11] suggested that CE thrombi were often larger than LAA thrombi, which could easily lead to proximal intracranial occlusions and consequently a higher baseline NIHSS, in agreement with the findings of our study. Hypertension is generally recognized as a risk factor for atherosclerosis, so a high prevalence of LAA stroke, rather than CE stroke, was noted in patients with hypertension. The present study used NIC, gender, baseline NIHSS and hypertension history to develop the nomogram, which was demonstrated to have a good validity and reliability. The AUC of this nomogram was slightly higher than that of AF, although the difference was not statistically significant (0.929 vs 0.869, p = 0.130). Therefore, our nomogram can be used to identify CE stroke when the existence of AF is difficult to confirm. Other cardiogenic causes besides AF can also lead to CE stroke, such as patent foramen ovalis. It is easy to be misdiagnosed stroke etiology in this condition when based only on AF. In addition, AF also occurs in some NCE stroke patients. These may explain why the AUC of AF in identifying CE stroke was slightly lower than that of our nomogram.
Timely and rapid identification of CE stroke would greatly assist neuro-interventional physicians in making optimal mechanical thrombectomy plans [30, 31]. Our study used the emergency DECT parameter (NIC) and clinical indicators (gender, baseline NIHSS, and hypertension history) to construct a nomogram that can be a useful tool for identifying CE stroke at admission. At later stages of treatment, some occult AF or other cardiogenic causes are still undetectable, and our nomogram could then also be used to determine the source of thrombi.
There were several limitations to this study. First, only patients with anterior circulation stroke and proximal intracranial occlusions were included. Whether our result is applicable to patients with distal artery occlusion of anterior circulation or posterior circulation requires further study. Second, the sample size of our study was modest due to the limitations of DECT scanning. DECT is an advanced CT equipment capable of performing both conventional and dual-energy scans. Although it is more expensive than traditional CT, DECT offers superior image quality and richer diagnostic information without increasing the radiation dose to patients. With the growing clinical adoption of DECT in recent years, large multicenter DECT studies on stroke will become feasible in the near future. Third, the retrospective study design meant that some clinical data, such as the use of anticoagulants, was missing. This can be overcome by conducting further prospective studies. Fourth, Zeff and
We demonstrated that a DECT thrombus permeability parameter, NIC, is a useful indicator of CE stroke. A nomogram constructed using NIC, gender, baseline NIHSS and hypertension history showed good diagnostic performance for CE stroke. We believe this nomogram may be especially valuable when the AF history is unknown, or the stroke is caused by other cardiogenic causes.
AIS, Acute ischemic stroke; CE, Cardioembolic; NCE, Non-cardioembolic; AF, Atrial fibrillation; ECG, Electrocardiogram; NIHSS, National Institutes of Health Stroke Scale; LAA, Large artery atherosclerosis; NCCT, Noncontrast computed tomography; CTA, CT angiography; DECT, Dual-energy CT; IC, Iodine concentration; NIC, Normalized iodine concentration; RBC, Red blood cell; FP, Fibrin/platelet; Zeff, Effective atomic number; HU, Hounsfield unit;
The datasets generated or analyzed during the study are mainly human CT images, and are not publicly available due to the ethics policies of the hospital, but are available from the corresponding author on reasonable request.
YD and YZhang designed the research study. YD and YZhao performed the research. YZhang, YM and JY put forward suggestions for modification. YD, ZS, YM and JY analyzed the data. YD and YZhao wrote the initial draft of the manuscript. All authors contributed to editorial changes in the manuscript. All authors read and approved the final manuscript. All authors have participated sufficiently in the work and agreed to be accountable for all aspects of the work.
The study was carried out in accordance with the guidelines of the Declaration of Helsinki and approved by the Ethics Committee of the institution (the First Affiliated Hospital of Soochow University) (Protocol No. 059, 2022), and the requirement for informed consent was waived due to the retrospective nature of the study.
Not applicable.
This research received no external funding.
The authors declare no conflict of interest.
References
Publisher’s Note: IMR Press stays neutral with regard to jurisdictional claims in published maps and institutional affiliations.