

 , Tengke Wang 1, Yan Yu 1, Xuran Lu 1, Zheyuan Chen 1, Li Yu 1, Sihao Cheng 1, Lingru Li 1, Liangshan Wang 1, Nan Liu 1,*
1 Center for Cardiac Intensive Care, Beijing Anzhen Hospital, Capital Medical University, 100029 Beijing, China
Abstract
Coagulation disorders are potentially one of the most important pathogeneses of acute respiratory distress syndrome (ARDS) following acute type A aortic dissection (ATAAD). This study aimed to determine whether aortic dissection singularly and cardiopulmonary bypass (CPB) surgery can activate coagulation pathways, promoting ARDS development in patients with ATAAD.
A total of 450 patients who received treatment at Beijing Anzhen Hospital, Capital Medical University, between March 2023 and February 2024 were consecutively enrolled in this prospective cohort study. We analyzed the clinical factors and measured serum coagulation biomarkers by enzyme-linked immunosorbent assay (ELISA) among patients with ATAAD, aortic aneurysm (AA), or unstable angina (UA). Logistic regression, two-way analysis of variance (ANOVA), and Spearman's correlation analysis were performed. Furthermore, the patients with ATAAD were divided into ARDS (based on chest radiographic findings and an oxygenation index ≤300 mmHg) and non-ARDS groups for subgroup comparisons.
The incidence of postoperative ARDS among patients with ATAAD was 20.7% (13.3% in the AA group and 7.3% in the UA group). Preoperatively, prothrombin time (PT) was longer in patients with ATAAD than in those with AA or UA ((odds ratio (OR): 12.0, 95% confidence interval (CI): 11.5–12.6) vs. (OR: 11.4, 95% CI: 10.9–12.1) vs. (OR: 11.2, 95% CI: 10.8–11.6), respectively; p < 0.001). The D-dimer levels, fibrin degradation products (FDPs), factor XIIa, and factor VIII-Ag (FVIII-Ag) were significantly elevated preoperatively and postoperatively in patients with ATAAD. The FDP levels in the ATAAD subgroup immediately after surgery were significantly higher in the ARDS group compared with those in the non-ARDS group (OR: 2.26, 95% CI: 1.13–4.54; p = 0.022). In addition, a negative correlation existed between the FXII level (correlation coefficient r = –0.682, p = 0.043) at 24 hours after surgery and the oxygenation index.
Coagulation activation may be caused by aortic dissection singularly and CPB, which promotes postoperative ARDS in patients with ATAAD.
Keywords
- acute aortic dissection
- acute respiratory distress syndrome
- coagulation
- fibrinolysis
- cardiopulmonary bypass
Acute lung injury (ALI) and acute respiratory distress syndrome (ARDS) are common complications that may occur during perioperative management, especially in high-risk populations of patients undergoing surgery [1, 2, 3]. ARDS is a primary cause of postoperative acute hypoxemic respiratory failure and its etiologies are diverse [4, 5, 6, 7]. The occurrence of ARDS has also been investigated following cardiac surgery (CS) involving cardiopulmonary bypass (CPB) procedures [3, 7, 8, 9]. Despite the continual refinement of perioperative management and surgical techniques, up to 20% of patients are affected by this postsurgical complication [3, 10]. Postoperative ARDS can seriously affect patient outcomes, with mortality rates as high as 40–80% in severe cases [2, 7, 11, 12] and functional limitations sometimes persisting 5 years after an ARDS episode [13].
Although the pathogenesis of ARDS is not entirely clear, recent studies suggest that the activation of coagulation is closely related to the development of ARDS [6, 14, 15, 16, 17, 18] and blockade of the initiating steps of the clotting cascade may be beneficial for patients with ARDS [6, 19]. During cardiac surgery, CPB procedures and extensive surgical trauma can induce the widespread activation of the coagulation system [17, 20, 21], and the pathogenesis of acute type A aortic dissection (ATAAD) has been shown to be associated with coagulation disorders [22]. Therefore, both ATAAD itself and CPB can contribute to the development of multiple disorders of the coagulation system; however, there is little data supporting the activation of coagulation cascade plays a role in the etiology of ARDS after aortic surgery.
The occurrence of ALI/ARDS following aortic surgery is unpredictable, although recent studies have suggested that early identification and improved perioperative care can prevent postoperative ALI/ARDS. Although several risk factors have been identified are associated with the occurrence of post-operative ARDS, to our knowledge, barely any study has illustrated the association between coagulation markers and ARDS in ATAAD patients. Therefore, the aim of this study was to explore the correlations between the serum levels of various biomarkers of coagulation and the occurrence of ARDS following aortic surgery, as these markers could serve as reliable predictors of the risk of ALI/ARDS.
This single-center prospective observational study was performed at the Center for Cardiac Intensive Care of Beijing Anzhen Hospital, Capital Medical University. A total of 450 patients were consecutively enrolled between March 2023 and February 2024, including 150 patients diagnosed with ATAAD, 150 with aortic aneurysm (AA), and 150 with unstable angina (UA). Patients with ATAAD and AA underwent Sun’s surgery or partial aortic arch replacement, whereas patients with UA underwent off-pump coronary artery bypass grafting (OPCABG).
All adult subjects were over 18 years of age, had been diagnosed with AA (chronic onset), UA and ATAAD (with a time from onset of under two weeks and had been scheduled for emergency surgery). The exclusion criteria were as follows: patients with neoplastic or chronic coagulation and inflammatory disorders; patients with missing specimens or clinical data; and patients who experienced a failed surgical intervention or died within 24 hours after surgery. Clinical data of these patients were collected during the hospitalization period. In addition, nine patients in each group were randomly selected and venous plasma was collected and subjected to enzyme-linked immunosorbent assays (ELISAs) to quantify various markers of coagulation and inflammation. We randomly selected 9 patients from each group by using a random number generator to ensure the reproducibility and validity of the findings.
All subjects underwent contrast-enhanced computed tomography (CT) to confirm the
surgeons’ diagnoses of ATAAD [23]. Based on the European Society of Intensive
Care Medicine (ESICM) definition [5], ARDS was confirmed via arterial blood gas
analysis and chest radiography. These criteria included an acute onset, an
oxygenation index (partial pressure of oxygen in arterial blood/fraction of
inspired oxygen, PaO2/FiO2)
Radial artery pressure, dorsalis pedis artery pressure, and central venous pressure were monitored before surgery in all patients using established methods. Anesthesia was administered in accordance with institutional standards. Aortic surgical procedures were performed under general anesthesia, CPB, deep hypothermic circulatory arrest (DHCA), and selective cerebral perfusion were conducted using a modified elephant trunk technique (Sun’s procedure) as previously described [22].
Data related to clinical characteristics, demographic information, medical history, intraoperative variables, and details pertaining to the subsequent course of recovery in the intensive care unit (ICU) post-surgery were recorded. Each patient’s preoperative risk profile was evaluated using the European System for Cardiac Operative Risk Evaluation (EuroSCORE) [24]. The dosage of vasoactive drug administration and organ function were assessed during the first 48 h post-surgery using the vasoactive inotrope score (VIS) [25] and the Sequential Organ Failure Assessment (SOFA) scale [26], respectively.
Blood samples were collected in sodium citrate tubes through a central venous
catheter at the following three time points: immediately prior to anesthesia
induction; immediately after surgery; and 24 hours after surgery. Samples were
centrifuged at 1550
We used the median to interpolate the missing data of continuous variables and
conducted the Kolmogorov-Smirnov test. Continuous variables were expressed as the
mean
The baseline characteristics of the ATAAD group were first compared with those of the AA group and UA group separately, followed by ANOVA across all three groups with Bonferroni correction for multiple comparisons. Patients with ATAAD were further stratified into ARDS and Non-ARDS subgroups, with a comparative analysis conducted on their baseline characteristics. All coagulation biomarkers were normalized and standardized using log- and z-score transformations. Logistic regression models were applied separately in the ATAAD group, AA group and UA group to assess the associations between coagulation biomarkers and postoperative ALI/ARDS, with odds ratios (ORs) and 95% confidence intervals (95% CIs) calculated. Model 1 was a univariate model and Model 2 was adjusted for traditional confounders, including sex, age, body mass index (BMI), HTN, diabetes, AKI, HF, liver dysfunction (LD), CLD, ND, smoking status, alcohol consumption, prior CS, preoperative aspartate aminotransferase (AST) level, and the preoperative oxygenation index (PaO2/FiO2, P/F). These covariates include medical history data and some preoperative meaningful indicators (AST and P/F) between the ARDS group and Non-ARDS group in the baseline characteristics (Supplementary Tables 1,2). Collinearity test was conducted in the multivariate analysis (Supplementary Table 3). A two-way ANOVA was used to account for both group and time as independent variables in ELISA. Spearman correlation analysis was used to analyze the associations between variables for inferring coagulation activity and the oxygenation index.
All analyses were performed using R software 4.3.1 (R Foundation, Vienna, Austria) (https://www.r-project.org/)
and Prism 10.2 (GraphPad Corp, San Diego, CA, USA). p-value
Baseline and preoperative laboratory values of the participants are presented in
Table 1. Patients in the ATAAD group were younger than those in the AA group
(49.1
| Variables | ATAAD | AA | UA | 1p | 2p | 3p | |
| (n = 150) | (n = 150) | (n = 150) | |||||
| Demographic information and preoperative complications | |||||||
| Age (yrs) | 49.1 |
55.3 |
62.8 |
||||
| Sex (male%) | 114 (76.0) | 109 (72.7) | 83 (55.3) | 0.597 | |||
| BMI (kg/m2) | 27.2 |
25.6 |
25.6 |
||||
| Smoking | 65 (43.3) | 72 (48.0) | 49 (32.7) | 0.487 | 0.074 | 0.022 | |
| Alcohol | 19 (12.7) | 42 (28.0) | 33 (22.0) | 0.002 | 0.047 | 0.004 | |
| HTN | 126 (84.0) | 94 (62.7) | 90 (60.0) | ||||
| Diabetes | 13 (8.7) | 9 (6.0) | 57 (38.0) | 0.506 | |||
| AKI | 23 (15.3) | 7 (4.7) | 5 (3.3) | 0.004 | 0.001 | ||
| LD | 11 (7.3) | 7 (4.7) | 4 (2.7) | 0.466 | 0.112 | 0.171 | |
| HF | 49 (32.7) | 57 (38.0) | 88 (58.7) | 0.398 | |||
| CLD | 4 (2.7) | 2 (1.3) | 4 (2.7) | 0.680 | 1 | 0.664 | |
| ND | 1 (0.7) | 4 (2.7) | 4 (2.7) | 0.367 | 0.367 | 0.360 | |
| Prior CS | 2 (1.3) | 13 (8.7) | 1 (0.7) | 0.008 | 1 | ||
| Shock | 7 (4.7) | 0 (0.0) | 0 (0.0) | 0.022 | 0.022 | 0.001 | |
| AC | 15 (10.0) | 1 (0.7) | 0 (0.0) | 0.001 | |||
| EuroSCORE | 5.0 (5.0, 6.0) | 4.0 (3.3, 6.0) | 2.0 (1.0, 3.0) | ||||
| Preoperative laboratory values | |||||||
| PaCO2 (mmHg) | 36.7 (33.3, 39.7) | 34.6 (32.3, 36.8) | 34.6 (31.7, 36.8) | ||||
| PaO2 (mmHg) | 98.1 (76.4, 122.8) | 89.7 (81.9, 95.0) | 90.9 (80.9, 101.1) | 0.015 | 0.092 | 0.034 | |
| Lac (mmol/L) | 1.5 (1.0, 2.3) | 1.5 (1.1, 1.8) | 1.7 (1.4, 2.1) | 0.338 | 0.113 | 0.004 | |
| PT | 12.0 (11.5, 12.6) | 11.4 (10.9, 12.1) | 11.2 (10.8, 11.6) | ||||
| APTT | 30.3 (28.5, 32.3) | 31.4 (29.6, 33.8) | 31.0 (29.0, 33.2) | 0.001 | 0.069 | 0.004 | |
| D-dimer (ng/mL) | 2589.0 (978.5, 7919.0) | 180.0 (68.3, 670.8) | 92.5 (56.0, 157.0) | ||||
| FBG (g/L) | 2.3 (1.8, 2.9) | 2.9 (2.4, 3.4) | 3.1 (2.6, 3.6) | ||||
| FDPs (µg/mL) | 27.5 (10.9, 69.3) | 1.4 (0.5, 4.6) | 0.8 (0.5, 1.2) | ||||
1p, p value of ATAAD group vs AA group; 2p, p value of ATAAD group vs UA group; 3p, p value of one-way ANOVA among three groups; ATAAD, acute type A aortic dissection; AA, aortic aneurysm; UA, unstable angina; BMI, body mass index; PT, prothrombin time; APTT, activated partial thromboplastin time; HTN, hypertension; AKI, acute kidney injury; LD, liver dysfunction; HF, heart failure; CLD, chronic lung disease; CS, cardiac surgery; ND, neurological dysfunction; AC, altered consciousness; EuroSCORE, European System for Cardiac Operative Risk Evaluation; Lac, lactic acid; FBG, fibrinogen; FDPs, fibrinogen degradation products.
1p and 2p
The duration of the CPB procedure was significantly longer in the patients with
ATAAD (179 [158–206] min) than it was in the other two groups (p
| Variables | ATAAD | AA | UA | 1p | 2p | 3p | |
| (n = 150) | (n = 150) | (n = 150) | |||||
| Surgery-related variables | |||||||
| Surgical duration (h) | 8.0 (7.0, 9.0) | 7.1 (6.0, 9.0) | 4.5 (4.0, 5.0) | 0.001 | |||
| CPB time (min) | 179.0 (158.0, 206.0) | 147.5 (123.0, 172.8) | 0.0 (0.0, 0.0) | ||||
| DHCA time (min) | 20.0 (13.0, 30.0) | 0.0 (0.0, 0.0) | 0.0 (0.0, 0.0) | ||||
| ACC time (min) | 96.5 (86.0, 116.0) | 86.5 (66.3, 100.8) | 0.0 (0.0, 0.0) | ||||
| Heparin input (mL) | 10.0 (10.0, 10.0) | 10.0 (7.6, 10.0) | 0.0 (0.0, 0.0) | 0.005 | |||
| Plasma input (mL) | 0.0 (0.0, 400.0) | 0.0 (0.0, 400.0) | 0.0 (0.0, 0.0) | 0.658 | |||
| Postoperative laboratory values | |||||||
| HR | 89.0 (75.0, 98.0) | 84.0 (75.0, 89.8) | 79.0 (70.0, 86.0) | 0.032 | |||
| MAP (mm/Hg) | 92.8 (83.0, 102.9) | 80.0 (75.1, 86.7) | 83.5 (74.3, 91.0) | ||||
| ACT | 160.0 (147.0, 176.0) | 151.0 (141.3, 159.0) | 153.0 (144.3, 163.0) | 0.001 | |||
| PaCO2 (mm/Hg) 0 h | 46.5 (42.6, 50.1) | 43.5 (39.1, 46.1) | 39.5 (36.2, 42.4) | ||||
| PaCO2 (mm/Hg) 24 h | 39.4 (35.4, 42.7) | 39.8 (36.5, 42.9) | 39.3 (35.6, 41.4) | 0.565 | 0.214 | 0.169 | |
| PaO2 (mm/Hg) 0 h | 110.0 (85.5, 160.5) | 151.5 (104.5, 206.5) | 158.0 (120.5, 205.8) | ||||
| PaO2 (mm/Hg) 24 h | 93.2 (77.6, 115.8) | 118.0 (95.1, 149.8) | 127.0 (97.2, 153.0) | ||||
| Lac (mmol/L) 0 h | 2.4 (1.5, 3.5) | 1.8 (1.3, 2.6) | 1.2 (0.9, 1.5) | 0.001 | |||
| Lac (mmol/L) 24 h | 2.2 (1.6, 3.2) | 3.2 (1.9, 5.0) | 1.8 (1.2, 2.5) | ||||
| P/F 0 h (%) | 180.0 (134.1, 264.6) | 275.0 (178.3, 375.3) | 268.4 (203.7, 348.3) | ||||
| P/F 24 h (%) | 210.8 (151.4, 281.3) | 289.0 (230.2, 371.3) | 295.7 (242.0, 373.6) | ||||
| NE (×109/L) 24 h | 10.0 (7.8, 12.4) | 9.3 (7.0, 12.8) | 9.7 (8.0, 12.0) | 0.573 | 0.938 | 0.791 | |
| NE (×109/L) 48 h | 13.6 (10.9, 16.5) | 14.0 (10.2, 17.4) | 11.8 (9.1, 14.9) | 0.730 | 0.001 | 0.001 | |
| PT 0 h | 13.2 (12.4, 14.1) | 13.0 (12.3, 14.2) | 13.3 (12.5, 14.4) | 0.628 | 0.344 | 0.354 | |
| PT 24 h | 13.0 (12.1, 13.9) | 13.0 (12.3, 14.0) | 13.5 (12.9, 14.5) | 0.345 | |||
| APTT 0 h | 33.9 (31.0, 40.3) | 32.2 (29.2, 36.1) | 31.5 (29.7, 35.4) | 0.001 | 0.001 | 0.001 | |
| APTT 24 h | 30.4 (27.7, 33.9) | 30.8 (28.6, 34.5) | 31.0 (28.3, 34.1) | 0.143 | 0.144 | 0.239 | |
| D-dimer (ng/mL) 0 h | 2532.0 (1180.8, 4083.5) | 987.0 (420.5, 2798.8) | 186.0 (112.3, 339.0) | ||||
| D-dimer (ng/mL) 24 h | 2294.5 (1173.0, 3390.8) | 917.5 (469.0, 2651.5) | 234.0 (156.3, 416.0) | ||||
| FBG (g/L) 0 h | 2.5 (2.0, 3.3) | 2.3 (1.9, 2.9) | 2.4 (1.8, 3.1) | 0.043 | 0.091 | 0.091 | |
| FBG (g/L) 24 h | 3.7 (3.0, 4.5) | 2.7 (2.3, 3.3) | 3.1 (2.6, 3.7) | ||||
| FDPs (µg/mL) 0 h | 20.5 (10.3, 38.1) | 7.9 (3.0, 21.2) | 1.4 (0.9, 2.3) | ||||
| FDPs (µg/mL) 24 h | 22.1 (11.8, 35.3) | 8.9 (4.6, 21.9) | 1.9 (1.2, 3.3) | ||||
| VIS 24 h | 6.0 (3.0, 12.8) | 5.0 (2.0, 11.0) | 7.0 (4.0, 12.0) | 0.050 | 0.909 | 0.070 | |
| VIS 48 h | 3.0 (0.0, 8.7) | 0.0 (0.0, 7.0) | 5.0 (0.0, 10.0) | 0.001 | 0.815 | 0.001 | |
| SOFA 24 h | 10.0 (7.0, 13.0) | 6.0 (5.0, 8.0) | 5.0 (4.0, 7.0) | ||||
| SOFA48 h | 8.0 (5.0, 12.8) | 5.0 (3.0, 6.0) | 4.0 (3.0, 5.0) | ||||
| ARDS (%) | 31 (20.7) | 20 (13.3) | 11 (7.3) | 0.124 | 0.002 | 0.004 | |
| ICU duration (h) | 68.5 (40.0, 151.8) | 42.0 (19.0, 69.0) | 25.5 (19.0, 48.0) | ||||
1p, p value of ATAAD group vs AA group; 2p, p value of ATAAD group vs UA group; 3p, p value of one-way ANOVA among three groups; CPB, cardiopulmonary bypass; DHCA, deep hypothermic circulatory arrest; ACC, aortic cross-clamp; HR, heart rate at admission in intensive care unit (ICU); MAP, mean arterial pressure at admission in ICU; ACT, activated clotting time at admission in ICU; Lac, lactic acid; P/F, PaO2/FiO2, oxygenation index; NE, neutrophil count; VIS, vasoactive inotrope score; SOFA, Sequential Organ Failure Assessment; 0 h, Patients at admission in ICU after surgery; 24 h, Patients in ICU at 24 h after surgery.
1p and 2p
The levels of coagulation factors in the patients with ARDS from the ATAAD group are shown in Tables 3,4. Preoperative D-dimer levels were similar between the non-ARDS and ARDS groups (2403.0 [942.0–7524.5] vs 5302 [1184.0–9419.0] ng/mL, p = 0.134). The concentration of the FDPs also tended to rise in the ARDS group before surgery (22.7 [10.2–65.9] vs 49.3 [12.5–80.8] µg/mL, p = 0.098). At the end of surgery, D-dimer levels in the ARDS group were significantly higher than those in the non-ARDS group (3326 [2270.0–5989.0] vs 2281.0 [1135.0–3787.5] ng/mL, p = 0.017). Twenty-four hours after surgery, there was no significant difference between the groups, although the D-dimer levels were significantly elevated in the ARDS group 48 hours after surgery (2017 [935.0–2955.0] vs. 935.0 [869.5–2617.0] ng/mL, p = 0.046). The trend of FDPs levels was consistent with that of the D-dimer levels. In-hospital mortality was significantly higher postoperatively in the patients with ARDS (25.8% vs. 4.2%, p = 0.001).
| Variables | Non-ARDS | ARDS | p | |
| (n = 119) | (n = 31) | |||
| Demographic information and preoperative complications | ||||
| Age (yrs) | 48.5 |
51.6 |
0.179 | |
| Sex (male%) | 87 (73.1) | 27 (87.1) | 0.165 | |
| BMI (kg/m2) | 27.1 |
27.6 |
0.526 | |
| Smoking | 51 (42.9) | 14 (45.2) | 0.978 | |
| Alcohol | 14 (11.8) | 5 (16.1) | 0.728 | |
| HTN | 101 (84.9) | 25 (80.6) | 0.766 | |
| Diabetes | 10 (8.4) | 3 (9.7) | 1 | |
| AKI | 22 (18.5) | 1 (3.2) | 0.069 | |
| LD | 10 (8.4) | 1 (3.2) | 0.550 | |
| HF | 37 (31.1) | 12 (38.7) | 0.555 | |
| CLD | 3 (2.5) | 1 (3.2) | 1 | |
| ND | 1 (0.8) | 0 (0.0) | 1 | |
| Prior CS | 1 (0.8) | 1 (3.2) | 0.879 | |
| Shock | 5 (4.2) | 2 (6.5) | 0.959 | |
| AC | 12 (10.1) | 3 (9.7) | 1 | |
| EuroSCORE | 5.0 (5.0, 6.5) | 5.0 (5.0, 6.0) | 0.622 | |
| Preoperative laboratory values | ||||
| PaCO2 | 36.7 (33.3, 39.6) | 35.6 (33.4, 39.4) | 0.492 | |
| PaO2 | 100.0 (80.7, 123.5) | 92.6 (69.8, 111.0) | 0.138 | |
| Lac | 1.4 (1.0, 2.2) | 1.9 (1.2, 3.0) | 0.094 | |
| PT | 12.0 (11.5, 12.6) | 11.9 (11.3, 12.7) | 0.922 | |
| APTT | 30.2 (28.6, 32.2) | 31.1 (26.9, 32.4) | 0.873 | |
| D-dimer | 2403.0 (942.0, 7524.5) | 5302.0 (1184.0, 9419.0) | 0.134 | |
| FBG | 2.3 (1.8, 3.0) | 2.0 (1.7, 2.5) | 0.100 | |
| FDPs | 22.7 (10.2, 65.9) | 49.3 (12.5, 80.8) | 0.098 | |
p
| Variables | Non-ARDS | ARDS | p | |
| (n = 119) | (n = 31) | |||
| Surgery-related variables | ||||
| Surgical duration (h) | 8.0 (7.0, 9.0) | 8.0 (7.5, 9.3) | 0.086 | |
| CPB time (min) | 176.0 (158.0, 202.0) | 192.0 (162.0, 222.5) | 0.078 | |
| DHCA time (min) | 19.0 (12.5, 29.0) | 24.0 (15.0, 36.5) | 0.055 | |
| ACC time (min) | 94.0 (84.5, 112.5) | 113.0 (93.5, 122.5) | 0.019 | |
| Heparin input (mL) | 10.0 (10.0, 10.0) | 10.0 (10.0, 11.0) | 0.431 | |
| Plasma input (mL) | 0.0 (0.0, 400.0) | 0.0 (0.0, 0.0) | 0.184 | |
| Postoperative laboratory values | ||||
| HR | 88.0 (75.0, 98.0) | 90.0 (79.5, 103.5) | 0.342 | |
| MAP (mm/Hg) | 94.0 (83.4, 103.8) | 90.5 (78.3, 100.3) | 0.256 | |
| ACT | 161.0 (147.0, 178.0) | 160.0 (149.0, 173.0) | 0.705 | |
| PaCO2 0 h | 46.5 (42.7, 50.0) | 47.3 (42.4, 53.1) | 0.462 | |
| PaCO2 24 h | 39.4 (35.5, 43.3) | 39.4 (34.8, 42.2) | 0.279 | |
| PaO2 0 h | 110.0 (85.6, 161.5) | 109.0 (86.6, 141.0) | 0.876 | |
| PaO2 24 h | 94.5 (78.6, 117.5) | 90.6 (72.3, 110.5) | 0.393 | |
| Lac 0 h | 2.3 (1.5, 3.3) | 2.6 (1.8, 4.0) | 0.224 | |
| Lac 24 h | 2.2 (1.5, 3.2) | 2.2 (1.9, 3.2) | 0.202 | |
| P/F 0 h | 182.8 (131.1, 273.4) | 162.3 (137.3, 235.4) | 0.598 | |
| P/F 24 h | 213.8 (158.6, 298.8) | 188.3 (122.4, 265.0) | 0.154 | |
| P/F 48 h | 275.7 (193.3, 333.4) | 187.3 (129.7, 218.2) | ||
| NE 24 h | 10.2 (7.8, 12.4) | 9.5 (7.3, 12.3) | 0.590 | |
| NE 48 h | 13.9 (11.2, 16.5) | 12.3 (10.7, 16.4) | 0.415 | |
| PT 0 h | 13.2 (12.4, 14.0) | 13.3 (12.6, 14.8) | 0.288 | |
| PT 24 h | 13.0 (12.2, 14.0) | 13.1 (12.2, 13.7) | 0.688 | |
| PT 48 h | 12.3 (11.6, 13.0) | 12.5 (11.7, 13.5) | 0.328 | |
| APTT 0 h | 33.9 (31.0, 40.1) | 33.6 (31.9, 40.3) | 0.897 | |
| APTT 24 h | 30.4 (27.3, 33.7) | 30.7 (28.1, 35.7) | 0.426 | |
| APTT 48 h | 31.0 (27.8, 31.4) | 31.0 (27.4, 33.7) | 0.825 | |
| D-dimer 0 h | 2281.0 (1135.0, 3787.5) | 3326.0 (2270.0, 5989.0) | 0.017 | |
| D-dimer 24 h | 2222.0 (1095.0, 3358.5) | 2823.0 (1881.5, 3558.5) | 0.213 | |
| D-dimer 48 h | 935.0 (869.5, 2617.0) | 2017.0 (935.0, 2955.0) | 0.046 | |
| FBG 0 h | 2.7 (2.1, 3.6) | 2.3 (1.6, 2.9) | 0.013 | |
| FBG 24 h | 3.7 (2.9, 4.5) | 3.7 (3.3, 4.5) | 0.809 | |
| FBG 48 h | 4.2 (3.8, 4.6) | 4.2 (3.3, 4.9) | 0.696 | |
| FDPs 0 h | 16.3 (9.7, 33.3) | 33.5 (17.4, 57.9) | 0.008 | |
| FDPs 24 h | 20.8 (11.3, 33.8) | 29.6 (17.8, 37.2) | 0.128 | |
| FDPs 48 h | 8.9 (8.5, 23.6) | 15.4 (8.8, 28.1) | 0.037 | |
| VIS 24 h | 6.0 (3.0, 11.0) | 10.0 (3.5, 20.0) | 0.157 | |
| VIS 48 h | 3.0 (0.0, 8.0) | 5.0 (3.0, 11.0) | 0.054 | |
| SOFA 24 h | 10.0 (7.0, 13.0) | 11.0 (8.5, 15.0) | 0.069 | |
| SOFA 48 h | 7.0 (5.0, 11.0) | 10.0 (8.0, 14.5) | 0.001 | |
| MV duration (h) | 19.0 (12.0, 61.0) | 39.0 (20.0, 108.5) | 0.014 | |
| ICU duration (h) | 65.0 (37.0, 138.0) | 106.0 (64.5, 201.0) | 0.027 | |
| In-hospital mortality (%) | 5 (4.2) | 8 (25.8) | 0.001 | |
MV, Mechanical ventilation; 0 h, Patients at admission in ICU after surgery; 24 h, Patients in ICU at 24 h after surgery; 48 h, Patients in ICU at 48 h after surgery.
p
After all coagulation biomarkers were normalized and standardized using log- and z-score transformations, the results indicated that the levels of FDPs at the end of surgery (OR: 2.26, 95% CI: 1.13–4.54; p = 0.022) was the independent risk factor for the development of ARDS among the patients with ATAAD (Table 5).
| Variables | ATAAD | AA | UA | |||||||||
| Model 1 | Model 2 | Model 1 | Model 2 | Model 1 | Model 2 | |||||||
| OR (95% CI) | p | OR (95% CI) | p | OR (95% CI) | p | OR (95% CI) | p | OR (95% CI) | p | OR (95% CI) | p | |
| z-pre-PT | 0.93 (0.58, 1.49) | 0.756 | 0.87 (0.45, 1.65) | 0.661 | 1.07 (0.77, 1.49) | 0.698 | 1.42 (0.88, 2.28) | 0.151 | 0.38 (0.10, 1.39) | 0.143 | 0.39 (0.08, 2.00) | 0.261 |
| z-pre-APTT | 1.02 (0.70, 1.50) | 0.900 | 1.02 (0.66, 1.57) | 0.942 | 0.81 (0.39, 1.70) | 0.577 | 1.41 (0.55, 3.61) | 0.474 | 0.85 (0.43, 1.68) | 0.638 | 0.76 (0.21, 2.72) | 0.668 |
| z-pre-D-dimer | 1.51 (0.89, 2.59) | 0.130 | 1.39 (0.72, 2.69) | 0.328 | 1.21 (0.67, 2.16) | 0.525 | 1.19 (0.61, 2.33) | 0.608 | 1.63 (0.52, 5.17) | 0.403 | 3.81 (0.56, 25.8) | 0.170 |
| z-pre-FBG | 0.75 (0.51, 1.09) | 0.130 | 0.76 (0.48, 1.20) | 0.237 | 0.96 (0.60, 1.54) | 0.863 | 0.85 (0.46, 1.56) | 0.594 | 1.67 (0.55, 5.05) | 0.364 | 5.04 (0.69, 36.5) | 0.110 |
| z-pre-FDPs | 1.54 (0.95, 2.51) | 0.083 | 1.41 (0.78, 2.55) | 0.252 | 1.16 (0.60, 2.23) | 0.659 | 0.97 (0.44, 2.16) | 0.943 | 1.67 (0.41, 6.75) | 0.472 | 18.8 (1.08, 32.8) | 0.044 |
| z-PT 0 h | 1.05 (0.75, 1.47) | 0.782 | 1.09 (0.76, 1.57) | 0.642 | 1.84 (0.82, 4.14) | 0.139 | 2.38 (0.89, 6.36) | 0.085 | 0.84 (0.34, 2.06) | 0.705 | 1.31 (0.36, 4.85) | 0.684 |
| z-PT 24 h | 1.08 (0.72, 1.47) | 0.719 | 1.42 (0.87, 2.31) | 0.161 | 1.13 (0.68, 1.87) | 0.636 | 1.33 (0.70, 2.50) | 0.384 | 0.87 (0.47, 1.62) | 0.670 | 0.82 (0.36, 1.86) | 0.629 |
| z-PT 48 h | 1.25 (0.86, 1.81) | 0.236 | 1.35 (0.87, 2.09) | 0.175 | / | / | / | / | ||||
| z-APTT 0 h | 1.02 (0.63, 1.65) | 0.951 | 1.07 (0.61, 1.87) | 0.820 | 1.15 (0.71, 1.87) | 0.558 | 1.04 (0.58, 1.88) | 0.893 | 1.28 (0.59, 2.78) | 0.540 | 0.97 (0.37, 2.55) | 0.958 |
| z-APTT 24 h | 1.36 (0.84, 2.21) | 0.210 | 1.41 (0.78, 2.54) | 0.257 | 0.77 (0.33, 1.81) | 0.551 | 0.49 (0.19, 1.23) | 0.129 | 1.16 (0.73, 1.82) | 0.530 | 0.99 (0.45, 2.17) | 0.980 |
| z-APTT 48 h | 1.00 (0.67, 1.48) | 0.991 | 1.02 (0.66, 1.57) | 0.933 | / | / | / | / | ||||
| z-D-dimer 0 h | 1.95 (1.06, 3.59) | 0.032 | 2.03 (0.96, 4.28) | 0.063 | 2.04 (1.11, 3.50) | 0.008 | 1.63 (0.89, 2.98) | 0.111 | 1.62 (0.59, 4.43) | 0.346 | 2.82 (0.53, 15.2) | 0.230 |
| z-D-dimer 24 h | 1.26 (0.68, 2.33) | 0.455 | 1.24 (0.63, 2.47) | 0.533 | 1.73 (0.99, 3.01) | 0.053 | 1.41 (0.72, 2.74) | 0.319 | 1.59 (0.63, 4.02) | 0.362 | 1.95 (0.65, 5.88) | 0.234 |
| z-D-dimer 48 h | 1.57 (1.06, 2.32) | 0.026 | 1.55 (0.97, 2.47) | 0.066 | / | / | / | / | ||||
| z-FBG 0 h | 0.43 (0.23, 0.81) | 0.008 | 0.40 (0.19, 0.83) | 0.014 | 0.58 (0.26, 1.32) | 0.196 | 0.46 (0.17, 1.22) | 0.117 | 1.05 (0.74, 1.50) | 0.768 | 1.10 (0.50, 2.44) | 0.814 |
| z-FBG 24 h | 1.02 (0.63, 1.65) | 0.934 | 0.99 (0.59, 1.68) | 0.978 | 0.64 (0.33, 1.23) | 0.181 | 0.60 (0.28, 1.29) | 0.189 | 1.18 (0.67, 2.09) | 0.559 | 0.99 (0.46, 2.11) | 0.979 |
| z-FBG 48 h | 0.88 (0.60, 1.30) | 0.521 | 0.85 (0.51, 1.39) | 0.510 | / | / | / | / | ||||
| z-FDPs 0 h | 2.05 (1.17, 3.60) | 0.012 | 2.26 (1.13, 4.54) | 0.022 | 1.92 (1.19, 3.09) | 0.008 | 1.60 (0.91, 2.81) | 0.105 | 1.12 (0.27, 4.65) | 0.875 | 1.83 (0.22, 15.3) | 0.575 |
| z-FDPs 24 h | 1.45 (0.78, 2.69) | 0.235 | 1.42 (0.70, 2.84) | 0.329 | 1.56 (0.96, 2.55) | 0.075 | 1.40 (0.74, 2.65) | 0.302 | 1.79 (0.61, 5.25) | 0.287 | 2.37 (0.52, 10.8) | 0.265 |
| z-FDPs 48 h | 1.50 (1.02, 2.21) | 0.040 | 1.51 (0.95, 2.40) | 0.080 | / | / | / | / | ||||
z: All biomarkers were normalized and standardized by log transformation and z-score transformation.
Model 1: Univariate logistic regression.
Model 2: Multivariate logistic regression. Adjusted covariates: age, sex, BMI, Hypertension, Diabetes, AKI, LD, CLD, ND, HF, Smoking, Alcohol, Prior CS, preoperative AST, preoperative oxygenation index. These covariates that showed significant differences between the ARDS group and Non-ARDS group in the baseline characteristics (Supplementary Table 1). Pre, preoperative.
p
The effects of the different groups and phases on the concentrations of FXII,
FXIIa, FVIII-Ag, and PAP are presented in Fig. 1. Preoperatively (immediately
prior to anesthesia induction), compared with those in the other two groups,
patients with ATAAD presented with significantly higher levels of FXIIa
(p = 0.014 and p
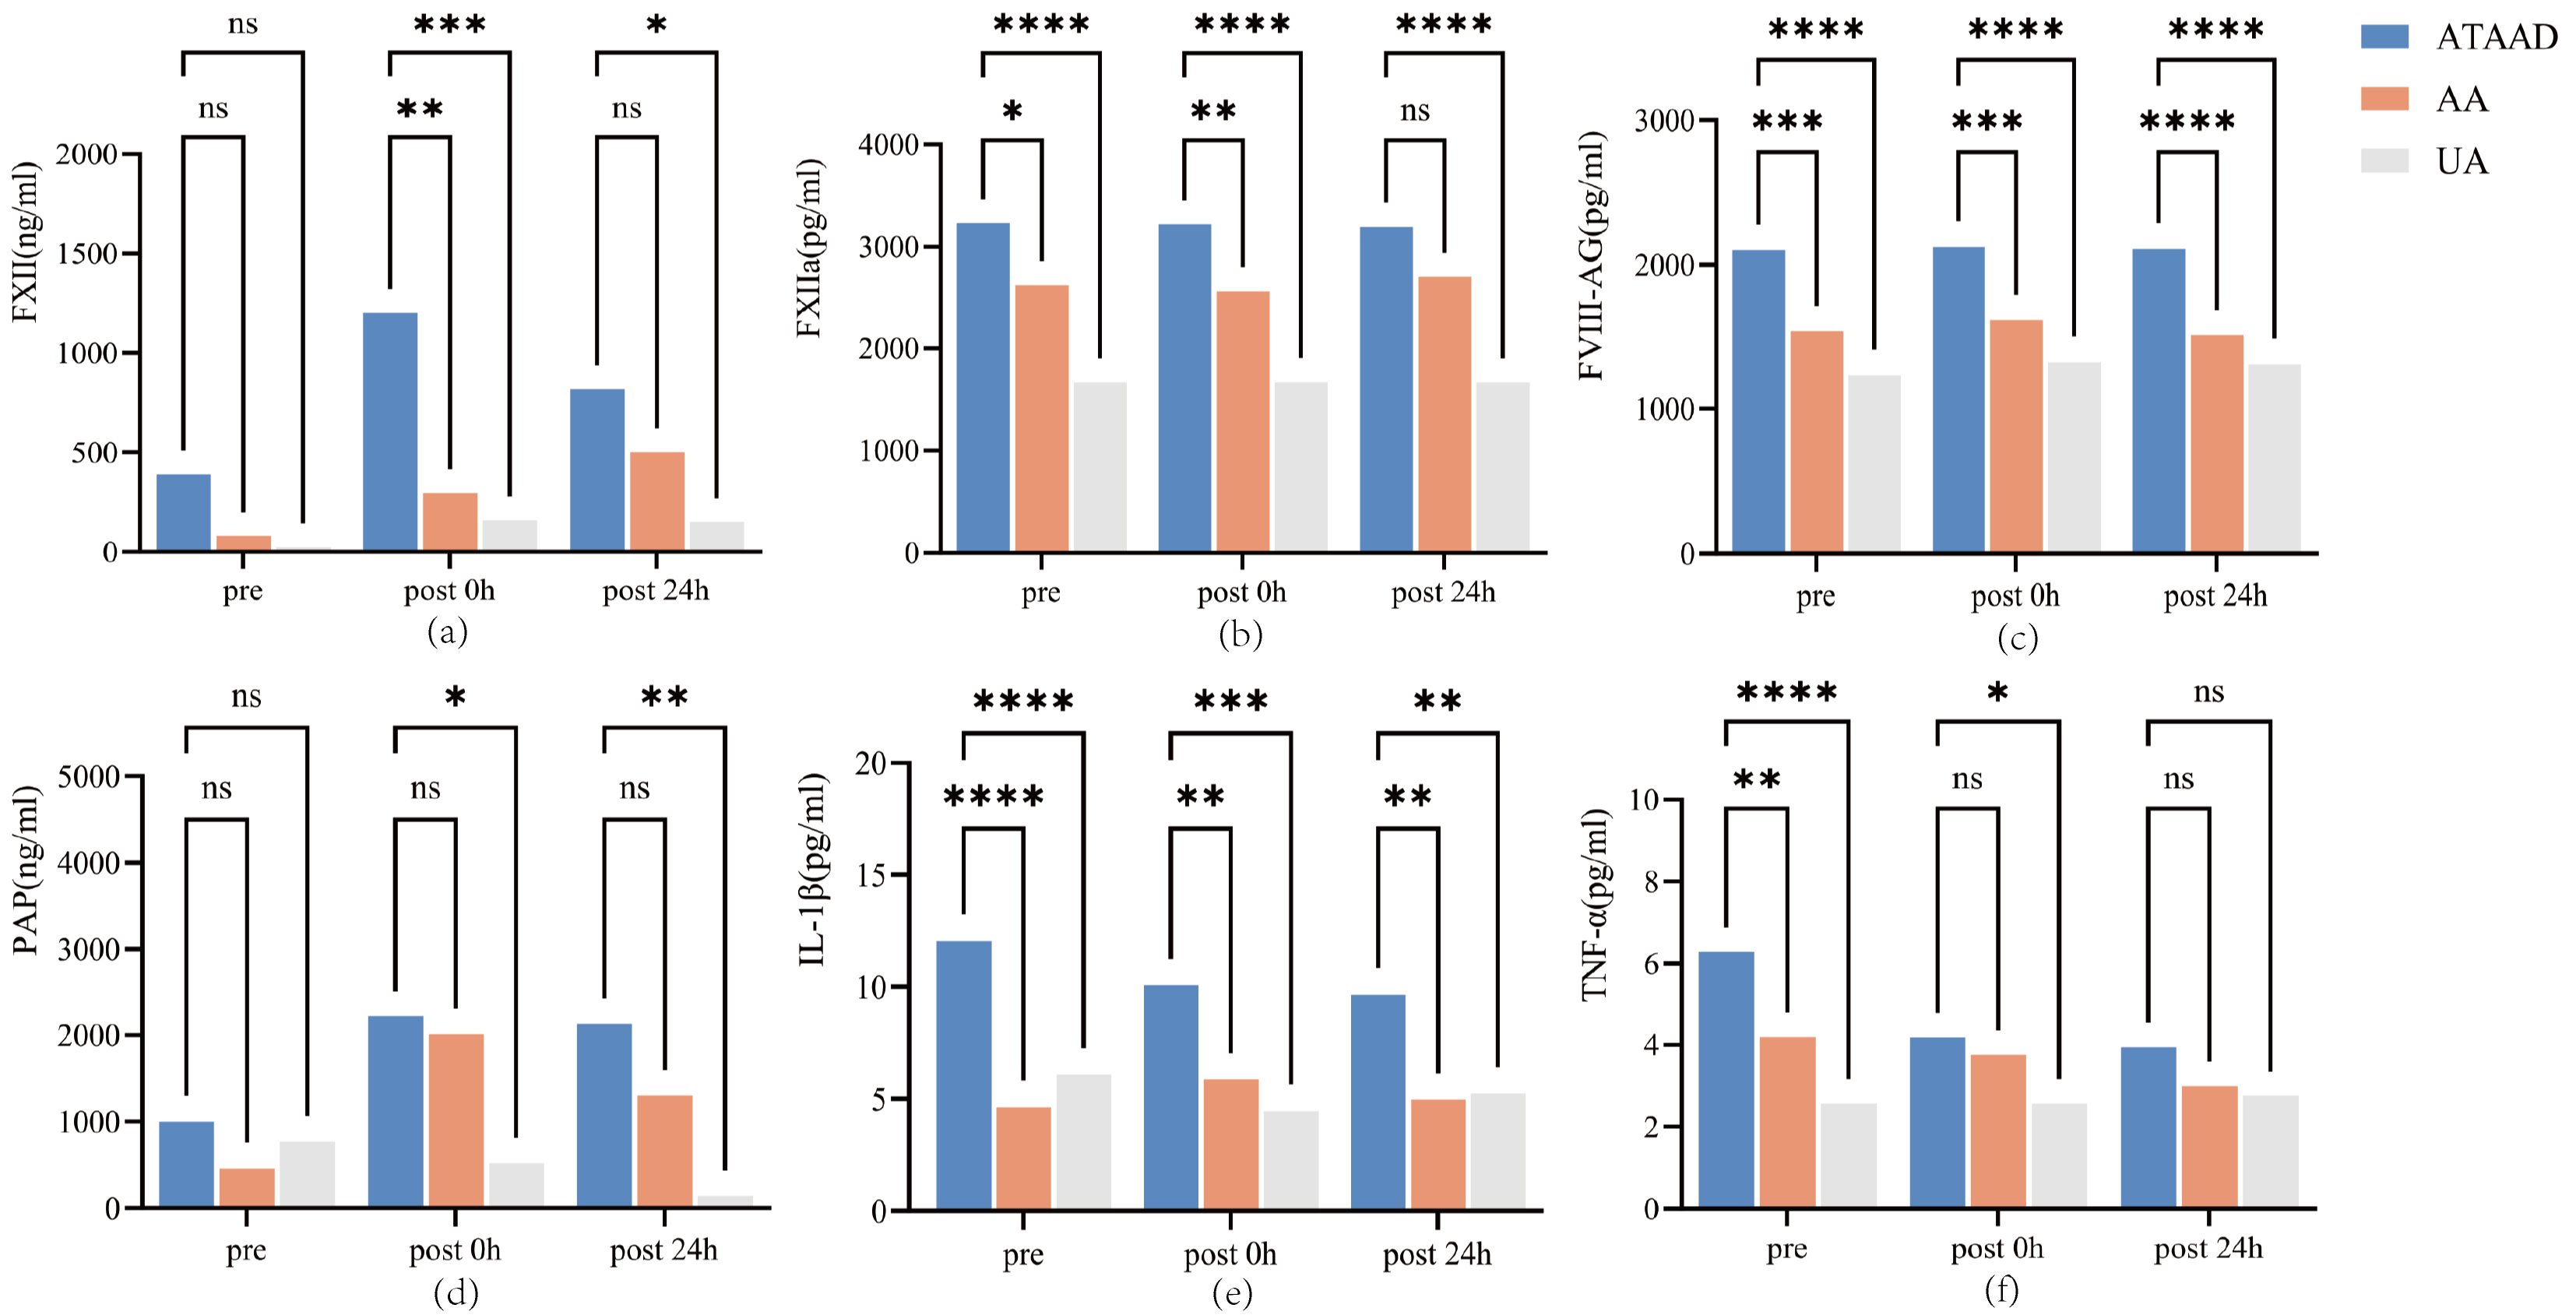 Fig. 1.
The serum concentration of coagulation and inflammation
biomarkers among three groups. (a) FXII levels: Intergroup comparisons across time points; (b) FXIIa levels: Intergroup comparisons across time points; (c) FVIII-Ag levels: Intergroup
comparisons across time points; (d) PAP levels: Intergroup comparisons across
time points; (e) IL-1
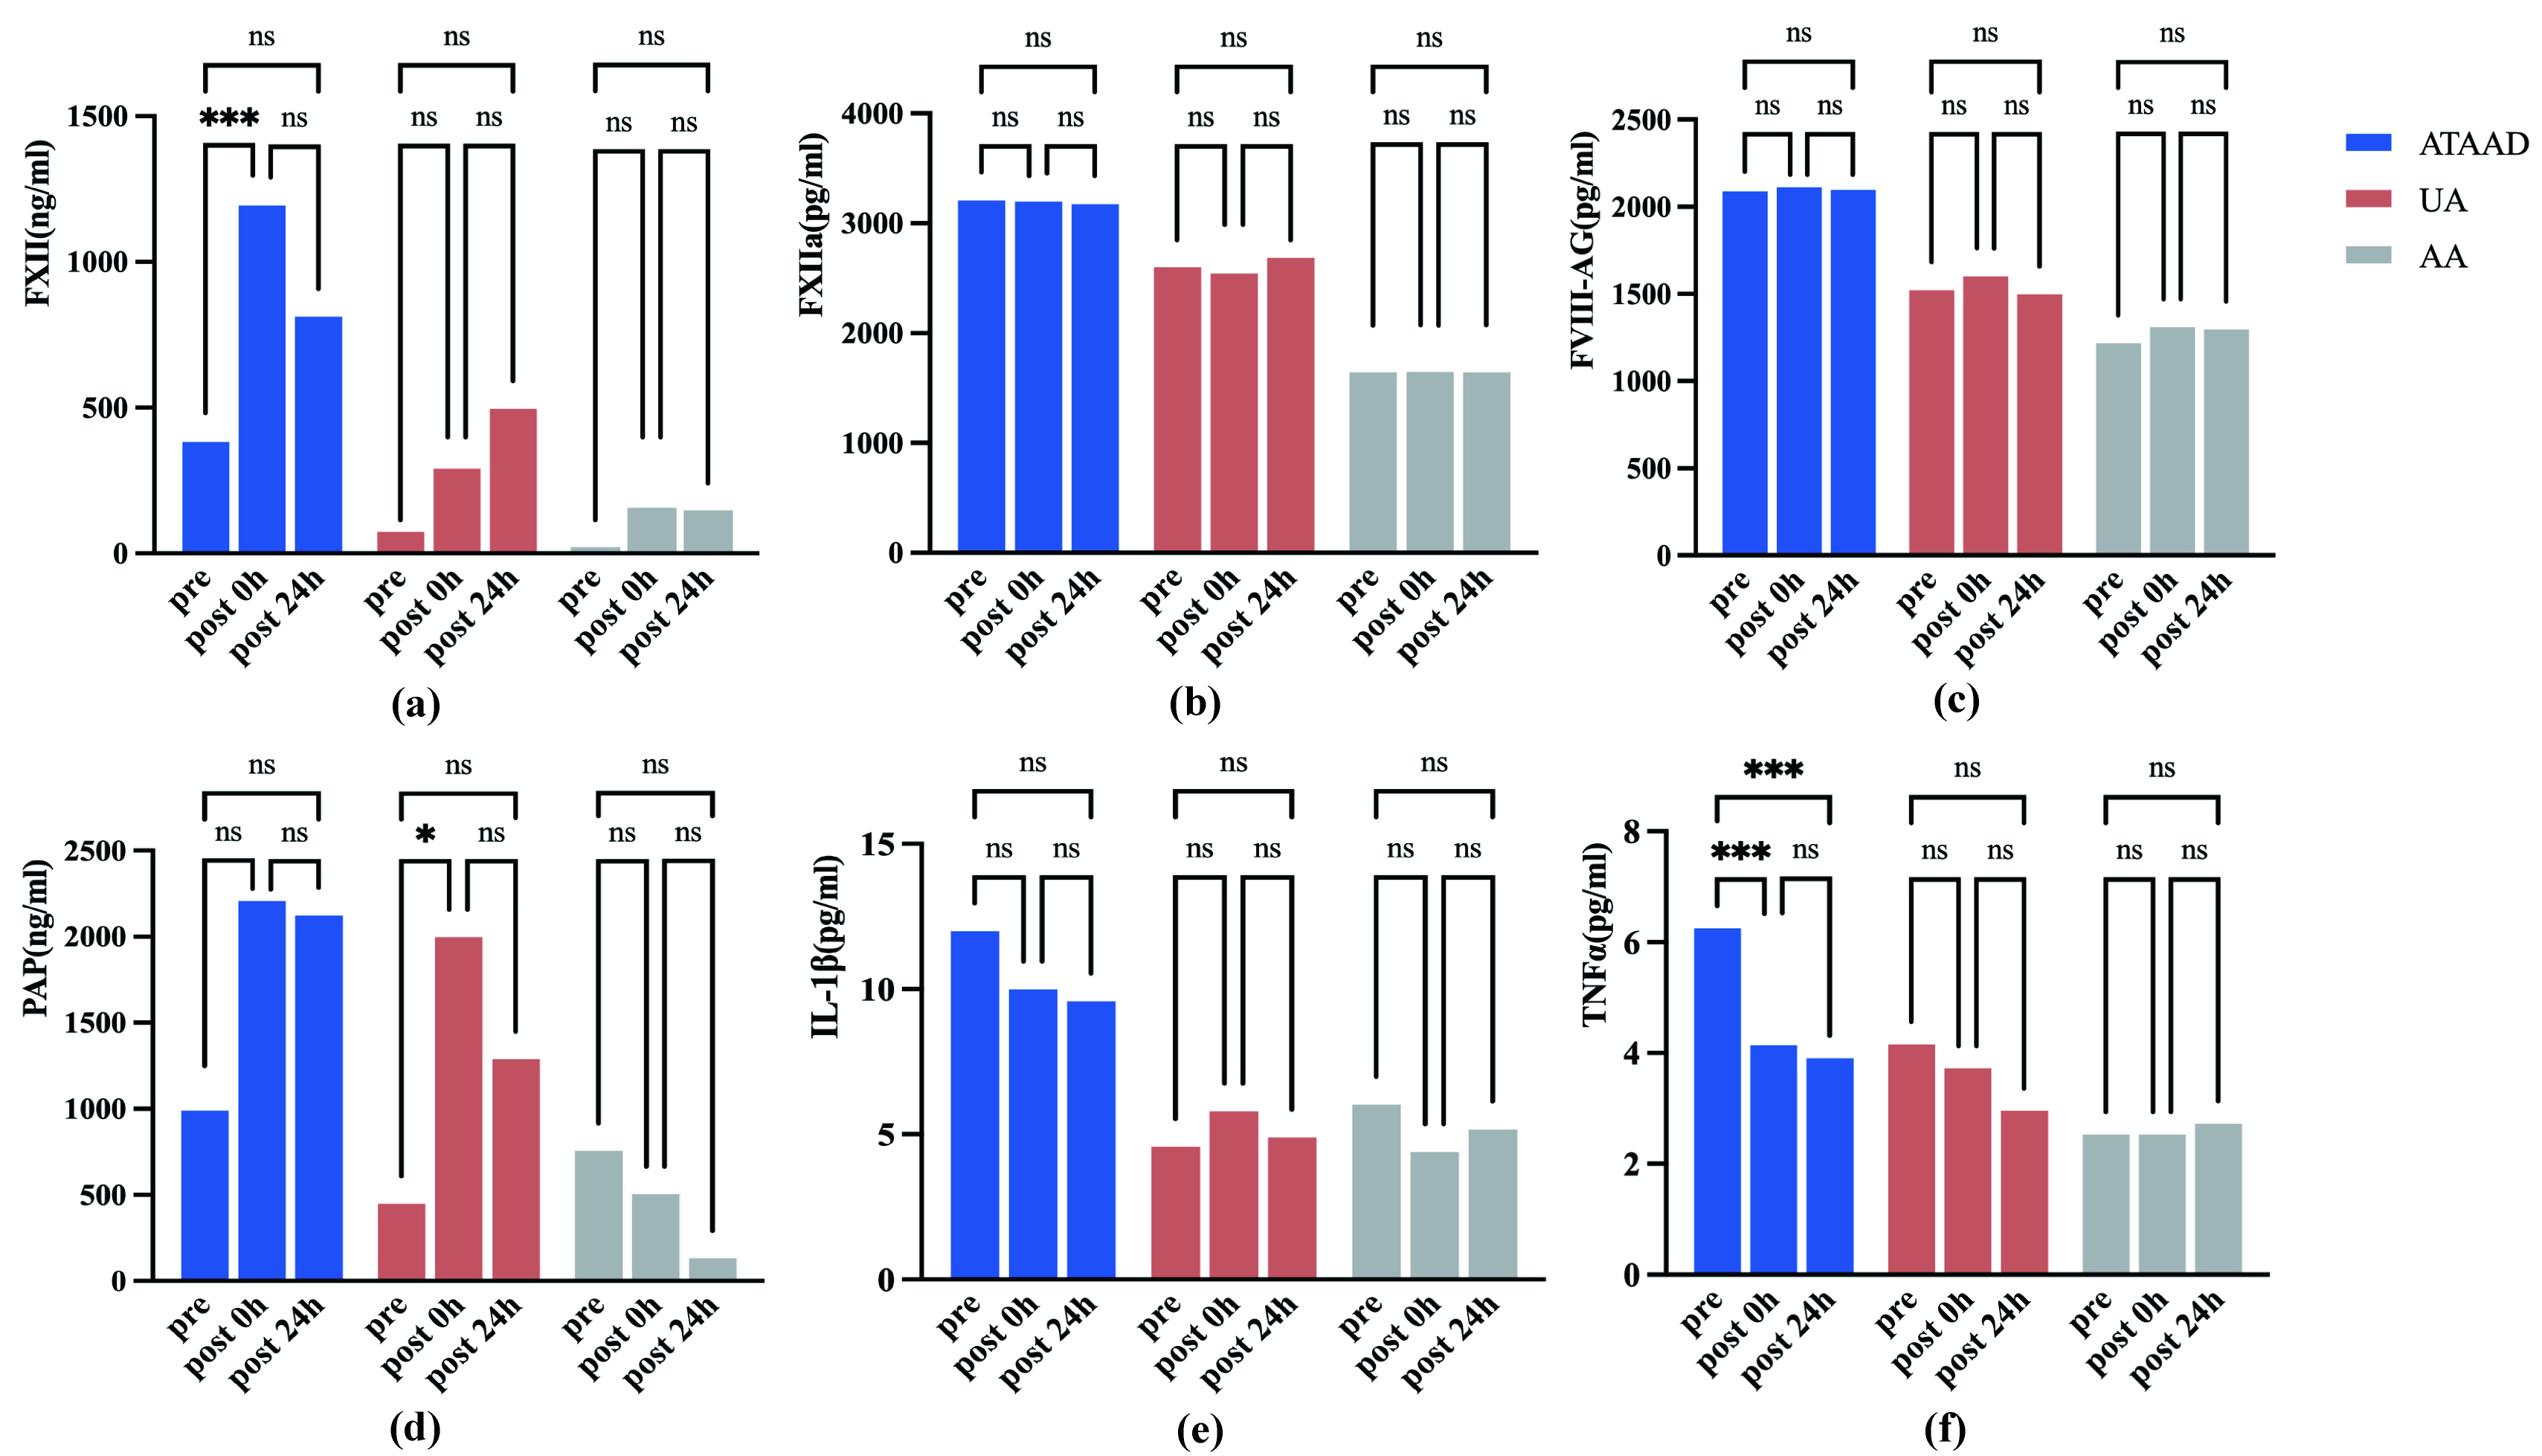
After conducting statistical analysis on the same indicators of the same group
at different time points, it was found that the FXII level at 0 h after was
significantly higher than that immediately prior to anesthesia induction
(p
 Fig. 2.
The serum concentration of coagulation and inflammation
biomarkers at different time points for the three groups. (a) FXII levels: Intragroup temporal variations; (b) FXIIa levels: Intragroup
temporal variations; (c) FVIII-Ag levels: Intragroup temporal variations; (d) PAP
levels: Intragroup temporal variations; (e) IL-1
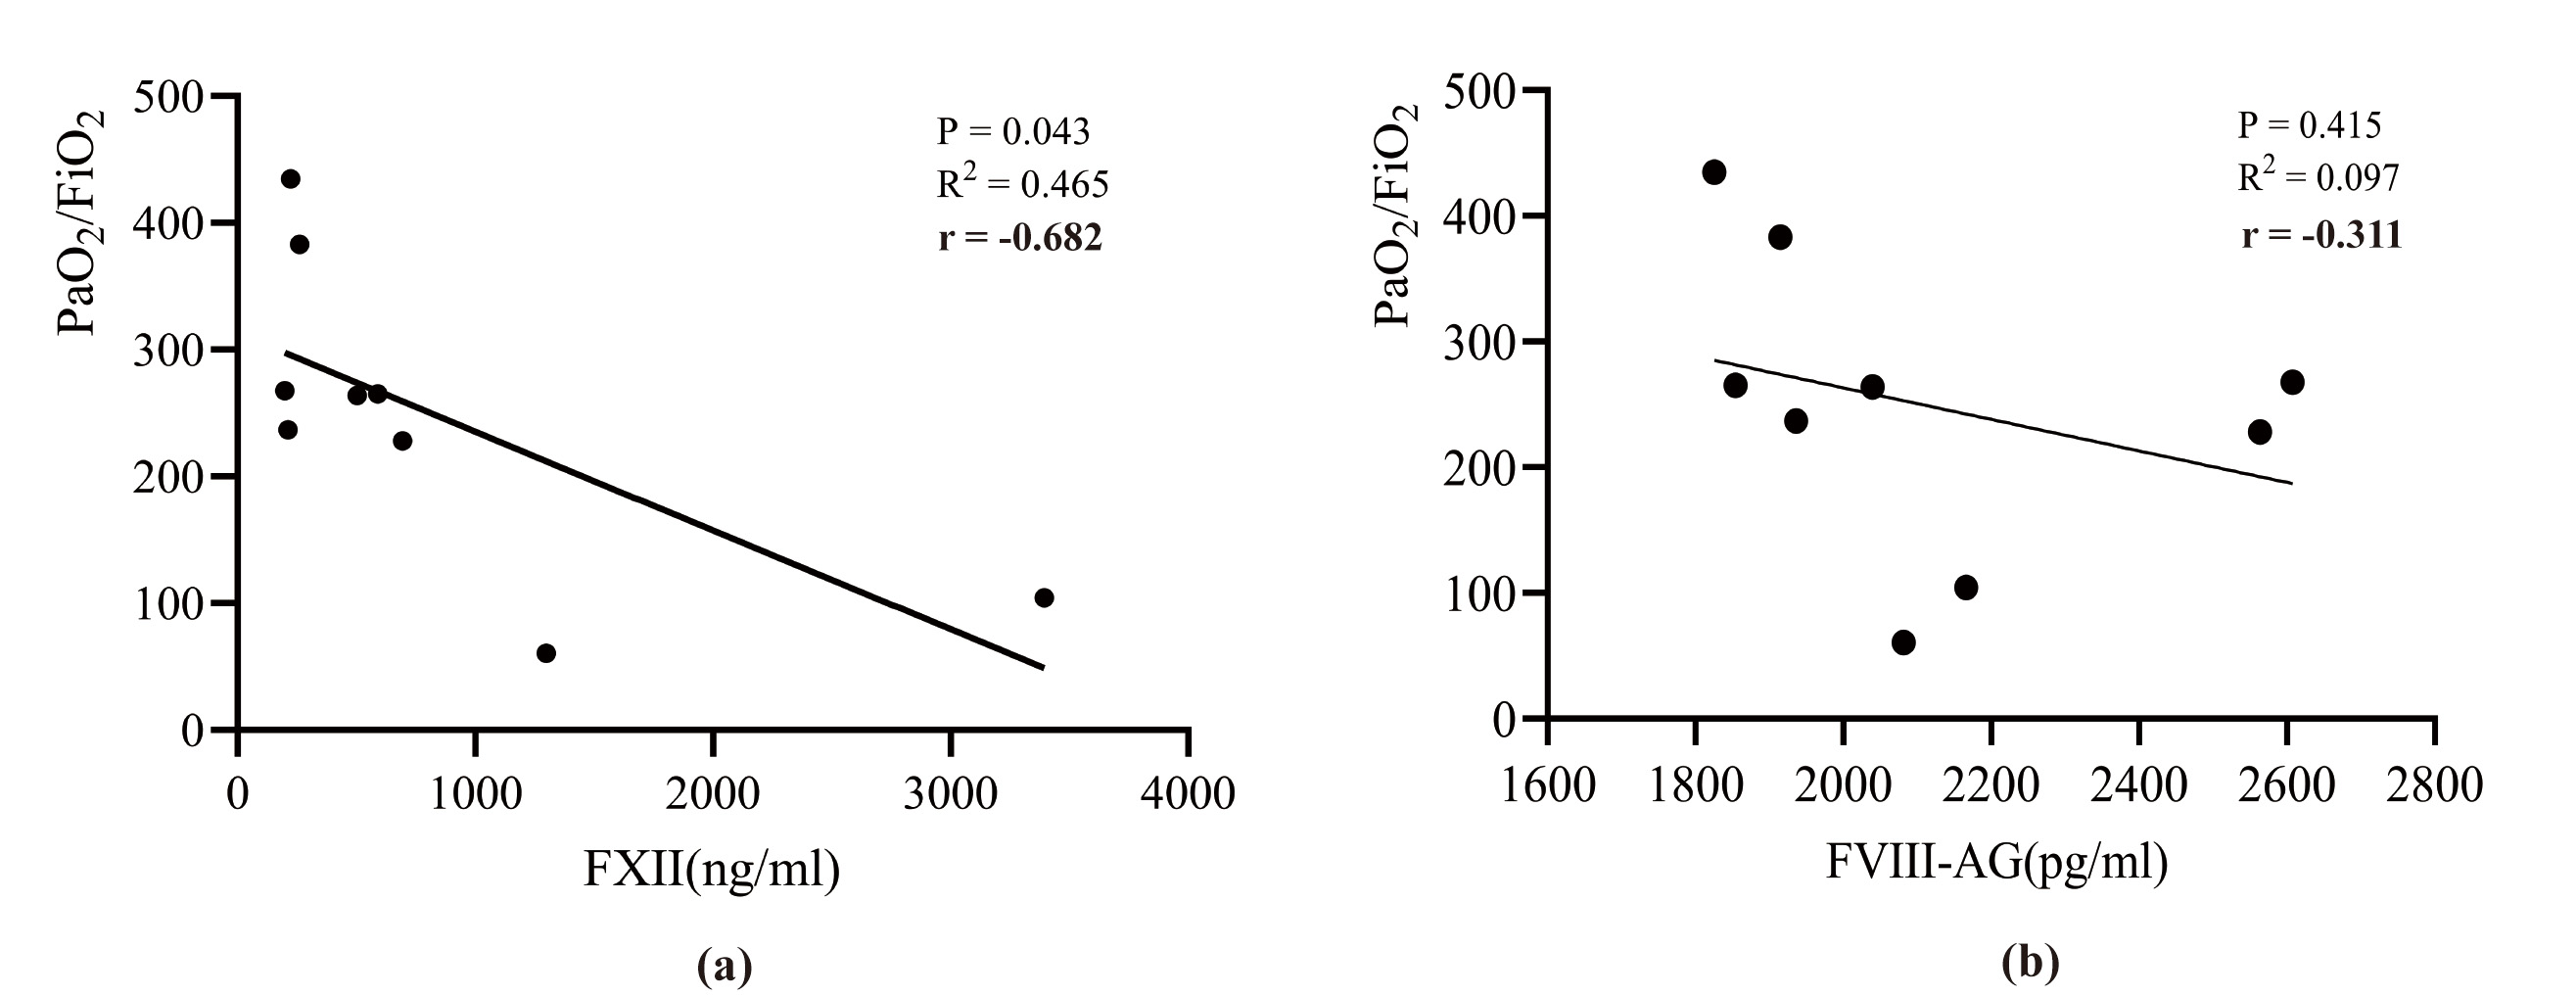
There was a negative correlation between FXII levels and the oxygenation index 24 h post-surgery (Pearson correlation coefficient r = –0.682, p = 0.043), whereas no significant correlations were observed for the other markers or at other time points (Fig. 3). However, a trend was observed in which the oxygenation index decreased as FVIII-Ag levels increased, suggesting that FVIII-Ag may affect lung function.
 Fig. 3.
The correlation between coagulation factors and oxygenation index in patients with ATAAD. (a) Association of FXII concentration with PaO2/FiO2; (b) Association of FVIII-Ag concentration with PaO2/FiO2. PaO2/FiO2, oxygenation index; FXII, factor XII; FVIII-Ag, factor VIII-related antigen.
The aim of this study was to investigate if coagulation activity could be induced by ATAAD onset or CPB, and to determine the impact of coagulation activity on the development of post-operative ARDS. The results revealed significantly elevated serum concentrations of perioperative coagulation biomarkers in patients with ATAAD who had undergone surgery involving CPB. Meanwhile, the results indicate that the elevation of coagulation biomarkers is a risk factor for the occurrence of ARDS.
The present study, which used a control group of patients with AA, verified that ATAAD itself can significantly increase the activation of the coagulation system. ATAAD is caused by injury to the aortic intima, where blood gains access to the false lumen formed between the intima and media. The activation of the coagulation system could be induced by contact between blood and the false lumen and the release of coagulant material from the aortic wall into the systemic circulation [26, 27].
Previous studies [28, 29] have demonstrated that ATAAD and the surgical interventions to treat it can cause an increase in the levels of biomarkers that induce the activation of coagulation. The preoperative levels of FDPs and D-dimer become sharply elevated in patients with ATAAD [27, 30]. An increased D-dimer level reflects both the augmented formation of fibrin as well as the degree of subsequent fibrinolysis, and it has been shown to be associated with postoperative adverse events in patients with ATAAD [31, 32]. However, a small number of studies [33, 34] have compared the perioperative coagulation function of patients with ATAAD undergoing emergency surgery and that of patients with AA undergoing elective aortic surgery.
In the present study, intergroup comparisons were performed between patients with ATAAD and those with AA or UA; the results showed that the preoperative (immediately prior to anesthesia induction) levels of FXIIa and FVIII-Ag were significantly higher in the ATAAD group than in the other two groups, whereas the preoperative fibrinogen level was significantly lower, indicating that patients with ATAAD consumed more fibrinogen before surgery. Although patients experiencing chronic aneurysms also presented with higher D-dimer levels, the upregulation was more pronounced in patients with ATAAD. However, whether there is a causal relationship between ATAAD itself and ARDS still requires further research to verify.
In this study, the levels of FXII, FXIIa, FVIII-Ag, D-dimer, and FDPs were elevated in patients with ATAAD and AA, and the elevation was more pronounced in the former group. Meanwhile, the CPB duration was significantly prolonged in ATAAD group. We hypothesize that the coagulation disorder after CPB is related to the activation of the “contact system”.
The “contact system” is a plasma protease cascade that plays an important role in the activation of the coagulation systems; it includes FXII, FXIIa, factor XI (FXI), high-molecular-weight kininogen (HMWK), and prekallikrein, which are associated proteins in the plasma [17]. Contact system activity increases dramatically as blood comes into contact with the artificial materials comprising CPB circuits [35]. Mechanistically, FXII cleaves itself upon contact with various anionic surfaces, resulting in the production of FXIIa, which subsequently converts prekallikrein into active kallikrein. In the plasma, kallikrein generates a positive feedback loop by cleaving additional FXII, which produces more bradykinin from HMWK [17]. Previous studies have shown that active thrombin can induce the release of tissue plasminogen activator in vitro, with bradykinin potentially serving as the predominant stimulus [36, 37]. Meanwhile, the binding of soluble fibrin to CPB circuits promotes plasminogen activation [38, 39].
Previous studies have reported that coagulation disorders can be deteriorated by use of CPB during surgery, especially in conditions that promote deep hypothermia [20, 33, 40, 41]. For example, some groups have reported that CPB causes an increase in the levels of FXIIa and FDPs [17, 20]. A study conducted by Boisclair et al. [42] suggested that FXIIa can serve as a marker of contact system activation in patients undergoing CPB procedures. In addition to producing kallikrein, FXIIa has been reported to convert FXI into FXIa, thereby initiating the activation of the intrinsic pathway [20]. Therefore, the contact system exacerbates the development of coagulation system disorders when CPB is performed, and this effect may be related to the length of time required to complete CPB procedures. FXIIa, D-dimer and FDPs may serve as early biomarkers for identifying high-risk ARDS patients. We should also pay attention to the coagulation system of patients with prolonged CPB duration.
In the ATAAD group, the concentrations of D-dimer and FDPs increased immediately after surgery in the patients who developed ARDS, indicating that coagulation activity was elevated; however, the PAP concentration did not differ between the ATAAD and AA groups and was lower in patients with hypoxemia. The pathophysiology of ARDS is complex, and the underlying mechanisms have yet to be fully elucidated, especially during acute critical illness [43].
Matthay et al. [44] have speculated that one of the mechanisms underlying ARDS pathogenesis involves the activation and dysregulation of coagulation, both in the lungs and systemically. As a result, increased fibrinolytic activity may be insufficient to counteract the amplified coagulation activity in patients with ARDS. This disequilibrium may lead to fibrin deposition along the denuded alveolar basement membrane, prompting hyaline membrane formation; such lesions can, in turn, decrease lung compliance and increase inspiratory pressures [43]. In addition, the activation of procoagulant pathways may cause microvascular thromboses in the lungs; the increased amount of dead space reduces blood flow and subsequently influences gas exchange in those with ARDS [43, 45, 46]. In this study, the oxygenation index was negatively correlated with the concentration of FXII and was positively correlated with the concentration of PAP 24 hours post-surgery, manifesting as a change in coagulation activity that may be associated with ARDS. However, given the limited sample size, additional research is warranted to validate these findings.
The concentrations of the pro-inflammatory cytokines IL-1
To date, there has been little evidence to support the possibility that coagulation activation at an early stage following cardiac surgery can increase the likelihood of ARDS development, especially in patients with ATAAD. One of the strengths of this study was the detailed comparison that was performed of the relationships between coagulation disorders and postoperative ARDS between the three groups; however, there were some limitations. Firstly, the study population was derived from a single center, and it was not possible to exclude other factors that may have affected oxygenation; further validation is required with a larger cohort. Secondly, ELISAs were used to test serum samples from just nine randomly selected patients in each group. Future investigations should examine other markers of coagulation and fibrinolysis in larger cohorts. Thirdly, local coagulation and inflammatory activity are also important, as they can influence the occurrence of hypoxemia; further analysis of the coagulation biomarkers will be performed based on bronchoalveolar lavage fluid.
In conclusion, the ATAAD- or CPB-induced activation of coagulation pathways can affect gas exchange in the lungs. The early increase in the levels of FXII, FXIIa, D-dimer, and FDPs and the decrease in PAP may play an important role in the mechanisms through which patients with ATAAD develop ARDS following surgical procedures involving CPB. This study offers new insights into the clinical treatment of ARDS using aggressive anticoagulant therapies. Further studies are needed to elucidate the underlying cellular and molecular mechanisms through which the activation of coagulation cascades drives the development of postoperative ARDS in patients with ATAAD.
AA, aortic aneurysm; ACI, acute lung injury; APTT, activated partial thromboplastin time; ARDS, acute respiratory distress syndrome; AST, aspartate aminotransferase; ATAAD, acute type A aortic dissection; BIC, Bayesian information criterion; BMI, body mass index; CIs, confidence intervals; CKD, chronic kidney disease; CLD, chronic liver disease; CPB, cardiopulmonary bypass; CS, cardiac surgery; CT, computed tomography; DHCA, deep hypothermic circulatory arrest; ELISA, enzyme-linked immunosorbent assay; ESICM, European Society of Intensive Care Medicine; EuroSCORE, European System for Cardiac Operative Risk Evaluation; FXI, factor XI; FXII, factor XII; FXIIa, factor XIIa; FVIII-Ag, factor VIII-related antigen; HF, heart failure; HMWK, high-molecular-weight kininogen; HTN, hypertension; ICU, intensive care unit; IL-1
The datasets used and/or analyzed during the current study are available from the corresponding author on reasonable request.
NL was involved in the conception and design of the study. ML and TW have made substantial dedication to acquisition and analysis of data and datadraft the article. YY, ZC, SC and LY conducted immunoassays and data acquisition and was involved in drafting the manuscript. LL was involved in the analysis of data and datadraft the article. XL and LW was involved in patient recruitment and reviewed the draft critically. NL undertook a critical revision of intellectual content. All authors read and approved the final manuscript. All authors have participated sufficiently in the work and agreed to be accountable for all aspects of the work.
The study was carried out in accordance with the guidelines of the Declaration of Helsinki and approved by the Ethics Committee of Beijing Anzhen Hospital, Capital Medical University (Protocol No. 20242001X). The patients randomly selected for ELISA testing need to sign informed consent form, while the others were exempted from signing it by the committee.
Not applicable.
The present work was supported by the National Natural Science Foundation of China (No.82170491). The sponsors analyzed the data and edit the manuscript.
The authors declare no conflict of interest.
Supplementary material associated with this article can be found, in the online version, at https://doi.org/10.31083/RCM36372.
References
Publisher’s Note: IMR Press stays neutral with regard to jurisdictional claims in published maps and institutional affiliations.