


 , Chilie Danzeng 2,†, Yu Jiang 1, JinGang Yang 1, WeiXian Yang 1,*
 , HaiYan Qian 1,3,*, YueJin Yang 1
1 Center for Coronary Heart Disease, Department of Cardiology, Fuwai Hospital, National Center for Cardiovascular Diseases of China, State Key Laboratory of Cardiovascular Disease, Chinese Academy of Medical Sciences and Peking Union Medical College, 100037 Beijing, China
2 Medical Research and Biometrics Center, National Clinical Research Center for Cardiovascular Diseases, Fuwai Hospital, National Center for Cardiovascular Diseases, Peking Union Medical College and Chinese Academy of Medical Sciences, 100037 Beijing, China
3 Center for Coronary Heart Disease, Department of Cardiology, Beijing Anzhen Hospital, Capital Medical University, 100029 Beijing, China
†These authors contributed equally.
Abstract
Globally, acute myocardial infarction (AMI) is among the primary causes of mortality. The ideal approach for blood pressure (BP) management for patients experiencing ST-segment elevation myocardial infarction (STEMI) who receive percutaneous coronary intervention (PCI) remains a topic of ongoing debate. Current guidelines on BP management lack specific recommendations for STEMI patients undergoing PCI, resulting in substantial individual variability and uncertainties in clinical treatment strategies. This research seeks to determine the ideal BP levels linked to the lowest risk of in-hospital mortality and long-term adverse endpoints in STEMI patients receiving PCI.
This retrospective study analyzed data from the China Acute Myocardial Infarction (CAMI) Registry, enrolling 10,482 STEMI patients undergoing PCI at 108 Chinese hospitals from January 2013 to September 2014. The primary outcome was in-hospital mortality. Secondary outcomes included 2-year all-cause mortality, severe bleeding, and major adverse cardiac and cerebrovascular events (MACCEs), defined as a combination of all-cause mortality, myocardial infarction (MI), or stroke. The analysis of the relationship between admission systolic blood pressure (SBP)/diastolic blood pressure (DBP) and the primary and secondary outcomes as continuous and categorical variables was conducted using restricted cubic spline (RCS) analysis and Cox regression models.
RCS analysis revealed that a J-shaped association existed between admission SBP/DBP and the risk of the primary outcome, with significant nonlinearity (both p < 0.001). Both lower and higher SBP/DBP levels were linked to an elevated risk of in-hospital mortality. The ideal SBP/DBP levels to minimize the in-hospital mortality risk were 157/94 mmHg. Compared to the reference SBP/DBP group (120–129/70–79 mmHg), lower admission SBP (<109 mmHg) or DBP (60–69 mmHg) significantly elevated the risk of the primary outcome. The adjusted hazard ratio (HR) for SBP levels of 100–109 mmHg and <100 mmHg was 1.08 (95% confidence interval (CI): 1.00–1.17; p = 0.0395 and p = 0.043, respectively), and for DBP of 60–69 mmHg, the adjusted HR was 1.07 (95% CI: 1.01–1.14, p = 0.0305). Similarly, the J-shaped curve was also noted between SBP/DBP and secondary outcomes, such as all-cause mortality, severe bleeding and MACCEs. However, no significant non–linear relationship was observed between SBP/DBP and recurrent MI at 2-year follow-up.
Among STEMI patients undergoing PCI, a J-curve relationship in in-hospital mortality was observed with a nadir at 157/94 mmHg. Similar J-shaped trends were also observed for secondary outcomes including all-cause mortality, severe bleeding and MACCEs. However, no significant nonlinear correlation was found between admission BP and recurrent MI within 2 years.
NCT01874691, https://www.clinicaltrials.gov/study/NCT01874691?term=NCT01874691&rank=1.
Keywords
- ST-segment elevation myocardial infarction
- blood pressure
- patient admission
- prognosis
- percutaneous coronary intervention
Blood pressure (BP) is a significant risk factor implicated in the progression of atherosclerosis and the formation of vulnerable plaques, contributing to increased mortality in acute coronary syndrome (ACS) patients [1, 2]. Various BP parameters are validated as essential prognostic and therapeutic markers in managing cardiovascular diseases across different clinical settings. Guidelines are recommended for rigorous BP control in individuals with hypertension to minimize the morbidity and mortality of cardiovascular outcomes [3, 4]. Evidence from randomized controlled trials confirmed that reducing BP in those with hypertension decreased the risk of cardiovascular events in the future [5, 6].
Previous research suggests that while elevated BP is linked to a higher
mortality risk following ACS, lower BP does not consistently demonstrate the same
association. Nevertheless, achieving optimal BP control in patients after ACS
remains essential for reducing subsequent cardiovascular events [7]. The SPRINT
trial showed that an intensive treatment strategy aiming for a systolic blood
pressure (SBP)
These conflicting results highlight persistent uncertainties regarding the association between BP levels and the cardiovascular mortality risk of ACS patients. Also, the precise BP levels that correlate with the minimal mortality risk remain poorly defined. Currently, evidence on the prognostic impact of admission SBP/DBP on in-hospital mortality and long-term outcomes in STEMI patients undergoing PCI is limited. Utilizing the data sourced from the large-scale China Acute Myocardial Infarction (CAMI) registry, our study represents the first investigation to employ restricted cubic spline (RCS) analysis to systematically determine the association between levels of admission SBP/DBP and the risk of both in-hospital mortality and long-term endpoints in a large Chinese STEMI cohort. Based on prior evidence, we hypothesize that a J-shaped relationship between admission SBP/DBP and in-hospital mortality, aiming to identify the optimal admission BP levels linked to the lowest mortality risk in STEMI patients undergoing PCI.
This CAMI study is a large-scale, prospective, multicenter observational study in China, aimed at gathering real-world clinical data from acute myocardial infarction (AMI) patients (NCT01874691) [18]. This project was approved by the central institutional review board at Fuwai Hospital and by the ethics committees at each participating institution. Written informed consent was obtained from every enrolled participant. The Data Monitoring Committee was set to supervise data and ensure its quality. The registry includes 108 hospitals across 31 provinces and municipalities in mainland China, with Hong Kong and Macau not included. Eligible patients primarily diagnosed with AMI were consecutively recruited in the registry from January 2013 to September 2014. The AMI diagnosis was rigorously defined based on the third Universal Definition for Myocardial Infarction, including types 1, 2, 3, 4b, and 4c [19]. Type 4a and type 5 AMI were not included in this registry.
Data collected encompassed patient demographics, clinical risk factors, physical
clinical examination findings, discharge medications and laboratory results [18].
The discharge medications specifically encompassed
The CAMI registry recorded 26,648 AMI patients from January 2013 to September 2014. The inclusion criteria encompassed those diagnosed with AMI. The excluded criteria included: those with non-STsegment elevation myocardial infarction (NSTEMI) or an uncertain diagnosis with STEMI/NSTEMI (n = 7294); patients without primary or selective PCI (n = 6908); missing or outlier SBP/DBP values (n = 153); or those lacking clear survival status during hospitalization or any follow-up data (n = 1811). Ultimately, a total of 10,482 STEMI patients undergoing PCI were included in subsequent analysis (Fig. 1).
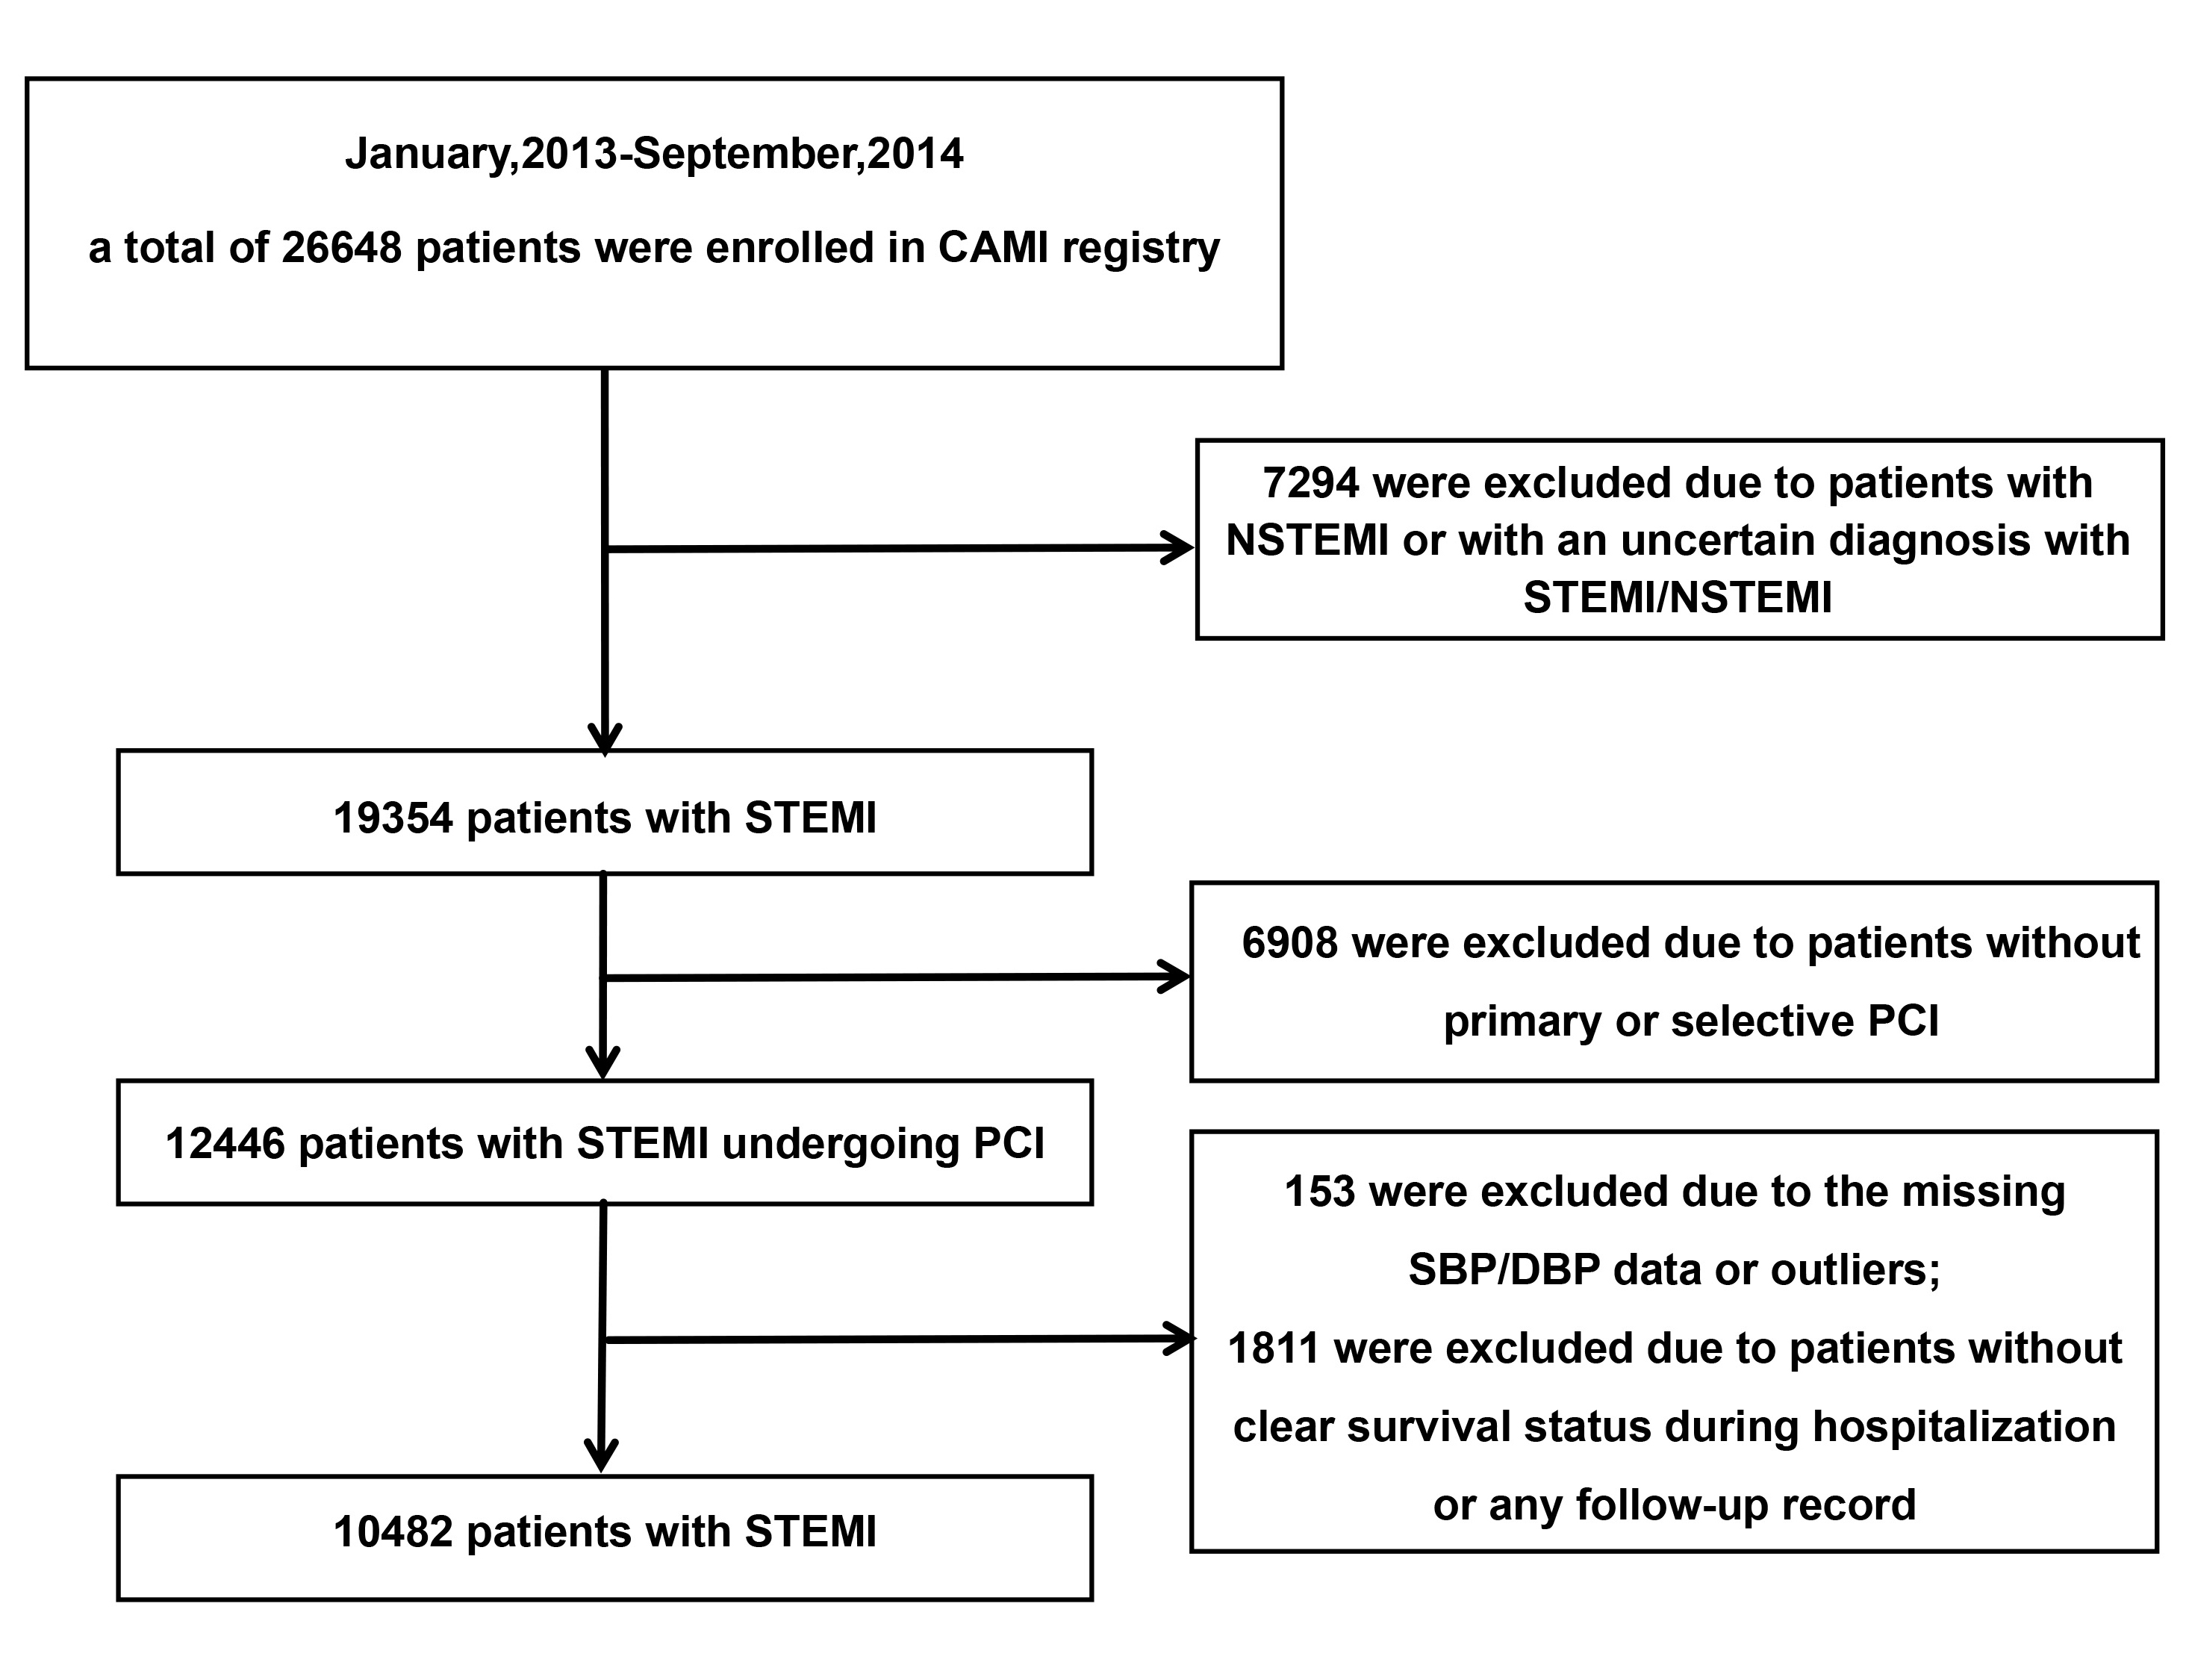 Fig. 1.
The flowchart of criteria for including and excluding participants. CAMI, China Acute Myocardial Infarction; NSTEMI, Non-ST segment elevation myocardial infarction; STEMI, ST-segment elevation myocardial infarction; PCI, percutaneous coronary intervention; SBP, systolic blood pressure; DBP, diastolic blood pressure.
Diabetes mellitus was defined as a documented history of the condition, prior hypoglycemic treatment or an admission hemoglobin A1c (HbA1c) level of 6.5% or higher [20]. Upon first admission to the Cardiology Department of FuWai Hospital, patients were instructed to rest quietly for at least five minutes before BP measurement. BP was measured by professional cardiologists with a validated electronic BP monitor. During the measurement, the upper arms of the patients were placed at the same height as the heart. Measurements were taken from both arms, and the higher value was recorded. Hyperlipidemia was characterized by plasma triglyceride levels of at least 200 mg/dL, total cholesterol levels of at least 240 mg/dL, or a recorded history of lipid-lowering medication use prior to admission [21].
During the 2-year follow-up after inclusion in the CAMI registry, the primary outcome was in-hospital mortality. The secondary outcomes included 2-year heart failure, 2-year all-cause mortality, 2-year severe bleeding, and 2-year MACCEs. MACCEs were defined as a combination of all-cause mortality, recurrent MI, and ischemic stroke. Rehospitalization or doctor visits for heart failure (HF) were considered indicative of new or worsening HF, diagnosed by clinical symptoms such as cardiac dyspnea and pink frothy sputum and was supported by laboratory tests. The identification of severe bleeding events followed the Bleeding Academic Research Consortium (BARC) criteria, with BARC types 0, 1, and 2 excluded [22].
Variables that are continuous and normally distributed are represented as mean
Given the potential non-linear relationship between admission SBP/DBP and
outcomes, RCS analysis with three knots was conducted. The knots of the SBP group
were determined as 98 mmHg (10th), 125 mmHg (50th), 160 mmHg (90th), while the
DBP group knots were determined as 60 mmHg (10th), 79 mmHg (50th), 100 mmHg
(90th) by using a percentile-based method, respectively. This spline analysis
evaluates the continuous associations between admission SBP/DBP and all outcomes
and identified the levels of admission SBP/DBP with the lowest risk of outcomes.
Interaction testing using Cox regression models was conducted for subgroup
analyses categorized by age (
For Cox proportional hazards regression models and logistic regression models, missing qualitative indicators are imputed by the most frequent category, whereas quantitative indicators are filled with the mean value. Supplementary Table 1 and Table 2 presents a summary of missing data for all covariates and compares baseline characteristics between participants with and without missing data to evaluate potential systematic differences. Statistical analyses utilized SAS software (version 9.4 for Windows, SAS Institute Inc., Cary, NC, USA). Statistical significance in a 2-tailed test was determined by a p-value of less than 0.05.
After excluding 16,166 patients based on predefined criteria, the current study
involved 10,482 eligible STEMI patients. The clinical and demographic
characteristics of the cohort are detailed in Tables 1,2. The participants had a
mean age of 59.84
| Systolic blood pressure groups | p-value | ||||||||
| Total | 100–109 mmHg | 110–119 mmHg | 120–129 mmHg | 130–139 mmHg | 140–149 mmHg | ||||
| N (total = 10,482) | 10,482 | 1133 | 1139 | 1644 | 1808 | 1632 | 1223 | 1903 | – |
| Age (years) | 60.02 (51.06–68.25) | 61.20 (53.59–70.12) | 59.94 (50.74–68.00) | 59.38 (50.32–67.33) | 59.42 (50.33–67.79) | 59.87 (51.00–67.43) | 59.76 (50.81–67.44) | 61.13 (51.97–69.66) | |
| Male sex | 8450 (80.6%) | 904 (79.8%) | 949 (83.3%) | 1370 (83.3%) | 1475 (81.6%) | 1321 (80.9%) | 980 (80.1%) | 1451 (76.2%) | |
| BMI (kg/m2) | 24.22 (22.49–26.04) | 23.88 (22.03–25.72) | 23.94 (22.09–25.71) | 24.21 (22.49–25.95) | 24.22 (22.49–25.95) | 24.22 (22.58–26.12) | 24.38 (22.68–26.11) | 24.49 (22.49–26.53) | |
| Baseline SBP (mmHg) | 125.00 (110.00–141.00) | 90.00 (85.00–96.00) | 104.00 (100.00–106.00) | 113.00 (110.00–116.00) | 122.00 (120.00–126.00) | 132.00 (130.00–136.00) | 142.00 (140.00–145.00) | 160.00 (154.00–171.00) | |
| Baseline DBP (mmHg) | 79.00 (70.00–90.00) | 60.00 (52.00–63.00) | 67.00 (61.00–71.00) | 71.00 (68.00–78.00) | 78.00 (70.00–82.00) | 80.00 (76.50–90.00) | 90.00 (80.00–95.00) | 98.00 (89.00–106.00) | |
| Heartrate (b.p.m.) | 75.00 (65.00–86.00) | 66.00 (52.00–63.00) | 72.00 (62.00–83.00) | 74.00 (65.00–84.00) | 76.00 (66.00–86.00) | 76.00 (67.00–86.00) | 78.00 (68.00–88.00) | 79.00 (70.00–90.00) | |
| LVEF (%) | 55.00 (48.00–60.00) | 54.00 (46.00–60.00) | 54.00 (47.00–60.00) | 55.00 (47.48–60.00) | 54.00 (47.00–60.00) | 55.00 (48.00–60.00) | 55.00 (48.00–60.00) | 56.00 (49.00–61.22) | |
| Killip III/IV | 547 (5.2%) | 218 (19.3%) | 53 (4.7%) | 81 (4.9%) | 51 (2.8%) | 47 (2.9%) | 31 (2.5%) | 66 (3.5%) | |
| Mean glucose | 7.00 (5.72–9.10) | 7.30 (5.87–9.80) | 6.77 (5.70–8.70) | 6.80 (5.60–8.73) | 6.87 (5.54–8.91) | 7.01 (5.80–9.00) | 7.20 (5.79–9.50) | 7.17 (5.83–9.41) | 0.2415 |
| LDL-C (mmol/L) | 2.78 (2.23–3.37) | 2.63 (2.10–3.20) | 2.68 (2.19–3.27) | 2.74 (2.20–3.35) | 2.79 (2.23–3.40) | 2.84 (2.26–3.43) | 2.82 (2.30–3.40) | 2.87 (2.32–3.47) | 0.0122 |
| HDL-C (mmol/L) | 1.00 (0.90–1.20) | 1.00 (0.80–1.20) | 1.00 (0.80–1.20) | 1.00 (0.80–1.20) | 1.00 (0.80–1.20) | 1.00 (0.90–1.30) | 1.00 (0.90–1.20) | 1.10 (0.90–1.30) | 0.5998 |
| Total Cholesterol | 4.53 (3.85–5.25) | 4.28 (3.67–4.98) | 4.41 (3.71–5.09) | 4.49 (3.81–5.20) | 4.51 (3.82–5.24) | 4.67 (3.96–5.37) | 4.61 (3.99–5.33) | 4.65 (3.95–5.40) | |
| Triglycerides | 1.44 (1.01–2.10) | 1.30 (0.88–1.89) | 1.42 (0.99–2.03) | 1.40 (1.02–2.05) | 1.45 (1.02–2.05) | 1.46 (1.04–2.18) | 1.51 (1.07–2.22) | 1.49 (1.03–2.23) | 0.1029 |
| Hs-CRP (mg/L) | 6.35 (2.46–14.60) | 7.15 (2.91–22.30) | 8.20 (2.60–16.49) | 6.52 (2.80–14.32) | 6.24 (2.10–14.33) | 5.75 (2.35–13.39) | 6.36 (2.27–14.84) | 6.00 (2.52–13.89) | |
| NT-proBNP (ng/ml) | 457.8 (125.00–1420.0) | 674.00 (191.00–2066.00) | 488.00 (125.00–1534.00) | 490.50 (127.00–1523.00) | 405.00 (122.00–1344.00) | 436.00 (114.00–1407.00) | 374.80 (125.00–1078.00) | 439.00 (118.00–1342.00) | |
| WBC ( |
10.10 (8.10–12.57) | 10.90 (8.50–13.70) | 10.21 (8.10–12.78) | 10.31 (8.23–12.81) | 10.00 (8.01–12.49) | 9.93 (8.09–12.30) | 10.00 (7.94–12.30) | 9.74 (7.96–12.05) | |
| PLT ( |
207.00 (172.00–246.00) | 199.00 (166.00–244.00) | 201.00 (167.00–239.00) | 206.00 (170.00–244.00) | 206.00 (171.00–246.00) | 211.00 (177.00–251.00) | 209.00 (175.00–251.50) | 211.00 (174.00–248.00) | 0.0014 |
| Serum creatinine (mmol/L) | 73.60 (61.90–87.90) | 79.90 (66.00–100.90) | 74.60 (63.25–88.90) | 74.00 (62.10–86.80) | 72.40 (60.00–86.00) | 73.00 (61.00–86.00) | 71.50 (60.80–85.00) | 72.00 (61.00–86.50) | |
| Previous MI | 520 (5.2%) | 80 (7.5%) | 71 (6.5%) | 82 (5.2%) | 78 (4.5%) | 68 (4.4%) | 57 (4.9%) | 84 (4.7%) | 0.0051 |
| TnI (ng/mL) | 25.07 (6.37–50.00) | 32.00 (11.80–50.00) | 28.27 (9.96–50.00) | 26.85 (6.50–50.00) | 20.47 (6.62–46.30) | 26.75 (6.17–50.00) | 20.48 (4.89–50.00) | 22.17 (4.34–50) | 0.4106 |
| History of heart failure | 78 (0.8%) | 14 (1.3%) | 8 (0.7%) | 11 (0.7%) | 14 (0.8%) | 12 (0.8%) | 11 (0.9%) | 8 (0.4%) | 0.348 |
| Admission heart failure | 1151 (11.1%) | 231 (20.6%) | 125 (11.0%) | 183 (11.2%) | 168 (9.4%) | 136 (8.4%) | 95 (7.8%) | 214 (11.3%) | |
| Peripheral vascular disease | 43 (0.4%) | 3 (0.3%) | 3 (0.3%) | 12 (0.8%) | 7 (0.4%) | 5 (0.3%) | 7 (0.6%) | 6 (0.3%) | 0.3965 |
| Hyperlipidemia | 807 (8.6%) | 73 (7.1%) | 91 (8.9%) | 134 (8.9%) | 135 (8.3%) | 133 (9%) | 101 (9.2%) | 140 (8.5%) | 0.6414 |
| Diabetes | 1880 (18.5%) | 179 (16.2%) | 168 (15.3%) | 280 (17.4%) | 302 (17.1%) | 305 (19.4%) | 269 (22.7%) | 377 (20.7%) | |
| Prior stroke | 793 (7.8%) | 66 (6.0%) | 62 (5.6%) | 118 (7.4%) | 137 (7.8%) | 123 (7.8%) | 99 (8.4%) | 188 (10.4%) | 0.0001 |
| COPD | 139 (1.4%) | 20 (1.8%) | 17 (1.5%) | 20 (1.3%) | 26 (1.5%) | 20 (1.3%) | 14 (1.2%) | 22 (1.2%) | 0.8268 |
| Haemoglobin (g/dL) | 139.84 |
134.43 |
136.55 |
138.73 |
139.61 |
141.27 |
142.53 |
143.24 |
|
| ACEi/ARB | 581 (6.2%) | 49 (4.8%) | 59 (5.7%) | 80 (5.4%) | 90 (5.5%) | 95 (6.5%) | 70 (6.5%) | 138 (8.4%) | 0.0026 |
| Beta-blocker | 443 (4.7%) | 46 (4.5%) | 54 (5.1%) | 66 (4.4%) | 77 (4.7%) | 65 (4.5%) | 52 (4.8%) | 83 (5.0%) | 0.9667 |
| Aspirin | 826 (8.6%) | 88 (8.5%) | 94 (8.9%) | 132 (8.7%) | 151 (9%) | 114 (7.7%) | 100 (8.9%) | 147 (8.6%) | 0.8982 |
| Clopidogrel | 340 (3.5%) | 38 (3.7%) | 45 (4.2%) | 51 (3.3%) | 63 (3.7%) | 38 (2.6%) | 46 (4.1%) | 59 (3.5%) | 0.2806 |
| Diuretics | 85 (0.9%) | 14 (1.4%) | 8 (0.8%) | 19 (1.3%) | 11 (0.7%) | 12 (0.8%) | 9 (0.8%) | 12 (0.7%) | 0.3740 |
| CCB | 687 (7.3%) | 63 (6.2%) | 42 (4.0%) | 91 (6.1%) | 102 (6.2%) | 115 (7.9%) | 99 (9.1%) | 175 (10.5%) | |
Continuous variables are medians with 25th and 75th percentiles. Abbreviations: BMI, body mass index; SBP, systolic blood pressure; DBP, diastolic blood pressure; LVEF, left ventricular ejection fraction; LDL-C, low-density lipoprotein cholesterol; HDL-C, high-density lipoprotein cholesterol; Hs-CRP, high-sensitivity C-reactive protein; NT-proBNP, N-terminal pro-brain natriuretic peptide; WBC, white blood cell; PLT, platelet; MI, myocardial infarction; TnI, Troponin I/T; COPD, chronic obstructive pulmonary disease; ACEi/ARB, angiotensin-converting enzyme inhibitor/angiotensin receptor blocker; CCB, calcium-channel blocker.
| Diastolic blood pressure groups | p-value | |||||||
| 60–69 mmHg | 70–79 mmHg | 80–89 mmHg | 90–99 mmHg | 100–109 mmHg | ||||
| N (total = 10,482) | 807 | 1806 | 2642 | 2588 | 1469 | 759 | 411 | – |
| Age (years) | 63.79 (55.33–72.58) | 60.95 (51.58–69.63) | 61.00 (52.42–68.63) | 60.00 (51.09–67.85) | 58.87 (50.35–66.71) | 56.61 (48.59–64.03) | 54.92 (47.13–63.68) | |
| Male sex | 621 (77.0%) | 1462 (81.0%) | 2113 (80.0%) | 2078 (80.3%) | 1198 (81.6%) | 628 (82.7%) | 350 (85.2%) | 0.0113 |
| BMI (kg/m2) | 23.88 (22.04–25.67) | 23.88 (22.06–25.78) | 24.22 (22.49–25.95) | 24.22 (22.53–26.03) | 24.34 (22.76–26.17) | 24.68 (22.69–26.80) | 24.92 (22.86–27.08) | |
| Baseline SBP (mmHg) | 91.00 (81.00–102.00) | 106.00 (98.00–116.00) | 120.00 (110.00–130.00) | 130.00 (120.00–140.00) | 142.00 (134.00–155.00) | 155.00 (145.00–166.00) | 174.00 (163.00–189.00) | |
| Baseline DBP (mmHg) | 53.00 (50.00–57.00) | 64.00 (60.00–67.00) | 72.00 (70.00–76.00) | 81.00 (80.00–85.00) | 92.00 (90.00–95.00) | 100.00 (100.00–105.00) | 115.00 (110.00–120.00) | |
| Heartrate (b.p.m.) | 62.00 (51.00–77.00) | 70.00 (61.00–82.00) | 74.00 (65.00–84.00) | 76.00 (68.00–86.00) | 80.00 (70.00–90.00) | 80.00 (71.00–92.00) | 84.00 (74.00–95.00) | |
| LVEF (%) | 55.00 (48.00–60.00) | 55.00 (48.00–60.00) | 55.00 (47.00–60.00) | 55.00 (48.00–60.00) | 55.00 (48.00–60.00) | 55.00 (47.61–60.00) | 54.00 (48.00–60.00) | 0.9185 |
| Killip III/IV | 180 (22.4%) | 97 (5.4%) | 112 (4.3%) | 81 (3.1%) | 42 (2.9%) | 17 (2.2%) | 18 (4.4%) | |
| Mean glucose (mmol/L) | 7.44 (5.96–10.00) | 6.70 (5.62–8.79) | 6.91 (5.69–9.00) | 7.01 (5.74–9.10) | 7.10 (5.80–9.06) | 7.01 (5.76–9.26) | 7.24 (5.80–9.65) | 0.0394 |
| LDL-C (mmol/L) | 2.61 (2.09–3.20) | 2.68 (2.15–3.24) | 2.76 (2.21–3.34) | 2.80 (2.26–3.43) | 2.90 (2.33–3.49) | 2.87 (2.31–3.49) | 2.93 (2.44–3.54) | 0.0165 |
| HDL-C (mmol/L) | 1.00 (0.80–1.20) | 1.00 (0.80–1.20) | 1.00 (0.80–1.20) | 1.00 (0.90–1.20) | 1.00 (0.90–1.20) | 1.10 (0.90–1.30) | 1.10 (0.90–1.30) | 0.6042 |
| Total Cholesterol (mmol/L) | 4.27 (3.65–4.96) | 4.43 (3.73–5.12) | 4.44 (3.81–5.18) | 4.58 (3.90–5.31) | 4.71 (4.00–5.40) | 4.70 (4.00–5.41) | 4.72 (4.09–5.47) | |
| Triglycerides (mmol/L) | 1.28 (0.88–1.87) | 1.35 (0.97–1.94) | 1.42 (1.00–2.07) | 1.46 (1.04–2.11) | 1.56 (1.08–2.27) | 1.46 (1.06–2.25) | 1.66 (1.10–2.39) | 0.1800 |
| Hs-CRP (mg/L) | 7.49 (3.02–19.70) | 7.93 (2.94–18.20) | 6.23 (2.32–14.19) | 6.47 (2.45–13.98) | 6.03 (2.00–14.04) | 5.12 (2.39–11.96) | 5.93 (2.51–14.40) | |
| NT-proBNP (fmol/L) | 660.75 (179.10–1797.00) | 506.75 (144.00–1744.00) | 487.86 (131.00–1487.00) | 410.00 (104.00–1305.00) | 374.66 (121.40–1197.00) | 404.50 (109.00–1198.00) | 337.30 (96.68–1184.00) | 0.0001 |
| WBC ( |
10.75 (8.34–13.89) | 10.10 (8.07–12.71) | 10.06 (8.10–12.40) | 10.07 (8.00–12.48) | 10.09 (8.27–12.40) | 9.93 (8.08–12.60) | 10.03 (8.18–12.00) | |
| PLT ( |
197.00 (164.00–241.00) | 204.00 (168.00–245.00) | 203.50 (169.00–242.00) | 209.00 (174.00–248.00) | 212.00 (177.00–248.00) | 214.00 (177.00–255.00) | 214.00 (178.50–251.00) | |
| Serum creatinine (mmol/L) | 81.30 (68.00–105.52) | 74.00 (62.30–88.00) | 73.00 (61.40–87.48) | 72.10 (60.00–86.00) | 72.00 (60.80–84.00) | 72.00 (61.70–84.00) | 73.00 (62.00–89.00) | |
| Previous MI | 57 (7.5%) | 99 (5.8%) | 132 (5.3%) | 122 (5.0%) | 67 (4.8%) | 27 (3.8%) | 16 (4.1%) | 0.0432 |
| TnI (ng/mL) | 32.00 (10.75–50.00) | 27.79 (9.23–50.00) | 22.64 (6.54–50.00) | 22.78 (5.58–50.00) | 24.72 (5.54–50.00) | 22.28 (5.21–50.00) | 27.31 (4.86–50.00) | 0.1635 |
| History of heart failure | 7 (0.9%) | 18 (1.0%) | 24 (1.0%) | 14 (0.6%) | 9 (0.6%) | 5 (0.7%) | 1 (0.3%) | 0.3891 |
| Admission heart failure | 166 (20.8%) | 216 (12.0%) | 263 (10.0%) | 247 (9.6%) | 147 (10.1%) | 68 (9.0%) | 45 (11.0%) | |
| Peripheral vascular disease | 4 (0.5%) | 9 (0.5%) | 12 (0.5%) | 12 (0.5%) | 3 (0.2%) | 3 (0.4%) | 0 (0.0%) | 0.4247 |
| Hyperlipidemia | 68 (9.3%) | 139 (8.5%) | 205 (8.6%) | 204 (8.7%) | 110 (8.5%) | 49 (7.5%) | 32 (9.0%) | 0.9445 |
| Diabetes | 149 (18.9%) | 300 (17.1%) | 526 (20.5%) | 448 (17.9%) | 256 (18.1%) | 137 (18.9%) | 64 (16.2%) | 0.0726 |
| Prior stroke | 50 (6.4%) | 132 (7.6%) | 188 (7.4%) | 200 (8.1%) | 118 (8.3%) | 72 (9.8%) | 33 (8.4%) | 0.2520 |
| COPD | 12 (1.5%) | 26 (1.5%) | 35 (1.4%) | 37 (1.5%) | 19 (1.3%) | 4 (0.5%) | 6 (1.5%) | 0.4823 |
| Haemoglobin (g/dL) | 133.37 |
135.70 |
138.09 |
140.62 |
143.76 |
146.38 |
150.97 |
|
| ACEi/ARB | 38 (5.3%) | 110 (6.7%) | 130 (5.4%) | 144 (6.3%) | 85 (6.5%) | 45 (6.5%) | 29 (8%) | 0.3796 |
| Beta-blocker | 37 (5.1%) | 80 (4.9%) | 101 (4.2%) | 108 (4.7%) | 70 (5.3%) | 29 (4.2%) | 18 (4.9%) | 0.7756 |
| Aspirin | 70 (9.6%) | 163 (9.8%) | 214 (8.8%) | 194 (8.3%) | 95 (7.1%) | 53 (7.5%) | 37 (9.9%) | 0.1193 |
| Clopidogrel | 30 (4.1%) | 79 (4.7%) | 78 (3.2%) | 75 (3.2%) | 45 (3.3%) | 20 (2.8%) | 13 (3.5%) | 0.1231 |
| Diuretics | 8 (1.1%) | 15 (0.9%) | 24 (1.0%) | 21 (0.9%) | 11 (0.8%) | 3 (0.4%) | 3 (0.8%) | 0.8302 |
| CCB | 49 (6.8%) | 92 (5.6%) | 158 (6.6%) | 157 (6.8%) | 126 (9.6%) | 65 (9.3%) | 40 (11.0%) | |
Continuous variables are medians with 25th and 75th percentiles.
The mean admission SBP/DBP for the cohort was 127.26
| Systolic blood pressure | p-value | ||
| N (total = 10,482) | 2272 | 8210 | – |
| Age (years) | 60.54 (51.72–69.05) | 59.94 (50.93–68.02) | |
| Male sex | 1853 (81.6%) | 6597 (80.4%) | 0.1965 |
| BMI (kg/m2) | 23.88 (22.04–25.71) | 24.22 (22.53–26.12) | |
| Baseline SBP (mmHg) | 100 (90.00–104.00) | 131 (120.00–147.00) | |
| Baseline DBP (mmHg) | 62.00 (58.00–69.00) | 80.00 (74.00–90.00) | |
| Heart rate (b.p.m.) | 70.00 (59.00–82.00) | 76.00 (67.00–87.00) | |
| LVEF (%) | 54.00 (47.00–60.00) | 55.00 (48.00–60.00) | |
| Killip III/IV (%) | 271 (12.0%) | 276 (3.4%) | |
| Mean glucose (mmol/L) | 7.00 (5.76–9.26) | 7.00 (5.71–9.09) | 0.1029 |
| LDL-C (mmol/L) | 2.65 (2.14–3.23) | 2.81 (2.26–3.41) | |
| HDL-C (mmol/L) | 1.00 (0.80–1.20) | 1.00 (0.90–1.20) | 0.5829 |
| Total cholesterol (mmol/L) | 4.34 (3.69–5.02) | 4.58 (3.90–5.31) | |
| Triglycerides (mmol/L) | 1.36 (0.94–1.96) | 1.46 (1.03–2.14) | |
| Hs-CRP (mg/L) | 7.58 (2.85–19.40) | 6.04 (2.40–13.94) | |
| NT-proBNP (fmol/L) | 581.00 (151.91–1710.00) | 426.30 (118.92–1352.00) | |
| WBC ( |
10.50 (8.30–13.20) | 10.00 (8.04–12.40) | |
| PLT ( |
200.00 (167.00–241.00) | 208.00 (173.00–248.00) | |
| Serum creatinine (mmol/L) | 77.00 (65.00–94.00) | 72.50 (61.00–86.00) | |
| Previous MI | 151 (7.0%) | 369 (4.7%) | |
| TnI (ng/mL) | 30.00 (10.60–50.00) | 23.25 (5.71–50.00) | 0.6479 |
| History of heart failure | 22 (1.0%) | 56 (0.7%) | 0.1735 |
| Admission heart failure | 356 (15.8%) | 796 (9.8%) | |
| Admission cardiogenic shock | 225 (10.0%) | 72 (0.9%) | |
| Admission cardiac arrest | 40 (1.8%) | 67 (0.8%) | |
| Peripheral vascular disease | 6 (0.3%) | 37 (0.5%) | 0.1909 |
| Hyperlipidemia | 164 (8.0%) | 643 (8.7%) | 0.2858 |
| Diabetes | 347 (15.8%) | 1533 (19.3%) | |
| Prior stroke | 128 (5.8%) | 665 (8.4%) | |
| COPD | 37 (1.7%) | 102 (1.3%) | 0.1695 |
| Haemoglobin (g/dL) | 136.70 (125.00–148.00) | 142.00 (130.00–153.00) | |
| ACEi/ARB | 108 (5.2%) | 473 (6.4%) | 0.0393 |
| Beta-blocker | 100 (4.8%) | 343 (4.7%) | 0.7622 |
| Aspirin | 182 (8.7%) | 644 (8.6%) | 0.8654 |
| Clopidogrel | 83 (4.0%) | 257 (3.4%) | 0.2423 |
| Diuretics | 22 (1.1%) | 63 (0.8%) | 0.3727 |
| CCB | 105 (5.1%) | 582 (7.9%) | |
Continuous variables are medians with 25th and 75th percentiles.
| Diastolic blood pressure | p-value | ||
| N (total = 10,482) | 2613 | 7869 | - |
| Age (years) | 61.61 (52.44–70.67) | 59.51 (50.73–67.48) | |
| Male sex | 2083 (79.7%) | 6367 (80.9%) | 0.1821 |
| BMI (kg/m2) | 23.88 (22.04–25.71) | 24.22 (22.53–26.12) | |
| Baseline SBP (mmHg) | 102.00 (93.00–113.00) | 131.00 (120.00–148.00) | |
| Baseline DBP (mmHg) | 60.00 (58.00–65.00) | 81.00 (76.00–91.00) | |
| Heart rate (b.p.m.) | 68.00 (59.00–80.00) | 77.00 (68.00–88.00) | |
| LVEF (%) | 55.00 (48.00–60.00) | 55.00 (48.00–60.00) | 0.9680 |
| Killip III/IV (%) | 277 (10.6%) | 270 (3.4%) | |
| Mean glucose (mmol/L) | 6.93 (5.70–9.17) | 7.00 (5.73–9.10) | 0.5737 |
| LDL-C (mmol/L) | 2.65 (2.13–3.23) | 2.82 (2.26–3.42) | |
| HDL-C (mmol/L) | 1.00 (0.80–1.20) | 1.00 (0.90–1.20) | 0.5829 |
| Total cholesterol (mmol/L) | 4.37 (3.70–5.08) | 4.58 (3.91–5.30) | |
| Triglycerides (mmol/L) | 1.34 (0.94–1.93) | 1.48 (1.04–2.16) | 0.3629 |
| Hs-CRP (mg/L) | 7.81 (2.96–18.61) | 6.00 (2.31–13.84) | |
| NT-proBNP (fmol/L) | 567.53 (155.00–1769.00) | 413.00 (116.00–1333.00) | |
| WBC ( |
10.32 (8.10–13.00) | 10.06 (8.10–12.43) | |
| PLT ( |
202.00 (167.00–244.00) | 208.00 (173.00–247.00) | |
| Serum creatinine (mmol/L) | 76.00 (64.00–92.35) | 72.50 (61.00–86.00) | |
| Previous MI | 156 (6.3%) | 364 (4.9%) | |
| TnI (ng/mL) | 29.77 (9.78–50.00) | 23.00 (5.80–50.00) | 0.6479 |
| History of heart failure | 25 (1.0%) | 53 (0.7%) | 0.1735 |
| Admission heart failure | 382 (14.7%) | 770 (9.9%) | |
| Admission cardiogenic shock | 228 (8.8%) | 69 (0.9%) | |
| Admission cardiac arrest | 37 (1.4%) | 70 (0.9%) | 0.0250 |
| Peripheral vascular disease | 13 (0.5%) | 30 (0.4%) | 0.4437 |
| Hyperlipidemia | 207 (8.8%) | 600 (8.5%) | 0.7359 |
| Diabetes | 449 (17.6%) | 1431 (18.8%) | 0.1736 |
| Prior stroke | 182 (7.2%) | 611 (8.1%) | 0.1619 |
| COPD | 38 (1.5%) | 101 (1.3%) | 0.5296 |
| Haemoglobin (g/dL) | 134.99 |
141.45 |
|
| ACEi/ARB | 148 (6.3%) | 433 (6.2%) | 0.8275 |
| Beta-blocker | 117 (4.9%) | 326 (4.6%) | 0.5430 |
| Aspirin | 233 (9.7%) | 593 (8.3%) | 0.0287 |
| Clopidogrel | 83 (4.0%) | 257 (3.4%) | 0.0027 |
| Diuretics | 23 (1.0%) | 62 (0.9%) | 0.6633 |
| CCB | 141 (6.0%) | 546 (7.7%) | 0.0036 |
Continuous variables are medians with 25th and 75th percentiles.
The association between admission SBP levels and the in-hospital mortality risk in STEMI patients receiving PCI followed a non-linear J-shaped trend, as assessed by restricted cubic spline analysis (p for nonlinearity = 0.004), with a nadir at 157 mmHg (Fig. 2).
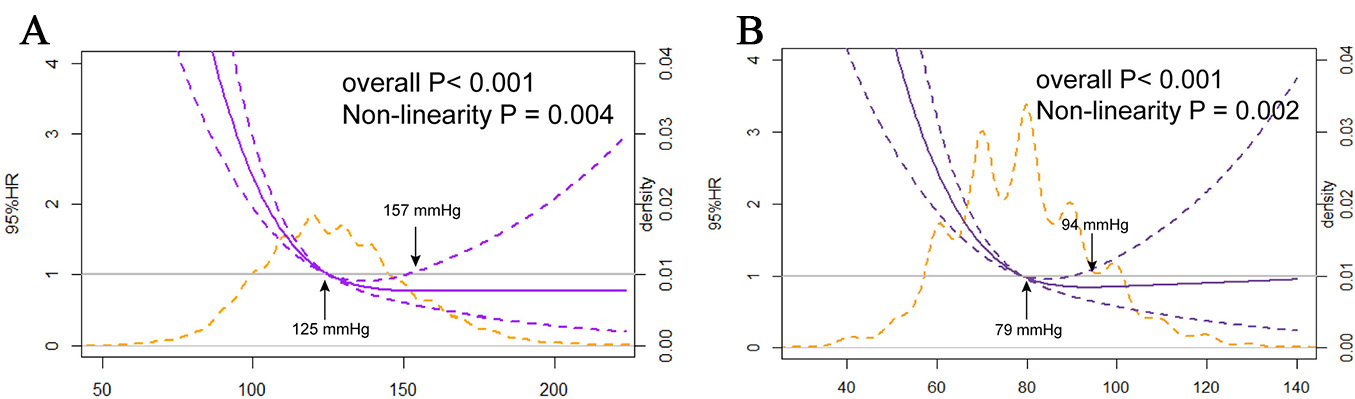 Fig. 2.
The nonlinear J-shaped relationship between SBP/DBP levels and in-hospital mortality. (A) Systolic blood pressure. (B) Diastolic blood pressure.
Different SBP groups were analyzed using a Cox proportional hazards model to
explore this relationship further. Among the total cohort, compared with
individuals whose SBP fell within the 120–130 mmHg range, the patients with an
SBP below 100 mmHg and those with an SBP ranging from 100–110 mmHg exhibited an
increased risk of in-hospital mortality [HR = 1.08 (95% CI: 1.00–1.17),
p
| Categories | Endpoint | BP quartiles (mmHg) | Events (n/Total) | Mortality (%) | Adjusted hazard ratio (95% CI) | |
| Adjusted | p-value | |||||
| Systolic blood pressure | In-hospital mortality | 41/1133 | 3.62 | 1.08 (1.00–1.17) | 0.0430 | |
| 100–109 mmHg | 17/1139 | 1.49 | 1.08 (1.00–1.17) | 0.0395 | ||
| 110–119 mmHg | 22/1644 | 1.34 | 1.05 (0.98–1.12) | 0.1501 | ||
| 120–129 mmHg | 22/1808 | 1.22 | Reference | – | ||
| 130–139 mmHg | 9/1632 | 0.55 | 1.01 (0.95–1.08) | 0.6982 | ||
| 140–149 mmHg | 5/1223 | 0.41 | 1.02 (0.95–1.10) | 0.6427 | ||
| 20/1903 | 1.05 | 1.00 (0.94–1.07) | 0.9643 | |||
| Diastolic blood pressure | In-hospital mortality | 33/804 | 4.09 | 1.05 (0.97–1.14) | 0.2042 | |
| 60–69 mmHg | 23/1806 | 1.27 | 1.07 (1.01–1.14) | 0.0305 | ||
| 70–79 mmHg | 30/2642 | 1.14 | Reference | – | ||
| 80–89 mmHg | 28/2588 | 1.08 | 1.00 (0.94–1.05) | 0.8486 | ||
| 90–99 mmHg | 15/1469 | 1.02 | 0.96 (0.90–1.02) | 0.1682 | ||
| 100–109 mmHg | 6/759 | 0.79 | 1.01 (0.93–1.09) | 0.8961 | ||
| 1/411 | 0.24 | 1.01 (0.91–1.13) | 0.7976 | |||
Model adjusted for age, gender, BMI, heart rate, diabetes, hyperlipidemia, smoke, heart failure, myocardial infarction, stroke, chronic kidney disease, left main coronary artery disease, left ventricular ejection fraction, and creatinine clearance rate.
According to the RCS analysis, a similarly steep J-curve was observed
(p for nonlinearity = 0.002) for DBP at admission concerning in-hospital
mortality. Lower DBPs were linked to an increased risk of in-hospital mortality.
The adjusted HR was 1.07 (95% CI: 1.01–1.14, p
The analysis was adjusted for the covariates such as age, gender, BMI, heart rate, diabetes, hyperlipidemia, smoking and alcohol consumption history, heart failure, MI, chronic kidney disease, left main coronary artery disease, stroke, LVEF, and creatinine clearance rate.
After adjusting for clinical baseline characteristics, a U-shaped curve was
observed for the association between both SBP and DBP with the incidence of
2-year HF, with a nadir at 140/85 mmHg (all p for nonlinearity
Multivariate logistic regression models were used to investigate the association
between SBP levels and 2-year heart failure. An elevated risk of 2-year HF was
observed in the group with SBP
Across the entire cohort, an analysis of 2-year MACCEs revealed that 4.7% of individuals experienced all-cause mortality, 2.2% experienced recurrent MI, and 1.6% experienced stroke within 2 years. Both SBP and DBP showed a similar U-shaped relationship with the risk of MACCEs, with a nadir at 136/83 mmHg (Supplementary Fig. 2). A comparable pattern in the correlation with all-cause mortality showed the lowest point at 138/84 mmHg (Supplementary Fig. 3). For 2-year stroke events, the 95% confidence interval included a HR of 1.0 at any level of DBP (Supplementary Fig. 4). High SBP levels were linked to a greater risk of stroke despite a notably wide 95% confidence interval. Additionally, for 2-year recurrent MI in any group, the 95% confidence interval included a HR of 1.0 for all levels of both SBP and DBP (Supplementary Fig. 5).
A non-linear relationship in the form of a U-shape curve exists between SBP/DBP
and the incidence of 2-year severe bleeding events was identified in the entire
cohort (all p for nonlinearity
Age, gender, and diabetes were identified as prognostic factors for STEMI in the
Cox regression analysis. Accordingly, patients were categorized into the younger
group (
In this study involving 10,482 individuals from a large-scale Chinese cohort of consecutive STEMI patients undergoing PCI, a J-shaped association between SBP/DBP and in-hospital mortality was identified using RCS analysis. This J-curve relationship persisted as significant even after controlling for possible confounding variables. Our data indicate the following: (1) the optimal admission SBP/DBP for minimizing risk of in-hospital mortality is 157/94 mmHg; (2) Additionally, the RCS analysis reveals a J-shaped trend, where patients with lower admission SBP/DBP are associated with an elevated risk for 2-year incidence of HF, severe bleeding, 2-year MACCEs and all-cause mortality. However, no J-shaped association was found for recurrent MI. (3) As a categorical variable, the HRs for in-hospital mortality were significantly higher in groups with lower admission SBP/DBP levels compared to those with an admission SBP/DBP of 120–129/70–79 mmHg. This association remained even after adjusting for potential confounders. According to our knowledge, this is the first investigation of the relationship between SBP/DBP and various long-term adverse clinical outcomes in STEMI patients receiving PCI within a large Chinese population cohort.
The majority of previous studies were conducted as retrospective or post hoc
analysis of randomized trials within hypertension cohorts. These studies often
explore the association between BP and adverse endpoints but often fail to reach
consistent results due to the variability in patient history and underlying
fragility. A systematic review and meta-analysis, excluding ACS patients,
confirmed the benefits of reducing SBP [5, 6]. However, it is crucial to
recognize that lower BP is not universally better, particularly for certain
patient populations like those with ACS. In the ONTARGET and TRANSCEND trials,
patients treated for hypertension with an SBP
Limited studies have investigated the phenomenon of J-shaped or U-shaped curves in ACS individuals. Consistent with our observations, a J-shaped curve was shown for the relationship between admission SBP and 2-year cardiovascular mortality in elderly ACS patients [14]. The Acute Coronary Syndrome Israel Survey (ACSIS) revealed that patients admitted with an SBP below 110 mmHg experienced significantly higher all-cause mortality at both 7-day and 1-year compared to those with admission SBP (110–140 mmHg) [25]. Additionally, both lower and higher SBPs were related to increased risks for different outcomes in AMI patients, with the risk associated with lower SBP being greater than that of a higher SBP [26, 27, 28]. However, it is crucial to highlight that the aforementioned studies primarily concentrated on the relationship between BP and adverse clinical outcomes in ACS patients, without investigating the optimal BP levels related to the minimal risk of such adverse endpoints.
The optimal levels of BP in patients with ACS have not been adequately defined. Previous studies identified a J-shaped curve between SBP/DBP and cardiovascular risks, with a nadir of 136/85 mmHg in ACS patients [29]. Similarly, the J-shaped curve was observed for SBP in relation to AMI prognosis, with a nadir at 114 mmHg [26]. Our findings are concordant with previous studies indicating a J- or U-shaped curve between BP and adverse endpoints. However, our results diverge somewhat from earlier results. One possible explanation for this divergence could be differences in data quality, sample sizes and confounders adjusted in the models. Furthermore, few studies have investigated the direct impact of admission BP levels on both short-term and long-term outcomes in ACS patients receiving PCI. Unlike prior research focusing on hypertension cohorts or broader ACS populations, our study specifically targeted STEMI patients. Given the widespread availability of PCI, the majority of ACS patients can receive reperfusion therapy in a timely manner. Therefore, our study specifically examined STEMI patients undergoing PCI and also found that the J- or U- shaped curve phenomenon was not alleviated by reperfusion therapy.
Both lower and higher SBP are associated with increased risks for the prognosis
of AMI, with a lower SBP creating a greater risk compared to that of a higher SBP
[27, 28]. In contrast to studies conducted by US and European researchers, a
small Japan–based study found an average admission SBP in the range of 141–159
mmHg, while ventricular rupture–related deaths were more frequently observed in
both the group with SBP
Interestingly, paradoxical findings have emerged, suggesting
that elevated SBP levels might have protective effects concerning short-term
mortality and improved in-hospital prognosis among ACS patients [33, 34].
Patients with an extremely elevated SBP (
The J-shaped or U-shaped relationship, particularly the higher rate of adverse events at lower BP levels observed in this study can be attributed to several reasons: (i) Coronary reperfusion is influenced by two major factors: coronary arterial pressure and myocardial oxygen consumption [37]. A lower DBP often leads to decreased coronary reperfusion, and this phenomenon is more significant in coronary atherosclerotic patients with impaired coronary flow reserve [38]. In addition, it could be proposed that STEMI patients with reduced BP suffer poor systematic health status, overstimulation of the sympathetic nervous system and severe coronary microvascular dysfunction [39]. Consequently, the poorer outcomes in patients with reduced SBP/DBP might be attributed to the compromised reperfusion of the ischemic myocardium; (ii) Low BP may represent an inability to generate a hypertensive response, potentially reflecting an epiphenomenon resulting from comorbidity burden and frailty [40]. Regarding the J-shaped concept, it has raised concerns about reverse causality, suggesting that a low SBP/DBP might merely reflect the unhealthy condition of patients rather than directly causing worse cardiovascular outcomes. Increased risk at lower DBP demonstrated, at least in part, reverse causation due to arterial aging, stiffening, or other conditions that contribute to a lower DBP. However, the CLARIFY trial argued against this viewpoint, as the authors excluded certain conditions that affect life expectancy and other serious diseases. Even after adjusting for factors like heart failure, peripheral artery disease, and specific baseline characteristics, the link between low SBP/DBP and a higher risk of cardiovascular events remains [17]. (iii) Reduced SBP/DBP might also be an epiphenomenon of damaged cardiac function [41, 42]. Nonetheless, the study indicated that low DBP remained a significant predictor of adverse events, even after adjusting for left ventricular function [43]. Although different studies have identified varying BP thresholds based on different demographic characteristics, the findings consistently indicated that patients with a low SBP/DBP experienced an elevated risk of cardiovascular outcomes compared to reference groups.
Considering age and diabetes as key risk factors in hypertension patients, the
management strategies for these populations should not be overlooked. For the
elderly, particularly those with cardiovascular disease, arterial stiffness and
multiple organ dysfunction are inevitable. However, there are no clear
recommendations for very elderly hypertension patients. The very elderly
(
This study, sourced from the CAMI database, is a retrospective observational analysis, primarily involving patients from China. Therefore, the reported relationship in STEMI patients receiving PCI between admission SBP/DBP and the risk of endpoint events should not be extrapolated to other populations, such as those with different comorbidities or from different geographical regions. Despite the adjustments for numerous baseline confounders, our multivariable model failed to account for several unmeasured factors potentially affecting outcomes, including frailty, socioeconomic status, and mental health. The underlying mechanisms in the relationship between a low SBP/DBP and adverse clinical outcomes are multifactorial and not yet fully understood, necessitating caution when generalizing our observations. Furthermore, some patient data were not fully recorded, potentially influencing the validity of the findings. Considering that the admission BP levels may have been influenced by analgesic drugs and vasoactive drugs, future studies should account for these medications and their timing as confounders in the adjusted models.
Additionally, in our studies, the nadir points of SBP/DBP for different clinical outcomes were considered preliminary exploratory results. Although these findings could provide initial clues regarding the relationship between SBP/DBP and various clinical outcomes, further research is needed in different populations to confirm the generalizability and reliability of our findings. Moreover, we observed wide confidence intervals appeared near some SBP/DBP values, indicating greater uncertainties in risk estimates for adverse clinical outcomes at these BP values. As BP levels change, the width of the confidence interval may also vary, reflecting the instability or uncertainty of the risk estimates in these regions. In future studies, the accuracy of risk prediction could be improved by increasing the sample size and refining the group criteria.
In conclusion, our observational study of admitted STEMI patients undergoing PCI revealed a J-shaped relationship between admission SBP/DBP and in-hospital mortality risk with the lowest risk at 157/94 mmHg. The optimal values fluctuated around 140/85 mmHg in the relationship between admission SBP/DBP and long-term outcomes (2-year heart failure, MACCEs, and all-cause death). Further studies will focus on several key areas. First, multicenter, prospective cohort studies will be initiated to assess the effects of different types of hypertension, such as permissive hypertension and resistant hypertension on adverse endpoints like all-cause mortality, cardiovascular outcomes and cardiovascular-kidney-metabolic syndrome. Additionally, it is worth exploring the association between long-term BP variation and adverse clinical outcomes through advanced wearable devices. Finally, with the continued advancement of artificial intelligence, the analysis of large-scale population data on BP can be facilitated through artificial intelligence, machine learning and other advanced techniques for personalized and automatic identification, classification, and prediction.
The data supporting the findings of this study are available at https://www.chictr.org.cn/ with the registration number ChiCTR-ONC-12002636. However, the data is not publicly accessible at the moment. It can be obtained from the author, Yuejin Yang (yangyj_fw@126.com), upon reasonable request.
ZS and YJ designed the research study. CD and ZS conducted the research. CD performed the formal statistical analysis. ZS and CD were responsible for writing, reviewing, and revising the original draft, and for providing the visualizations for this research. YY, HQ, WY and JY conducted an initial review of the article’s theme and content, offering valuable help and suggestions for revisions. YY provided the data. All authors contributed to the interpretation of the data and writing of the manuscript. All authors read and approved the final manuscript. All authors have participated sufficiently in the work and agreed to be accountable for all aspects of the work.
The study was approved by the central institutional review board at Fuwai Hospital and by the ethics committees of all participating institutions (431). Written informed consent was obtained from every enrolled participant. The study was carried out in accordance with the guidelines of the Declaration of Helsinki.
Not applicable.
The work was supported by the grants from the National High Level Hospital Clinical Research Funding (2023-GSP-GG-32).
The authors declare no conflict of interest.
Supplementary material associated with this article can be found, in the online version, at https://doi.org/10.31083/RCM33512.
References
Publisher’s Note: IMR Press stays neutral with regard to jurisdictional claims in published maps and institutional affiliations.