


 , Mei Chen 2,†, Chen Zhu 1, Yang Liu 1,3,*
1 Department of Internal Medicine and Pediatrics, Clinical College of Qilu Medical University, 255300 Zibo, Shandong, China
2 Department of Nursing Science, Clinical College of Qilu Medical University, 255300 Zibo, Shandong, China
3 Department of Cardiology, Affiliated Hospital of Qilu Medical University, 255213 Zibo, Shandong, China
†These authors contributed equally.
Abstract
High thoracic epidural blockade (HTEB) with local anti-sympathetic effects modulates cardiac performance in patients undergoing cardiac or non-cardiac surgeries. However, the short-term cardio-protective effects of HTEB in non-operative patients with ischemic heart disease (IHD) and heart failure (HF) remain unclear. Our study aimed to pool evidence regarding the benefits of adjunctive HTEB intervention in patients with IHD and HF.
Exposures were defined as non-operative patients with IHD and HF who received adjunctive HTEB intervention and/or conventional medical treatment (CMT). The primary outcomes were clinical recovery indicator assessments, electrocardiographic and ultrasonic index improvement, laboratory tests, and hemodynamic benefits provided by adjunctive HTEB treatment. The secondary outcome was the effectiveness rate and adverse side effects after HTEB intervention. The pooled analyses of continuous variables were conducted using a fixed-effects model and the effects were represented by the weighted mean difference (WMD) and a 95% confidence interval (CI). The effective rates of HTEB treatment were represented using odds ratios (ORs, 95% CI) or effect size (ES, 95% CI). The I2 statistic was used to identify any inconsistency in the pooled results from individual trials. A meta-regression and subgroup analysis were conducted when inconsistencies in individual trials were detected.
HTEB treatment was associated with a significant 10% increase in left ventricular ejection fraction (summary WMD, 9.651 [95% CI: 9.082 to 10.220]), a decline in neuroendocrine hormone levels, myocardial ischemia relief, improvement in hemodynamics, and the reversal of decompensated cardiac remodeling. HTEB treatment is more effective than conventional medical treatment (odds ratio, 5.114 [95% CI: 3.189 to 8.203]) in treating HF and angina pectoris.
Our results suggest that HTEB intervention may be a complementary approach for cardiac rehabilitation in patients with IHD and HF. However, more data are necessary to confirm these findings due to the significant heterogeneity of the included studies.
Keywords
- high thoracic epidural blockade
- heart failure
- ischemic heart disease
- systematic review
Heart failure (HF) is the end-stage of multiple cardiovascular diseases and has
become the leading cause of death worldwide [1]. HF is characterized by a
multi-faceted syndrome with clinical symptoms and signs resulting from cardiac
dysfunction, which is associated with a high risk of mortality in hospitalized
patients. HF has been categorized into three phenotypes based on left ventricular
ejection fraction (LVEF) measurements: HF with preserved (HFpEF: LVEF
Several newly developed anti-HF drugs have been introduced in recent years,
including mineralocorticoid receptor antagonists (MRAs), soluble guanylate
cyclase (sGC) stimulators, sodium–glucose transport protein 2 inhibitors,
selective vasopressin V2 receptor antagonists, novel anti-renin–angiotensin
system (RAS) agents, calcium sensitizers, and the If channel inhibitor [4].
Patients diagnosed with HFrEF should receive standard pharmacological treatment,
including a combination of an angiotensin-converting enzyme inhibitor
(ACE-I)/angiotensin receptor–neprilysin inhibitor (ARNI), a beta-blocker, a MRA,
and a sodium–glucose co-transporter 2 inhibitor (SGLT2i), which comprise the
foundation of pharmacotherapy for HFrEF patients. Sacubitril/valsartan, a
representative ARNI, is recommended as a first-line therapy instead of an ACE-I
or angiotensin II receptor blocker (ARB) in patients with HFrEF [4]. The
administration of sacubitril/valsartan has been associated with several
advantageous outcomes, including improvement in symptoms and quality of life, a
decrease in the occurrence of diabetes necessitating insulin therapy, a
mitigation of the decline in estimated glomerular filtration rate (eGFR), as well
as a lower incidence of hyperkalemia. Patients starting sacubitril/valsartan
should have adequate blood pressure and an estimated GFR greater than or equal to
30 mL/min/1.73 m2 [4]. Beta-blockers, ACE-I/ARB/ARNI, and SGLT2i were
independently associated with a lower risk of all-cause mortality in patients
with HF. Nevertheless, anti-sympathetic therapy remains an important component in
the comprehensive treatment of HF. Accumulating evidence suggested that
exacerbated sympathetic nerve discharge and a progressive loss of rhythmic
sympathetic oscillation contribute to the hyper-adrenergic state associated with
HF [5]. Levine and colleagues [6] found significant correlations between plasma
norepinephrine concentrations and hemodynamic evidence associated with congestive
HF, while sympathetic stimulation contributed to renin release. The results by
Levine et al. [6] implicated that the sympathetic response contributes
to the hemodynamic derangement observed in HF patients. These pathophysiological
changes can lead to a diminished compensatory response to increased cardiac load,
ultimately facilitating cardiac enlargement, symptomatic mitral regurgitation,
and systolic dysfunction [6, 7, 8].
The impact of high thoracic epidural blockade (HTEB) with thoracic epidural anesthesia on the postoperative neurohumoral stress response and cardiovascular pathophysiology has been the focus of extensive clinical and experimental research for several years [12]. Some investigators have raised questions about the effect of HTEB on systolic left ventricular function. Results from studies on the HTEB effect have varied, indicating that it may be unchanged, impaired, or even improved in healthy individuals. Some of these studies found that HTEB potentially increased the luminal dimensions of stenotic coronary vessels, thereby reducing coronary blood flow [13]. HTEB may also help alleviate severe refractory unstable angina pectoris by improving abnormalities in coronary function, and can complement traditional medication treatments to achieve better therapeutic effects [14]. Nevertheless, recent well-designed clinical trials on HTEB intervention primarily concentrated on the anti-ischemic and antiarrhythmic properties in patients with coronary artery disease (CAD) or those undergoing surgery [12, 14]. There is limited information in the scientific literature regarding non-surgical HF patients. Some studies have found that adjunctive cardiac sympathetic blockade produces favorable hemodynamic effects during rehabilitation management for HF; meanwhile, the combination of HTEB and conventional medical treatment (CMT) also demonstrated superior therapeutic effects in hospitalized patients with dilated cardiomyopathy [15, 16]. Regrettably, compared to well-designed clinical trials conducted recently, earlier studies did not strictly adhere to randomized principles and exhibited varying degrees of flaws in their design. Additionally, since most relevant results were published in Chinese, these data received limited attention and were not widely recognized. However, these findings may provide important insights into the neuroregulation of HF and the changes in cardiac performance following local cardiac sympathetic blockage in the context of abnormal hemodynamics associated with HF. Therefore, the current study aimed to consolidate evidence from published articles regarding the effectiveness of HTEB for managing ischemic heart disease (IHD) and HF.
The methods applied in this study adhered to the Preferred Reporting Items for Systematic Reviews and Meta-Analyses (PRISMA) guidelines [17]. The review protocol was not registered.
We searched the PubMed, Web of Science, Embase, and Chinese National Knowledge Infrastructure (CNKI) databases. The Medical Subject Headings (MeSH) terms and keywords included “thoracic epidural blockade”, “cardiac sympathetic blockade”, “thoracic epidural analgesia”, “epidural anesthesia”, “epidural analgesia”, “cardiac sympathectomy”, “heart failure”, “ischemic heart disease”, “dilated cardiomyopathy”, “angina”, “coronary artery disease”, “left ventricular ejection fraction”, and “left ventricular function”. These terms were used to conduct an integrative search of the aforementioned databases. The search strategy is detailed in Supplementary Table 1.
Clinical trials were identified from systematic literature searches in the databases mentioned above. The cardiac diseases involved IHD with or without HF, and HF due to various cardiovascular disorders. The diagnostic criteria of HF and other types of cardiac diseases were based on the World Health Organization (WHO) guidelines and the Chinese Guidelines for Diagnosis and Treatment of HF cited in the included studies. To reduce the bias of the selected studies, we also screened valuable conference abstracts or published supplementary issues on HTEB treatment. The languages of publication included, but were not restricted to, English and Chinese. We included two types of clinical trials: case–control trials and case–series reports; two groups of patients were noted in the case–control trials. One group of patients received a combination of HTEB and CMT treatment, whereas the other group only received CMT treatment. The trials also described comparing cardiac outcomes between the two groups of patients before and after treatment. In the case–series reports, the patients received combinations of HTEB and CMT treatments with no control arm, and the comparisons of cardiac outcomes were conducted pre- and post-treatment. We excluded the isolated case reports, HTEB combined with general anesthesia, and those undergoing cardiac or other surgery.
Two independent reviewers (DYG and MC) extracted data based on the baseline characteristics of each patient, study design, and treatment or control agents. Another author assisted with the data extraction (CZ). The quality of the individual case–control articles (randomized assignment) was assessed according to the Jadad score [18]. The Newcastle–Ottawa Scale (NOS) was added for additional evaluation of the case–control trials [19]. The case–series studies were evaluated using the developing tool from the Institute of Health Economics (IHE) [20]. This tool contains 21 independent items that assess the quality of the case reports. Any discrepancies were resolved through consensus. If a consensus could not be reached, the author (YL) decided on data extraction and trial eligibility. The protocol for this analysis was not registered.
Clinical indicators included heart rate (HR), systolic blood pressure (SBP), diastolic blood pressure (DBP), mean arterial blood pressure (MBP), and the New York Heart Association (NYHA) cardiac functional classification.
Ultrasound indicators: LVEF, left ventricular fraction shortening (LVFS), left ventricular end-systolic dimension (LVESD), left ventricular end-diastolic dimension (LVEDD), left atrial dimension (LAD), left ventricular end-diastolic volume (LVEDV), left ventricular end-systolic volume (LVESV), left ventricular weight (LVW), right ventricle transverse dimension (RVTD), right atrium end-diastolic transverse dimension (RATD), MRA, tricuspid regurgitation area (TRA), pulmonary arterial pressure (PAP), and cardiac index.
Curative effect: total effective rate, excellence rate, and inefficiency rate.
Clinical indicators: frequency of ischemic episodes, duration of ischemic episodes, mean HR, SBP, DBP, MBP, NYHA cardiac functional classification, and 6-minute walk distance test (6-MWD).
Cardio-electronic indicators:
Radiological indicator: Cardiothoracic ratio (CTR).
Ultrasound indicators: LVEF, LVFS, LAD, LVEDD, LVESV, LVEDV, A/E peaking ratio, and E/A peaking ratio. Laboratory indicators: plasma N-terminal pro-B-type natriuretic peptide (NT-pro BNP), serum angiotensin-converting enzyme 2 (Ang II), and norepinephrine (NE).
Hemodynamic indicators: cardiac output (CO), stroke volume (SV), cardiac index, mean pulmonary arterial pressure (mPAP), pulmonary capillary wedge (PCW), pulmonary vascular resistance indices (PVRIs), stroke volume index (SVI), and systemic vascular resistance indices (SVRIs).
Curative effect: total effective rate, excellence rate, and inefficiency rate.
Clinical indicators: HR, SBP, DBP, MBP, and the NYHA cardiac functional classification.
Ultrasound indicators: LVEF, LVFS, LAD, LVEDD, LVESV, LVEDV, and CI.
Curative effect: total effective rate, excellence rate, and inefficiency rate.
The incidence of adverse events related to HTEB was assessed in the individual studies, and the percentage of each event is reported.
The primary data of the NYHA cardiac functional classification in some of the
included studies was reported as the difference in the mean (M)
(1) 1 kpa
The reported hemodynamic indices measured using cardiac catheterization were converted according to the formula:
A continuous variable in individual studies was presented as the weighted mean difference (WMD) with a 95% confidence interval (CI) when comparing adjunctive HTEB treatment to CMT alone in 24 case–control trials, as well as the change in outcomes pre- and post-HTEB treatment in 38 case–series studies. The effective rate was analyzed using a fixed-effect model and a random-effects model. When high heterogeneity existed between the adjunctive HTEB and CMT groups of individual examinations in 24 case–control trials, the summary ORs and 95% CIs were applied to represent the results. In analyzing 38 case–series and merged studies, a single rate meta-analysis was conducted using the representative effect size (ES) and 95% CI. The merged analyses (HTEB groups of case–control trials and case–series studies) were conducted by comparing the main parameters between pre- and post-adjunctive HTEB treatment. When high heterogeneity existed, the pooled effects were calculated using a fixed-effect model and a random-effects model.
Inconsistency among the eligible studies was detected using the I2 statistic [21]. Moreover, meta-regression of covariates and a subgroup analysis were conducted when significant heterogeneity was identified. Potential publication bias was evaluated using the Egger’s test for case–control trials and case–series studies. Results were deemed statistically significant at a p-value of less than 0.05. The analytical procedure was achieved using STATA 12.0 software (StataCorp, College Station, TX, USA).
A total of 25 case–control trials [14, 16, 22, 23, 24, 25, 26, 27, 28, 29, 30, 31, 32, 33, 34, 35, 36, 37, 38, 39, 40, 41, 42, 43, 44] and 38 case–series studies [13, 45, 46, 47, 48, 49, 50, 51, 52, 53, 54, 55, 56, 57, 58, 59, 60, 61, 62, 63, 64, 65, 66, 67, 68, 69, 70, 71, 72, 73, 74, 75, 76, 77, 78, 79, 80, 81] were included. The case–control trials included 23 random assignment trials [14, 16, 23, 24, 25, 26, 27, 28, 29, 30, 31, 32, 33, 34, 35, 36, 37, 38, 39, 40, 41, 42, 44], one observational study [22], and one retrospective study [43]. In the case–control trials, there were eight trials on dilated cardiomyopathy [14, 22, 25, 26, 29, 31, 32, 33], four trials on ischemic cardiomyopathy [35, 37, 41, 43], two trials on myocardial infarction [30, 40], five trials on angina pectoris [14, 23, 24, 38, 39], four trials on multiple cardiovascular disease [27, 28, 42, 44], and one trial on peripartum cardiomyopathy [36].
Additionally, we included 38 case–series studies to evaluate additional cardiac indicators in patients receiving adjunctive HTEB treatment; these included nineteen reports on coronary artery disease [13, 45, 46, 47, 48, 49, 50, 51, 52, 53, 54, 55, 57, 60, 62, 68, 69, 70, 71], seven reports on dilated cardiomyopathy [56, 58, 59, 61, 63, 67, 81], one report on Keshan disease (endemic cardiomyopathy) [64], one report on alcoholic cardiomyopathy [65], one report on familial dilated cardiomyopathy [66], two reports on diabetic cardiomyopathy or HF with type II diabetes [72, 73], four reports on multiple cardiovascular diseases [74, 75, 78, 79], one report on HF with AF [76], one report on hypertrophic cardiomyopathy [77], and two reports on valvular heart diseases [79, 80]. Fig. 1 presents the PRISMA selection flowchart and the analytical protocol. Supplementary Table 4 outlines the clinical characteristics of patients in individual studies. Supplementary Table 5 presents the deciphered therapeutic methods.
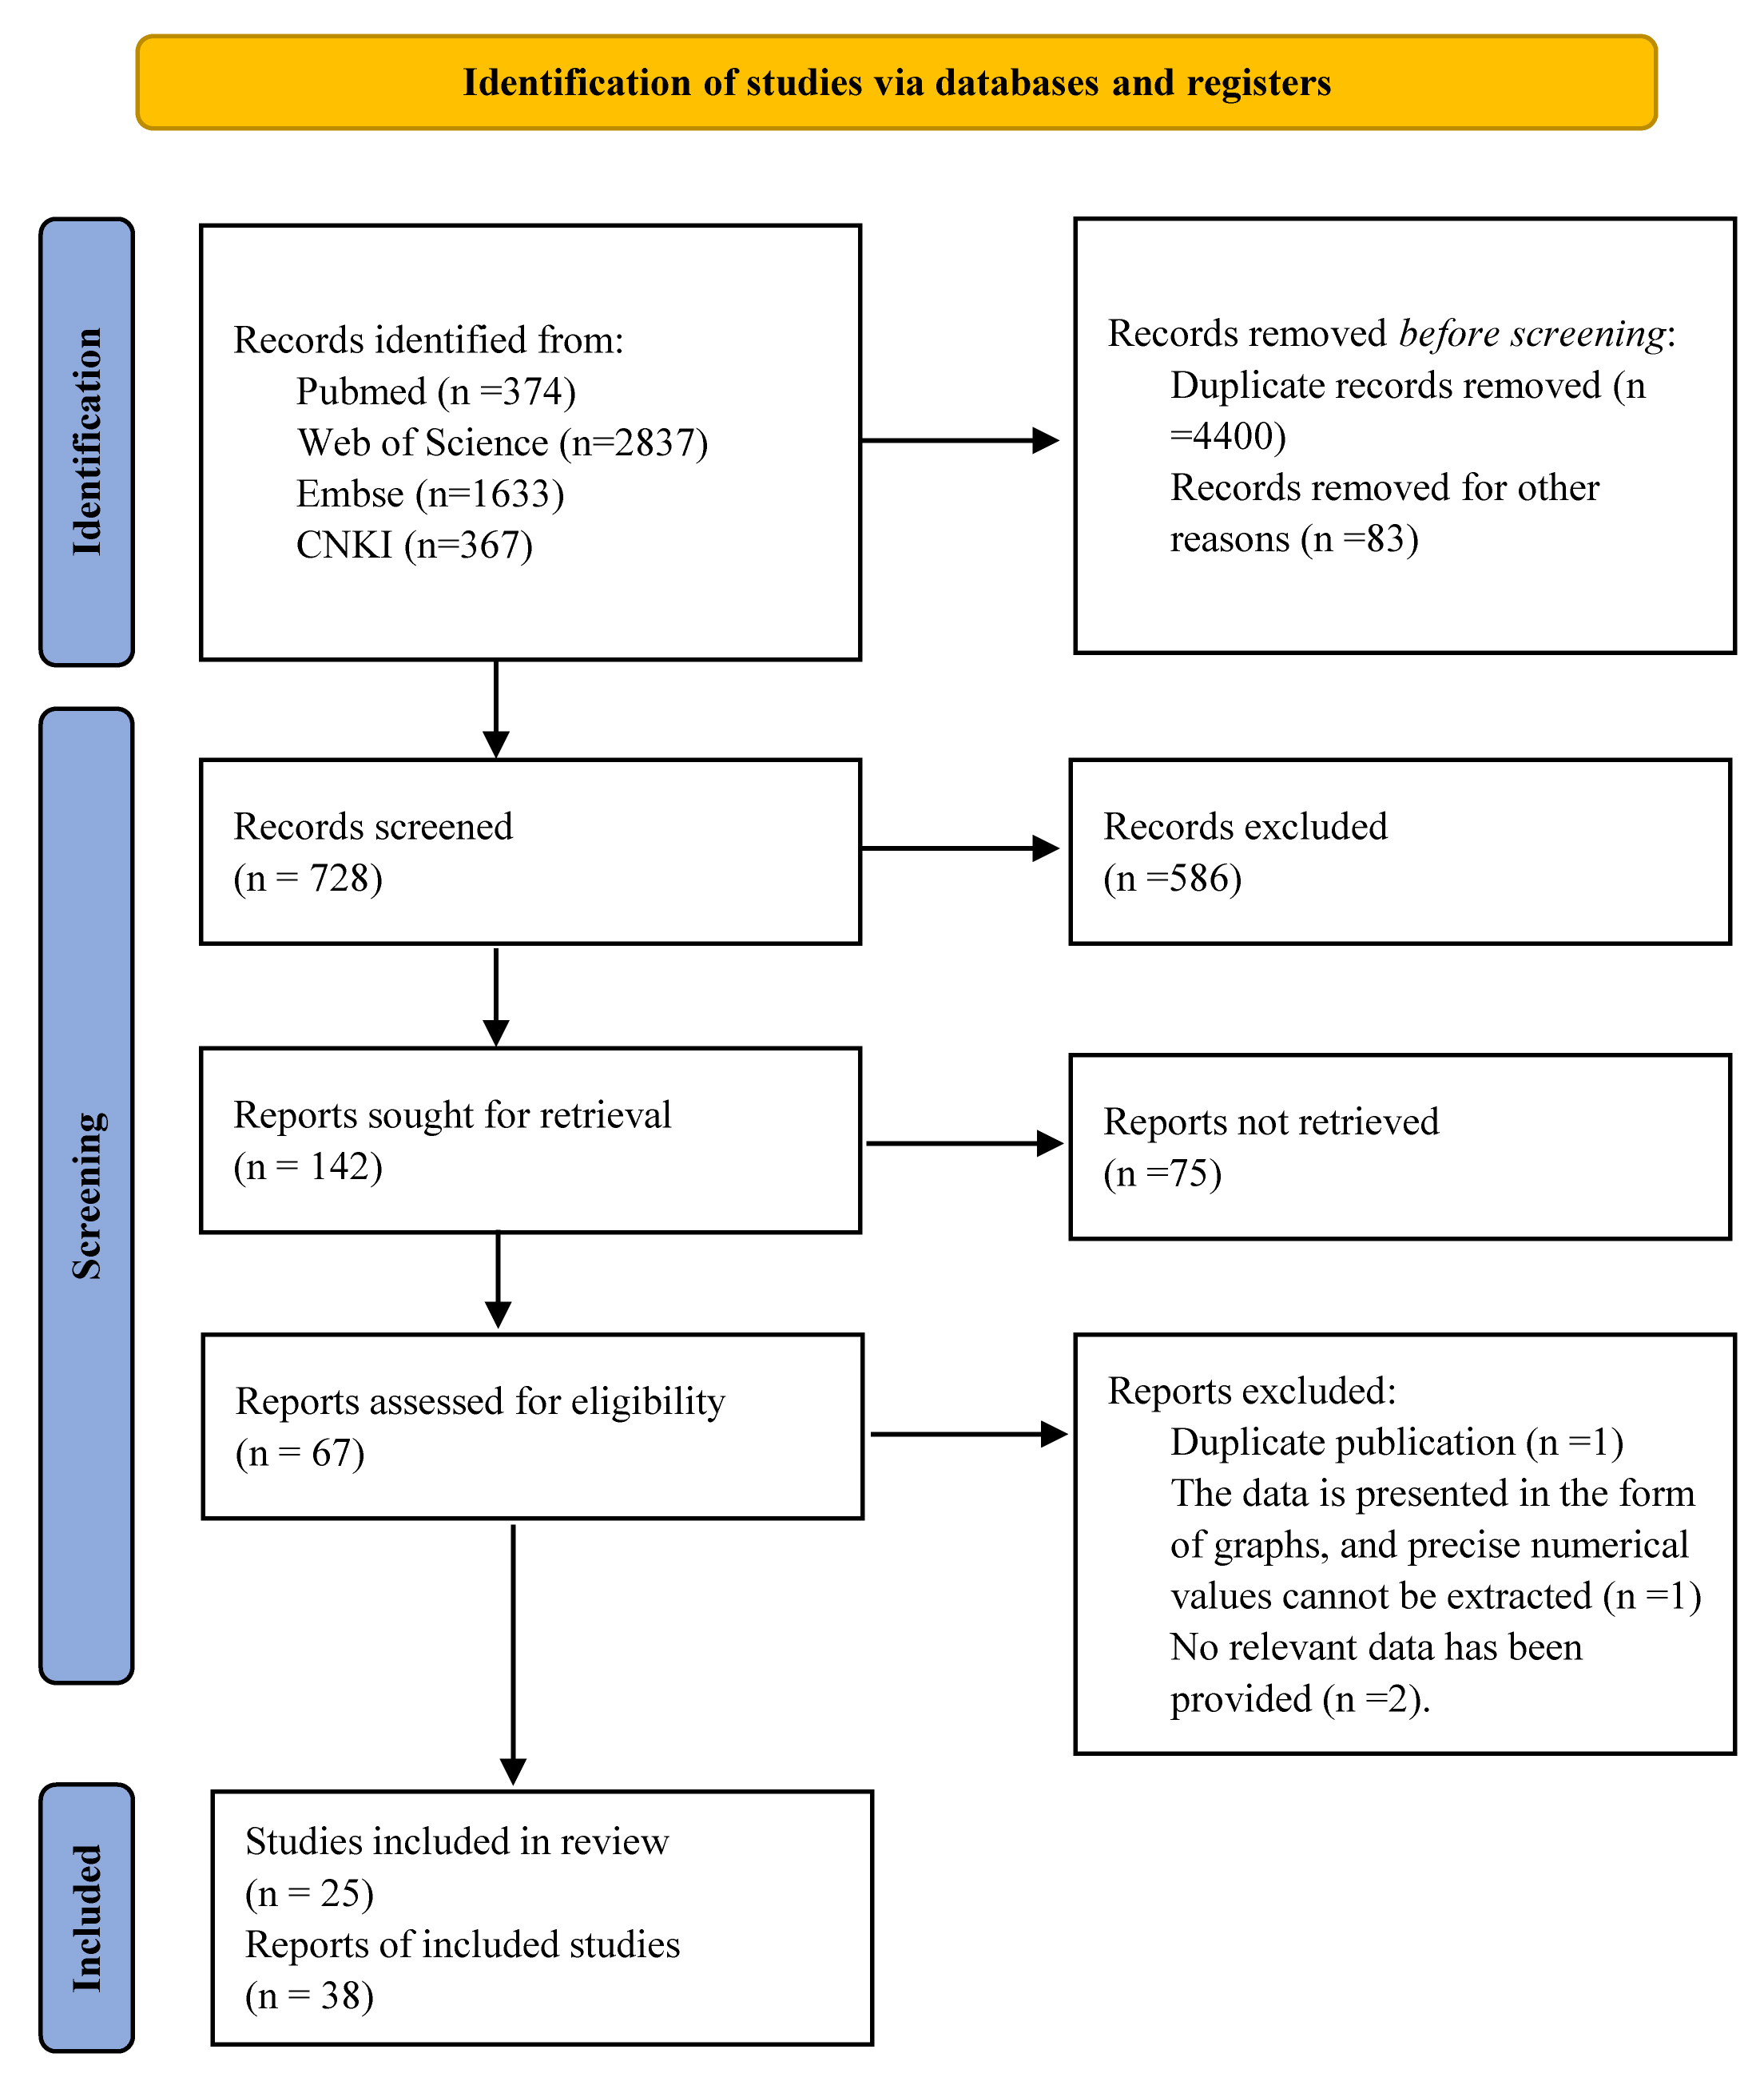 Fig. 1.
Preferred Reporting Items for Systematic Reviews and Meta-Analyses (PRISMA) flowchart and analytical protocol. CNKI, Chinese National Knowledge Infrastructure.
A total of 25 case–control trials reported randomization allocation, but only
two trials were strictly adherent (Supplementary Table 6) [42, 44].
Therefore, we added the NOS, a tool for evaluating the risk of bias in
non-randomized studies, which can provide more information on the study methods.
The total score of the 24 studies was estimated to be up to six points [14, 22, 23, 24, 25, 26, 27, 28, 29, 30, 31, 32, 33, 34, 35, 36, 37, 38, 39, 40, 41, 42, 43, 44], with only one study estimated to be up to eight points
(Supplementary Tables 7 and 8) [16]. All but one (Chi
et al. [16], 2011) case–control study lacked the adequacy of follow-up
of cohorts. Meanwhile, the case–series studies were estimated using modified
tools developed by the IHE. A total of 21 IHE items are listed in
Supplementary Table 9. Most of the case–series studies fulfilled items
1, 2, 5 to 12, 15, and 17; a few studies met items 3, 4, 13, 14, 16, 18, and 19
(Supplementary Table 10). In total, 24 studies used
Based on the pretreatment effects of LVEF (16 studies) and LVEDD (16 studies)
between the two groups in the 25 case–control studies, the Egger’s test
indicated that there was no significant publication bias for LVEF (coefficient:
0.494, 95% CI: –0.695 to 1.683; p
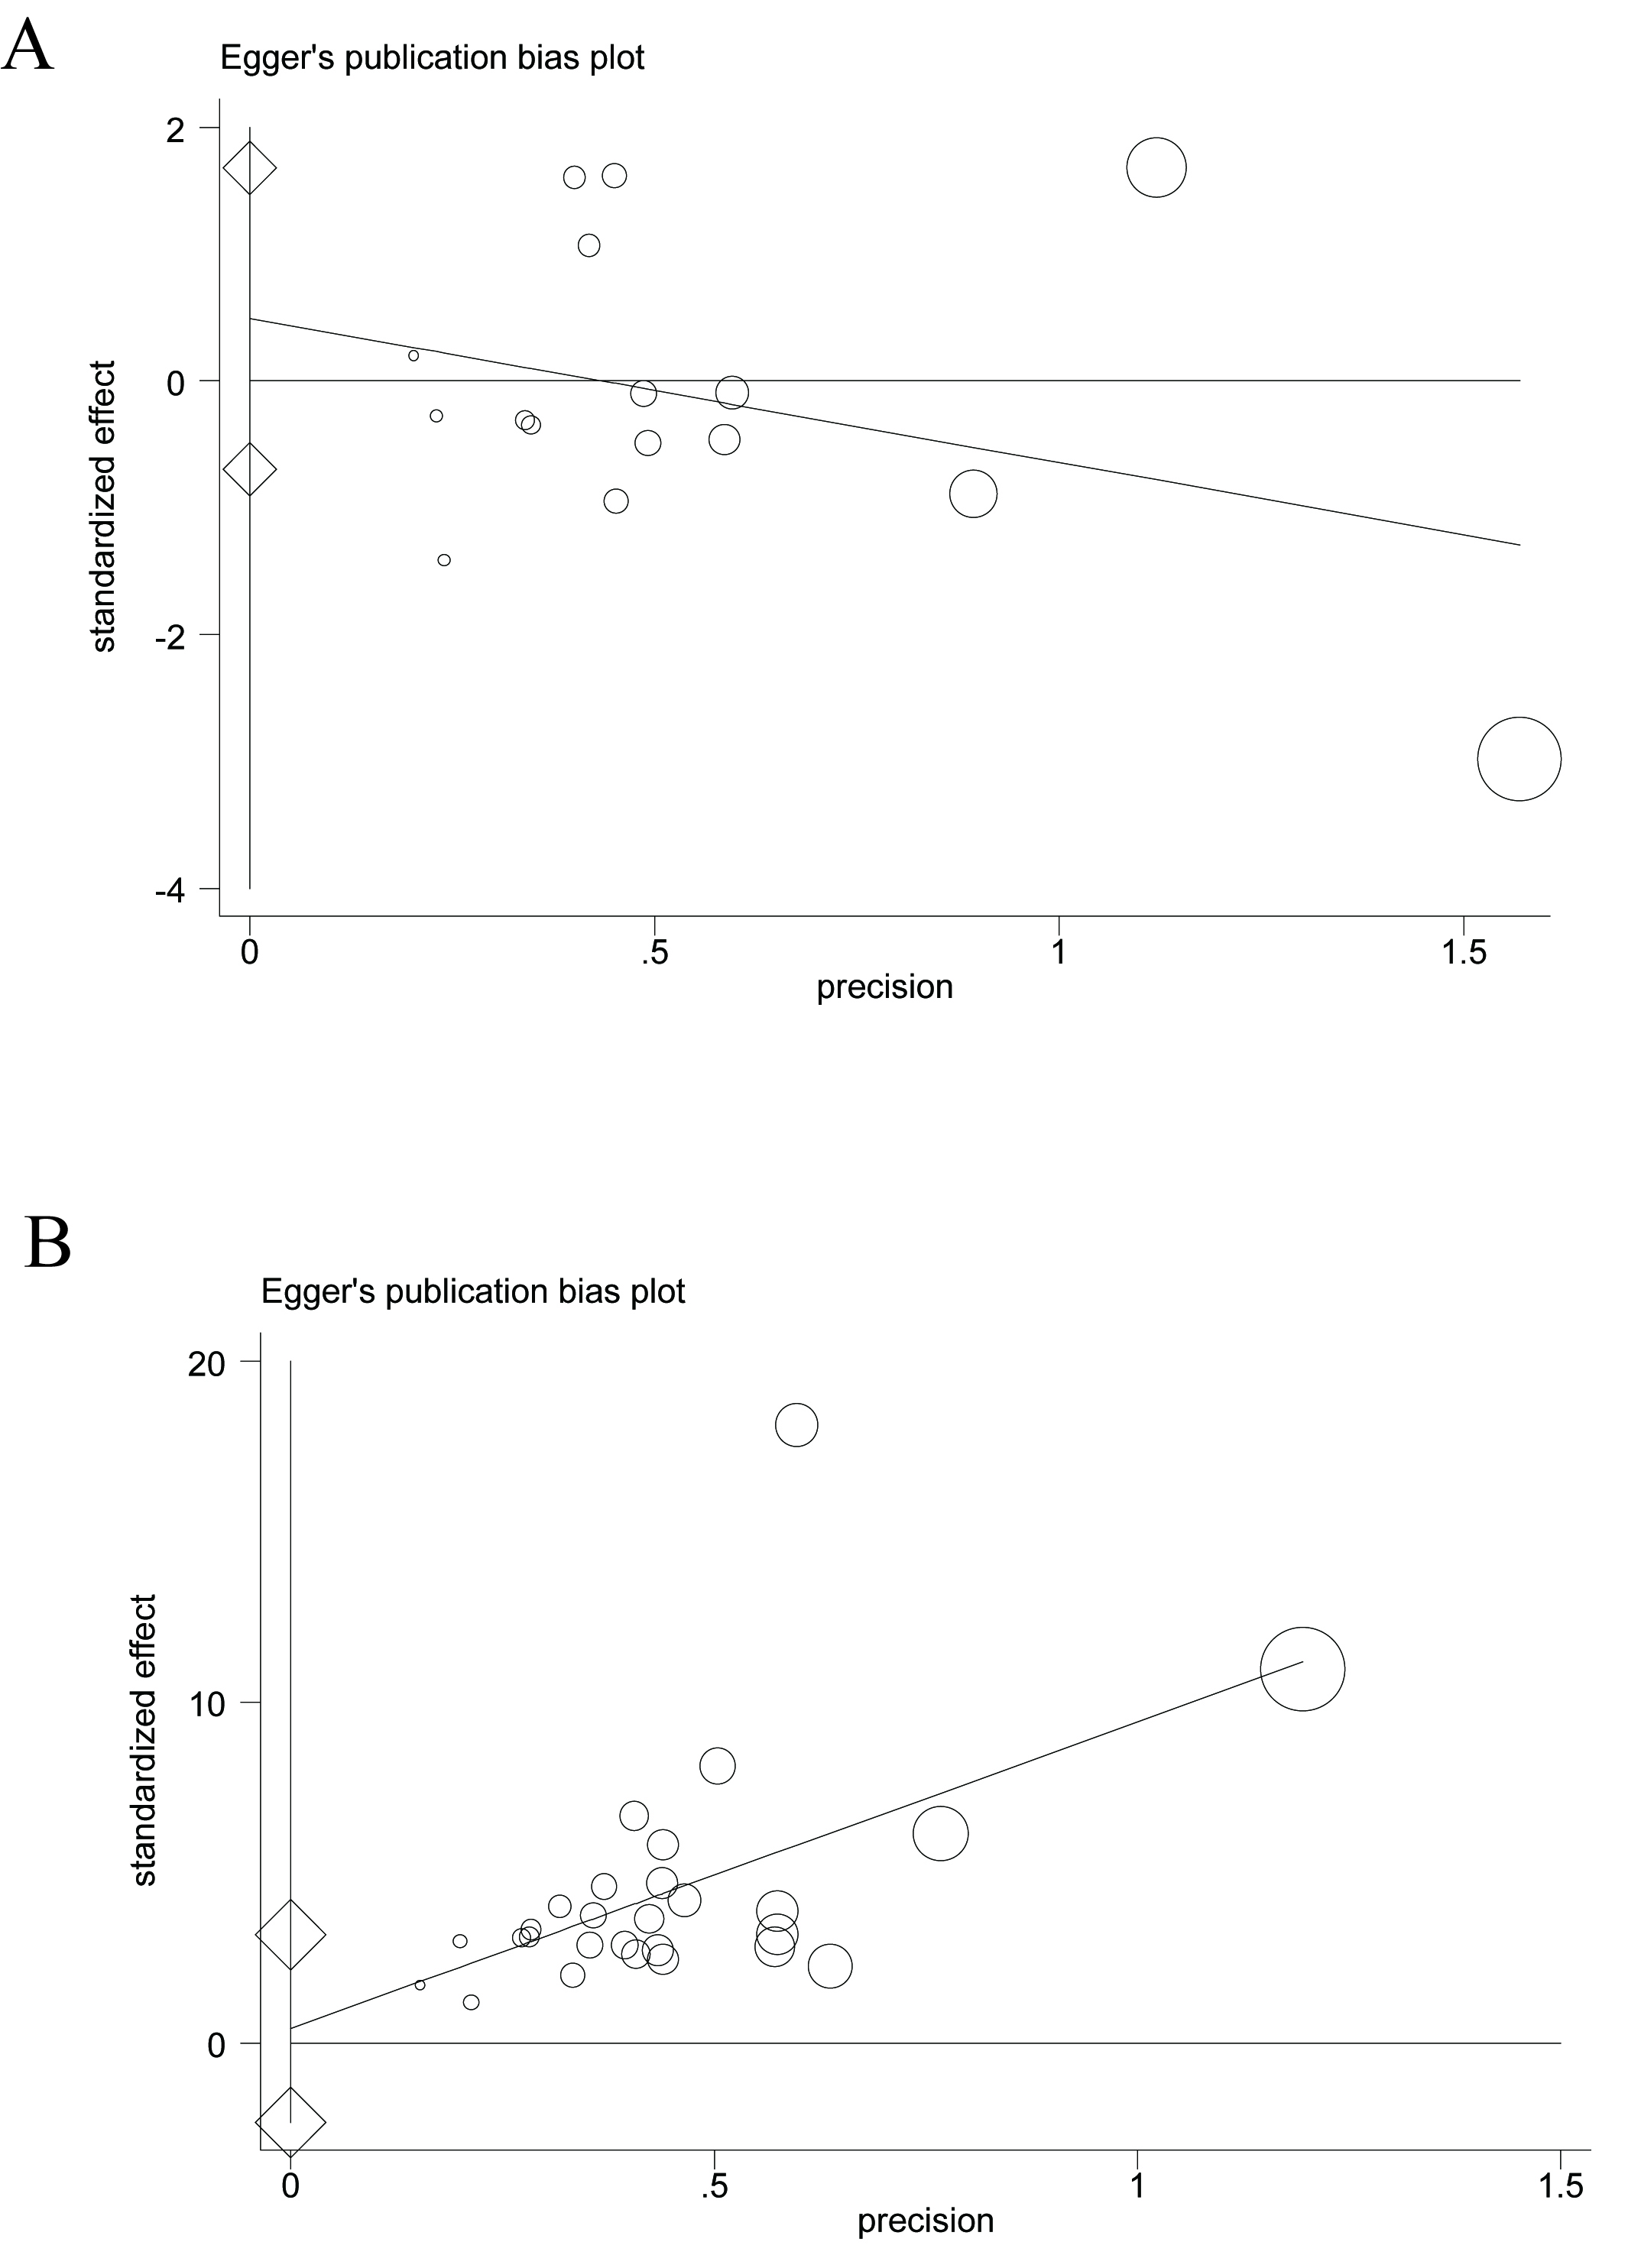 Fig. 2.
An estimation of the publication bias based on the left ventricular ejection fraction (LVEF) effect by the Egger’s test. (A) Case–control studies, (B) case–series studies.
Complications were estimated in 1818 patients undergoing an HTEB intervention. Hypotension (0.39%), feeling weak (0.61%), dizziness (0.55%), infection (0.17%), bleeding (0.11%), local inflammation (0.28%), catheter detachment or occlusion (0.61%), pain (0.17%), Horner’s syndrome (0.22%), and urinary retention (0.55%) were reported as complications related to HTEB. Cardiac arrest or mortality (0.17%) was unrelated to HTEB intervention (Supplementary Table 11). No severe complications, such as respiratory depression, hematomas, thromboembolism, cardiac arrest, or death, were reported after HTEB treatment in the reviewed studies.
No significant difference was observed in the pooled effects of indicators
between pre-HTEB treatment and pre-CMT. HTEB treatment was associated with a
significant reduction in HR, blood pressure (BP), and NYHA cardiac functional
classification (WMD = –0.602 grade, 95% CI: –0.691 to –0.513, p =
0.000, I2 = 87.4%) compared to CMT. HTEB treatment significantly
improved cardiac function, including LVEF (WMD = 5.589%, 95% CI: 4.727 to
6.451, p = 0.000, I2 = 62.2%), LVFS (WMD = 0.799%, 95%
CI: 0.587 to 1.011, p = 0.000, I2 = 45.4%), and CI (WMD =
0.372 L min-1 m-2, 95% CI: 0.305 to 0.438, p = 0.000,
I2 = 0%). In contrast, HTEB treatment reduced cardiac compensative
expansion, LAD (WMD = –2.604 mm, 95% CI: –3.719 to –1.488, p =
0.000, I2 = 0.9%), LVESD (WMD = –4.114 mm, 95% CI: –6.954 to
–1.275, p = 0.005, I2 = 0.0%), LVEDD (WMD = –3.593 mm,
95% CI: –4.432 to –2.754, p = 0.000, I2 = 22.8%),
LVESV (WMD = –37.601 mL, 95% CI: –52.050 to –23.153, p = 0.000,
I2 = 66.8%), LVEDV (WMD = –30.072 mL, 95% CI: –50.169 to
–9.975, p = 0.003, I2 = 0.0%), LVW (WMD = –41.002
g/m2, 95% CI: –51.014 to –30.990, p = 0.000, I2 =
21.6%), and mitral regurgitation area (WMD = –1.734 mm2, 95% CI: –2.810
to –0.658, p = 0.002, I2 = 87.4%) compared to CMT alone.
HTEB also alleviated right heart expansion (RATD: WMD = –2.926, 95% CI: –4.585
to –1.266, p = 0.001, I2 = 51.2%; RVTD: WMD = –5.149,
95% CI: –6.807 to –3.491, p = 0.000, I2 = 79.7%),
tricuspid regurgitation area (WMD = –2.866 mm2, 95% CI: –3.914 to
–1.819, p = 0.000, I2 = 92.1%), and pulmonary arterial
pressure (WMD = –17.196 mmHg, 95% CI: –22.036 to –12.356, p = 0.000,
I2 = 0.0%). HETB treatment significantly decreased plasma BNP
concentrations (WMD = –210.429 pg/mL or ng/L, 95% CI: –217.478 to –203.380,
p = 0.000; I2 = 80.2%) compared to CMT alone. Due to the
significant heterogeneities observed in the pooled results of indicators among
the included literature, indicated by the fixed-effects model, we included a
random-effects model to reanalyze these results, particularly for studies with an
I2 greater than 75%. Consistent results were observed from the
random-effects model, excluding the indicators, mean arterial blood pressure
(p for effect
The pooled results indicated that HTEB treatment is more efficient than CMT alone, as the total effective rate: OR, 5.114 (95% CI: 3.189 to 8.203), p = 0.000, I2 = 0%, and the excellence rate: OR, 2.828 (95% CI: 1.968 to 4.063), p = 0.000, I2 = 0%. HTEB treatment was less inefficient than CMT alone (OR, 0.186 [95% CI: 0.112 to 0.307], p = 0.000, I2 = 0%). The detailed results are presented in Table 1.
| Parameters | Number of studies | Pooled weighted mean difference (WMD) and 95% confidence interval | p-value for WMD | I-squared (I2, %) | p-value for heterogeneity | |
| Heart rate (times per min) | ||||||
| Post-HTEB versus pre-HTEB | 8 | –12.197 (–13.328, –11.066) | 0.000 | 94.4% | 0.000 | |
| Random-effects model | –12.126 (–17.348, –6.904) | 0.000 | 94.4% | 0.000 | ||
| Post-CMT versus pre-CMT | 7 | –6.681 (–8.211, –5.152) | 0.000 | 79.1% | 0.000 | |
| Random-effects model | –5.795 (–9.652, –1.937) | 0.003 | 79.1% | 0.000 | ||
| Pre-HTEB versus pre-CMT | 7 | 1.213 (–0.501, 2.926) | 0.766 | 0.0% | 0.166 | |
| Post-HTEB versus post-CMT | 9 | –7.851 (–8.556, –7.147) | 0.000 | 84.3% | 0.000 | |
| Random-effects model | –7.347 (–9.646, –5.047) | 0.000 | 84.3% | 0.000 | ||
| Systolic blood pressure (mmHg) | ||||||
| Post-HTEB versus pre-HTEB | 6 | –18.494 (–20.632, –16.356) | 0.000 | 94.7% | 0.000 | |
| Random-effects model | –12.082 (–22.307, –1.858) | 0.021 | 94.7% | 0.000 | ||
| Post-CMT versus pre-CMT | 5 | –6.915 (–10.028, –3.802) | 0.000 | 91.3% | 0.000 | |
| Random-effects model | –1.824 (–13.664, 10.017) | 0.763 | 91.3% | 0.000 | ||
| Pre-HTEB versus pre-CMT | 4 | 2.568 (–0.461, 5.597) | 0.986 | 0.0% | 0.097 | |
| Post-HTEB versus post-CMT | 7 | –3.241 (–4.867, –1.615) | 0.000 | 92.8% | 0.000 | |
| Random-effects model | –8.030 (–15.257, –0.802) | 0.029 | 92.8% | 0.000 | ||
| Diastolic blood pressure (mmHg) | ||||||
| Post-HTEB versus pre-HTEB | 5 | –7.767 (–9.364, –6.169) | 0.000 | 92.1% | 0.000 | |
| Random-effects model | –7.169 (–13.205, –1.133) | 0.020 | 92.1% | 0.000 | ||
| Post-CMT versus pre-CMT | 4 | –4.712 (–6.153, –3.270) | 0.005 | 69.9% | 0.000 | |
| Pre-HTEB versus pre-CMT | 4 | 3.503 (1.313, 5.693) | 0.002 | 67.0% | 0.028 | |
| Post-HTEB versus post-CMT | 6 | 0.861 (0.087, 1.636) | 0.029 | 96.0% | 0.000 | |
| Random-effects model | –5.170 (–10.240, –0.100) | 0.046 | 96.0% | 0.000 | ||
| Mean arterial blood pressure (mmHg) | ||||||
| Post-HTEB versus pre-HTEB | 2 | –9.975 (–13.747, –6.203) | 0.000 | 86.8% | 0.006 | |
| Random-effects model | –8.629 (–19.451, 2.192) | 0.118 | 86.8% | 0.006 | ||
| Post-CMT versus pre-CMT | 2 | –1.725 (–5.822, 2.373) | 0.409 | 0.0% | 0.623 | |
| Pre-HTEB versus pre-CMT | 2 | –0.061 (–3.784, 3.662) | 0.974 | 0.0% | 0.450 | |
| Post-HTEB versus post-CMT | 2 | –7.992 (–12.154, –3.829) | 0.000 | 81.8% | 0.019 | |
| Random-effects model | –7.098 (–17.087, 2.890) | 0.164 | 81.8% | 0.019 | ||
| NYHA cardiac functional classification (grade) | ||||||
| Post-HTEB versus pre-HTEB | 9 | –1.319 (–1.409, –1.228) | 0.000 | 84.4% | 0.000 | |
| Random-effect model | –1.386 (–1.626, –1.147) | 0.000 | 84.4% | 0.000 | ||
| Post-CMT versus pre-CMT | 9 | –0.647 (–0.747, –0.546) | 0.000 | 70.5% | 0.001 | |
| Pre-HTEB versus pre-CMT | 9 | –0.019 (–0.108, 0.070) | 0.678 | 0.0% | 0.972 | |
| Post-HTEB versus post-CMT | 10 | –0.602 (–0.691, –0.513) | 0.000 | 87.4% | 0.000 | |
| Random-effects model | –0.783 (–1.052, –0.513) | 0.000 | 87.4% | 0.000 | ||
| Left ventricular ejection fraction (%) | ||||||
| Post-HTEB versus pre-HTEB | 16 | 9.472 (8.616, 10.328) | 0.000 | 77.8% | 0.000 | |
| Random-effects model | 9.776 (7.726, 11.825) | 0.000 | 77.8% | 0.000 | ||
| Post-CMT versus pre-CMT | 16 | 3.763 (2.998, 4.529) | 0.000 | 44.8% | 0.027 | |
| Pre-HTEB versus pre-CMT | 16 | –0.499 (–1.249, 0.251) | 0.192 | 28.1% | 0.141 | |
| Post-HTEB versus post-CMT | 16 | 5.589 (4.727, 6.451) | 0.000 | 62.2% | 0.001 | |
| Left ventricular fraction shortening (%) | ||||||
| Post-HTEB versus pre-HTEB | 8 | 1.270 (1.053, 1.486) | 0.000 | 21.6% | 0.258 | |
| Post-CMT versus pre-CMT | 8 | 0.364 (0.154, 0.574) | 0.001 | 0.0% | 0.595 | |
| Pre-HTEB versus pre-CMT | 8 | –0.109 (–0.311, 0.094) | 0.293 | 0.0% | 0.700 | |
| Post-HTEB versus post-CMT | 8 | 0.799 (0.587, 1.011) | 0.000 | 45.4% | 0.077 | |
| Cardiac index (L min–1 m–2) | ||||||
| Post-HTEB versus pre-HTEB | 3 | 0.633 (0.549, 0.717) | 0.000 | 92.0% | 0.000 | |
| Random-effects model | 0.950 (0.313, 1.587) | 0.003 | 92.0% | 0.000 | ||
| Post-CMT versus pre-CMT | 3 | 0.231 (0.151, 0.310) | 0.000 | 91.7% | 0.000 | |
| Random-effects model | 0.545 (0.010, 1.081) | 0.046 | 91.7% | 0.000 | ||
| Pre-HTEB versus pre-CMT | 3 | –0.051 (–0.146, 0.044) | 0.295 | 0.0% | 0.867 | |
| Post-HTEB versus post-CMT | 3 | 0.372 (0.305, 0.438) | 0.000 | 0.0% | 0.446 | |
| Left atrial dimension (mm) | ||||||
| Post-HTEB versus pre-HTEB | 8 | –4.454 (–5.602, –3.306) | 0.000 | 0.0% | 0.667 | |
| Post-CMT versus pre-CMT | 8 | –1.260 (–2.397, –0.123) | 0.030 | 0.0% | 0.978 | |
| Pre-HTEB versus pre-CMT | 8 | 0.450 (–0.738, 1.637) | 0.458 | 0.0% | 0.778 | |
| Post-HTEB versus post-CMT | 8 | –2.604 (–3.719, –1.488) | 0.000 | 0.9% | 0.422 | |
| Left ventricular end-systolic dimension (mm) | ||||||
| Post-HTEB versus pre-HTEB | 2 | –5.772 (–8.692, –2.853) | 0.000 | 0.0% | 0.830 | |
| Post-CMT versus pre-CMT | 2 | –1.743 (–4.642, 1.156) | 0.239 | 0.0% | 0.417 | |
| Pre-HTEB versus pre-CMT | 2 | –0.228 (–3.153, 2.697) | 0.879 | 0.0% | 0.883 | |
| Post-HTEB versus post-CMT | 2 | –4.114 (–6.954, –1.275) | 0.005 | 0.0% | 0.647 | |
| Left ventricular end-diastolic dimension (mm) | ||||||
| Post-HTEB versus pre-HTEB | 16 | –5.341 (–6.190, –4.492) | 0.000 | 31.1% | 0.114 | |
| Post-CMT versus pre-CMT | 16 | –0.980 (–1.915, –0.044) | 0.040 | 0.0% | 0.764 | |
| Pre-HTEB versus pre-CMT | 16 | 0.768 (–0.182, 1.719) | 0.113 | 0.0% | 0.999 | |
| Post-HTEB versus post-CMT | 15 | –3.593 (–4.432, –2.754) | 0.000 | 22.8% | 0.195 | |
| Left ventricular end-systolic volume (mL) | ||||||
| Post-HTEB versus pre-HTEB | 3 | –42.022 (–57.831, –26.213) | 0.000 | 55.7% | 0.105 | |
| Post-CMT versus pre-CMT | 3 | –5.238 (–20.319, 9.842) | 0.496 | 0.0% | 0.951 | |
| Pre-HTEB versus pre-CMT | 3 | 1.136 (–15.309, 17.581) | 0.892 | 0.0% | 0.959 | |
| Post-HTEB versus post-CMT | 3 | –37.601 (–52.050, –23.153) | 0.000 | 66.8% | 0.049 | |
| Left ventricular end-diastolic volume (mL) | ||||||
| Post-HTEB versus pre-HTEB | 3 | –36.659 (–57.129, –16.190) | 0.000 | 14.5% | 0.310 | |
| Post-CMT versus pre-CMT | 3 | –1.096 (–21.118, 18.926) | 0.915 | 0.0% | 0.976 | |
| Pre-HTEB versus pre-CMT | 3 | 4.779 (–15.711, 25.269) | 0.648 | 0.0% | 0.963 | |
| Post-HTEB versus post-CMT | 3 | –30.072 (–50.169, –9.975) | 0.003 | 0.0% | 0.375 | |
| Left ventricular weight (g/m2) | ||||||
| Post-HTEB versus pre-HTEB | 3 | –42.607 (–55.360, –29.855) | 0.000 | 16.2% | 0.303 | |
| Post-CMT versus pre-CMT | 3 | –8.429 (–17.494, 0.636) | 0.068 | 0.0% | 0.596 | |
| Pre-HTEB versus pre-CMT | 3 | –4.587 (–16.676, 7.502) | 0.457 | 0.0% | 0.858 | |
| Post-HTEB versus post-CMT | 3 | –41.002 (–51.014, –30.990) | 0.000 | 21.6% | 0.279 | |
| Mitral regurgitation area (mm2) | ||||||
| Post-HTEB versus pre-HTEB | 2 | –3.016 (–4.031, –2.000) | 0.005 | 87.4% | 0.000 | |
| Random-effects model | –4.007 (–7.622, –0.392) | 0.030 | 87.4% | 0.005 | ||
| Post-CMT versus pre-CMT | 2 | –0.776 (–1.964, 0.412) | 0.201 | 0.0% | 0.444 | |
| Pre-HTEB versus pre-CMT | 2 | 0.487 (–0.649, 1.622) | 0.401 | 0.0% | 0.331 | |
| Post-HTEB versus post-CMT | 2 | –1.734 (–2.810, –0.658) | 0.002 | 87.4% | 0.005 | |
| Random-effects model | –2.841 (–6.748, 1.067) | 0.154 | 87.4% | 0.005 | ||
| Right atrium end-diastolic transverse dimension (mm) | ||||||
| Post-HTEB versus pre-HTEB | 3 | –4.112 (–5.873, –2.351) | 0.000 | 40.2% | 0.188 | |
| Post-CMT versus pre-CMT | 3 | –1.505 (–3.041, 0.031) | 0.055 | 0.0% | 0.866 | |
| Pre-HTEB versus pre-CMT | 3 | 0.054 (–1.680, 1.788) | 0.951 | 0.0% | 0.378 | |
| Post-HTEB versus post-CMT | 3 | –2.926 (–4.585, –1.266) | 0.001 | 51.2% | 0.129 | |
| Right ventricle transverse dimension (mm) | ||||||
| Post-HTEB versus pre-HTEB | 3 | –4.663 (–6.334, –2.993) | 0.000 | 0.0% | 0.551 | |
| Post-CMT versus pre-CMT | 3 | –0.173 (–1.782, 1.437) | 0.833 | 53.1% | 0.119 | |
| Pre-HTEB versus pre-CMT | 3 | –0.229 (–1.876, 1.419) | 0.785 | 0.9% | 0.365 | |
| Post-HTEB versus post-CMT | 3 | –5.149 (–6.807, –3.491) | 0.000 | 79.7% | 0.007 | |
| Random-effects model | –5.055 (–8.964, –1.146) | 0.011 | 79.7% | 0.007 | ||
| Tricuspid regurgitation area (mm2) | ||||||
| Post-HTEB versus pre-HTEB | 2 | –3.095 (–3.932, –2.258) | 0.000 | 93.5% | 0.000 | |
| Random-effects model | –3.955 (–7.707, –0.204) | 0.039 | 93.5% | 0.000 | ||
| Post-CMT versus pre-CMT | 2 | –0.378 (–1.509, 0.753) | 0.512 | 0.0% | 0.875 | |
| Pre-HTEB versus pre-CMT | 2 | –0.820 (–1.828, 0.188) | 0.111 | 51.9% | 0.149 | |
| Post-HTEB versus post-CMT | 2 | –2.866 (–3.914, –1.819) | 0.000 | 92.1% | 0.000 | |
| Random-effects model | –5.545 (–12.341, 1.251) | 0.110 | 92.1% | 0.000 | ||
| Pulmonary arterial pressure (mmHg) | ||||||
| Post-HTEB versus pre-HTEB | 2 | –18.600 (–22.544, –14.656) | 0.000 | 0.0% | 0.917 | |
| Post-CMT versus pre-CMT | 2 | –2.057 (–7.609, 3.495) | 0.468 | 0.0% | 0.986 | |
| Pre-HTEB versus pre-CMT | 2 | –0.483 (–5.516, 4.550) | 0.851 | 0.0% | 0.685 | |
| Post-HTEB versus post-CMT | 2 | –17.196 (–22.036, –12.356) | 0.000 | 0.0% | 0.580 | |
| Brain natriuretic peptide (pg/mL or ng/L) | ||||||
| Post-HTEB versus pre-HTEB | 2 | –961.493 (–969.022, –953.964) | 0.000 | 98.1% | 0.000 | |
| Random-effects model | –706.883 (–1.2 × 10³, –195.421) | 0.007 | 98.1% | 0.000 | ||
| Post-CMT versus pre-CMT | 2 | –683.279 (–689.595, –676.964) | 0.000 | 96.6% | 0.000 | |
| Random-effects model | –476.191 (–897.348, –55.035) | 0.027 | 96.6% | 0.000 | ||
| Pre-HTEB versus pre-CMT | 2 | 68.032 (61.191, 74.873) | 0.000 | 0.0% | 0.805 | |
| Post-HTEB versus post-CMT | 2 | –210.429 (–217.478, –203.380) | 0.000 | 80.2% | 0.025 | |
| Random-effects model | –164.775 (–275.285, –54.265) | 0.003 | 80.2% | 0.025 | ||
| Parameters | Number of studies | Pooled odds ratio (OR) and 95% confidence interval | p-value for OR | I-square (I2, %) | p-value for heterogeneity | |
| Total effective rate | 6 | 5.114 (3.189, 8.203) | 0.000 | 0.0% | 0.744 | |
| Heart failure | 3 | 5.601 (1.990, 15.762) | 0.001 | 0.0% | 0.570 | |
| Angina pectoris | 3 | 4.993 (2.936, 8.492) | 0.000 | 0.0% | 0.505 | |
| Excellence rate | 5 | 2.828 (1.968, 4.063) | 0.000 | 0.0% | 0.977 | |
| Heart failure | 2 | 2.768 (0.808, 9.480) | 0.105 | 0.0% | 0.659 | |
| Angina pectoris | 3 | 2.833 (1.939, 4.140) | 0.000 | 0.0% | 0.896 | |
| Inefficient rate | 5 | 0.186 (0.112, 0.307) | 0.000 | 0.0% | 0.675 | |
| Heart failure | 2 | 0.097 (0.020, 0.463) | 0.003 | 0.0% | 0.772 | |
| Angina pectoris | 3 | 0.200 (0.118, 0.341) | 0.000 | 0.0% | 0.505 | |
A random-effects model was added alongside the fixed-effects model when high heterogeneity was observed among the included studies (italicized). HTEB, high thoracic epidural blockade; CMT, conventional medical treatment; NYHA, New York Heart Association.
A comparison was conducted between pre- and post-HTEB treatment. The mean HR and
BP were reduced after adjunctive HTEB treatment. Moreover, HTEB treatment
alleviated the myocardial ischemia, reflected by decreased frequency and duration
of ischemic episodes, and improved
| Parameters | Number of studies | Pooled weighted mean difference (WMD) and 95% confidence interval | p-value for WMD | I-squared (I2, %) | p-value for heterogeneity |
| Frequency of ischemic episodes (24 hours) | 3 | –4.230 (–4.758, –3.703) | 0.000 | 27.3% | 0.253 |
| Duration of ischemic episodes (minutes) | 3 | –8.660 (–9.991, –7.328) | 0.000 | 37.7% | 0.201 |
| Mean heart rate (times per min) | 14 | –5.210 (–6.046, –4.374) | 0.000 | 59.4% | 0.001 |
| Systolic blood pressure (mmHg) | 8 | –8.260 (–10.010, –6.509) | 0.000 | 87.3% | 0.000 |
| Random-effects model | –10.703 (–15.951, –5.456) | 0.000 | 87.3% | 0.000 | |
| Diastolic blood pressure (mmHg) | 8 | –8.015 (–8.705, –7.324) | 0.000 | 99.5% | 0.000 |
| Random-effects model | –12.712 (–23.362, –2.062) | 0.019 | 99.5% | 0.000 | |
| Mean arterial blood pressure (mmHg) | 4 | –8.895 (–12.059, –5.732) | 0.000 | 57.1% | 0.072 |
| ΣST-T (mv) | 7 | –1.192 (–1.332, –1.053) | 0.000 | 0.0% | 0.613 |
| NST-T | 6 | –1.614 (–1.828, –1.401) | 0.000 | 0.0% | 0.862 |
| Q-T dispersion | 3 | –9.313 (–14.524, –4.103) | 0.000 | 0.0% | 0.983 |
| Q-T corrected dispersion | 3 | –10.287 (–17.283, –3.290) | 0.004 | 31.0% | 0.235 |
| J-TD | 2 | –9.045 (–15.789, –2.300) | 0.009 | 0.0% | 0.623 |
| SDNN (ms) | 2 | 20.455 (11.077, 29.833) | 0.000 | 73.2% | 0.053 |
| SDANN (ms) | 2 | 21.425 (13.472, 29.378) | 0.000 | 63.2% | 0.099 |
| NYHA cardiac functional classification | 15 | –1.650 (–1.734, –1.566) | 0.000 | 42.4% | 0.024 |
| Left ventricular ejection fraction (%) | 23 | 9.792 (9.031, 10.554) | 0.000 | 87.8% | 0.000 |
| Random-effects model | 10.041 (7.724, 12.359) | 0.000 | 87.8% | 0.000 | |
| Left ventricular fraction shortening (%) | 7 | 4.425 (3.577, 5.273) | 0.000 | 30.9% | 0.181 |
| N-terminal pro-brain natriuretic peptide (ng/L) | 8 | –4.0 × 10³ (–4.4 × 10³, –3.6 × 10³) | 0.000 | 95.5% | 0.000 |
| Random-effects model | –4.0 × 10³ (–5.9 × 10³, –2.0 × 10³) | 0.000 | 95.5% | 0.000 | |
| Left atrial dimension (mm) | 10 | –5.053 (–6.222, –3.884) | 0.000 | 0.0% | 0.623 |
| Left ventricular end-diastolic dimension (mm) | 17 | –7.151 (–7.902, –6.400) | 0.000 | 81.4% | 0.000 |
| Random-effects model | –5.291 (–7.192, –3.391) | 0.000 | 81.4% | 0.000 | |
| Left ventricular end-systolic volume (mL) | 7 | –24.258 (–34.572, –13.944) | 0.000 | 43.7% | 0.087 |
| Left ventricular end-diastolic volume (mL) | 7 | –13.649 (–26.893, –0.404) | 0.043 | 41.9% | 0.099 |
| E peaking/A peaking ratio | 3 | 0.281 (0.129, 0.432) | 0.000 | 0.0% | 0.538 |
| A peaking/E peaking ratio | 2 | –0.670 (–0.815, –0.524) | 0.000 | 0.0% | 0.640 |
| Cardiac output (L/min) | 4 | 0.823 (0.501, 1.146) | 0.000 | 84.2% | 0.000 |
| Random-effects model | 0.803 (–0.029, 1.636) | 0.059 | 84.2% | 0.000 | |
| Stroke volume (mL) | 5 | 9.469 (5.558, 13.380) | 0.000 | 30.6% | 0.206 |
| Cardiothoracic ratio (CTR) | 3 | –0.128 (–0.137, –0.119) | 0.000 | 46.9% | 0.152 |
| 6-minute walk distance (6MWT) | 3 | 132.564 (75.010, 190.117) | 0.000 | 0.0% | 0.444 |
| Cardiac index (L min–1 m–2) | 3 | 0.446 (0.284, 0.608) | 0.000 | 80.5% | 0.006 |
| Random-effects model | 0.423 (0.044, 0.802) | 0.029 | 80.5% | 0.006 | |
| Mean pulmonary arterial pressure (mmHg) | 2 | –3.189 (–4.309, –2.068) | 0.000 | 93.0% | 0.000 |
| Random-effects model | –2.827 (–7.139, 1.484) | 0.199 | 93.0% | 0.000 | |
| Pulmonary capillary wedge pressure (PCWP, mmHg) | 2 | –2.826 (–3.857, –1.796) | 0.000 | 94.6% | 0.000 |
| Random-effects model | –2.641 (–7.090, 1.808) | 0.245 | 94.6% | 0.000 | |
| Pulmonary vascular resistance indices (PVRI, mmHg min L–1 m2) | 2 | –26.803 (–41.816, –11.789) | 0.000 | 4.0% | 0.308 |
| Stroke volume index (SVI, mL/m2) | 2 | 5.110 (2.010, 8.210) | 0.001 | 0.0% | 0.493 |
| Systemic vascular resistance indices (SVRI, mmHg min L–1 m2) | 3 | –182.480 (–270.393, –94.567) | 0.000 | 73.1% | 0.024 |
| Angiotensin-converting enzyme 2 | 2 | –20.508 (–24.087, –16.928) | 0.000 | 95.9% | 0.000 |
| Random-effects model | –37.543 (–76.590, 1.503) | 0.059 | 95.9% | 0.000 | |
| Norepinephrine | 2 | –228.264 (–264.134, –192.394) | 0.000 | 71.7% | 0.029 |
| Parameters | Number of studies | Pooled ES and 95% confidence interval | p-value for ES | I-squared (I2, %) | p-value for heterogeneity |
| Total effective rate | 5 | 0.968 (0.944, 0.991) | 0.000 | 0.0% | 0.573 |
| Excellence rate | 8 | 0.677 (0.595, 0.76) | 0.000 | 57.9% | 0.011 |
| Inefficient rate | 5 | 0.033 (0.009, 0.057) | 0.007 | 0.0% | 0.572 |
A random-effects model was added alongside the fixed-effects model when high heterogeneity was observed among the included studies (italicized). HTEB, high thoracic epidural blockade; NYHA, New York Heart Association; SDNN, standard deviation of NN intervals; SDANN, standard deviation of the average NN intervals; ES, effect size.
The HTEB groups in the 25 case–control studies and 38 case–series were merged, and synthetic single-rate meta-analyses were performed to estimate the ESs of the short-term outcomes post-adjunctive HTEB. The results showed that HTEB reduces HR, BPs, and NYHA cardiac functional classification. Moreover, HTEB treatment was associated with improved left ventricular output and cardiac remodeling depicted by enhanced LVEF, LVFS, LAD, LVEDD, LVESV, LVEDV, and CI. The summary effective rate of adjunctive HTEB treatment was 95.2%, and the excellent and inefficient rates were 56.9% and 4.9%, respectively. We applied a random-effects model to reanalyze these results, particularly for studies with an I2 greater than 75%. Consistent results were observed from the random-effects model. The results are listed in Table 3.
| Parameters | Number of studies | Pooled weighted mean difference (WMD) and 95% confidence interval | p-value for WMD | I-squared (I2, %) | p-value for heterogeneity |
| Heart rate (min) | 21 | –8.093 (–8.806, –7.381) | 0.000 | 91.6% | 0.000 |
| Random-effects model | –8.093 (–8.806, –7.381) | 0.000 | 91.6% | 0.000 | |
| Systolic blood pressure (mmHg) | 13 | –9.057 (–10.067, –8.047) | 0.000 | 96.6% | 0.000 |
| Random-effects model | –13.072 (–18.857, –7.288) | 0.000 | 96.6% | 0.000 | |
| Diastolic blood pressure (mmHg) | 12 | –8.574 (–9.236, –7.913) | 0.000 | 99.3% | 0.000 |
| Random-effects model | –12.082 (–20.495, –3.670) | 0.005 | 99.3% | 0.000 | |
| Mean blood pressure (mmHg) | 6 | –9.341 (–11.765, –6.917) | 0.000 | 66.1% | 0.011 |
| NYHA cardiac functional classification | 24 | –1.526 (–1.586, –1.466) | 0.000 | 72.8% | 0.000 |
| Left ventricular ejection fraction (%) | 39 | 9.651 (9.082, 10.220) | 0.000 | 85.1% | 0.000 |
| Random-effects model | 9.970 (8.387, 11.553) | 0.000 | 85.1% | 0.000 | |
| Left ventricular fraction shortening (%) | 15 | 4.365 (3.840, 4.890) | 0.000 | 53.8% | 0.006 |
| Left atrial dimension (mm) | 18 | –4.748 (–5.567, –3.929) | 0.000 | 0.0% | 0.757 |
| Left ventricular end diastolic dimension (mm) | 33 | –6.356 (–6.918, –5.793) | 0.000 | 74.3% | 0.000 |
| Left ventricular end-systolic volume (mL) | 10 | –29.562 (–38.200, –20.924) | 0.000 | 50.9% | 0.026 |
| Left ventricular end-diastolic volume (mL) | 10 | –20.439 (–31.559, –9.319) | 0.000 | 43.8% | 0.058 |
| Cardiac index (L min–1 m–2) | 5 | 0.546 (0.469, 0.623) | 0.000 | 69.1% | 0.011 |
| Parameters | Number of studies | Pooled ES and 95% confidence interval | p-value for ES | I-squared (I2, %) | p-value for heterogeneity |
| Total effective rate | 11 | 0.952 (0.934, 0.970) | 0.007 | 0.0% | 0.509 |
| Excellence rate (random-effects model) | 14 | 0.569 (0.460, 0.679) | 0.000 | 89.7% | 0.000 |
| Excellence rate (fixed-effect model) | 14 | 0.564 (0.530, 0.597) | 0.000 | 89.7% | 0.000 |
| Inefficient rate | 10 | 0.049 (0.031, 0.067) | 0.000 | 0.0% | 0.521 |
HTEB, high thoracic epidural blockade; ES, effect size; NYHA, New York Heart Association.
Multivariable meta-regression analysis was conducted on the NYHA cardiac functional classification and LVEF based on the variables, including HF etiology, anesthetic agent doses, HTEB intervention frequency, and HTEB intervention duration. Two indicators exhibited low fitting degrees, with adjusted R2 values of 11.81% for NYHA and 19.28% for LVEF, as identified through multivariable meta-regression analysis. No statistical significance was observed. Therefore, independent variable regression was performed. The results showed that the inconsistency of LVEF in individual studies was related to the HF etiology (Supplementary Table 12). The results of the subgroup analysis noted a slight inconsistency in the subgroups, such as dilated cardiomyopathy (DCM) (I2 = 33.3%) and ischemic cardiomyopathy (ICM) (I2 = 0%), and a slight to moderate inconsistency in the multiple cardiovascular diseases (I2 = 47.9%) (Supplementary Table 13).
A meta-regression analysis was conducted for the case–series studies to explore the inconsistency between individual studies for NT-pro BNP, LVEF, and LVEDD. No positive covariate was identified in the multivariate regression analysis. The results of the univariate regression analyses implicated the identified covariates, such as the dose of the anesthetic agents (p = 0.037), in relation to the LVEDD inconsistency between individual studies. Thus, subgroup analyses were performed on the three indicators. The NT-pro BNP analysis observed a wide distribution in HF etiologies. Therefore, three covariates were estimated based on the anesthetic agent doses, HTEB intervention frequency, and HTEB intervention duration. Good homogeneities were identified between the three studies [74, 75, 76]. A high heterogeneity was observed among the included studies in the subgroup labeled coronary artery disease of LVEF (I2 = 96.1%; seven reports). Moderate heterogeneity was noted in the subgroup labeled dilated cardiomyopathy for LVEF (I2 = 49.4%; 10 reports), while slight heterogeneity was found for LVEF in the subset categorized as other cardiovascular diseases (I2 = 28.3%; eight reports). Homogeneities were observed in the subgroups of the HTEB intervention duration, including 4–8 weeks (four reports), 2 weeks (two reports), 4–6 weeks (three reports), and minutes (two reports). Meanwhile, substantial heterogeneity (I2 = 81.4) was observed among involved studies for the LVEDD estimation (17 reports). Based on the classification of “dose of anesthetic agents”, the results of the meta-regression and subgroup analyses represented good consistency in the subgroup labeled as “0.5% lidocaine (3–5 mL)” (I2 = 9.8%; seven reports), “0.5% lidocaine (5 mL) or 0.2% ropivacaine (5 mL)” (I2 = 0%; three reports), and “0.5% lidocaine (5 mL)” (I2 = 0%; four reports). High inconsistency was observed in the subgroup labeled “others” (I2 = 83.1; 3 reports). These results are presented in Supplementary Tables 14 and 15.
Meta-regression analyses were conducted for NYHA, LVEF, and LVEDD between merged studies, with a positive result observed in the LVEF analysis. Covariates, such as the HTEB intervention duration (multivariate regression, p = 0.011; univariate regression, p = 0.008), were identified as related to the inconsistency between studies. Subgroup analyses were performed on the LVEF based on the covariates and those in the meta-regression analyses. Consistency between reports was identified in the subgroups, such as dilated cardiomyopathy (I2 = 28.8%; 18 reports; p-value for WMD = 0.000) and other cardiomyopathies (I2 = 27.3%; 11 reports; p-value for WMD = 0.000). The HTEB intervention duration subgroups, including minutes (I2 = 25.1%; two reports), 1 week (I2 = 22.1%; two reports), 2–3 weeks (I2 = 0.0%; three reports), 4–6 weeks (I2 = 0.0%; three reports), and 4–8 weeks (I2 = 0.0%; five reports) showed good homogeneity that potentially contributed to the inconsistency in the pooled effects of LVEF between reports. These results are presented in Supplementary Tables 16 and 17.
Multiple earlier meta-analyses have demonstrated that HTEB improves outcomes in patients undergoing both cardiac and non-cardiac surgeries. The use of epidural anesthesia during surgical procedures provides additional benefits, including reducing supraventricular arrhythmias, alleviating respiratory issues, and reducing major adverse cardiac events and mortality [82, 83, 84]. Nevertheless, questions and controversies remain regarding the anti-arrhythmic effects of HTEB. Several studies and a meta-analysis have suggested that thoracic epidural anesthesia shows no beneficial efficacy in preventing postoperative AF in patients undergoing cardiac surgery [85, 86]. However, two uncontrolled studies with small sample sizes suggested that patients with ventricular arrhythmias may benefit from HTEB treatment [87, 88]. No conclusive evidence exists that supports the use of bilateral cardiac sympathetic denervation for antiarrhythmic purposes in patients with cardiomyopathies; meanwhile, heart transplantation represents the most effective treatment among patients with end-stage cardiomyopathy and arrhythmias [89]. HTEB may be beneficial for ameliorating the hemodynamic abnormalities and cardiac dysfunction in cases of IHD and HF.
As the short-term effects of HTEB on cardiac performance in non-surgical patients with IHD and/or HF remain uncertain, we conducted a pooled analysis using a meta-analytic approach. The analytical procedure involved three continuous stages. Stage 1: Analysis of 25 case–control studies comparing cardiac indicators between adjunctive HTEB treatment and CMT. Stage 2: Analysis of 38 case–series studies comparing the cardiac indicators between pre- and post-HTEB treatment. Stage 3: Aggregation of the HTEB groups isolated from the case–control and case–series studies comparing the cardiac indicators between pre- and post-HTEB treatment. Most of the studies were published in Chinese because reports regarding adjunctive HTEB treatments in non-surgical patients with IHD and HF are limited in the literature published in English and other languages. The cumulative results provided valuable insights indicating that HTEB, combined with conventional medical treatments, offered additional benefits for improving cardiac function, alleviating angina caused by myocardial ischemia, and reducing cardiac dilation. Substantial heterogeneity was observed between individual studies. We addressed a part of this heterogeneity through meta-regression followed by subgroup analyses.
In the evaluation of 25 case–control studies, obvious inconsistency was observed in the cardiac functional classification of HR, SBP, DBP, MBP, and NYHA in the individual studies. In contrast to imaging examinations with relative quantitative detections, measuring the time points of HR and BP with variability are inconsistently distributed; meanwhile, the NYHA cardiac functional classification is based solely on clinical judgment. Therefore, we did not conduct a further meta-regression or subgroup analysis. Two or three studies were included in estimating the LVESV, mitral regurgitation area, tricuspid regurgitation area, RATD, RVTD, and serum BNP concentrations after HTEB treatment, and further subgroup analysis and meta-regression were unavailable due to limitations in computational efficiency, as well as in the number of reports. HTEB treatment increased LVEF with moderate heterogeneity (n = 16; I2 = 62.2%) among these selected studies. We further explored the potential origin of heterogeneity by using a meta-regression analysis followed by a subgroup analysis. The variables were classified as (1) HF etiology, (2) anesthetic agent doses, (3) HTEB treatment frequency, and (4) HTEB treatment duration. We found that the inconsistency between individual studies was related to HF etiology. The following subgroup analysis further indicated that HF due to DCM or ICM showed preferable homogeneity. Furthermore, in comparing the effective rate between the adjunctive HTEB group and the CMT group, the definition of effective rate in the three studies was the recovery of HF and angina pectoris due to CAD. The HTEB is more effective than CMT in treating HF and angina pectoris.
The sympathetic efferent nerve mediates angina in patients with ischemic
coronary artery disease. Blocking the thoracic sympathetic segments through local
anesthesia provides pain relief in the coronary ischemia syndrome and is
sometimes used to manage intractable angina [90]. Olausson et al. [14]
confirmed that continuous HTEB has superior anti-ischemic and anti-anginal
effects compared to conventional therapy in patients with refractory unstable
angina. Moreover, HTEB treatment can normalize the myocardial blood flow response
to sympathetic stimuli, improve myocardial pH and metabolism during ischemia,
increase myocardial oxygen availability, and preserve the cardiac function of the
ischemic heart [13, 45, 46, 47, 48, 69, 71, 91, 92, 93, 94]. Our pooled analysis of the
case–series studies indicates that HTEB exerts significant anti-ischemic
effects, as evidenced by decreased frequency and duration of ischemic episodes,
mean HR, and BP in patients with unstable angina pectoris. Heterogeneity was
observed in the HR and BP calculations. We did not conduct a subgroup analysis
due to the measured variability and randomness. In contrast, the
HF is the end stage in various cardiovascular diseases, characterized by poor
cardiac output and ventricular enlargement. Furthermore, HF is often associated
with malignant arrhythmias and sudden cardiac arrest. DCM and ICM are common
etiologies of HF. For non-cardiac surgery, HTEB has been suggested as the optimal
anesthetic management for patients with DCM and HF, since HTEB can provide rapid
analgesia and reduce the risk of perioperative adverse cardiac events [84]. There
are limited reports on applying adjunctive HTEB in non-surgical patients with
DCM. The 2011 study by Chi and colleagues [16] confirmed that HTEB treatment
significantly improved cardiac function and benefited outcomes. Therefore, the
observed improvement in cardiac ultrasound parameters in this study aligns with
findings from other studies [14, 15]. Nevertheless, this study did not represent
limited outcome information, such as detailed follow-up data. The middle and
long-term benefits of HTEB on hard endpoints cannot be definitively confirmed for
HF in humans. Therefore, well-designed trials with complete follow-up and
adequate evidence are needed in the future [16]. Li and Liu [42] found that HTEB
decreased plasma norepinephrine, cyclic adenosine monophosphate (cAMP), and
cyclic guanosine monophosphatec (cGMP) levels, which was associated with improved
left ventricular systolic function in patients with HF. The authors concluded
that HTEB intervention improved cardiac function via blocking the
NE–
In addition to the pooled results from the case–control studies, we included additional case–series studies. The HTEB groups in the case–control studies were extracted and integrated with the case–series studies before the aggregated analysis was conducted. The pooled results indicated a significant improvement in cardiac function and a reduction in cardiomegaly following the adjunctive HTEB intervention. There was a wide distribution of etiologies, anesthetic agents, dosages, and HTEB intervention frequencies and durations. The disease classification was significantly inconsistent. Therefore, we did not discuss the origin of heterogeneity for all of the cardiac indicators in the case–series studies and aggregated studies further. Since we only performed a single-rate analysis using the uncontrolled case–series studies, the pooled effects we obtained failed to avoid the generation of heterogeneity. In addition, most of these case–series studies had small sample sizes that may contribute to the heterogeneity. Some evaluated indicators involved few reports (less than or equal to 3), restricted by computational efficiency, and the meta-regression or subgroup analysis was unavailable. These differences may affect the estimation of outcomes between individual studies. Nonetheless, merged effects may provide the average impacts of adjunctive HTEB treatment on cardiac function and structure in patients with IHD and HF.
Evidence showed that patients had received adequate drug intervention in these
early studies. For example, patients with IHD received the combination of CMT
that involved
Two patterns of epidural administration were noted in the included studies. In
the study conducted by Olausson et al. [14], an epidural bolus dose of
20 to 30 mg of bupivacaine (5 mg/mL) induced a blockage in the cardiac
sympathetic segments (Th1-5), and continuous epidural infusion of
bupivacaine was then started for at least 48 hours. In this study, HTEB resulted
in a significant alleviation of refractory unstable angina. In the studies
conducted by Blomberg and coworkers, pain management using HTEB began with a
bolus epidural injection of 4.3
Several potential limitations in this study should be considered. First, due to the limited number of studies on this topic published in English and other languages, the current analysis primarily focuses on articles published in Chinese. Consequently, a potential publication bias may exist. Second, the inclusion period spans a long duration (from 1989 to 2023), during which the accuracy of diagnoses, treatments, and other factors may have influenced how these patients respond to HTEB treatment. This variability contributes to the heterogeneity of the included studies. The scheme of the traditional medical treatment used in the early studies for HF did not strictly adhere to the new therapeutic regimen recommended by the 2021 ESC guidelines for diagnosing and treating acute and chronic HF with reduced ejection fraction. Moreover, the medical regimen in some studies did not involve angiotensin-converting enzyme inhibitors/angiotensin receptor blockers, beta-blockers, mineralocorticoid receptor antagonists, and sodium-glucose co-transporter 2 inhibitors [2, 4]. Therefore, the clinical efficacy of HTEB in combination with the new drug regimen could not be assessed. Third, some of the earlier clinical study designs were inadequate, which may have reduced the reliability of the results. In the included case–series studies, we used a self-controlled design to compare changes in primary indicators before and after HTEB treatment. Therefore, this assessment may introduce significant bias due to the intrinsic characteristics of the included case–series studies. Lastly, we only detected publication bias based on the effects of LVEF due to the limited number of other indicators in the individual analyses. Some methods (e.g., funnel plots or regression) are only sensitive to the relationship between sample size and effect size. However, if the populations or protocols differ among the trials, legitimate heterogeneity should be reflected in the ES [97].
Even though the current results are limited and the application of HTEB in non-surgical patients with HF has not reached widespread consensus, our pooled results suggest that adjunctive HTEB treatment can improve cardiac performance and compensatory cardiac dilation. HTEB roughly increases the average LVEF by 10% in patients with IHD and HF, especially for DCM and ICM. A frequently-used protocol of HTEB treatment is 3–5 mL of 0.5% lidocaine hydrochloride administered intermittently via epidural infusion every 2/24 hours for 4 weeks. Adjunctive HTEB treatment may be a promising strategy for short-term cardiovascular rehabilitation; however, well-designed, larger-sample, multi-center clinical trials are needed in the future.
HTEB, High thoracic epidural blockade; IHD, ischemic heart disease; CMT, conventional medical treatment; HF, heart failure; MRAs, mineralocorticoid receptor antagonists; sGC, soluble guanylate cyclase; RAS, renin-angiotensin system; rEF, reduced ejection fraction; CAD, coronary artery disease; MeSH, Medical Subject Headings; GA, general anesthesia.
The raw data used in our study are available from the corresponding author on reasonable request.
YL and DYG designed study; DYG, MC, and CZ performed research; DYG, MC, and CZ analyzed data; YL wrote the draft. All authors contributed to the conception and editorial changes in the manuscript. All authors read and approved the final manuscript. All authors have participated sufficiently in the work and agreed to be accountable for all aspects of the work.
Not applicable.
Not applicable.
This research received no external funding.
The authors declare no conflict of interest.
Supplementary material associated with this article can be found, in the online version, at https://doi.org/10.31083/RCM37886.
References
Publisher’s Note: IMR Press stays neutral with regard to jurisdictional claims in published maps and institutional affiliations.