


1 Department of Cardiology, The Central Hospital of Wuhan, Tongji Medical College, Huazhong University of Science and Technology, 430014 Wuhan, Hubei, China
2 Key Laboratory for Molecular Diagnosis of Hubei Province, The Central Hospital of Wuhan, Tongji Medical College, Huazhong University of Science and Technology, 430014 Wuhan, Hubei, China
Abstract
Despite prior research showing that elevated BAR levels were linked to poor prognoses in several cardiovascular disease conditions, the predictive role of the blood–urea–nitrogen to serum albumin ratio (BAR) in atrial fibrillation (AF) patients admitted to the intensive care unit (ICU) remains largely unknown.
Patients diagnosed with AF were gathered from the Medical Information Mart for Intensive Care-IV (MIMIC-IV) database, and the X-tile software was used to determine the best cut-off values for BAR. The Kaplan–Meier curves and receiver operating characteristics (ROC) analyses were used to evaluate the prognostic value of the BAR. The identified prognostic indicators were used to build a nomogram model.
Finally, 13,451 AF patients were included in this study. The best BAR cut-off value was 8.9. In-hospital survival was substantially higher in the low-BAR group (BAR ≤8.9) than in the high-BAR group (BAR >8.9) (HR: 3.15, 95% CI: 2.89–3.44; p < 0.001). A nomogram model was developed using the findings of multivariable logistic regression, considering variables such as age, heart rate, albumin, white blood cell count, simplified acute physiology score II (SAPS II) score, sequential organ failure assessment (SOFA) score, mechanical ventilation, and the BAR. When forecasting the probability of death for AF patients admitted to the ICU, the nomogram showed good performance and practical application. Calibration curves evaluated the accuracy of the model, decision curve analysis evaluated the clinical use of the model, and the area under the receiver operating characteristic (AUROC) curve evaluated the discriminative capabilities of the model.
Among critically ill AF patients, the BAR, a readily available clinical measure, shows outstanding predictive ability in predicting in-hospital mortality. Additionally, in-hospital mortality could be predicted with high accuracy using a nomogram that included the BAR.
Keywords
- blood urea nitrogen
- serum albumin
- atrial fibrillation
- intensive care unit
- hospital mortality
- nomogram
Cardiovascular diseases (CVD) have been the world’s leading cause of death in recent decades. According to reports, cardiovascular diseases claimed the lives of almost 20.5 million individuals in 2021, making up about one-third of all fatalities worldwide [1]. Among these prevalent cardiovascular diseases, atrial fibrillation (AF) is significantly associated with an increased risk of all-cause mortality, heart failure, hospitalization, and thromboembolic events [2, 3]. AF is notably prevalent among critically ill patients, representing approximately 47.4% to 61% of all arrhythmias and about 52% of atrial arrhythmias in intensive care units (ICUs), highlighting its significance in this setting [4, 5]. AF is also linked to poor prognosis, as evidenced by the atrial fibrillation (AFIB)-ICU cohort study, which found that patients with AF had a 1.38-fold higher risk of 90-day mortality compared to those without AF [6]. Another study underscored that both new-onset and recurrent AF in ICU significantly increased mortality among hospitalized patients [7]. The French and euRopean Outcome reGistry in Intensive Care Unit (FROG-ICU) research further revealed that patients with new-onset AF had approximately a 60% higher risk of in-hospital mortality compared to those without AF [8]. Consequently, there is a pressing need to develop a novel predictive model to identify patients at high risk of mortality.
Mostly eliminated by the kidneys, blood urea nitrogen (BUN) is the main byproduct of human protein metabolism. Increased BUN levels are a critical indicator of a patient’s renal function and protein catabolism status and arise in situations of either impaired glomerular filtration rate or excessive protein catabolism [9]. Similarly, albumin has a number of physiological characteristics, including as anti-inflammatory and antioxidant actions, and indicates the body’s nutritional state. A composite metric with important therapeutic consequences, the BUN/albumin ratio (BAR) can concurrently represent the body’s nutritional state, inflammation, and liver and kidney function [10]. BAR has shown significant value in a number of acute and severe illnesses, enabling the evaluation of disease severity and prognostication prediction. Previous research has demonstrated BAR’s exceptional prognostic prediction power in a wide range of illnesses, such as sepsis, pneumonia, acute renal insufficiency, chronic heart failure, and chronic obstructive pulmonary disease [11, 12, 13, 14].
However, the unique pathophysiological characteristics of AF patients in the ICU—such as hemodynamic instability, heightened inflammatory responses, and electrolyte imbalances—may influence the prognostic utility of BAR differently compared to other critically ill populations. Therefore, it is imperative to investigate the specific role of BAR in predicting in-hospital mortality among ICU patients with AF. This study aims to explore this potential, with the goal of enhancing clinical assessment and guiding individualized treatment strategies for this high-risk group.
This retrospective observational study utilized data from the Medical Information Mart for Intensive Care IV (MIMIC-IV) database, maintained by the Massachusetts Institute of Technology’s Laboratory for Computational Physiology. The database comprises de-identified health records of patients admitted to the intensive care units at Beth Israel Deaconess Medical Center (BIDMC) in Boston between 2008 and 2019. The Institutional Review Board of BIDMC approved the use of this dataset for research purposes and waived the requirement for informed consent due to the anonymized nature of the data. The author (HX) acquired the required permissions and met all database access restrictions.
Patients diagnosed with AF were identified using International Classification of Diseases, Ninth Revision, Clinical Modification (ICD-9-CM) code 427.31. Only the first hospitalization record for each patient was included. Patients those with hospital stays shorter than 24 hours, and those with missing serum urea nitrogen or albumin measurements within the first 24 hours of admission were excluded from the analysis. Finally, the analysis encompassed 13,451 AF patients (Fig. 1).
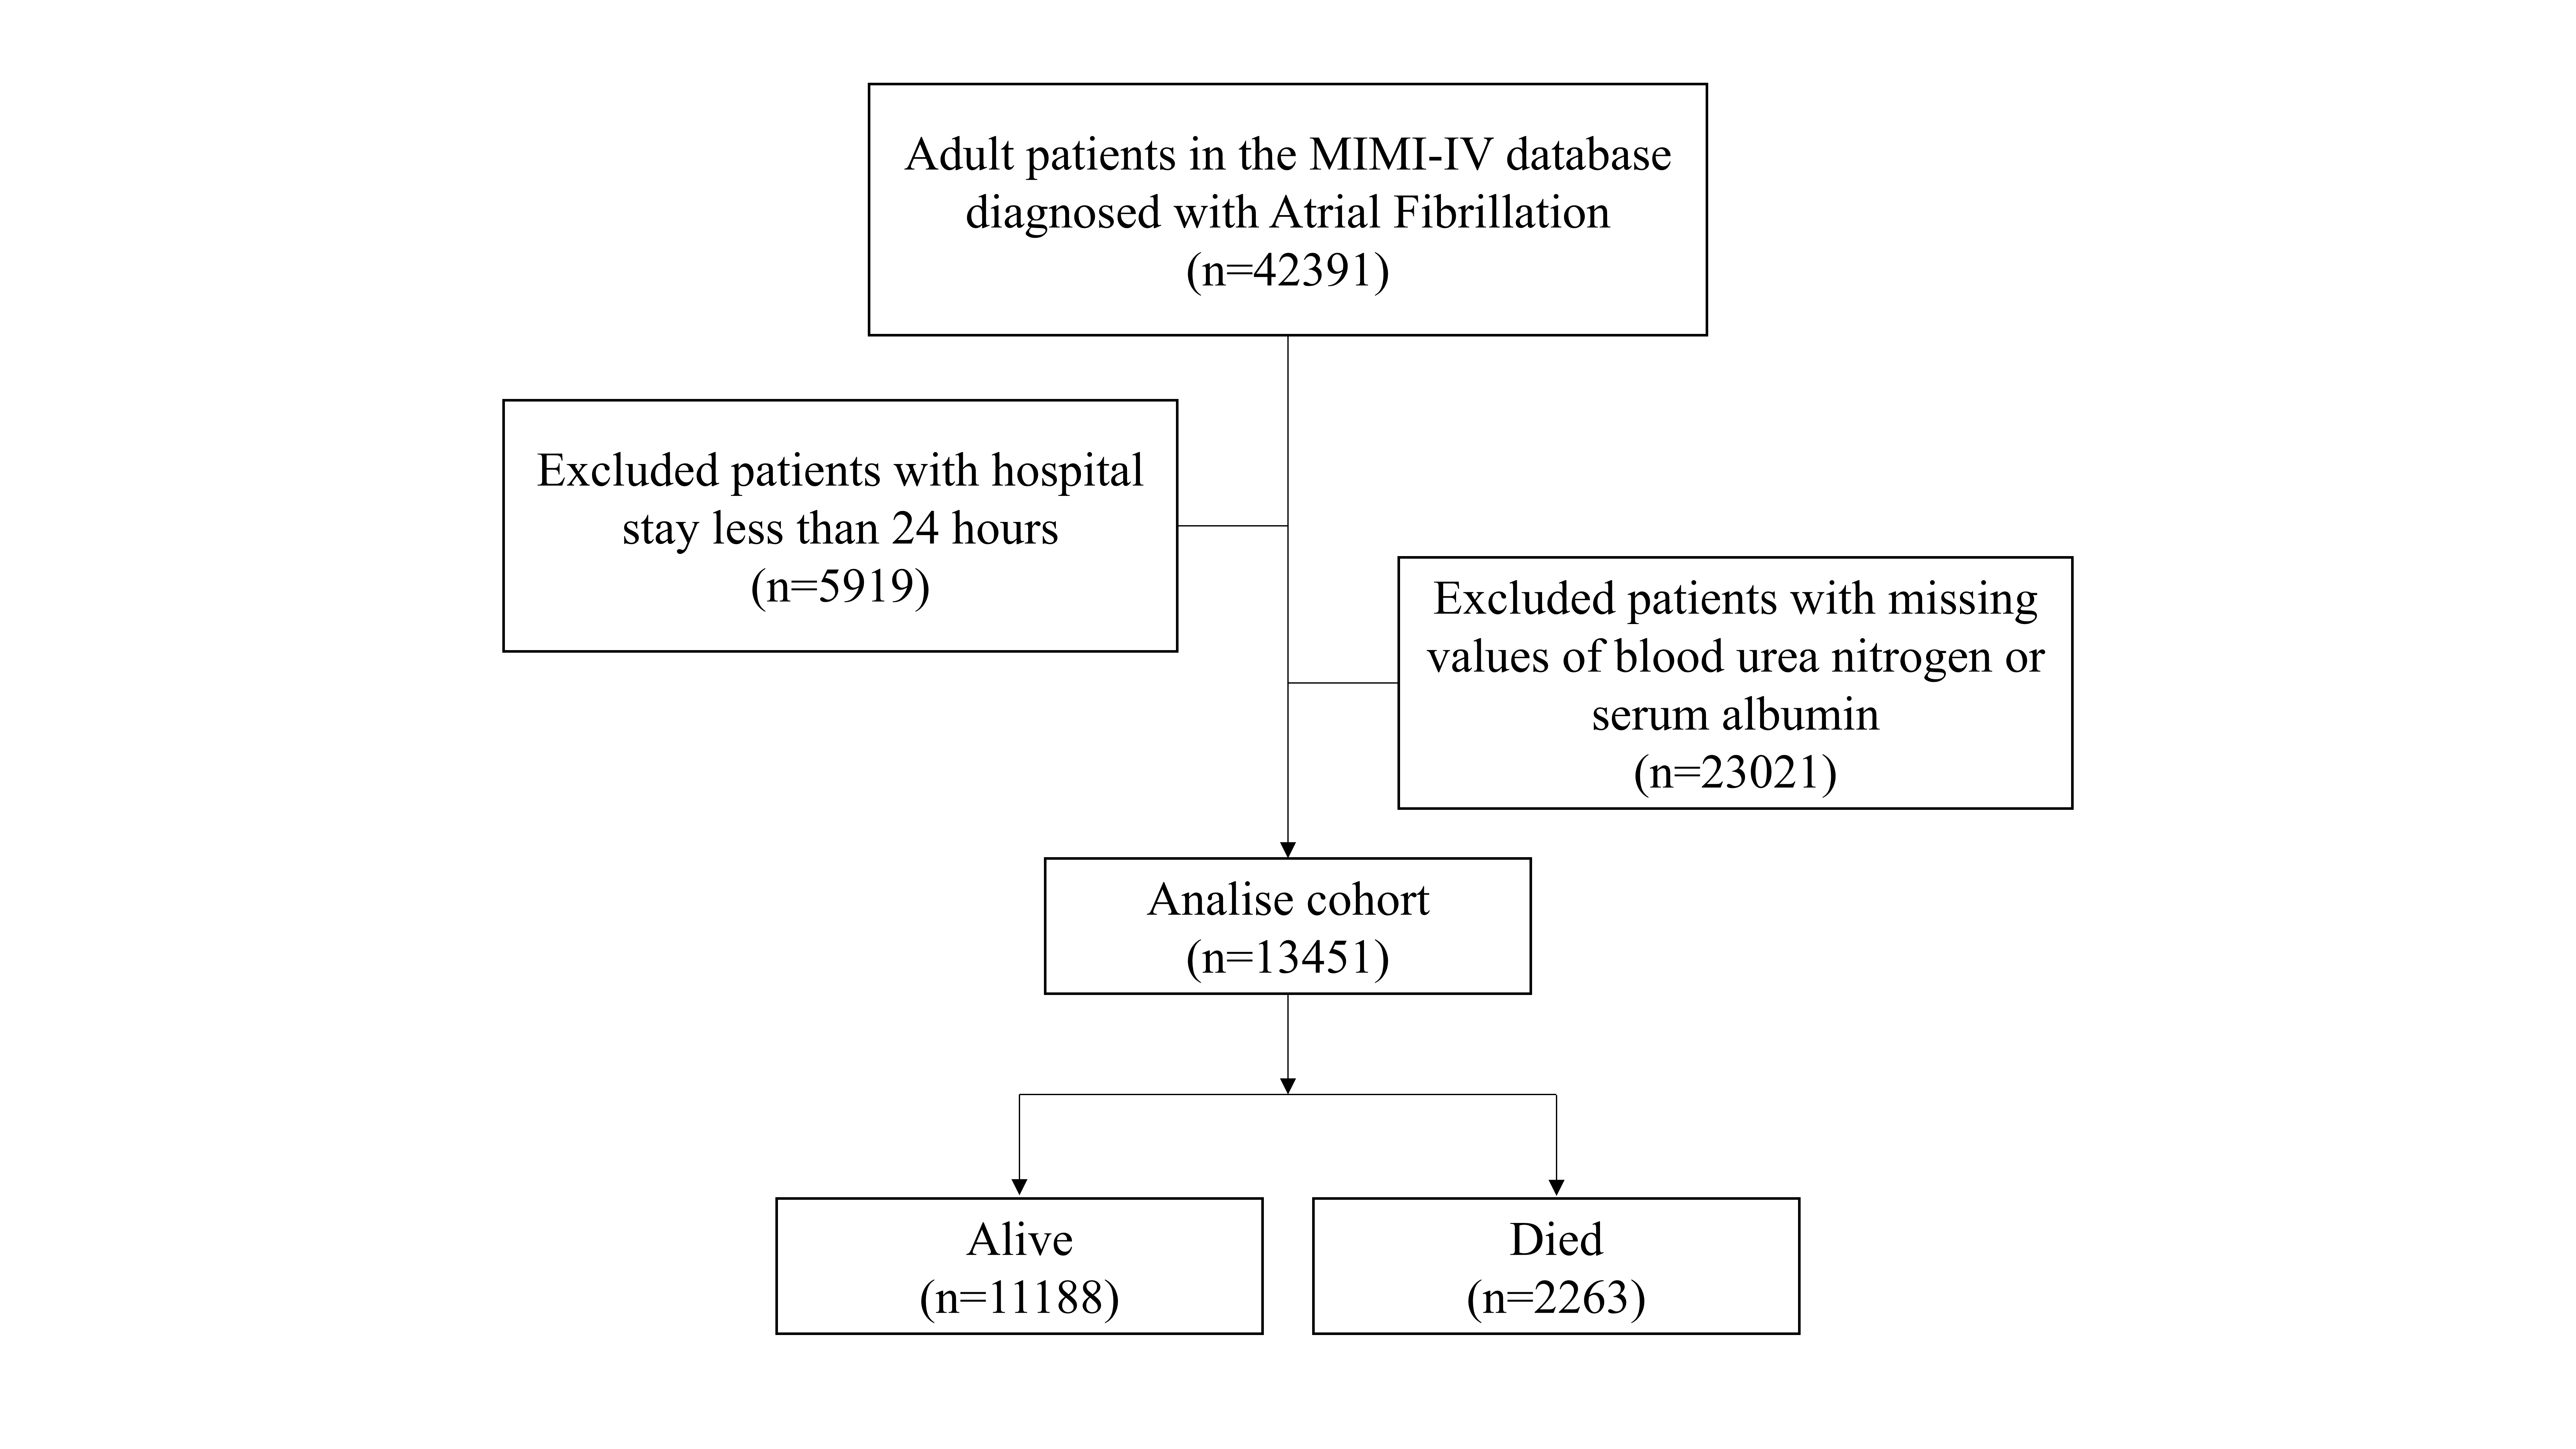 Fig. 1.
The flow chart of this study. MIMIC-IV, Medical Information Mart for Intensive Care IV.
Baseline demographics (age, sex, height, weight), comorbidities (myocardial infarction, heart failure, diabetes mellitus, chronic renal disease defined by ICD-9 codes), 24-hour ICU admission laboratory data, and admission severity scores (Oxford Acute Severity of Illness [OASIS] [15], simplified acute physiology score II [SAPS II] [16], sequential organ failure assessment [SOFA] [17]) were extracted from the MIMIC-IV database via PostgreSQL version 9.6 (The PostgreSQL Global Development Group, San Francisco, CA, USA) using Structured Query Language (SQL).
The statistical studies were conducted using R software version 4.1.2
(University of Auckland, Auckland, New Zealand), X-tile (Yale University, New
Haven, CT, USA), and SPSS 22.0 (IBM Corp., Armonk, NY, USA). For baseline
comparisons, the patients were split into high- and low-BAR groups according to
the ideal cut-off value for BAR, which was determined using X-tile software (In
this study, we utilized X-tile software to determine the optimal cutoff value for
the BAR. X-tile evaluates all potential cutoff points by systematically assessing
the association between BAR and patient outcomes, employing Kaplan-Meier survival
analysis and log-rank tests to identify the threshold that best stratifies
patients with significant survival differences. This approach enables an
objective determination of the most informative cutoff value for subsequent
analyses). Use the normality test to examine the normality of continuous
variables Normally distributed variables were expressed as mean
Ultimately, 13,451 critically ill AF were collected, among which 2263 (16.82%)
experienced in-hospital mortality, as shown in Fig. 1. The optimal cut-off value
for BAR was 8.9. Following that, patients were split into two groups according to
the ideal cut-off value, as shown in Fig. 2. In this study, 13,451 AF patients
were categorized into low-BAR (
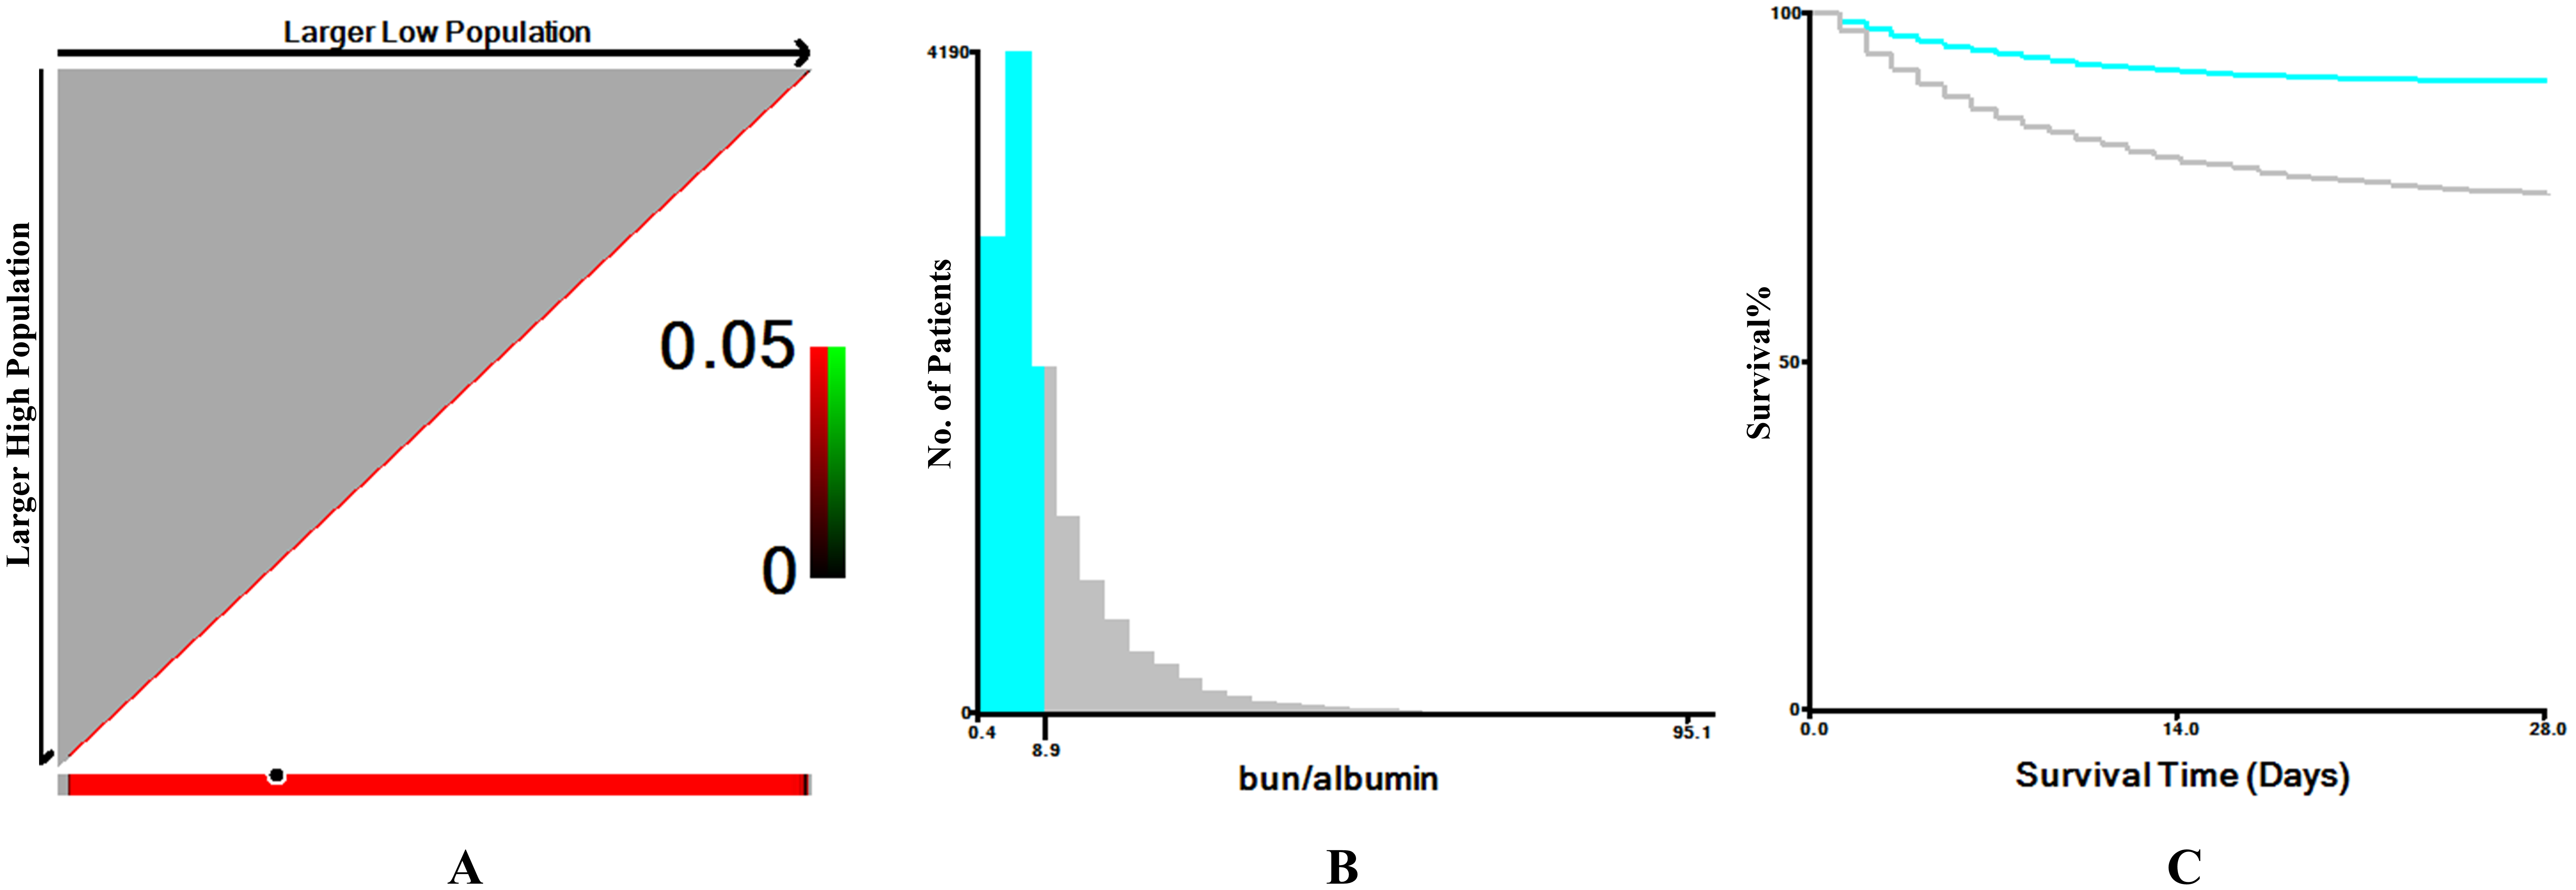 Fig. 2.
The optimal cutoff value for the blood urea nitrogen to serum albumin ratio (BAR) was determined using X-tile software. (A) In the X-tile plots (left panels), the optimal cutoff point is indicated by a black circle. (B) The middle panels display histograms illustrating the distribution of BAR values and the selected cutoff. (C) The right panels present Kaplan-Meier survival curves, demonstrating the prognostic significance of the identified cutoff in critically ill patients with atrial fibrillation.
| Characteristics | Low-BAR ( |
High-BAR ( |
p values | |
| N = 8672 | N = 4779 | |||
| Age, years old | 61 |
68 |
||
| Gender, male, n (%) | 4680 (53.97) | 2856 (59.76) | ||
| Weight, kg | 80 |
84 |
||
| Comorbidities, n (%) | ||||
| Myocardial infarct | 1228 (14.16) | 1013 (21.20) | ||
| Congestive heart failure | 1792 (20.66) | 1940 (40.59) | ||
| Diabetes | 2026 (23.36) | 1851 (38.73) | ||
| Chronic kidney disease | 127 (1.46) | 566 (11.84) | ||
| Charlson comorbidity index | 5 (3, 7) | 5 (4, 7) | 0.467 | |
| Interventions, n (%) | ||||
| Mechanical ventilation | 1208 (13.93) | 953 (19.94) | ||
| Vasopressors | 2462 (28.39) | 2232 (46.70) | ||
| Score system, points | ||||
| SOFA | 4 (2, 6) | 8 (5, 11) | ||
| OASIS | 32 |
37 |
||
| SAPS II | 31 (24, 40) | 46 (37, 56) | ||
| Vital signs | ||||
| Mean arterial pressure, mmHg | 81 |
75 |
||
| Heart rate, bpm | 86 |
88 |
||
| Laboratory values | ||||
| White blood cell, ×109/L | 10.50 (7.65, 14.15) | 11.75 (8.15, 16.70) | ||
| Hemoglobin, g/dL | 11.45 |
10.03 |
||
| Platelet, ×109/L | 199 (145, 259) | 174 (113, 246) | ||
| Albumin, g/dL | 3.47 |
2.95 |
||
| Nitrogen | 15.3 (11.3, 20.5) | 44.3 (34.0, 62.2) | ||
| BAR | 4.5 (3.2, 6.3) | 14.9 (11.3, 21.7) | ||
| Creatinine, mg/dL | 0.85 (0.68, 1.10) | 1.90 (1.30, 3.13) | ||
| Bicarbonate | 23.17 |
21.03 |
||
| Outcomes | ||||
| Length of ICU stay | 2 (2, 5) | 3 (2, 6) | ||
| Length of hospital stay | 7 (4, 12) | 9 (5, 17) | ||
| In-hospital death, n (%) | 932 (10.75) | 1331 (27.82) | ||
SOFA, sequential organ failure assessment; OASIS, Oxford Acute Severity of Illness Score; ICU, intensive care unit; SAPS II, simplified acute physiology score II; BAR, blood urea nitrogen albumin ratio.
The result presented in Table 2, which shows the number of patients at risk during follow-up, stratified by BAR levels. Kaplan-Meier survival analysis demonstrated significantly higher in-hospital
survival in patients with BAR
| Time (days) | Low-BAR ( |
High-BAR ( |
| N = 8672 | N = 4779 | |
| 10 | 8032 | 3910 |
| 20 | 7850 | 3629 |
| 30 | 7802 | 3526 |
| 40 | 7774 | 3493 |
| 50 | 7760 | 3467 |
| 60 | 7748 | 3462 |
| 70 | 7746 | 3456 |
| 100 | 7741 | 3449 |
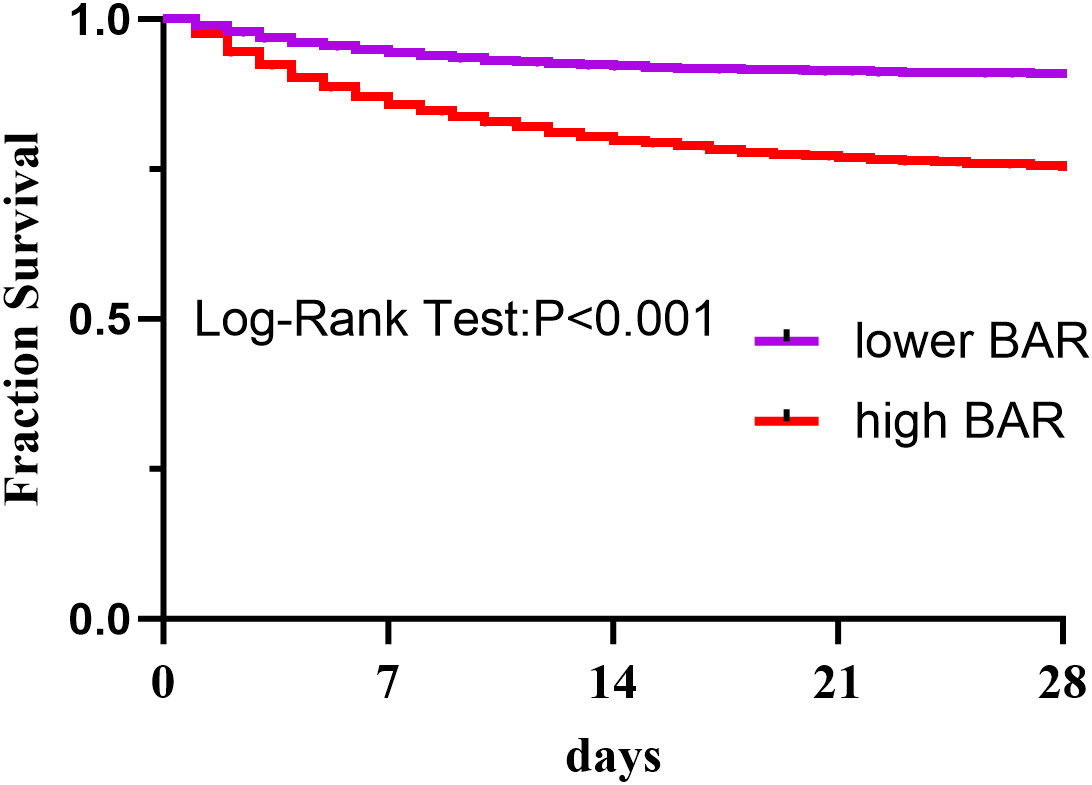 Fig. 3.
The Kaplan-Meier curve was used to determine the overall survival of the high-BAR and low-BAR groups. BAR is the ratio of blood urea nitrogen to serum albumin.
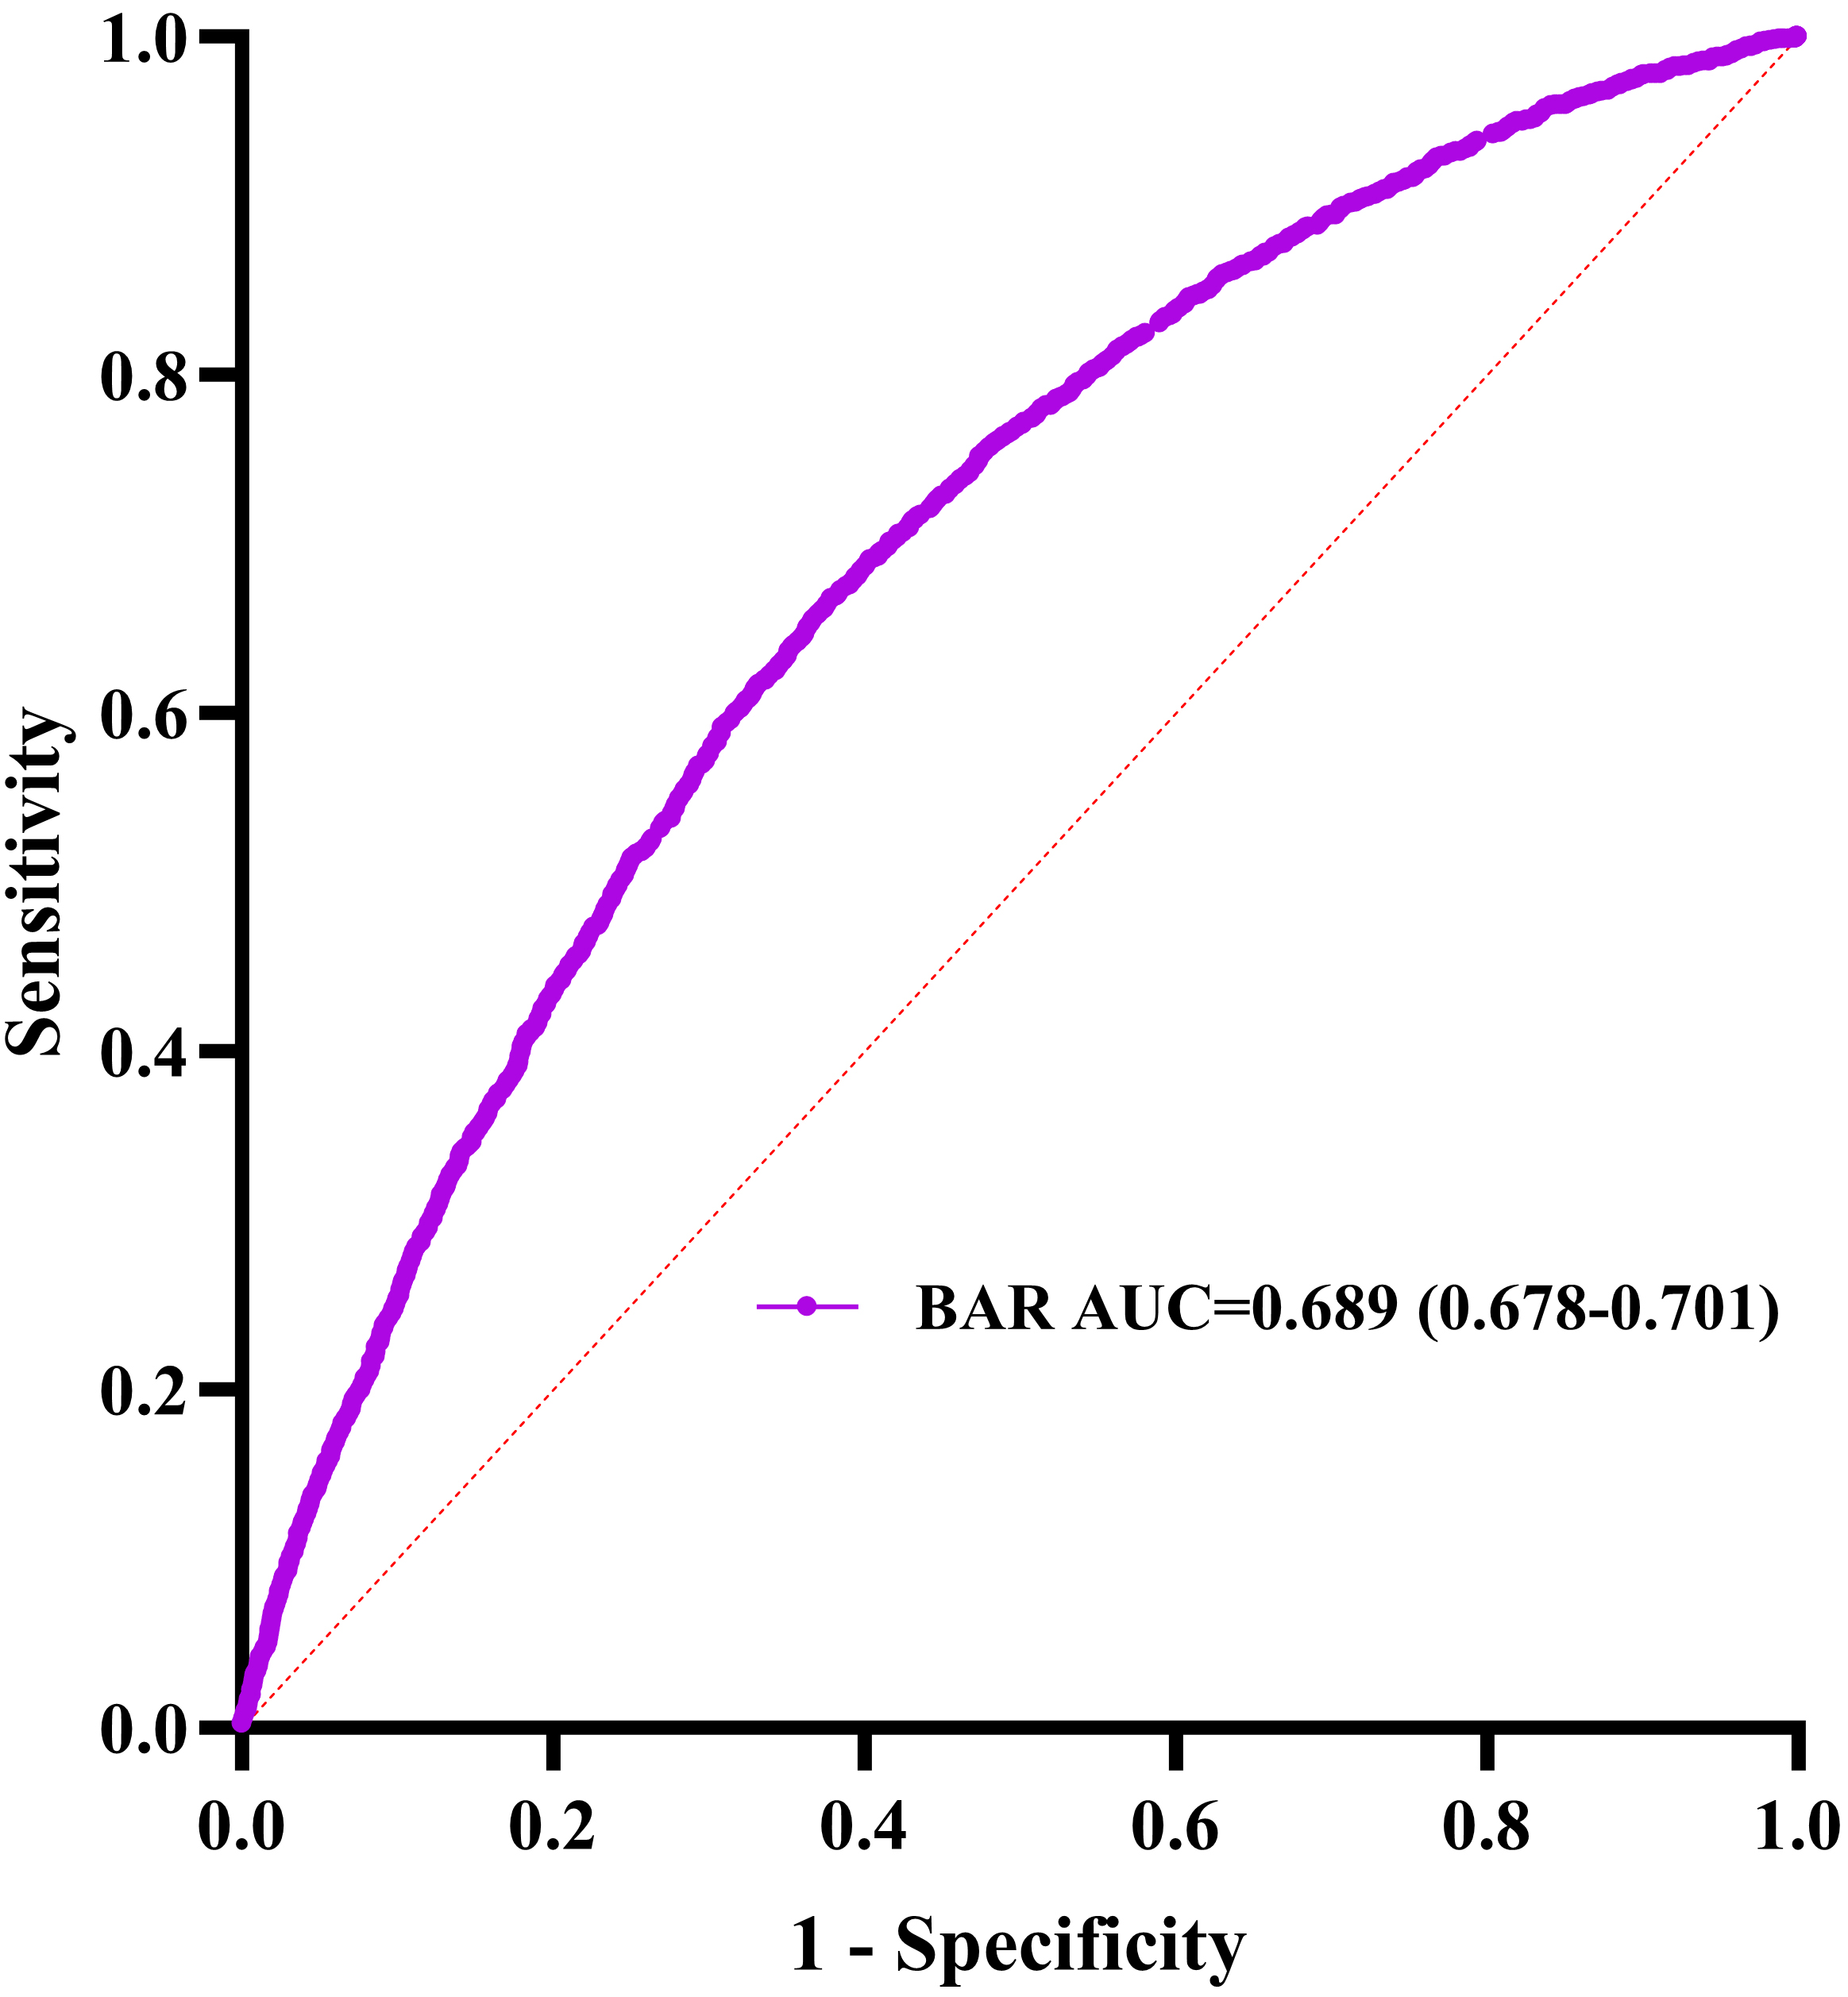 Fig. 4.
Blood urea nitrogen receiver operating characteristic curve analysis for in-hospital mortality prediction. AUC, area under the curve.
This study aimed to develop a predictive model for in-hospital mortality in
AF patients. Ten risk indicators were initially selected
using LASSO regression (Fig. 5). Multivariate logistic regression analysis (Table 3) was then applied to construct a nomogram integrating independent predictors:
age (odds ratio, [OR] = 1.030, 95% CI: 1.025–1.035, p
| Univariate | Multivariate | |||
| OR (95% CI) | p value | OR (95% CI) | p value | |
| Age | 1.025 (1.022–1.028) | 1.030 (1.025–1.035) | ||
| Vasopressors | 1.112 (1.106–1.118) | 1.029 (0.896–1.182) | 0.686 | |
| Mechanical ventilation | 12.552 (11.288–13.957) | 11.204 (9.781–12.835) | ||
| SOFA | 1.248 (1.234–1.263) | 1.077 (1.054–1.100) | ||
| OASIA | 4.207 (3.826–4.625) | 0.999 (0.990–1.008) | 0.801 | |
| SAPS II | 1.075 (1.071–1.078) | 1.034 (1.028–1.040) | ||
| Heart rate | 1.017 (1.014–1.02) | 1.017 (1.014–1.021) | ||
| White blood cell | 1.028 (1.023–1.033) | 1.010 (1.005–1.015) | ||
| Albumin | 0.487 (0.455–0.521) | 0.824 (0.753–0.902) | ||
| BAR | 3.206 (2.922–3.518) | 1.284 (1.126–1.464) | ||
SOFA, sequential organ failure assessment; OASIS, Oxford Acute Severity of Illness Score; ICU, intensive care unit; SAPS II, simplified acute physiology score II; OR, odds ratio.
 Fig. 5.
Finding the important variables associated with hospital death
in critically sick AF patients applying the analysis of least absolute shrinkage
and selection operator (LASSO) regression. (A) Using a rigorous cross-validation
strategy to optimize the
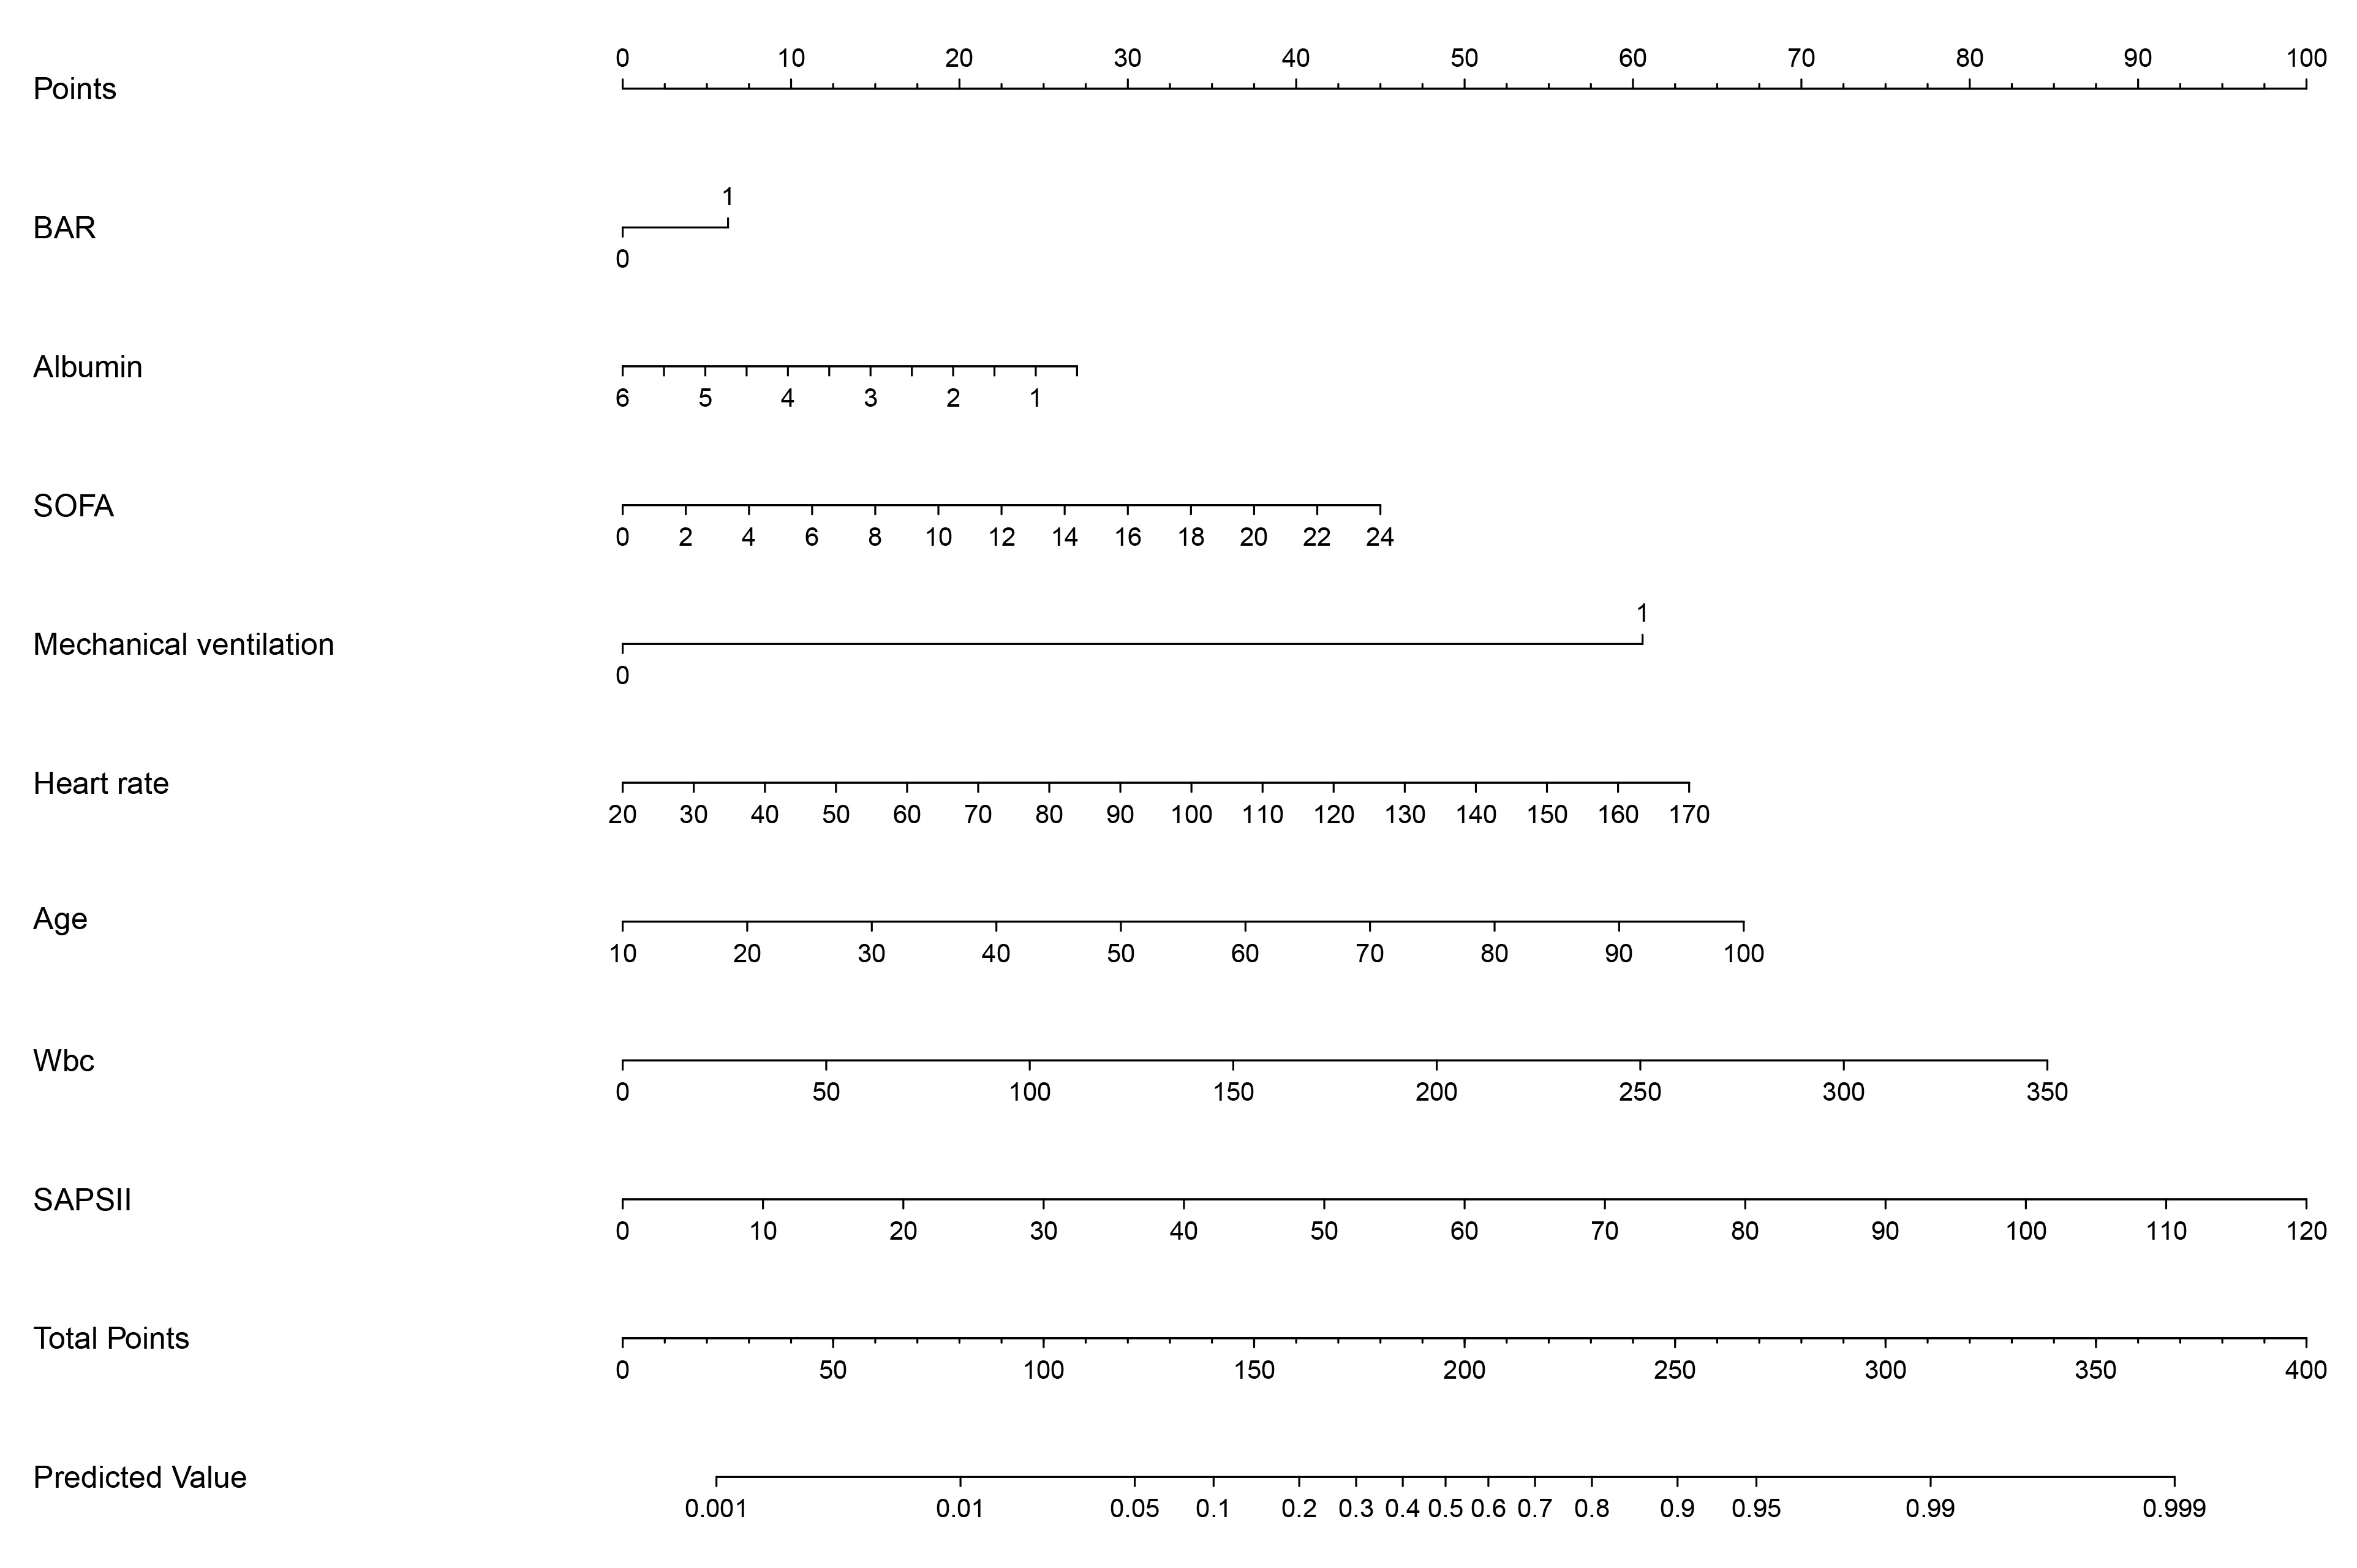 Fig. 6.
The nomogram displays the scoring system of the predictive model for in-hospital mortality among critically ill patients with AF. Wbc, white blood cell count.
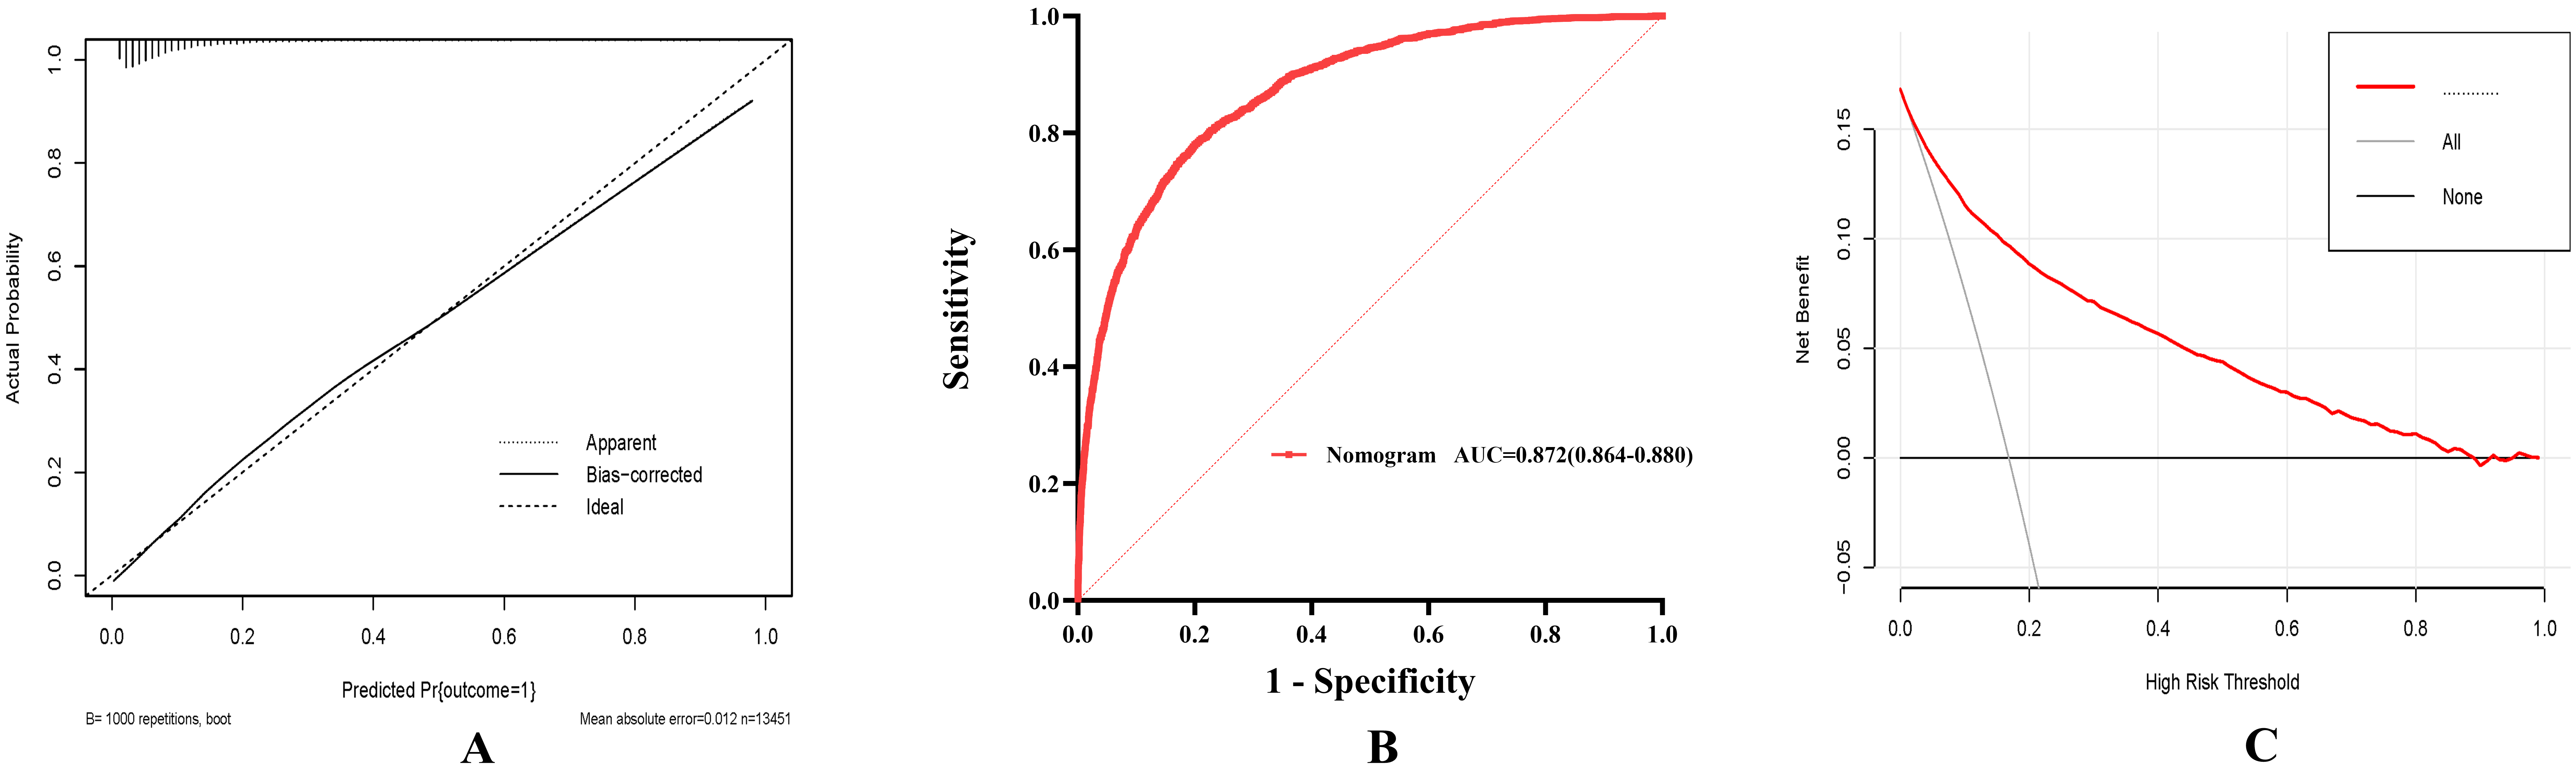 Fig. 7.
To determine the clinical utilities of the predictive nomogram. (A) The in-hospital mortality prediction calibration curve. (B) Blood urea nitrogen and nomogram receiver operating characteristic curve analysis for in-hospital mortality prediction. (C) Predicting in-hospital mortality using the nomogram’s decision curve analysis (DCA).
Multivariable Cox regression analysis (Table 4) demonstrated that the BAR retained significant prognostic value for in-hospital mortality, persisting as an independent predictor across sequentially adjusted models.
| Methods | HR (95% CI) | p value | |
| For continuous variable, BAR | |||
| Unadjusted | 1.041 (1.038–1.044) | ||
| Adjusted for model I | 1.039 (1.036–1.042) | ||
| Adjusted for model II | 1.008 (1.004–1.012) | ||
| Adjusted for model III | 1.006 (1.002–1.011) | 0.004 | |
| For categorical variable, BAR | |||
| Unadjusted | 2.850 (2.621–3.099) | ||
| Adjusted for model I | 1.302 (1.179–1.438) | ||
| Adjusted for model II | 1.221 (1.102–1.352) | ||
| Adjusted for model III | 2.577 (2.366–2.808) | ||
Model I: Adjusted for age, gender, weight.
Model II: Adjusted for age, gender, weight, myocardial infarct, congestive heart failure, diabetes, chronic kidney disease, charlson comorbidity index, mechanical ventilation, vasopressors.
Model III: Adjusted for age, gender, weight, myocardial infarct, congestive heart failure, diabetes, chronic kidney disease, charlson comorbidity index, mechanical ventilation, vasopressors, SOFA score, OASIS score, SAPS II score, mean arterial pressure, heart rate, white blood cell, hemoglobin, platelet.
We are the first to examine the usefulness of BAR, a straightforward and practical indicator, in determining the risk of in-hospital death for AF patients admitted to the intensive care unit. We determined that 8.9 was the ideal BAR cut-off value, and patients were categorized into high- and low-BAR groups accordingly. According to our study, participants in the high-BAR group experienced a greater in-hospital death rate and noticeably longer hospital and intensive care unit stays than those in the low-BAR group. This result emphasizes how well BAR predicts the probability of in-hospital death for AF patients admitted to the ICU. Furthermore, this study not only validates the predictive power of the BUN/albumin ratio (BAR) but also demonstrates the superior performance of a nomogram model that integrates BAR with other prognostic factors in predicting ICU mortality among patients with atrial fibrillation. This model exhibits excellent discrimination and calibration performance, coupled with robust clinical utility. Finally, through multivariate Cox regression analysis, we found that both BAR alone and the combined nomogram model consistently predicted in-hospital mortality among ICU-admitted AF patients across different models, providing a novel basis for clinical prognosis assessment.
AF remains the predominant arrhythmia observed in intensive care units (ICUs), paralleling its status as the most prevalent cardiac rhythm disorder globally. Given the elevated mortality risk among critically ill ICU patients compared to general hospital populations, developing a validated prognostic tool tailored for this high-risk cohort is clinically vital. Our study aimed to address this gap by integrating two readily measurable biomarkers—serum albumin and blood urea nitrogen (BUN)—into a mortality prediction model for ICU-admitted AF patients. This framework not only incorporates these biochemical parameters but also synergizes them with established clinical covariates, which we systematically developed and rigorously validated to stratify in-hospital death risk.
The prognostic utility of the BAR has been explored across multiple cardiovascular and renal conditions. In chronic heart failure, Lin et al. [14] identified BAR as an independent predictor of 90-day all-cause mortality, while Zhang et al. [18] demonstrated its robust association with ventricular aneurysm risk No-ST-segment elevation myocardial infarction, even after multivariable adjustment. Similarly, Sevdımbas et al. [19] linked elevated BAR to adverse outcomes in non-ST-elevation myocardial infarction (NSTEMI) cohorts. Beyond cardiac pathologies, Shi et al. [20] established BAR as a prognostic marker for 28-day and 1-year mortality in acute kidney injury, and Liu et al. [21] further validated its predictive value for long-term mortality in type 2 diabetic nephropathy.
Our analysis demonstrated the robust prognostic value of the BAR for predicting
in-hospital mortality in critically ill AF patients. Patients with BAR
In our investigation, among AF patients admitted to the intensive care unit, BAR was positively connected with the probability of death. Research explicitly connecting BAR to mortality risk in AF patients, especially those hospitalized to the intensive care unit, is still lacking. We hypothesize that the following could be the cause of this: The urea cycle in the liver transforms BUN, a metabolic result of protein digestion and breakdown, into urea, which is then filtered out by the glomerulus. The concentration of BUN indicates the equilibrium between urea production and renal excretion [35]. First, the formation and progression of CVD are significantly influenced by the interaction between the kidneys and heart [36]. BUN has been linked to the prognosis of cardiovascular disease, according to meta-analyses. Furthermore, serum urea nitrogen is associated with neurohormonal activity in addition to reflecting renal function [37]. An increase in urea nitrogen mirrors the cumulative effects of hemodynamic and neurohormonal changes, leading to impaired renal perfusion [38], where neurohormones are integral to the development and prognosis of AF [39]. Additionally, studies have demonstrated that renin-angiotensin system (RAAS) inhibitors can not only prevent the onset of AF but also improve its prognosis [40]. Secondly, numerous studies have confirmed the predictive value of serum urea nitrogen in the occurrence and prognosis of heart failure [41, 42, 43, 44], and AF and heart failure often coexist [45], suggesting that serum urea nitrogen may also contribute to poor prognosis in AF patients through this mechanism. In the setting of hypoalbuminemia, serum albumin, another component of BAR, has been linked in the past to the prognosis of various CVD [46, 47, 48]. Although AF does not directly cause low albumin levels, we speculate that this may be due to the coexistence of AF and heart failure [45], where heart failure itself is a condition of inadequate organ perfusion due to cardiac overload. In the presence of hypoalbuminemia, further loss of fluid in the circulatory system exacerbates the vicious cycle, leading to poor prognosis [14]. Furthermore, any patient in the ICU, an environment prone to infections, malnutrition, liver dysfunction, and renal diseases, is susceptible to further albumin loss, disrupting fluid balance [47, 49]. Therefore, in our study, an elevated BAR reflects the overall condition and mortality risk among ICU-admitted patients with AF. Based on our findings, we believe that BAR and the risk prediction model have significant value in assessing the prevention and improvement of prognosis for AF patients by ICU physicians. However, further research is needed to elucidate the specific mechanisms underlying this indicator, guiding future clinical treatment strategies.
All research findings and conclusions in this retrospective analysis, which was based on the MIMIC-IV database, were taken from the general circumstances and laboratory test results that were obtained within 24 hours after admission. The relationship between continuous BAR trajectories and the outcomes of AF patients admitted to the intensive care unit is not only not adequately examined, but there is also a lack of prospective validation. Additionally, as this study is based on the single-center MIMIC-IV database, we plan to perform external validation in future research using multicenter databases such as the eICU Collaborative Research Database or Chinese critical care datasets. This will help assess the applicability of BAR across different geographic regions and healthcare systems. Limitations in the MIMIC database data, such as the absence of some AF-related scores and stratifications (such as CHA2DS2-VASc score, anticoagulant drug use, and AF type), also add bias to the findings.
This study demonstrated that there was a higher risk of in-hospital death for AF patients with high BAR who were admitted to the intensive care unit. Furthermore, the nomogram that combined BAR with other pertinent factors showed strong predictive power in estimating the likelihood of in-hospital death. To further validate our findings, more extensive, prospective research is required in the future.
The datasets used during the current study available from the corresponding author on reasonable request.
TH designed the research study. QL provided help and advice on conceptual execution. QL and HX collected the data and performed the statistical analysis. HX wrote and revised the manuscript. All authors contributed to editorial changes in the manuscript. All the authors have accepted responsibility for the entire content of this submitted manuscript and approved submission. All authors have participated sufficiently in the work and agreed to be accountable for all aspects of the work.
As this study was an analysis of the public databases, approval of the Institutional Review Board (IRB) was completely exempted. And the ethical approval statement and the need for informed consent were waived for this manuscript.
Not applicable.
This research received no external funding.
The authors declare no conflict of interest.
Supplementary material associated with this article can be found, in the online version, at https://doi.org/10.31083/RCM36596.
References
Publisher’s Note: IMR Press stays neutral with regard to jurisdictional claims in published maps and institutional affiliations.