


 , Zhe Wang 3,†, Tong Gao 2, Baofu Wang 2, Yijie Gao 2, Mengru Liu 2, Hong Jiang 2, Xianlun Li 1,2,*
1 China-Japan Friendship Hospital (Institute of Clinical Medical Sciences), Chinese Academy of Medical Sciences & Peking Union Medical College, 100029 Beijing, China
2 Department of Integrative Medicine Cardiology, China-Japan Friendship Hospital, 100029 Beijing, China
3 Department of Cardiology, Beijing Anzhen Hospital, Capital Medical University, 100029 Beijing, China
†These authors contributed equally.
Abstract
Anemia and iron deficiency (ID) are common in patients with acute myocardial infarction (AMI), especially those in intensive care units (ICU). This study investigated the impact of hemoglobin (Hb) and ID on the short-term mortality of critically ill patients with AMI.
Overall 992 AMI patients with their first ICU admission were included in this analysis. ID was defined as serum ferritin <100 ng/mL or transferrin saturation (TSAT) <20%. Patients were categorized into four groups according to their Hb concentrations and the presence of ID. Kaplan-Meier survival analysis was used to assess differences in all-cause mortality between the different groups, and Cox regression models to identify risk factors for all-cause mortality.
Anemia was present in 89.5% of patients, while 65.9% suffered from ID. Patients in the group with Hb <9 g/dL and without ID were the youngest, yet they exhibited the highest severity scores. The Kaplan–Meier analysis showed that this group had a higher rate of all-cause mortality compared to the other three groups (Log-rank test p = 0.005). Moreover, multivariate Cox regression analysis revealed that Hb <9 g/dL and no ID was associated with a higher risk of all-cause mortality at 120 days (hazard ratio 1.512, 95% confidence interval 1.031–2.217, p = 0.034) when compared to the reference group (Hb ≥9 g/dL and no ID). Additionally, multivariate Cox regression analysis showed that lower Hb was linked to increased rates of all-cause mortality at 30, 60, 90, and 120 days. Elevated levels of ferritin and TSAT were also associated with increased all-cause mortality at 60, 90, and 120 days. Compared to patients without ID, those with ID had a decreased risk of all-cause mortality at 60, 90, and 120 days.
Anemia and ID were prevalent in ICU patients with AMI. Patients with Hb <9 g/dL and without ID showed higher 120-day all-cause mortality. Additionally, lower Hb, elevated ferritin, and increased TSAT levels were identified as significant risk factors for short-term all-cause mortality in these patients.
Keywords
- intensive care units
- hemoglobins
- iron deficiencies
- myocardial infarction
- mortality
Anemia is prevalent in hospitalized patients with acute myocardial infarction (AMI), Previous study indicates that anemia is present in up to one in four patients with acute coronary syndrome (ACS) [1]. In the realm of critical care, anemia is exceedingly prevalent, affecting approximately two-thirds of patients upon admission [2]. The presence of anemia can further reduce the oxygen supply to ischemic myocardial tissue caused by ACS. Existing study indicates that patients with ACS who also have anemia are at a heightened risk for more severe outcomes, including significantly higher rates of in-hospital and long-term mortality [3]. Furthermore, these patients are more likely to experience heart failure and have an elevated risk of major bleeding events, and reinfarction [3, 4, 5].
Beyond anemia, iron deficiency (ID), defined by reduced iron bioavailability and storage, is a key factor influencing oxygen metabolism. It is prevalent among patients with cardiovascular disease, affecting nearly half of those with coronary artery disease (CAD) [6]. Regardless of the presence of anemia, ID has been identified as a critical predictor of adverse outcomes in heart failure (HF) patients [7]. A study has demonstrated that intravenous iron replacement can significantly improve the prognosis for these patients [8]. However, the impact of ID on the prognosis of patients with AMI remains controversial. Moreover, there is a notable scarcity of research on its correlation with short-term outcomes.
Anemia and ID may have additional associations with adverse outcomes in patients with AMI. Currently, there is a lack of research on the impact of hemoglobin (Hb) concentration and ID on the prognosis of severe patients with AMI. Therefore, this study utilized the American Medical Information Mart for Intensive Care IV (MIMIC-IV) cohort to focus on critically ill patients with AMI and explore the effects of Hb and ID on their short-term prognosis.
This retrospective study used the freely accessible MIMIC-IV database (https://mimic.mit.edu), which contains over 50,000 intensive care units (ICU) admissions at Beth Israel Deaconess Medical Center (Boston, Massachusetts) from 2008 to 2019 [9]. The population of this study is critically ill patients diagnosed with AMI in the MIMIC-IV database. The international classification of diseases (ICD) codes used to screen for the diagnosis of AMI mainly include 410 in ICD-9, and I21 in ICD-10. Inclusion criteria were: (1) First hospital admission with initial ICU stay; (2) Diagnosis includes AMI. Exclusion criteria were: (1) Age outside the range of 18 to 89 years; (2) ICU stay less than 24 hours; (3) Missing data for key research indicators (Hb, ferritin, serum iron, total iron binding capacity). The population screening process can be found in Fig. 1.
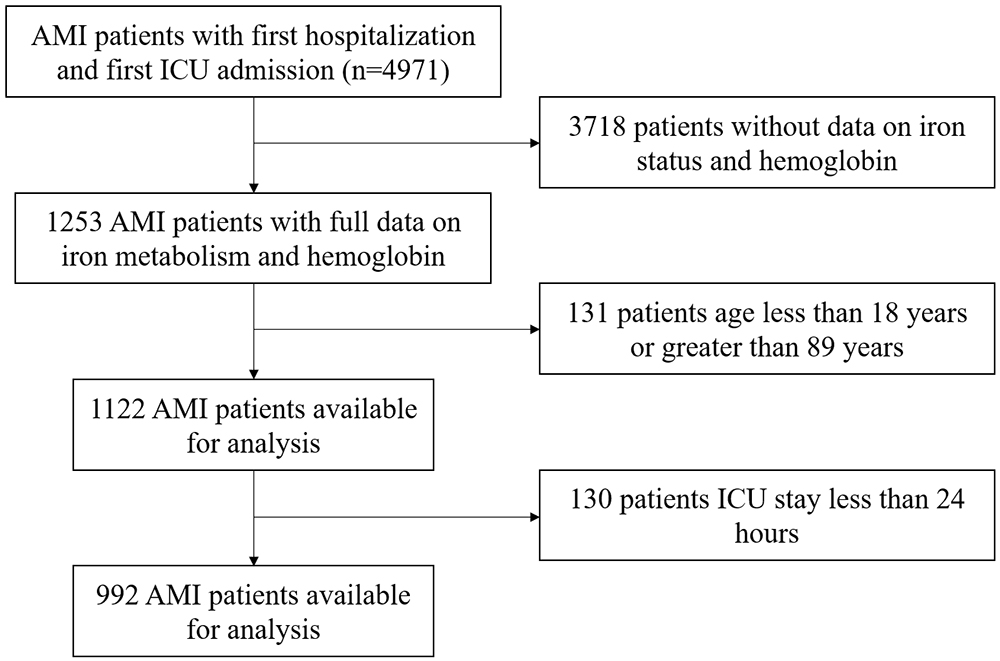 Fig. 1.
The flowchart illustrated the selection of patients from the MIMIC-IV database. AMI, acute myocardial infarction; ICU, intensive care units; MIMIC-IV, Medical Information Mart for Intensive Care IV.
We have undertaken a comprehensive training course offered by the National Institutes of Health and successfully passed the examination on “Protecting Human Research Participants” (certification number: 60366313). Navicat for PostgreSQL (version 16.0, PremiumSoft CyberTech Ltd., Hong Kong, China) was employed to filter data and extract baseline information, comorbidities, vital signs, laboratory tests, disease severity scoring, treatment measures conducted during hospitalization, and follow-up outcomes. The diagnosis of complications is based on ICD-9 and ICD-10 codes. The indicators related to iron status (ferritin, serum iron, total iron binding capacity) were based on the first measurement results during the patient’s hospitalization. Hb and other laboratory tests, as well as vital signs, are all based on the average values within 24 hours after the patient’s admission to the ICU.
The study’s primary endpoint was 120-day mortality after admission. Secondary
endpoints were 30-day, 60-day, and 90-day mortality. Anemia was defined according
to the World Health Organization criteria as Hb
Continuous data were presented as mean
A total of 992 critically ill patients with AMI were included in the analysis
following screening for appropriate criteria. The Hb concentration of the overall
study population was 9.8
| All (n = 992) | Hb |
Hb |
Hb |
Hb |
p-value | |
| Age (years) | 72.4 (63.8, 79.6) | 73.1 (64.5, 80.0) | 71.9 (62.5, 78.8) | 69.4 (61.5, 77.7) | 75.6 (67.6, 80.8) | |
| Female (n, %) | 408 (41.1) | 82 (39.0) | 178 (42.6) | 44 (34.4) | 104 (44.1) | 0.262 |
| Hypertension (n, %) | 782 (78.8) | 156 (74.3) | 327 (78.2) | 101 (78.9) | 198 (83.9) | 0.097 |
| Congestive heart failure (n, %) | 644 (64.9) | 119 (56.7) | 270 (64.6) | 77 (60.2) | 178 (75.4) | |
| Atrial fibrillation (n, %) | 361 (36.3) | 75 (35.7) | 150 (35.9) | 38 (29.7) | 98 (41.5) | 0.154 |
| Dyslipidemia (n, %) | 530 (53.4) | 107 (51.0) | 229 (54.8) | 63 (49.2) | 131 (55.5) | 0.542 |
| Diabetes (n, %) | 512 (51.6) | 91 (43.3) | 214 (51.2) | 68 (53.1) | 139 (58.9) | 0.012 |
| Cerebrovascular disease (n, %) | 137 (13.8) | 21 (10.0) | 66 (15.8) | 17 (13.3) | 33 (14.0) | 0.264 |
| Chronic pulmonary disease (n, %) | 309 (311) | 66 (31.4) | 131 (31.3) | 26 (20.3) | 86 (36.4) | 0.018 |
| Chronic kidney diseases (n, %) | 453 (45.7) | 80 (38.1) | 168 (40.2) | 76 (59.4) | 129 (54.7) | |
| Heart rate (bpm) | 84.3 |
83.3 |
85.0 |
85.6 |
83.4 |
0.328 |
| SBP (mmHg) | 115.7 |
116.0 |
114.8 |
117.6 |
115.9 |
0.330 |
| RR (cpm) | 19.9 |
19.4 |
20.2 |
20.1 |
19.7 |
0.068 |
| T (°C) | 36.8 |
36.8 |
36.8 |
36.8 |
36.8 |
0.654 |
| WBC (K/µL) | 11.7 (8.8, 15.2) | 11.8 (8.8, 15.7) | 11.8 (9.2, 15.4) | 10.6 (7.2, 15.1) | 11.2 (8.6, 14.7) | 0.209 |
| Platelets (K/µL) | 198.5 (143.6, 265.3) | 182.8 (136.5, 247.3) | 204.3 (155.0, 267.6) | 175.3 (103.8, 232.4) | 213.8 (151.0, 294.0) | |
| Troponin_T (µg/L) | 0.24 (0.08, 0.70) | 0.20 (0.06, 0.59) | 0.25 (0.08, 0.83) | 0.20 (0.08, 0.57) | 0.27 (0.08, 0.68) | 0.250 |
| BUN (mmol/L) | 31.7 (19.0, 52.0) | 27.5 (17.9, 44.5) | 27.8 (17.5, 45.1) | 47.3 (30.0, 72.0) | 38.3 (22.1, 61.0) | |
| Cr (mg/dL) | 1.5 (1.0, 2.6) | 1.4 (0.9, 2.7) | 1.3 (1.0, 2.3) | 2.3 (1.2, 4.0) | 1.6 (1.1, 2.5) | |
| FBG (mg/dL) | 144.5 (117.4, 186.9) | 142.8 (117.1, 183.8) | 146.2 (119.6, 190.8) | 136.6 (116.5, 180.3) | 146.1 (117.6, 187.6) | 0.560 |
| Sodium (mmol/L) | 138.0 |
138.2 |
137.9 |
138.1 |
138.2 |
0.797 |
| Potassium (mmol/L) | 4.4 |
4.4 |
4.4 |
4.6 |
4.5 |
0.014 |
| Calcium (mg/dL) | 8.4 |
8.3 |
8.5 |
8.3 |
8.3 |
0.002 |
| Anion gap (mEq/L) | 16.3 |
16.1 |
16.4 |
17.6 |
15.7 |
0.001 |
| INR | 1.3 (1.2, 1.5) | 1.3 (1.1, 1.5) | 1.3 (1.2, 1.5) | 1.4 (1.2, 1.6) | 1.4 (1.2, 1.6) | 0.004 |
| PT (seconds) | 14.2 (12.7, 16.8) | 13.9 (12.4, 16.1) | 14.1 (12.5, 16.5) | 14.7 (13.0, 18.0) | 14.6 (13.0, 17.5) | 0.009 |
| PTT (seconds) | 36.8 (29.6, 58.3) | 37.1 (29.8, 61.6) | 37.7 (29.6, 60.8) | 35.4 (29.6, 52.6) | 35.7 (29.6, 56.7) | 0.781 |
| SOFA | 6.0 |
6.4 |
5.7 |
7.2 |
5.7 |
|
| SAPS 2 | 42.3 |
43.2 |
41.1 |
45.6 |
41.9 |
0.009 |
| SAPS 3 | 52.3 |
53.0 |
51.1 |
58.4 |
50.6 |
0.002 |
| LODS | 5.8 |
5.7 |
5.7 |
6.7 |
5.8 |
0.007 |
| OASIS | 33.6 |
34.5 |
33.5 |
34.5 |
32.6 |
0.075 |
| SIRS | 3.0 (2.0, 3.0) | 3.0 (2.0, 3.0) | 3.0 (2.0, 3.0) | 3.0 (2.0, 3.0) | 3.0 (2.0, 3.0) | 0.702 |
| PCI (n, %) | 129 (13.0) | 23 (11.0) | 71 (17.0) | 9 (7.0) | 26 (11.0) | 0.009 |
| CABG (n, %) | 127 (12.8) | 28 (13.3) | 57 (13.6) | 5 (3.9) | 37 (15.7) | 0.011 |
| Mechanical ventilation (n, %) | 896 (90.3) | 185 (88.1) | 386 (92.3) | 112 (95.3) | 213 (90.3) | 0.229 |
| RRT (n, %) | 97 (9.7) | 25 (11.9) | 34 (8.1) | 23 (18.0) | 15 (6.4) | 0.002 |
| IABP (n, %) | 61 (6.1) | 10 (4.8) | 38 (9.1) | 4 (3.1) | 9 (3.8) | 0.011 |
| Aspirin (n, %) | 888 (89.5) | 185 (88.1) | 385 (92.1) | 98 (76.6) | 220 (93.2) | |
| Digoxin (n, %) | 62 (6.3) | 10 (4.8) | 34 (8.1) | 6 (4.7) | 12 (5.1) | 0.221 |
| Diuretic (n, %) | 778 (78.4) | 146 (69.5) | 332 (79.4) | 100 (78.1) | 200 (84.7) | 0.001 |
| LOS Hos (day) | 11.6 (7.1, 18.5) | 10.9 (6.2, 20.3) | 11.0 (6.9, 18.5) | 13.8 (8.6, 21.7) | 12.1 (6.9, 17.0) | 0.043 |
| LOS ICU (day) | 3.1 (1.9, 6.1) | 3.1 (2.0, 6.4) | 3.3 (2.0, 6.2) | 3.1 (1.8, 5.8) | 3.0 (1.9, 5.6) | 0.363 |
| In-hospital mortality (n, %) | 163 (16.4) | 33 (15.7) | 62 (14.8) | 30 (23.4) | 38 (16.1) | 0.142 |
| 7-day mortality (n, %) | 65 (6.5) | 16 (7.6) | 25 (6.0) | 7 (5.5) | 17 (7.2) | 0.796 |
| 30-day mortality (n, %) | 179 (18.0) | 37 (17.6) | 65 (15.6) | 34 (26.6) | 43 (18.2) | 0.045 |
| 60-day mortality (n, %) | 236 (23.8) | 52 (24.8) | 81 (19.4) | 46 (35.9) | 57 (24.2) | 0.002 |
| 90-day mortality (n, %) | 266 (26.8) | 57 (27.1) | 93 (22.2) | 51 (39.8) | 65 (27.5) | 0.001 |
| 120-day mortality (n, %) | 289 (29.1) | 60 (28.6) | 108 (25.8) | 54 (42.2) | 67 (28.4) | 0.005 |
Abbreviations: Hb, hemoglobin; ID, iron deficiency; SBP, systolic blood pressure; RR, respiratory rate; T, temperature; WBC, white blood cell count; BUN, blood urea nitrogen; Cr, creatinine; FBG, fasting blood glucose; IABP, intra-aortic balloon pump; INR, international normalized ratio; PT, prothrombin time; PTT, partial thromboplastin time; PCI, percutaneous coronary intervention; CABG, coronary artery bypass grafting; RRT, renal replacement therapy; SOFA, Sequential Organ Failure Assessment; SAPS, Simplified Acute Physiology Score; LODS, Logistic Organ Dysfunction Score; OASIS, Oxford Acute Severity of Illness Score; SIRS, Systemic Inflammatory Response Syndrome Score; LOS Hos, length of hospital stay.
Significant differences in age were observed among the groups (p
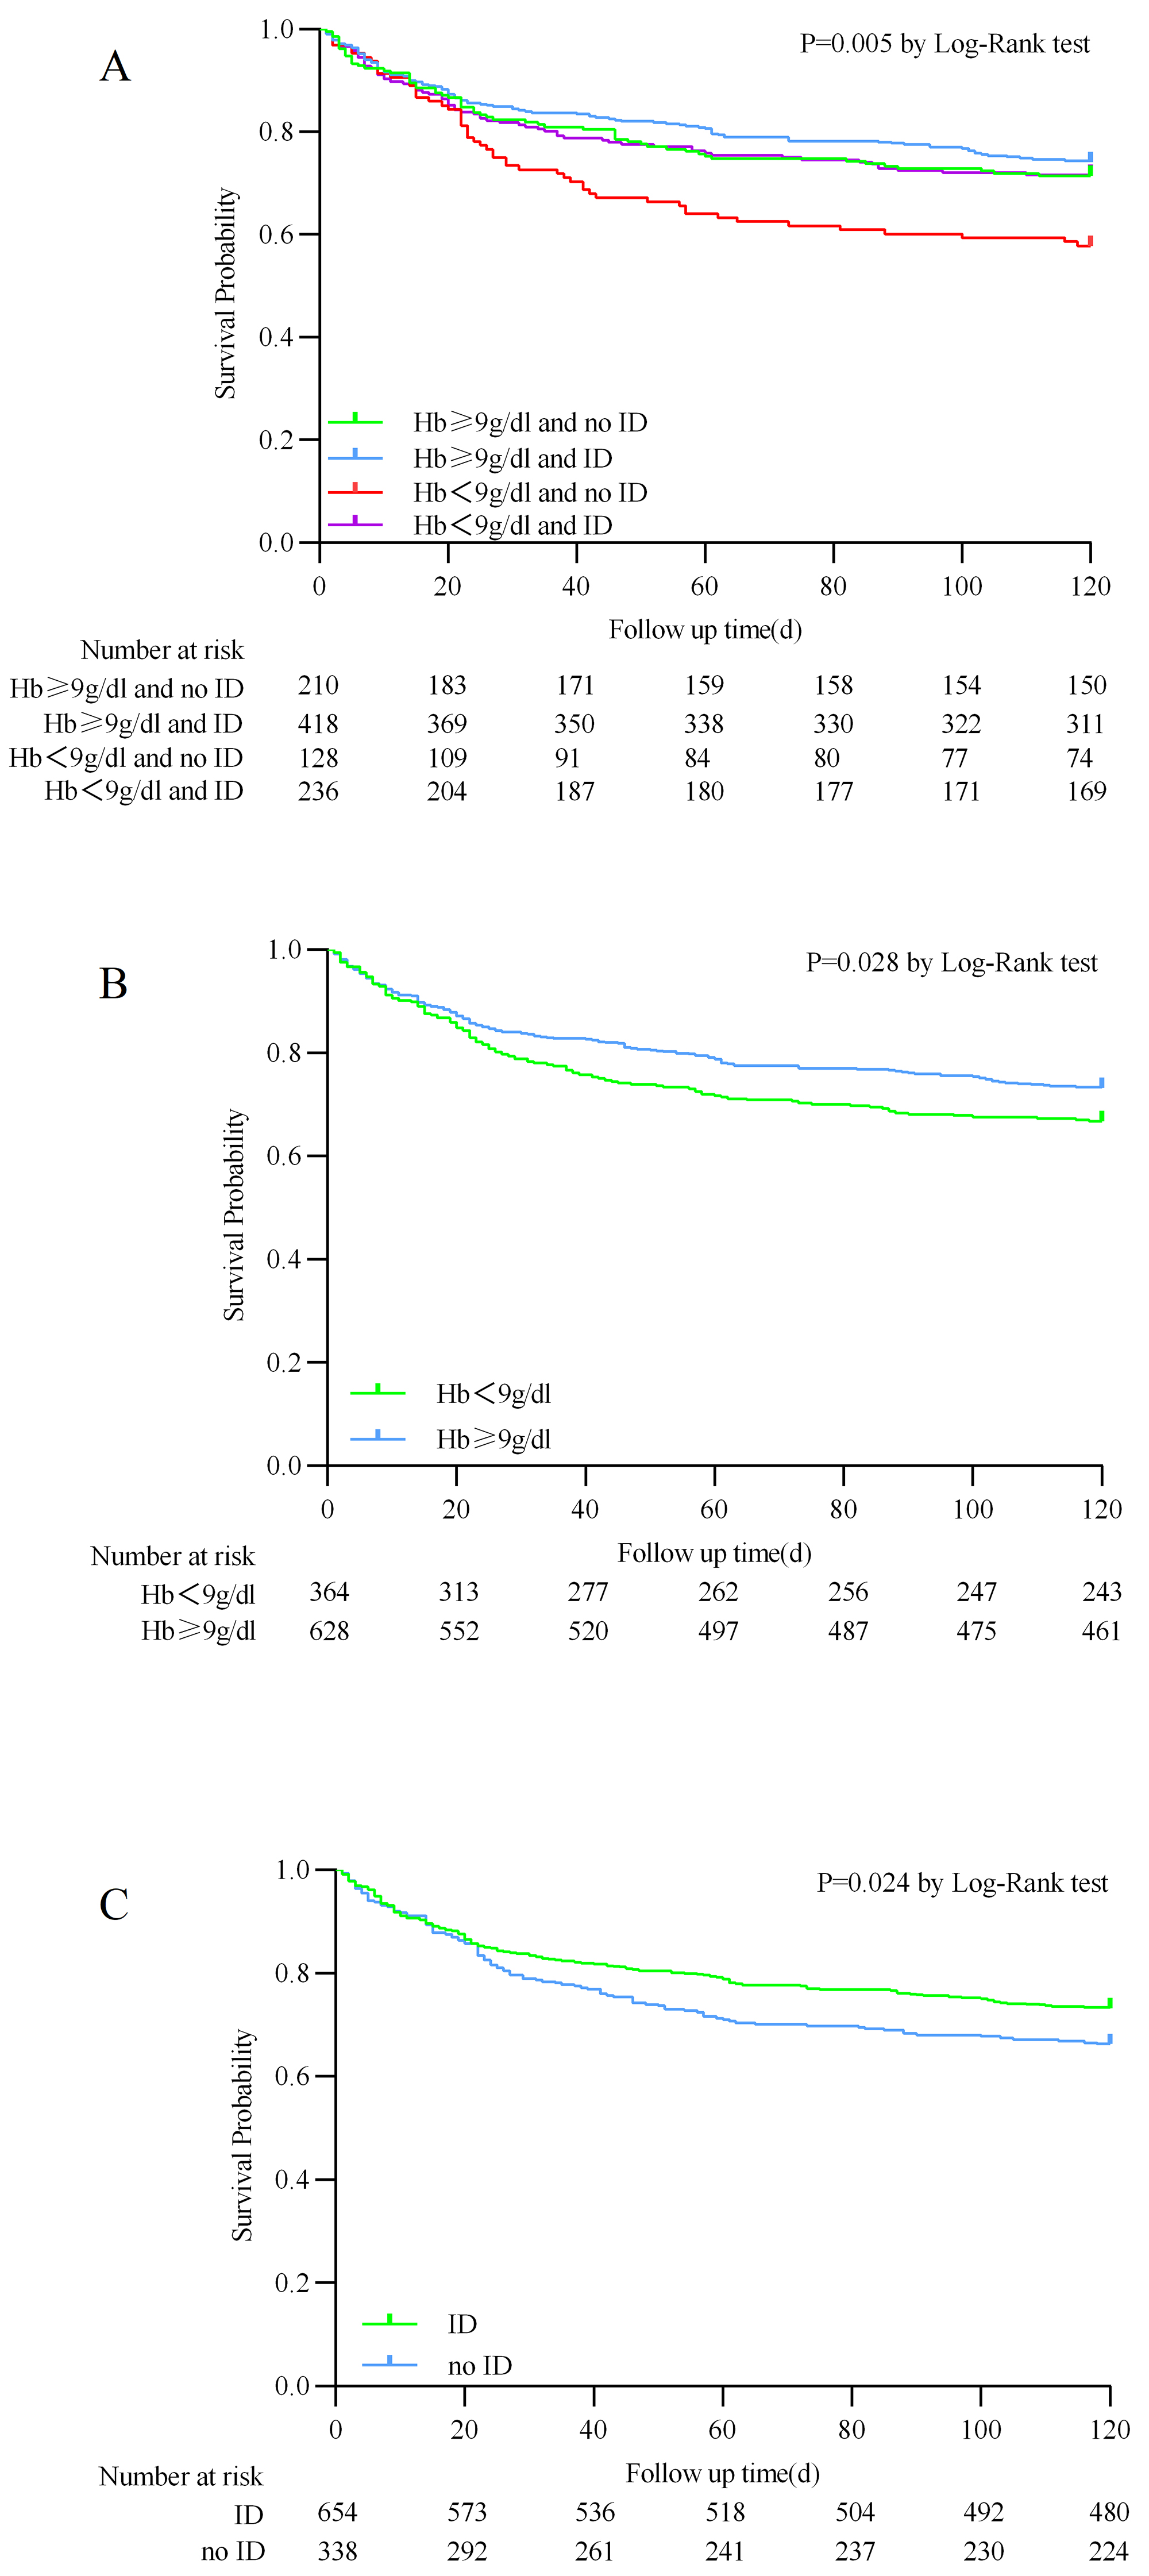
The overall mortality rate of critically ill patients with AMI was high, with an
all-cause mortality rate of 29.1% at 120-days. No significant differences in the
in-hospital and 7-day mortality rates were observed between the four groups of
patients. However, patients in the Hb
The Kaplan–Meier analysis showed that the Hb
 Fig. 2.
Kaplan–Meier survival analysis curves for 120-day all-cause mortality. (A) Stratified by hemoglobin and iron deficiency. (B) Stratified by hemoglobin. (C) Stratified by iron deficiency.
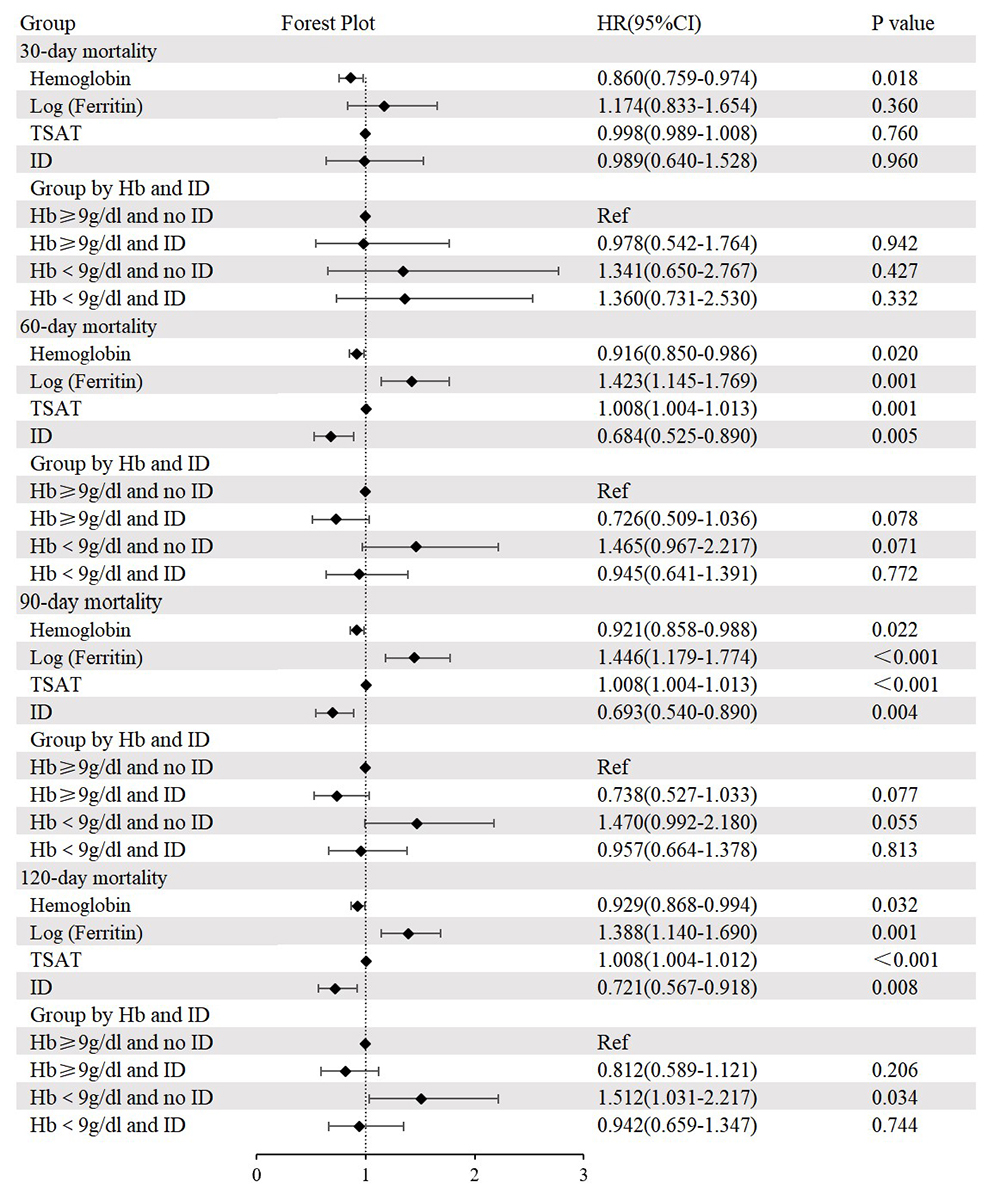
In the univariate analysis, age, dyslipidemia, cerebrovascular disease, chronic
pulmonary disease, heart rate, respiratory rate, systolic blood pressure,
temperature, fasting blood glucose, blood urea nitrogen, anion gap, international
normalized ratio, percutaneous coronary intervention (PCI), and coronary artery
bypass grafting (CABG), and severity scores were significantly associated with
the 120-day mortality rate (all p
Following adjustments for age, sex, dyslipidemia, cerebrovascular disease,
chronic pulmonary disease, heart rate, respiratory rate, systolic blood pressure,
temperature, fasting blood glucose, blood urea nitrogen, anion gap, international
normalized ratio, PCI, and CABG, the multivariate Cox regression analysis
revealed that the group with Hb
 Fig. 3.
Cox regression analysis and forest plot for 30-day, 60-day, 90-day, and 120-day all-cause mortality. Adjusted for age, sex, dyslipidemia, cerebrovascular disease, chronic pulmonary disease, heart rate, respiratory rate, systolic blood pressure, temperature, fasting blood glucose, blood urea nitrogen, anion gap, international normalized ratio, percutaneous coronary intervention, and coronary artery bypass grafting. HR, hazard ratio; CI, confidence interval; TSAT, transferrin saturation; Ref, reference.
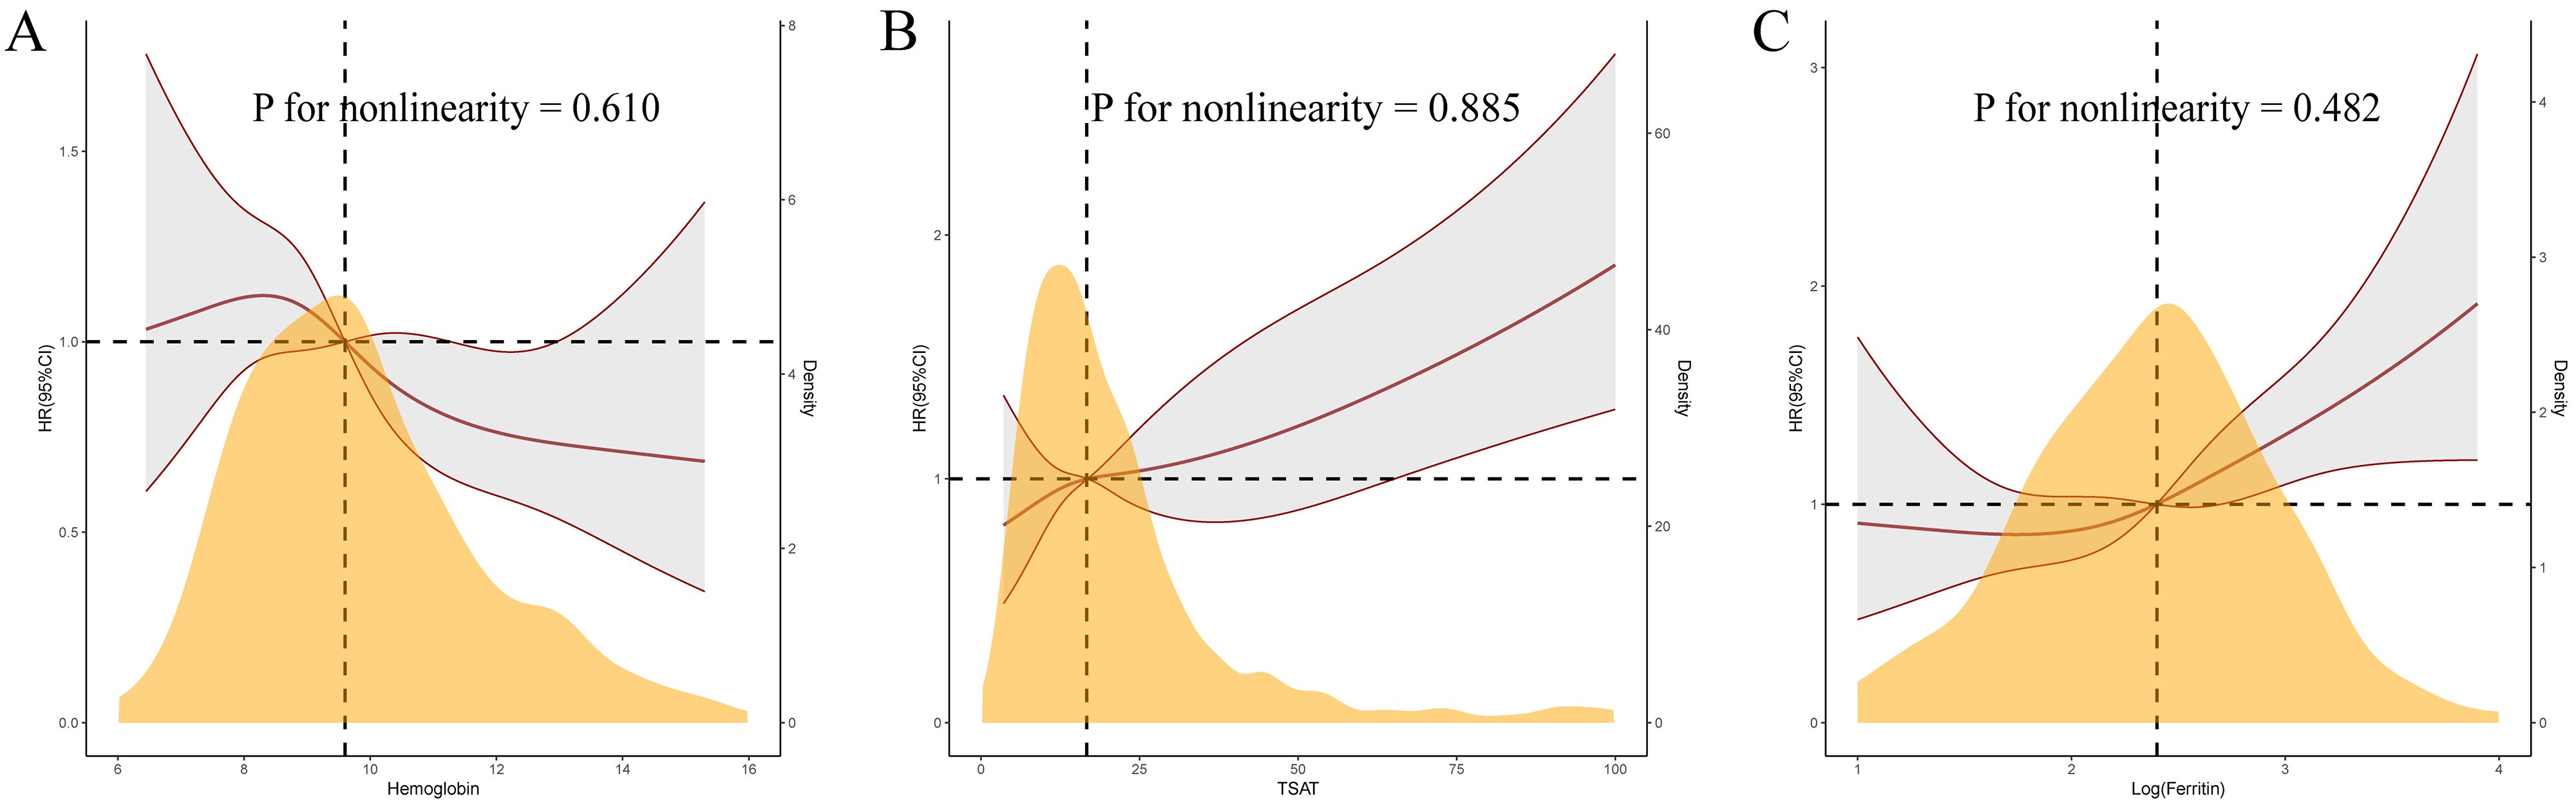
 Fig. 4.
Restricted cubic spline curves for 120-day mortality by hemoglobin (A), transferrin saturation (B), and log-ferritin (C) after covariates adjustment.
Following stratification for the presence of congestive heart failure, chronic
kidney diseases, diabetes, and revascularization. An interaction was present
between revascularization and log-ferritin (p = 0.045). Elevated
log-ferritin (HR 1.312, 95% CI 1.065–1.617, p = 0.011) was associated
with a higher mortality rate in patients who did not undergo revascularization,
whereas this association was not statistically significant in patients who
underwent revascularization. Log-ferritin levels were 2.41
 Fig. 5.
Forest plots of hazard ratios for 120-day mortality in different subgroups.
This retrospective study leverages the MIMIC-IV database to investigate the
impact of Hb concentration and ID on the short-term prognosis of critically ill
patients with AMI. We observed several critical findings: Firstly, anemia and ID
were common among patients with AMI in the ICU. Secondly, we identified that a
decrease in Hb concentration, an increase in TSAT, and an elevation in
log-ferritin were independent risk factors for short-term all-cause mortality in
these patients. Unexpectedly, ID was associated with a better outcome. These
relationships remain significant even after multi-factorial adjustment. Lastly,
using patients with Hb
Anemia is prevalent among critically ill patients, impacting approximately two-thirds of those admitted [2]. The high prevalence of anemia, reaching 89.5% in our study population, can be attributed to the fact that the subjects are patients with AMI in the ICU, and iron status assessments may be more frequent in patients with anemia. Previous meta-analysis results showed that in patients with ACS, anemia was associated with a significantly increased risk of both early and late mortality [3]. In patients with ST-elevation myocardial infarction (STEMI), cardiovascular mortality increased as the Hb level fell below 14 g/dL [11]. The findings of our study align closely with these observations. The underlying mechanism may be attributed to the fact that anemia can exacerbate ischemia by reducing oxygen delivery to the compromised myocardium and increasing myocardial oxygen demand due to elevated cardiac output, which is necessary to maintain adequate systemic oxygen delivery [12, 13]. Furthermore, inflammation, which can cause anemia without the need for ID, and oxidative stress may also play significant roles in exacerbating adverse outcomes [14, 15].
Iron is an essential trace element that plays a crucial role in Hb synthesis,
mitochondrial and cellular oxidative metabolism, the synthesis of essential
biomolecules, and various other functions [16]. ID is linked with poorer quality
of life, diminished exercise capacity, and worse prognosis in HF patients [17].
In a previous cohort study involving patients with HF, ID was typically defined
as a serum ferritin level below 100 ng/mL or a serum ferritin level between 100
and 299 ng/mL when the TSAT is below 20%. These cutoff points were borrowed from
the field of nephrology [18]. In a multicenter international study, a TSAT
The impact of ID on the prognosis of patients with CAD remains controversial. In
a retrospective subgroup analysis of patients with ACS from the AtheroGene cohort
study, with a median follow-up of 4 years, ID was found to strongly predict
cardiovascular mortality and non-fatal myocardial infarction [21]. Another
previous research indicated that lower levels of TSAT were independently
associated with an increased risk of long-term mortality in 252 elderly patients
with ACS [22]. Fujinaga et al. [23] found that ID on admission was
associated with elevated C-reactive protein (CRP) and advanced Killip stage, as well as increased
in-hospital mortality after PCI in non-anemic patients with STEMI. However,
another study involving 420 patients undergoing their first PCI for STEMI
revealed that ID was associated with mitochondrial injury and with better
in-hospital outcome [24]. Obradovic et al. [10], through an analysis of
427 patients with AMI complicated with cardiogenic shock in the Culprit Lesion Only PCI versus Multivessel PCI in Cardiogenic Shock (CULPRIT-SHOCK)
trial, discovered that concomitant anemia without ID presence in patients was
associated with an increased risk of all-cause mortality, renal replacement
therapy, and the composite endpoint within 30 days post-hospitalization, but ID
alone has no relevant impact on the clinical outcome. Similarly, our research
concludes that Hb
In this study, elevated levels of log-ferritin and TSAT were closely associated with poor prognoses, while ID corresponded with better outcomes. Several potential mechanisms are considered to underlie these associations. Primarily, the role of inflammation is critical. Serum ferritin, an acute-phase reactive protein, reflects systemic inflammatory states. Additionally, an elevation in ferritin might signify a complex interplay among ID, inflammation, and cellular damage [25]. This complexity means that elevated ferritin does not exclude the presence of ID. Therefore, the diagnostic utility of ferritin is limited in patients with coexisting conditions that have an inflammatory component. Furthermore, iron has been implicated in catalyzing the formation of reactive oxygen species, promoting the oxidation of lipoproteins, contributing to vascular dysfunction, and generating free radicals [26, 27]. Lastly, ferroptosis, an iron-dependent form of cell death, may play an important role. Previous studies have demonstrated that ferroptosis is involved in both the early and middle stages of myocardial infarction, as well as in myocardial ischemia-reperfusion injury [28, 29, 30].
This retrospective analysis using the MIMIC-IV database is the first to examine the impact of Hb and ID on the prognosis of ICU patients with AMI, yielding unexpected results that ID is linked to a better prognosis. The findings indicate that for critically ill patients with AMI, a population with a high mortality rate, Hb, ferritin, and TSAT can be valuable tools for risk stratification and management. While timely correction of low Hb concentration may theoretically enhance patient outcomes, it is important to recognize that such treatments may also influence iron status. Therefore, a cautious approach is warranted when addressing Hb levels in this population, and further research is needed to explore the optimal strategies for managing Hb while considering the broader implications for iron status. While iron supplementation can benefit patients with heart failure and ID, such treatment in critically ill patients with AMI and ID should be more cautious, and its effectiveness remains to be confirmed. Whether the conclusions of this study apply to non-severe patients with AMI still needs further exploration, and the optimal diagnostic methods for ID in the AMI population require additional research.
Several limitations need to be addressed in this study. Firstly, this is a small-scale retrospective study that only included patients with both Hb and iron markers measured, potentially enriching the cohort with individuals already suspected of anemia and leading to selection bias, highlighting the need for larger prospective cohort studies to validate these findings. Secondly, the research focuses on patients in the ICU with AMI, and whether its conclusions apply to all AMI patients remains uncertain. Thirdly, the study’s data, based on public databases, have missing information, leading to the omission of some crucial indicators that may affect the outcomes. Fourthly, due to the retrospective nature of the study, we cannot conduct an in-depth analysis of the causes of anemia and ID in the patients, such as hemorrhagic diseases and renal disorders. Lastly, there is a lack of a clear and reliable diagnostic standard for ID in patients with AMI, and different diagnostic criteria can impact the results. Therefore, large cohort studies are needed to further confirm the optimal diagnosis of ID in patients with AMI.
In severe patients with AMI, anemia and ID were common. Hb
ACS, Acute coronary syndrome; AMI, Acute myocardial infarction; BUN, Blood urea nitrogen; CABG, Coronary artery bypass grafting; CAD, Coronary artery disease; Cr, Creatinine; FBG, Fasting blood glucose; Hb, Hemoglobin; HR, Hazard ratio; IABP, Intra-aortic balloon pump; ICU, Intensive care units; ID, Iron deficiency; INR, International normalized ratio; PCI, Percutaneous coronary intervention; PT, Prothrombin time; PTT, Partial thromboplastin time; RCS, Restricted cubic spline; RR, Respiratory rate; RRT, Renal replacement therapy; SBP, Systolic blood pressure; STEMI, ST-elevation myocardial infarction; T, Temperature; TSAT, Transferrin saturation; WBC, White blood cell count.
This study analyzed publicly available datasets from the MIMIC-IV database (https://mimic.mit.edu/).
FYL and XLL designed the study. FYL and ZW performed data analysis and wrote the draft of the manuscript. TG, BFW, and YJG contributed to the data proofreading and revised it critically for important intellectual content. MRL and HJ contributed to the manuscript proofreading and provided assistance and suggestions in the creation of figures and tables. XLL supervised the study, reviewed the manuscript, and revised it critically for important intellectual content. All authors read and approved the final manuscript. All authors have participated sufficiently in the work and agreed to be accountable for all aspects of the work.
All data handling procedures in this study complied with the ethical standards of the Declaration of Helsinki. The MIMIC-IV project received approval from the institutional review board of the Massachusetts Institute of Technology and Beth Israel Deaconess Medical Center. Given that the data is accessible to the public through the MIMIC-IV database, the ethical approval statement and the requirement for informed consent were waived for this study.
We acknowledge all participants in the MIMC-IV research team for survey design and data collection.
This study was partly supported by the National Natural Science Foundation of China (Grant No. 82274331 to XLL).
The authors declare no conflict of interest.
Supplementary material associated with this article can be found, in the online version, at https://doi.org/10.31083/RCM28261.
References
Publisher’s Note: IMR Press stays neutral with regard to jurisdictional claims in published maps and institutional affiliations.