


 , Snežana Tadić 1,2, Maja Stefanović 1,2, Djordje Ilić 1,3, Milovan Petrović 1,2, Aleksandra Milovančev 1,2,*
 , Marija Bjelobrk 1,2, Tatjana Miljković 1,2, Dragana Dabović 1,2, Snežana Stojšić 2, Muamer Bačevac 4, Anastazija Stojšić-Milosavljević 1,2
1 Faculty of Medicine, University of Novi Sad, 21000 Novi Sad, Serbia
2 Institute of Cardiovascular Diseases of Vojvodina, 21208 Sremska Kamenica, Serbia
3 Department of Obstetrics and Gynecology, Clinical Center of Vojvodina, 21000 Novi Sad, Serbia
4 Department of Internal Medicine, Opšta bolnica Novi Pazar, 36300 Novi Pazar, Serbia
Abstract
Hypertensive disorders in pregnancy (HDP) are associated with adverse pregnancy outcomes. Three-dimensional (3D) echocardiography provides greater accuracy for assessing cardiac geometry and function during pregnancy. The aim was to assess the impact of the 3D left ventricle (LV) systolic function in HDP on pregnancy outcomes.
The prospective cohort study included primiparous with singleton pregnancies, without previous comorbidities who underwent medical history assessment, laboratory tests, ambulatory blood pressure monitoring (ABPM), and transthoracic echocardiography at baseline and six weeks after delivery. Participants were divided into a HDP group and a control group. Pregnancy outcomes (intrauterine growth restriction (IUGR), preterm delivery, and birth weight) were recorded and analyzed.
The study involved 174 HDPs and 64 controls, with a median gestational age of 34 weeks (31; 36). Compared to controls HDP exhibited significantly impaired values in both two-dimensional (2D) and 3D parameters for the systolic and diastolic function of the LV. They had higher LV mass index values and lower absolute values for 2D global longitudinal strain and 3D LV strain in all directions (p < 0.001). Multivariable regression analysis revealed that body mass index (BMI) with odds ratio (OR) of 0.751 (95% confidence interval (CI): 0.666–0.847, p < 0.001) and 3D LV global area strain (GAS) with OR of 0.234 (95% CI: 0.155–0.352, p < 0.001) were the strongest predictors of IUGR, while BMI with OR of 0.832 (95% CI: 0.758–0.914), nighttime systolic blood pressure (SBP) with OR of 1.055 (95% CI: 1.032–1.079, p < 0.01) and 3D LV ejection fraction (EF) with OR of 0.780 (95% CI: 0.687–0.885) were the strongest predictors of preterm delivery. The receiver operating characteristic (ROC) curve showed that the model with BMI and 3D LV GAS can be a good predictor for IUGR with an area under the curve (AUC) 0.951 (0.925–0.976) with 89.5% sensitivity and 86.4% specificity, p < 0.001, while the model with BMI, nighttime SBP and 3D LV EF is a predictor for preterm delivery with AUC of 0.835 (0.776–0.893) with 79.1% sensitivity and 73.7% specificity, p < 0.001. Person correlation showed a significant positive correlation between birth weight and 3D GAS, r = 0.485; p < 0.001.
LV GAS is significantly associated with IUGR and birth weight, while 3D LV EF strongly predicts preterm delivery.
Keywords
- 3D echocardiography
- global area strain
- hypertension in pregnancy
- pregnancy outcome
Hypertensive disorders in pregnancy (HDP) are associated with adverse pregnancy outcomes, both for the mother and the newborn. Also, HDP is a risk factor for ischemic heart disease, hypertension, and stroke later in life [1].
During pregnancy, the mother’s heart adapts to the increased volume, usually changing its geometry toward eccentric hypertrophy or concentric remodeling leading to changes in its function [2]. As echocardiographic parameters for assessing geometry and systolic function are volume-dependent they may not entirely reflect left ventricular geometry in pregnant women. The impacts of these changes are more evident in pregnancies affected by gestational hypertension and preeclampsia (PE). Consequently, in addition to physiological changes, these alterations in maternal cardiac geometry in women with HDP are linked to more pronounced adverse remodeling. This remodeling can further influence cardiac function and contribute to the overall risk of adverse pregnancy outcomes, highlighting the importance of thorough cardiac assessment during pregnancy [3]. Three-dimensional (3D) echocardiography has proved to be highly precise for evaluating cardiac chamber geometry [4]. During pregnancy, slight systolic function decline is observed, as indicated by both ejection fraction (EF) and left ventricular global longitudinal strain (LV GLS) [5]. Similar changes were also evident in the 3D assessment of maternal cardiac morphology and left ventricular myocardial deformation, which showed a better correlation with magnetic resonance imaging (MRI) than two-dimensional (2D) assessment [6]. On the other hand, studies have shown that 3D LV GLS is a better predictor of adverse events compared to EF and 2D LV GLS in patients who have experienced a myocardial infarction [7], asymptomatic diabetic patients compared to control [8], as well as in cardio-oncology [9].
There is limited data assessing a mother’s 3D left ventricular systolic function during pregnancy. While 3D echocardiography (3DE) has been used in other clinical scenarios, its application in HDP is still underexplored. 3DE has shown significant advantages in accuracy, reproducibility, and versatility, often serving as a stronger prognostic predictor than two-dimensional echocardiography (2DE). The assessment of chamber volumes using 3DE has been more precise and accurate. Parameters such as ejection fraction and left ventricular hypertrophy are recognized as significant predictors of cardiovascular outcomes. However, despite their importance in cardiovascular pathology, the use of 3DE to assess cardiac geometry during pregnancy has not been extensively utilized or studied.
The aim was to assess the impact of the 3D left ventricle systolic function in women with HDP on pregnancy outcomes.
This prospective cohort study enrolled primiparous women with singleton pregnancies who had no previous comorbidities or risk factors. Pregnant women with any pregnancy-related comorbidities, such as gestational diabetes or thyroid disorders, were excluded from the study.
Conducted from December 2021 to April 2024 at a tertiary care center, the study involved a comprehensive assessment of each participant’s medical history, physical examination, laboratory tests, transthoracic echocardiogram, and 24-hour ambulatory blood pressure monitoring (ABPM). This was done both at baseline (screening) between the 23rd and 41st gestational weeks, with a median of 34.0 (ranging from 31.0 to 36.0 weeks) for the entire cohort, and again six weeks after delivery. The goal was to exclude any cases of chronic (pre-existing) hypertension. Six weeks postpartum, all participants were normotensive; those with still-elevated blood pressure values were excluded from the study.
A total of 321 pregnant women were screened. After excluding 18 subjects due to insufficient image quality for analysis, 22 for incorrectly recorded blood pressure by ABPM, and 43 who were lost to follow-up (as they did not attend check-ups), 174 women with HDP and 64 normotensive healthy pregnant controls were analyzed.
In this study, “HDP” refers to gestational hypertension and PE, defined according to the current guidelines of the European Society of Cardiology [1]. The research received approval from the Institution’s Ethics Committee (number 1189-1/5), and all participants provided informed consent to take part in the study.
ABPM was performed during screening, six weeks after delivery, and also throughout pregnancy to monitor the blood pressure (BP) values of pregnant women undergoing treatment for high blood pressure. ABPM was obtained using the Meditech Cardio Tens device (Meditech Ltd., Budapest, Hungary).
Blood pressure measurements were recorded every 20 minutes from 6 am to 10 pm, and every 30 min from 10 pm to 10 am the next day. The average values for daytime systolic and diastolic BP, as well as nighttime systolic and diastolic BP and heart rate (HR), were used for analysis.
All patients underwent resting transthoracic echocardiography in the left lateral position at screening and again 6 weeks after delivery. Images were captured using a GE Vivid E95 ultrasound machine (GE, SN 0BB459D4 version 204, Milwaukee, WI, USA) equipped with a M5Sc-D transducer 1.5–4.5 MHz (2D) with simultaneous electrocardiogram monitoring. The investigator, who was blinded to the clinical characteristics of participants, analyzed three cardiac cycles in sinus rhythm using uncompressed data that were stored in cine-loop format on EchoPAC PC v SN 0BB459D4 version 204 GE, Milwaukee, WI, USA.
The evaluation included 2D volumes, mass, both systolic and diastolic function of the left ventricle, as well as 2D LV GLS in accordance to current recommendations [10, 11]. 2D LV GLS was obtained in the apical 2-, 3-, and 4-chamber views and calculated by averaging the peak systolic strain values in the myocardial segments. Mass and cardiac output were indexed by body surface area (BSA).
For 3D analysis with a 4Vc-D 1.5–5 MHz (3D) transducer full-volume images were captured from an apical view with 6 second single breath holds to avoid stitching. All the optimal data sets were recorded in a raw-data format and exported to a workstation where 3D full-volume data sets were analyzed using the 4D Auto Left Ventricular Quantification (LVQ) package on the Echopack workstation. Acquisitions were made with volume rates of 20–40 volumes per second. The endocardial border and the epicardial surface were acquired automatically. All captured images were stored digitally for later analysis. If tracking was considered suboptimal, the endocardial border was manually corrected. Then left ventricular (LV) volumes, ejection fraction, LV mass, and cardiac output were calculated automatically.
3D speckle tracking echocardiography of the left ventricle was estimated from a 12-slice, multi-beat, single 3D full-volume data set as 3D LV GLS, global circumferential strain (3D LV GCS), global radial strain (3D LV GRS), and global area strain (3D LV GAS) by using the 4D Auto LVQ function in the software [4, 6, 12, 13]. Patients with suboptimal images and with three or more rejected segments were excluded from the study.
Participants were followed and pregnancy endpoints were recorded: intrauterine growth retardation (IUGR), preterm delivery, and birth weight. IUGR was defined as a newborn’s weight below the 10th percentile for its gestational age [14]. Delivery before the 37th gestational week (GW) was considered as preterm delivery [15].
Categorical variables are presented as absolute numbers and percentages. The Kolmogorov-Smirnov test was used to test the normal distribution. Continuous variables are presented as the means and standard deviations or median with interquartile ranges (25th and 75th percentile). Differences between groups were tested via Student’s paired t-test or Mann-Whitney test, ANOVA, Wilcoxon, and the chi-square test as appropriate. Linear Pearson’s correlation test was used for the assessment of the influence of the studied variables on birth weight. Binary logistic regression was used to determine independent predictors of primary endpoints, and these were expressed as estimated odds ratios (ORs) with their corresponding 95% confidence intervals (CIs). Variables found to be statistically significant by an univariable analysis were used for the multivariate model building, and p-values lower than 0.05 were considered statistically significant. The fitting effect of multivariate binary logistic regression analysis was evaluated by the receiver operating curve (ROC). The statistical software Statistica (Statistica 13.5, The Ultimate Academic Bundle, StatSoft Europe GmbH, Hamburg, Germany; university license for the University of Novi Sad) was used for all analyses.
A total of 238 pregnant women were included in the analysis, out of which 174 had HDP, among these 129 met the criteria for gestational hypertension (GH) and 45 for PE, while 64 were normotensive healthy pregnant controls. The median age of all participants was 31 years (26; 35). Women with HDP were significantly older than controls, p = 0.018. At baseline, the median gestational week was 34 (31; 36).
The baseline screening characteristics of all participants are shown in Table 1. Women with HDP exhibited a statistically significant reduction in both 2D and 3D parameters of systolic and diastolic function. They also had significantly higher values for the left ventricular mass index (p
| Parameter | All (N = 238) | HDP (N = 174) | Controls (N = 64) | p |
| Median (IQR) | Median (IQR) | Median (IQR) | ||
| GW | 34 (31; 36) | 36 (34; 38) | 33 (31; 35) | |
| Age (years) | 31 (26; 35) | 32 (27; 35) | 29 (25; 33.5) | 0.018 |
| Height (cm) | 167 (164; 170) | 168 (164; 170) | 165 (164; 171) | 0.236 |
| Weight (kg) | 79.5 (73; 90) | 82.5 (75; 92) | 75 (71; 78) | |
| BMI (kg/m2) | 29.05 (27.16; 32.62) | 30.3 (27.68; 33.39) | 27.39 (26.08; 27.72) | |
| SBPav daytime (mmHg) | 140 (124; 146) | 145 (139; 150) | 119 (115; 122) | |
| SBPav nighttime (mmHg) | 128 (108; 139) | 134 (126; 142) | 105 (98; 107) | |
| DBPav daytime (mmHg) | 88 (77; 93) | 92 (87; 95) | 70 (68; 75) | |
| DBPav nighttime (mmHg) | 74 (62; 89.25) | 82 (73; 92) | 58 (55; –61.5) | |
| Average HR (beat per minute) | 88 (82; 98) | 88 (82; 98) | 88 (82; 99) | 0.740 |
| E (m/sec) | 0.80 (0.70; 0.90) | 0.80 (0.70; 0.90) | 0.90 (0.80; 1.04) | |
| e’s (m/sec) | 0.09 (0.08; 0.11) | 0.09 (0.08; 0.10) | 0.12 (0.10; 0.13) | |
| e’l (m/sec) | 0.11 (0.09; 0.14) | 0.10 (0.09; 0.12) | 0.15 (0.13; 0.17) | |
| E/e’av | 8.1 (6.92; 8.75) | 8.42 (7.37; 8.89) | 6.95 (6.21; 7.96) | |
| 2D LV EDV (mL) | 96 (85; 109) | 97 (85; 110) | 95 (85; 108.5) | 0.452 |
| 2D LV ESV (mL) | 35.5 (31.38; 40) | 36 (32; 40) | 33.5 (28; 40) | 0.034 |
| 2D LV EF (%) | 63.07 (62; 64.84) | 62.90 (61; 64.75) | 63.92 (62.44; 64.89) | |
| 2D CO index (L/min/m2) | 2.97 (2.66; 3.40) | 2.96 (2.62; 3.46) | 3.01 (2.80; 3.31) | 0.302 |
| 2D mass index (g/m2) | 84.59 (75.42; 97.13) | 91:3 (83.24; 98.92) | 74.84 (72.16; 77.62) | |
| 3D LV EDV (mL) | 99 (89; 116) | 99.5 (91; 117) | 98 (88; 110) | 0.059 |
| 3D LV ESV (mL) | 38 (33; 43) | 40 (35; 44) | 35 (29; 40.5) | |
| 3D LV EF (%) | 62.71 (61; 64.62) | 61.99 (60.32; 63.72) | 64.09 (62.72; 64.82) | |
| 3D CO index (L/min/m2) | 3.15 (2.71; 3.55) | 3.18 (2.67; 3.64) | 3.15 (2.9; 3.35) | 0.843 |
| 3D mass index (g/m2) | 85.98 (76.11; 97.96) | 91.76 (83.17; 101.02) | 75.34 (73.76; 78.72) | |
| 2D LV GLS | –19 (–18.9; –20.6) | –19.15 (–18; –22.0) | –20.6 (–20.2; –21.1) | |
| 3D LV GLS | –17.3 (–15.9; –19.2) | –16.5 (–15.9; –18) | –20.55 (–19.4; –21) | |
| 3D LV GCS | –19.1 (–18.55; –20.4) | –16.8 (–15.9; –17.4) | –19.8 (–18.2; –21.1) | |
| 3D LV GRS | 48.55 (45.1; 51.9) | 46.2 (44.9; 49.2) | 53 (51.9; 54.05) | |
| 3D LV GAS | –30.7 (–27.78; –32.6) | –26.8 (–26; –37.2) | –32.5 (–31.8; –32.8) |
HDP, hypertensive disorders in pregnancy; GW, gestational week; BMI, body mass index; IQR, interquartile range; SBPav, systolic blood pressure average value; DBPav, diastolic blood pressure average value; HR, heart rate; E, transmitral early peak velocity; e’s, early diastolic mitral annulus septal velocity; e’l, early diastolic mitral annulus lateral velocity; E/e’av, left ventricle filling pressure; 2D, two-dimensional; 3D, three-dimensional; LV, left ventricle; EDV, end-diastolic volume; ESV, end-systolic volume; EF, ejection fraction; CO, cardiac output; 2D LV GLS, two-dimensional left ventricular global longitudinal strain; 3D LV GLS, three-dimensional left ventricular global longitudinal strain; 3D LV GCS, three-dimensional left ventricular global circumferential strain; 3D LV GRS, three-dimensional left ventricular global radial strain; 3D LV GAS, three-dimensional left ventricular global area strain; p-value, HDP vs Controls. Interquartile range (25-percentile; 75th percentile).
Pregnancy outcomes and participants’ characteristics after delivery are presented in Table 2. Women who were hypertensive during pregnancy, although normotensive after delivery, when compared to controls still had statistically significantly higher BP values (p
| All (N = 238) | HDP (N = 174) | Controls (N = 64) | p | |
| Median (IQR) | Median (IQR) | Median (IQR) | ||
| N (%) | N (%) | N (%) | ||
| Weight (kg) | 69 (65; 82) | 71 (67; 85) | 65 (64; 69) | |
| BMI (kg/m2) | 24.8 (23.42; 29.02) | 25.91 (23.88; 30.59) | 23.8 (22.76; 24.77) | |
| SBPav daytime (mmHg) | 124 (118; 126) | 125 (123; 127) | 116.5 (115; 119) | |
| SBPav nighttime (mmHg) | 108.5 (103.75; 114) | 112 (107; 116) | 103 (100; 105) | |
| DBPav daytime (mmHg) | 76 (73; 77) | 76 (75; 78) | 71 (65; 72.5) | |
| DBPav nighttime (mmHg) | 64 (59; 66) | 65 (63; 66) | 58 (55; 59) | |
| Average HR (beat per minute) | 81 (71; 87) | 72 (76; 89) | 74 (70; 85.5) | |
| E (m/sec) | 0.9 (0.80; 1) | 0.9 (0.8; 1.03) | 0.9 (0.8; 1) | 0.950 |
| e’s (m/sec) | 0.12 (0.11; 0.14) | 0.12 (0.11; 0.14) | 0.12 (0.11; 0.14) | 0.547 |
| e’l (m/sec) | 0.15 (0.13; 0.17) | 0.15 (0.13; 0.16) | 0.16 (0.14; 0.18) | |
| E/e’av | 7.10 (6.21; 7.64) | 7.20 (6.40; 7.83) | 6.56 (6.03; 7.3) | |
| 2D LV EDV (mL) | 91 (84.25; 99) | 91 (85; 99) | 91 (82; 98) | 0.403 |
| 2D LV ESV (mL) | 32 (31; 35.25) | 32 (31; 36) | 31 (28.5; 35) | 0.050 |
| 2D LV EF (%) | 64.29 (63; 65.19) | 64.29 (63; 65.05) | 64.29 (63.38; 65.45) | 0.163 |
| 2D CO index (L/min/m2) | 2.91 (2.67; 3.14) | 2.97 (2.68; 3.17) | 2.81 (2.63; 2.93) | |
| 2D mass index (g/m2) | 71.85 (68.52; 76.59) | 72.79 (68.70; 77.64) | 70.4 (68.49; 74.16) | |
| 3D LV EDV (mL) | 94 (85; 99) | 91 (85; 99) | 94 (85; 99) | 0.957 |
| 3D LV ESV (mL) | 31 (29; 35) | 31 (29; 36) | 33 (28.5; 34) | 0.963 |
| 3D LV EF (%) | 65.56 (64.21; 67.03) | 65.56 (64.20; 67.03) | 65.66 (64.36; 66.50) | 0.891 |
| 3D CO index (L/min/m2) | 2.95 (2.78; 3.22) | 3.05 (2.81; 3.35) | 2.89 (2.68; 2.92) | |
| 3D mass index (g/m2) | 73.13 (68.61; 77.26) | 74.1 (68.92; 79.17) | 71.49 (68.54; 74.51) | |
| 2D LV GLS | –20.2 (–19.90; –21.23) | –20 (–19.8; –20.6) | –21.6 (–20.8; 22) | |
| 3D LV GLS | –22.5 (–19.78; –23.80) | –22.05 (–19.6; –23.8) | –22.9 (–21.5; –23.9) | |
| 3D LV GCS | –19.8 (–19.10; –22.03) | –19.4 (–19; –20.8) | –21.6 (–20.35; –22.7) | |
| 3D LV GRS | 54.3 (53.78; 55.90) | 54.1 (53.4; 55.3) | 55.8 (54.30; 56.1) | |
| 3D LV GAS | –35.4 (–34.50; –36.80) | –27.1 (–25.5; –28.6) | –36.1 (–34.75; –36.9) | |
| Birth weight (g) | 2900 (2380; 3450) | 2770 (2250; 3210) | 3330 (2800; 3710) | |
| IUGR | 76 (31.9) | 74 (42.5) | 2 (3.1) | |
| Preterm delivery | 67 (28.2) | 58 (33.3) | 9 (14.1) |
HDP, hypertensive disorders in pregnancy; BMI, body mass index; SBPav, systolic blood pressure average value; IQR, interquartile range; DBPav, diastolic blood pressure average value; HR, heart rate; E, transmitral early peak velocity; e’s, early diastolic mitral annulus septal velocity; e’l, early diastolic mitral annulus lateral velocity; E/e’av, left ventricle filling pressure; 2D, two-dimensional; 3D, three-dimensional; LV, left ventricle; EDV, end-diastolic volume; ESV, end-systolic volume; EF, ejection fraction; CO, cardiac output; 2D LV GLS, two-dimensional left ventricular global longitudinal strain; 3D LV GLS, three-dimensional left ventricular global longitudinal strain; 3D LV GCS, three-dimensional left ventricular global circumferential strain; 3D LV GRS, three-dimensional left ventricular global radial strain; 3D LV GAS, three-dimensional left ventricular global area strain; IUGR, intrauterine growth restriction; p-value, HDP vs Controls. Interquartile range (25-percentile; 75th percentile).
Based on the Pearson correlation coefficient there is a statistically significant negative moderate association between birth weight and night-time diastolic BP, r = –0.502; p
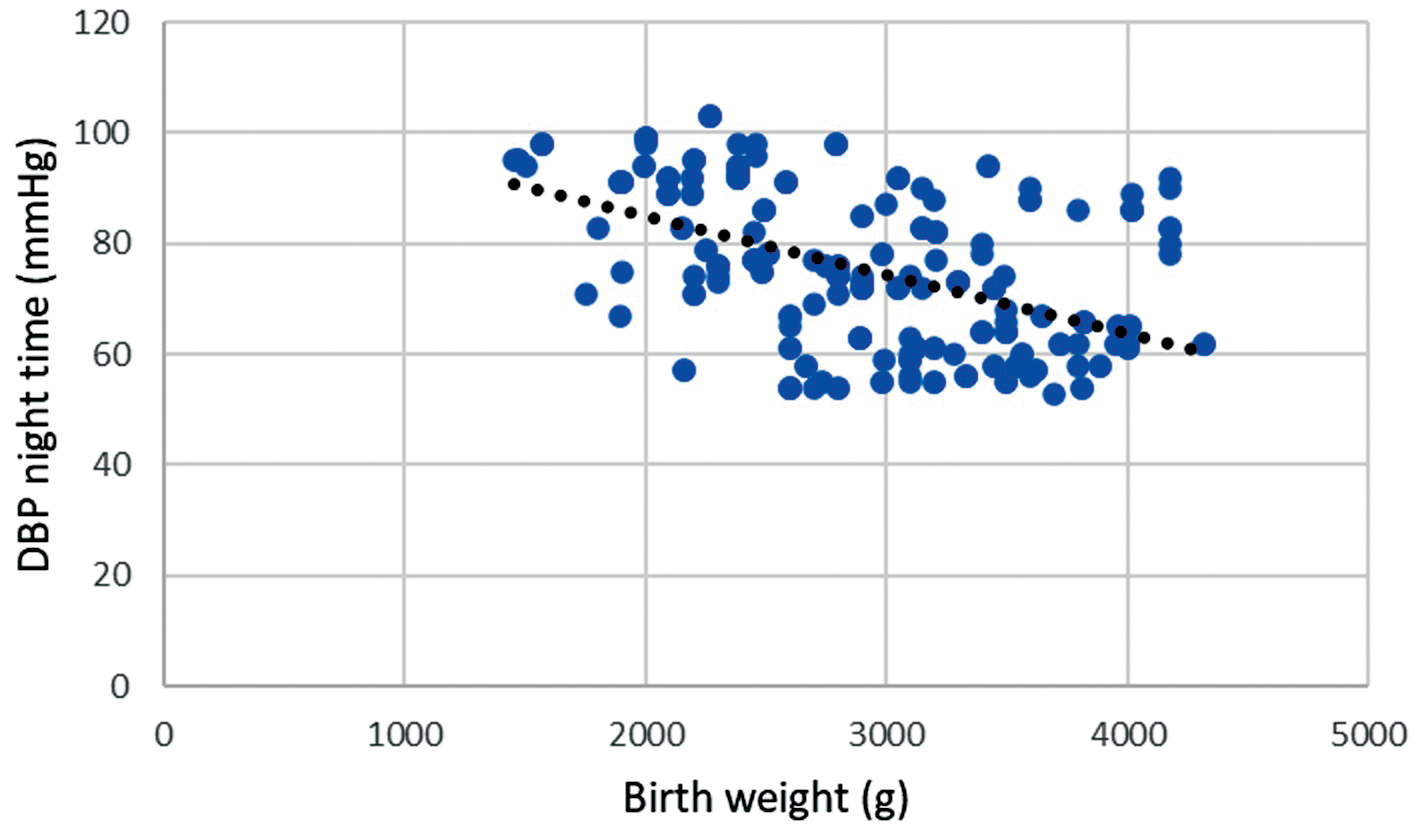 Fig. 1.
 Correlation of birth weight and night-time diastolic blood pressure during pregnancy. Legend: Scatter plot showing significant negative strong correlation between birth weight and night-time diastolic blood pressure (DBP), r = –0.502; p
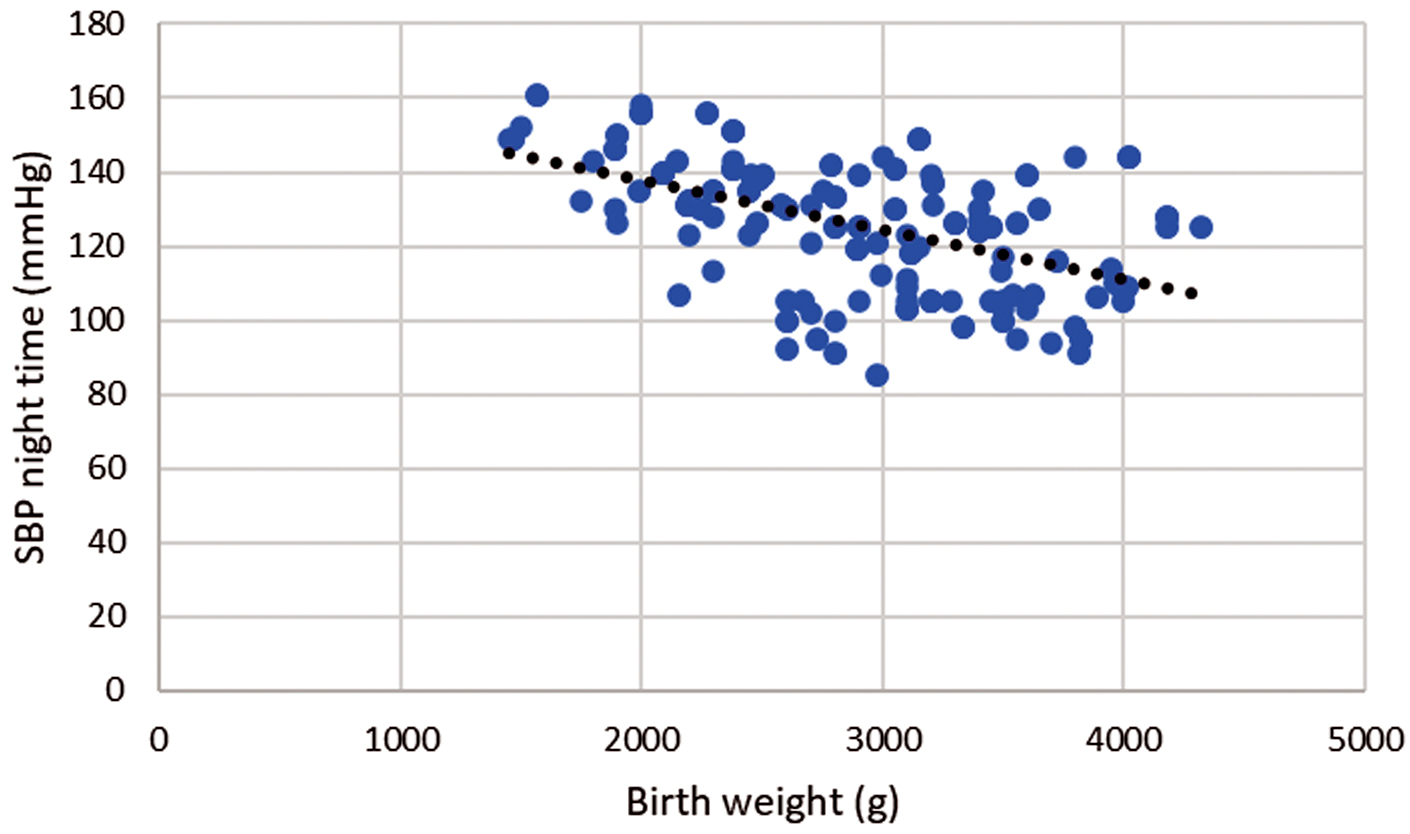 Fig. 2.
 Correlation of birth weight and night-time systolic blood pressure during pregnancy. Legend: Scatter plot showing significant negative strong correlation between birth weight and night-time systolic blood pressure (SBP), r = –0.506; p
There is also a statistically significant moderate positive correlation between birth weight and absolute values of 3D GAS r = 0.485; p
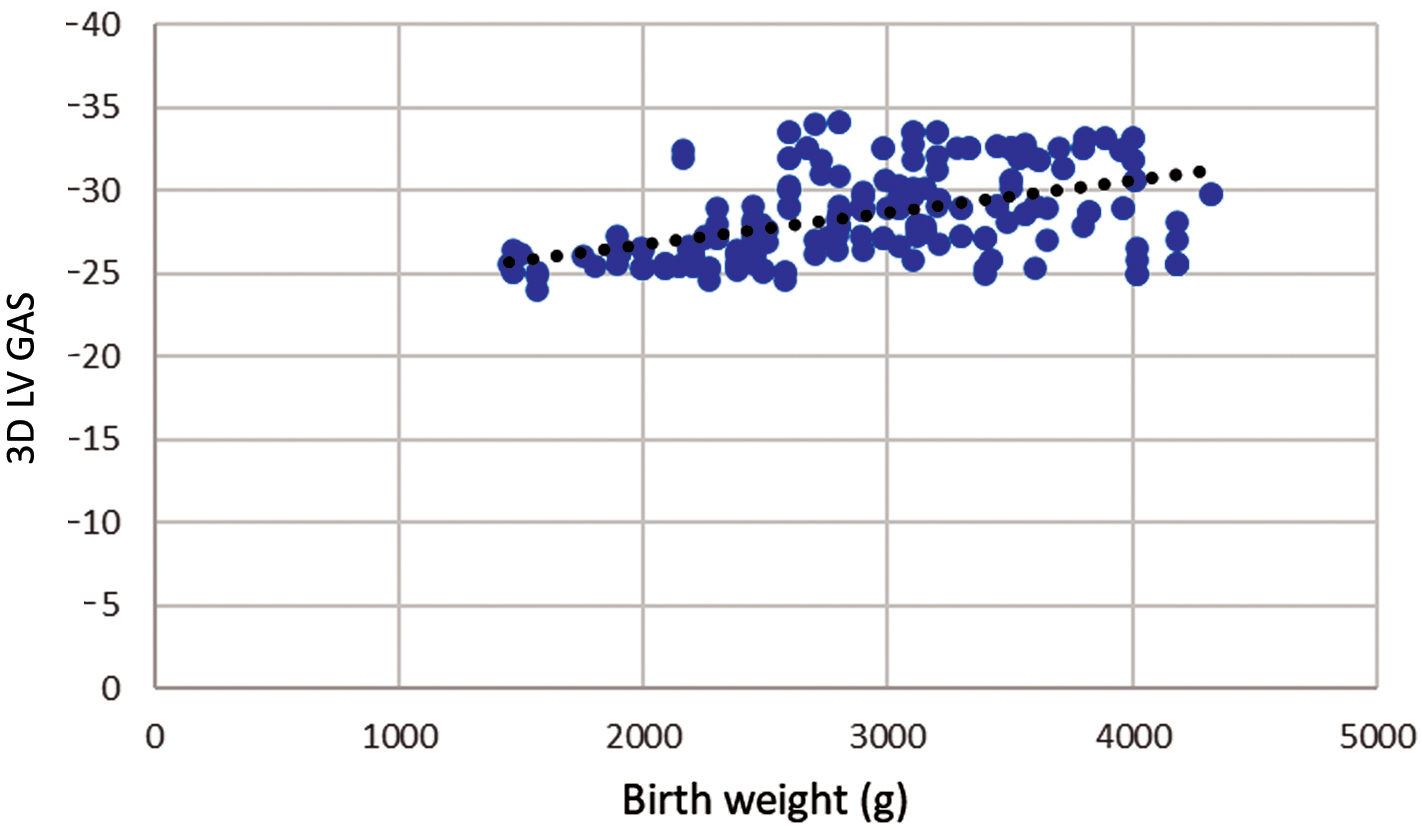 Fig. 3.
 Correlation of birth weight and three-dimensional left ventricular global area strain during pregnancy. Legend: Scatter plot showing significant positive strong correlation between birth weight and three-dimensional left ventricular global area strain (3D LV GAS), r = 0.485; p
The impact of HDP group parameters on IUGR was analyzed.
Univariate regression analysis showed that fetal growth retardation is influenced by an increase in body mass index, age, blood pressure, left ventricular mass index, and left ventricular systolic function, assessed by both two- and three-dimensional echocardiography. Multivariable regression analysis revealed that the strongest predictors for the occurrence of IUGR are body mass index (BMI) and 3D estimated GAS. The cut-off value for 3D GAS is –26.75. Reducing 3D GAS by 1 increases the possibility of IUGR by 77% (Table 3).
| Univariate | Multivariable | |||
| OR (95% CI) | p-value | OR (95% CI) | p-value | |
| Age (years) | 1.057 (1.005–1.113) | 0.032 | ||
| BMI (kg/m2) | 0.920 (0.863–0.980) | 0.010 | 0.751 (0.666–0.847) | |
| SBPav daytime (mmHg) | 1.099 (1.067–1.133) | |||
| SBPav nighttime (mmHg) | 1.101 (1.071–1.132) | |||
| DBPav daytime (mmHg) | 1.161 (1.110–1.214) | |||
| DBPav nighttime (mmHg) | 1.135 (1.099–1.172) | |||
| 2D mass index (g/m2) | 1.078 (1.051–1.106) | |||
| 3D mass index (g/m2) | 1.080 (1.053–1.108) | |||
| 2D LVEDV (mL) | 0.982 (0.968–0.997) | 0.017 | ||
| 3D LVEDV (mL) | 0.983 (0.969–0.997) | 0.015 | ||
| 2D LV EF (%) | 0.734 (0.651–0.828) | |||
| 3D LV EF (%) | 0.709 (0.633–0.795) | |||
| 2D CO index (L/min/m2) | 0.191 (0.100–0.368) | |||
| 3D CO index (L/min/m2) | 0.270 (0.153–0.479) | |||
| 2D LV GLS | 0.447 (0.340–0.588) | |||
| 3D LV GLS | 0.463 (0.367–0.584) | |||
| 3D LV GCS | 0.779 (0.651–0.933) | |||
| 3D LV GRS | 0.730 (0.662–0.806) | |||
| 3D LV GAS | 0.299 (0.214–0.417) | 0.234 (0.155–0.352) | ||
BMI, body mass index; SBPav, systolic blood pressure average value; DBPav, diastolic blood pressure average value; 2D, two-dimensional; 3D, three-dimensional; LVEDV, left ventricular end-diastolic volume; EF, ejection fraction; CO, cardiac output; 2D LV GLS, two-dimensional left ventricular global longitudinal strain; 3D LV GLS, three-dimensional left ventricular global longitudinal strain; 3D LV GCS, three-dimensional left ventricular global circumferential strain; 3D LV GRS, three-dimensional left ventricular global radial strain; 3D LV GAS, three-dimensional left ventricular global area strain; OR, odds ratio; CI, confidence interval; IUGR, intrauterine growth restriction.
The ROC curve showed that the 3D LV GAS can be a good predictor of IUGR. The corresponding area under the ROC curve was 0.951 (0.925–0.976) with 89.5% sensitivity and 86.4% specificity, p
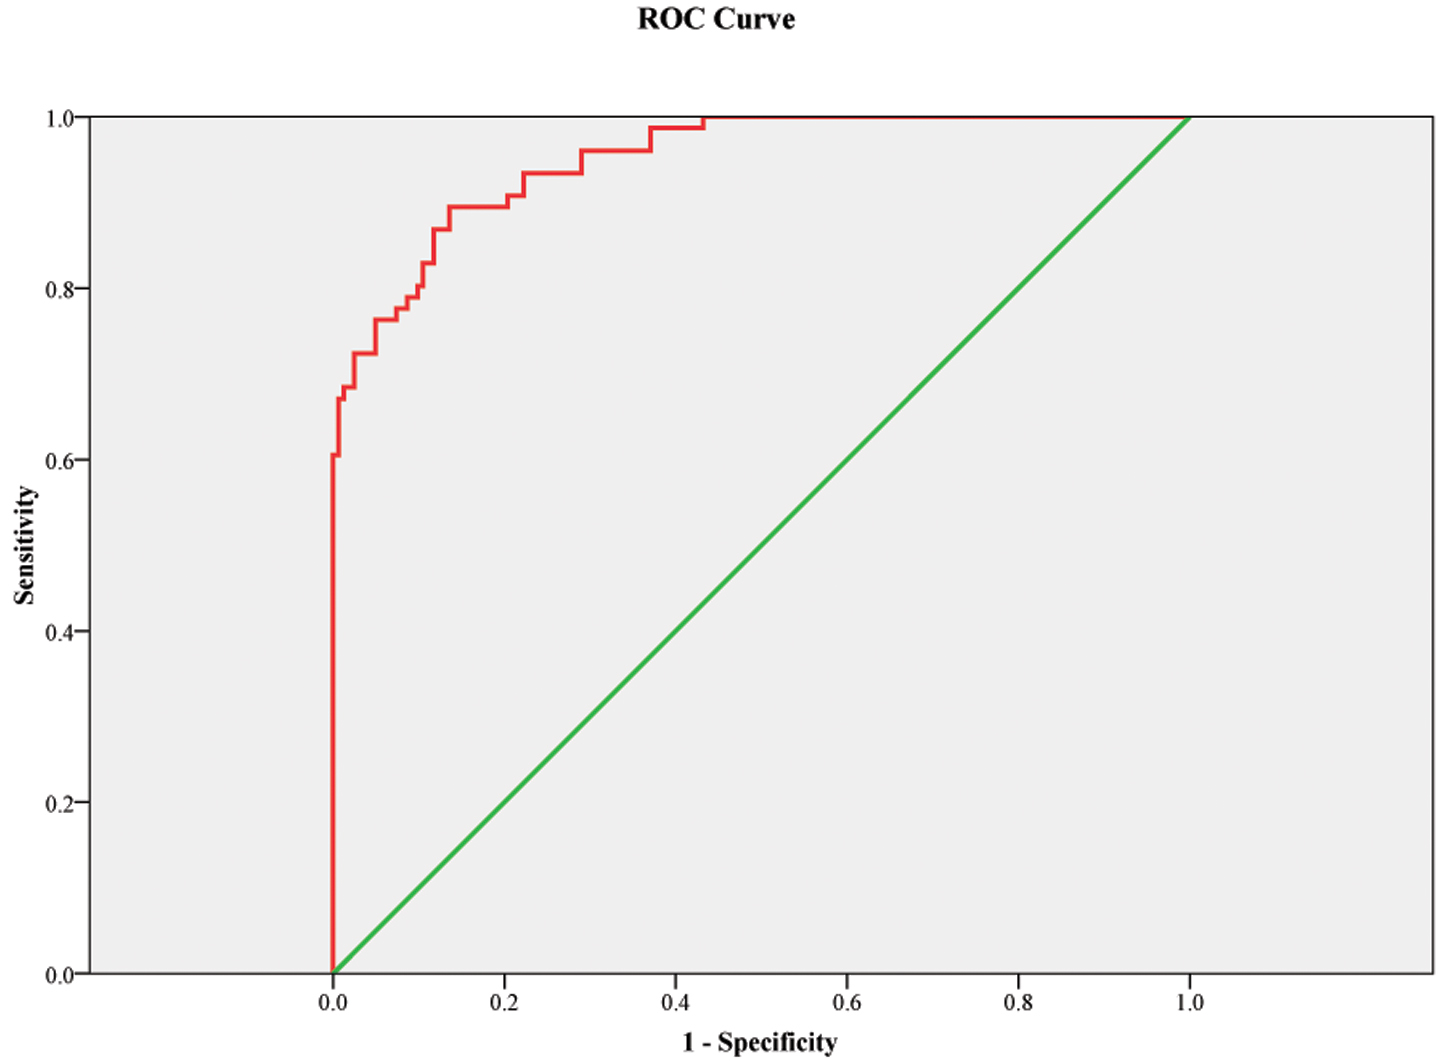 Fig. 4.
 ROC curve model for three-dimensional left ventricular global area strain as a predictor for IUGR. Figure legend: The receiver operating characteristic curve (ROC) curve showed that this model (with BMI and 3D LV GAS, three-dimensional left ventricular global area strain) can be a good marker for the prediction of IUGR with an area under the curve 0.951; p
The influence of HDP group parameters on preterm delivery was analyzed.
Multivariable analysis revealed that the three-dimensionally estimated left ventricular ejection fraction, systolic blood pressure during the night, and BMI were independent significant predictors of preterm delivery. The cut-off value for 3D LV EF is 62.05%. The 1% decrease in 3D LV EF increases the risk of preterm delivery by 22% (Table 4).
| Univariate | Multivariable | |||
| OR (95% CI) | p value | OR (95% CI) | p value | |
| Age (years) | 1.082 (1.025–1.143) | |||
| BMI (kg/m2) | 0.901 (0.839–0.967) | 0.832 (0.758–0.914) | ||
| SBPav daytime (mmHg) | 1.049 (1.025–1.074) | |||
| SBPav nighttime (mmHg) | 1.066 (1.043–1.089) | 1.055 (1.032–1.079) | ||
| DBPav daytime (mmHg) | 1.062 (1.030–1.094) | |||
| DBPav nighttime (mmHg) | 1.071 (1.046–1.097) | |||
| 2D mass index (g/m2) | 1.067 (1.041–1.094) | |||
| 3D mass index (g/m2) | 1.067 (1.041–1.094) | |||
| 2D LVEDV (mL) | 0.974 (0.958–0.989) | |||
| 3D LVEDV (mL) | 0.972 (0.957–0.987) | |||
| 2D LV EF (%) | 0.717 (0.633–0.813) | |||
| 3D LV EF (%) | 0.732 (0.655–0.817) | 0.780 (0.687–0.885) | ||
| 2D CO index (L/min/m2) | 0.417 (0.230–0.755) | |||
| 3D CO index (L/min/m2) | 0.370 (0.210–0.650) | |||
| 2D LV GLS | 0.588 (0.458–0.754) | |||
| 3D LV GLS | 0.745 (0.632–0.879) | |||
| 3D LV GRS | 0.865 (0.796–0.939) | |||
| 3D LV GAS | 0.662 (0.569–0.770) | |||
BMI, body mass index; SBPav, systolic blood pressure average value; DBPav, diastolic blood pressure average value; 2D, two-dimensional; 3D, three-dimensional; LVEDV, left ventricular end-diastolic volume; EF, ejection fraction; CO, cardiac output; 2D LV GLS, two-dimensional left ventricular global longitudinal strain; 3D LV GLS, three-dimensional left ventricular global longitudinal strain; 3D LV GRS, three-dimensional left ventricular global radial strain; 3D LV GAS, three-dimensional left ventricular global area strain; OR, odds ratio; CI, confidence interval.
The ROC curve showed that the 3D LV EF can be a good predictor of preterm delivery. The corresponding area under the ROC curve was 0.835 (0.776–0.893) with 79.1% sensitivity and 73.7% specificity, p
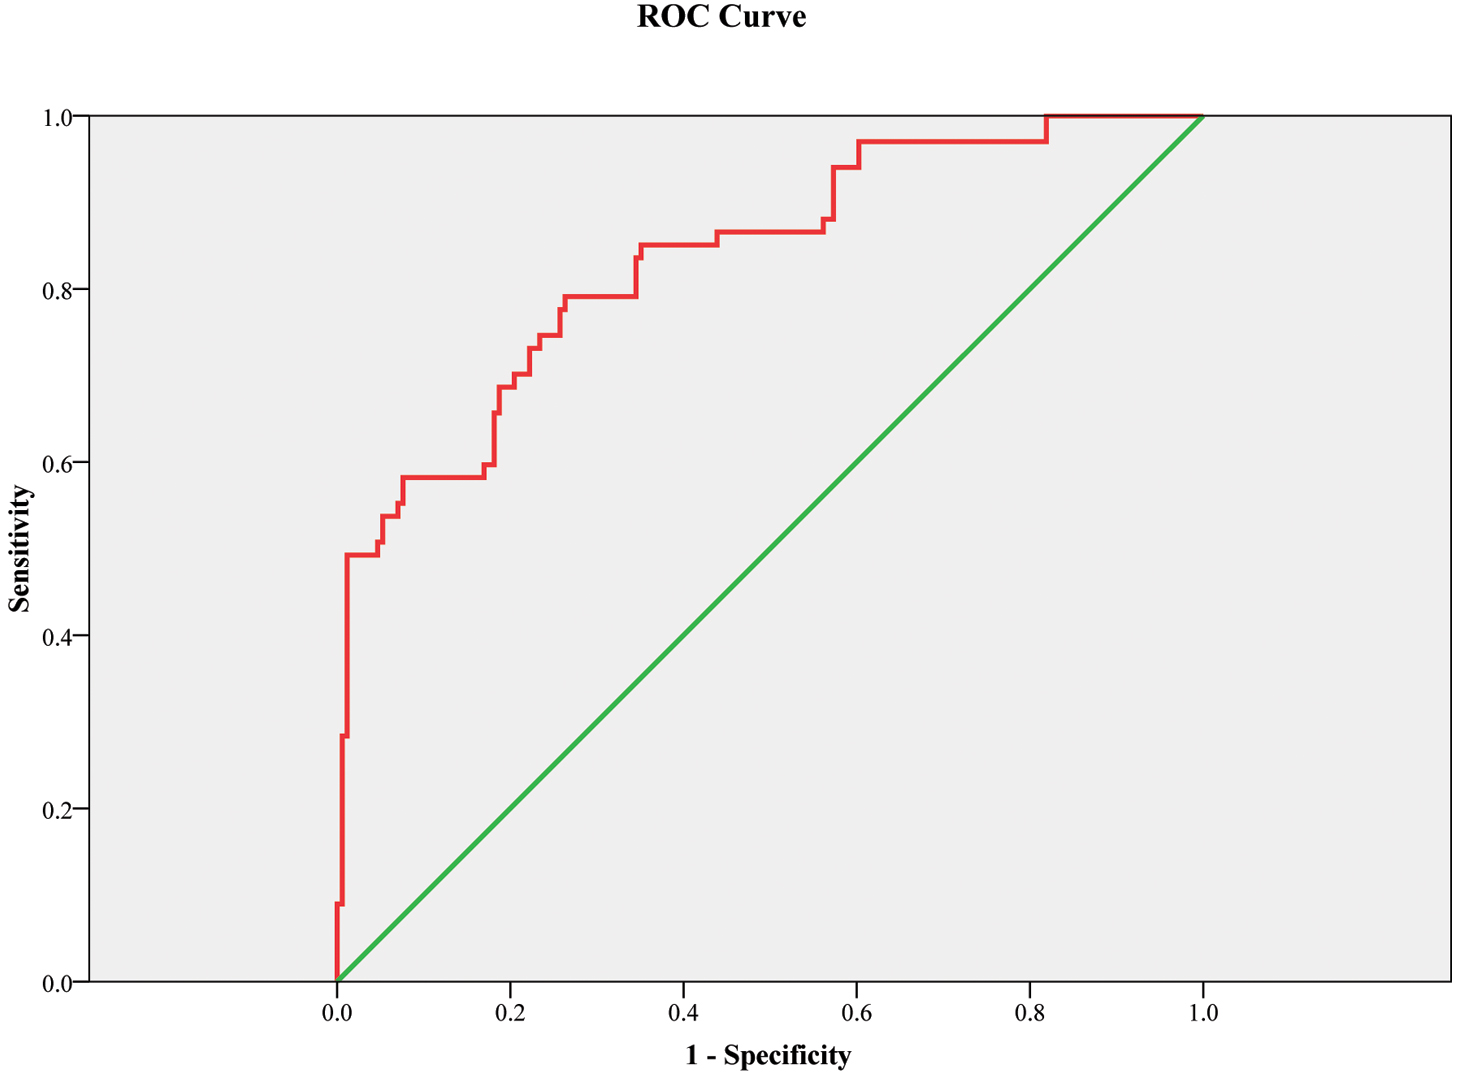 Fig. 5.
 ROC curve model for three-dimensional left ventricular ejection fraction as a predictor of preterm delivery. Figure legend: Receiver operating characteristic curve (ROC) showed that this model (with body mass index, night-time systolic blood pressure and 3D left ventricular ejection fraction) can be a good marker for the prediction of preterm delivery. The green line is the reference line. The corresponding area under the ROC curve was 0.835 (0.776–0.893) with 79.1% sensitivity and 73.7% specificity, p
Our research revealed that 3D echocardiographic assessment of the mother’s systolic function during pregnancy is a better predictor of pregnancy outcomes compared to 2DE We have shown that 3D evaluation of EF is a good predictor of preterm delivery, while 3D LV GAS is an excellent predictor of IUGR, but also correlates well with the birth weight of the newborn. To the best of our knowledge, this is the first study to assess the influence of the maternal systolic function of the LV assessed by 3DE on pregnancy outcomes.
Our findings regarding the impaired systolic and diastolic function of the left ventricle in hypertensive pregnant women, along with the increased mass of the LV compared to normotensive individuals, align with numerous previous studies [16]. Significantly lower birth weight, higher prevalence of IUGR and preterm delivery in HDP compared to normotensive pregnant women is also previously known [17]. Our research supports these findings. While changes in diastolic function and left ventricle geometry during hypertensive pregnancy have been recognized in previous decades [18, 19, 20, 21, 22, 23], data regarding systolic function remain limited and somewhat contentious [23, 24]. As mentioned in the introduction, changes in the geometry of the LV during pregnancy, necessitate a more accurate assessment of its function and morphology of the LV which can be achieved through 3DE. Cong et al. [6] demonstrated that both 2DE and 3DE parameters representing the function and morphology of the LV in healthy pregnant women change throughout pregnancy. They found that systolic function parameters are at their lowest during the third trimester, while the LV mass notably increases. After delivery, there is a significant improvement in systolic function parameters and LV mass decreases [6]. Our results coincide with the mentioned research for normotensive pregnant women, but also for pregnant women with HDP, where these changes were even more pronounced. Women with HDP exhibited statistically significant impairments in both 2D and 3D parameters of systolic and diastolic function of the LV, with decreases in absolute values of 2D LV GLS and 3D strain in all directions, as well as significantly higher values of the LV mass index compared to normotensive pregnant women. After delivery, all the mentioned parameters showed improvement across the entire cohort, as well as distinctly in both hypertensive disorders of pregnancy groups and controls. Interestingly women who were hypertensive during pregnancy, despite being normotensive after delivery, still had statistically significant higher LV mass values compared to those who were normotensive during pregnancy.
In terms of LV systolic function, the difference in EF values was no longer significant, when assessed using both 2D and 3D methods. This change can likely be attributed to the normalization of BP during the postpartum period. Unlike LV EF, both the 2D and 3D strain values remained statistically significantly worse in women with HDP both at baseline and six weeks after delivery. This finding may imply that the assessment of the systolic function of women with HDP using the speckle tracking method may provide a more accurate indication of the subendocardial damage in the LV compared to the ejection fraction.
Company Calabuig et al. [25] analyzed 3D echocardiographic parameters in women with PE and showed that women with PE had lower LV diastolic function and increased LV mass index compared with controls. Notably, there was a postpartum improvement in these indices, attributed to an improvement of their risk factor profiles [25]. Pregnant women with underlying risk factors (e.g., smoking) and all other comorbidities were excluded from our research. The only exception was obesity, which was not used as an exclusion criterion. This decision was made because pregnant women were primarily screened during the third trimester, and factors such as swelling and increased volume load made BMI a less reliable exclusion metric. After delivery, we obtained the anamnestic information that some participants had actually gained more weight compared to their pre-pregnancy state, which indicates that the observed improvements in the aforementioned parameters cannot be solely attributed to the reduction of obesity as a risk factor. Although there are limited studies on the use of 3DE in pregnant women, particularly those with HDP, existing research in the non-pregnant population has demonstrated that 3D strain analysis (3D STE) offers greater accuracy and objectivity than 2D STE when assessing cardiac systolic dysfunction or dysregulation, without relying on geometric assumptions [26, 27]. Also, 3DE provides higher accuracy and reproducibility as compared to cardiac magnetic resonance both in pregnant women and in the non-pregnant population [6, 28].
The GAS, a parameter uniquely obtainable through 3D STE analysis, combines the evaluation of longitudinal and circumferential deformations. This makes it particularly sensitive to detecting anomalies without geometric assumptions, especially in the subendocardial layer, which is often one of the first areas affected in various cardiac conditions [29].
Our study showed that 3D echocardiographic assessment of the mother’s systolic function during HDP is a better predictor of pregnancy outcomes than 2D. We have shown that the strongest predictor for the occurrence of intrauterine growth retardation is a decrease in the absolute value of the GAS. Specifically, a reduction of 1 unit in GAS increases the possibility of IUGR by 77%. The cut of value of LV GAS is –26.75. Furthermore lower GAS correlates with lower birth weight. Taking into account the changes in the geometry of the LV during pregnancy, especially in hypertensive pregnant women, we may conclude that such results are expected when taking into account the volume and the geometrically independent assessment of the systolic function by the GAS.
Since similar analyzes have not been conducted in pregnant women before, we can compare them with the research demonstrating that 3D LV GLS and 3D LV GCS provide better predictive capability regarding ejection fraction and adverse events in patients with a history of myocardial infarction [30]. Additionally, LV GAS has been independently associated with an increased risk of death or heart failure following acute myocardial infarction [30]. Also, a recently published meta-analysis showed that 3D myocardial strain was reduced in all directions in asymptomatic diabetic patients compared to controls, as well as hemoglobin A1c was associated with worse 3D LV GLS and 3D LV GSC [8]. Besides that, the early change to abnormal values of 3D LV GAS was associated with a subsequent decrease in LV EF, representing a promising technique to predict chemotherapy-induced cardiomyopathy in patients with breast cancer [9].
Absolute LV GAS values in our study were statistically significantly lower in hypertensive pregnant women compared to normotensive ones and remained significantly lower even after delivery, although previously hypertensive participants became normotensive. The relationship of LV GAS with BP values has been shown in a previous study [31], as well as 3D LV GLS, GCS and GRS.
Therefore we can assume that GAS, as a comprehensive parameter of myocardial systolic deformation in all three dimensions, is the most sensitive parameter for detecting occult myocardial dysfunction in HDP, as it was shown for the association with exercise time and predictive value on E/e’ for exercise capacity in participants undergoing a treadmill exercise test [32] and with common LV systolic function parameters [33].
Our study also revealed another advantage of 3D assessment of LV systolic function in pregnant women by the significant association of 3D LV EF with preterm delivery, with a cut-off value of 62.05%. The decrease of 1% in 3D LV EF increases the risk of preterm delivery by 22%. We have previously shown that 2D deterioration of LV systolic function is associated with preterm delivery [34], while a recent study showed that 3D LV EF has superior predictive ability over 2D LV EF [35]. The cut-off value of 62.05 for 3D LV EF offers valuable insights for predicting preterm delivery. However, there is a need for further clarification on its clinical application and a comparison with existing methods and established markers, such as cervical length measurement and maternal clinical factors (e.g., history of preterm birth, infections) [36]. When comparing this cut-off to other clinical methods for predicting preterm delivery, it is essential for future studies to focus on refining these predictions by considering various clinical contexts and potential combinations with other established predictors.
While traditional echocardiographic methods have been utilized to assess cardiac function in pregnancy, there is a notable scarcity of studies focusing on the specific contributions of 3DE in understanding cardiac changes in women with HDP. Our study aims to fill this knowledge gap by providing a comprehensive evaluation of 3DE parameters and their clinical relevance in this population. The application of 3DE allows for more precise and reproducible measurements of LV function without relying on geometric assumptions inherent in 2DE methods. This advancement is particularly crucial in the context of HDP, where alterations in cardiac structure and function can be subtle yet clinically significant. By utilizing 3DE , we can detect early changes that may not be apparent with conventional techniques. Our findings not only support previous research indicating cardiac dysfunction in HDP but also extend this knowledge by highlighting the utility of 3DE as a valuable tool for early detection and monitoring. The identification of specific cut-off values, such as the one we established for 3D LV EF, could be the way to integrate this into routine clinical practice.
In addition to HDP as a risk factor for cardiovascular morbidity later in life [1], a recently published study showed that preterm delivery, low birth weight of the newborn, and intrauterine growth retardation are also risk factors for future adverse maternal cardiovascular events [37]. We have shown that deterioration of the systolic function of the mother’s left ventricle during HDP obtained by 3DE assessment, is significantly related to the mentioned pregnancy outcomes. Therefore, 3D assessment of LV function during HDP, especially LV GAS, as a comprehensive parameter of myocardial systolic deformation in all three dimensions, and because of that the most sensitive parameter for detecting subclinical myocardial dysfunction in HDP, could be a good screening tool for detecting women at increased risk of developing cardiovascular complications. In that context, more frequent checks of those women are very important, as well as advising them to change their lifestyle habits.
To the best of our knowledge, this is the first study to investigate the impact of 3DE assessment of LV systolic function in pregnant women on pregnancy outcomes.
In our view, studying 3D LV GAS is particularly significant because it combines both 3D LV GLS and 3D LV GCS. We believe this method provides a more accurate assessment of LV systolic function in pregnant women, especially those with hypertension, due to changes in LV geometry.
It is a single-center study. Future multicenter research assessing the impact of 3D LV GAS on maternal cardiovascular events is needed to confirm our results. Also, we believe that future studies are needed to assess these parameters in earlier pregnancy (e.g., in the first trimester) in order to confirm the use of these echocardiographic measures as early markers for obstetric complications, or to potentially guide clinical decisions during the prognosis of pregnancy complications, both in terms of IUGR and preterm delivery.
3DE assessment of the mother’s systolic function during pregnancy is a good predictor of pregnancy outcomes. The strongest predictor of preterm delivery is 3D LV EF, while the LV GAS is the strongest predictor of the intrauterine growth retardation, but also correlates well with the birth weight.
All data reported in this paper will be shared by the lead contact upon request.
Conceptualization, AI, MP; methodology, MBje; validation, DJI; formal analysis, ST, MS and DD; investigation, TM, SS, MS; resources, writing—original draft preparation, AI, AM; writing—review and editing, AM; interpretation, MBač, ASM, AM; supervision, MBač, ASM. All authors contributed to editorial changes in the manuscript. All authors read and approved the final manuscript. All authors have participated sufficiently in the work and agreed to be accountable for all aspects of the work.
The research protocol was approved by the Ethics Committee of the Institute of Cardiovascular Diseases of Vojvodina (Ethic Approval Number: 1189-1/5), and all of the participants provided signed informed consent. The study was carried out in accordance with the guidelines of the Declaration of Helsinki.
Not applicable.
This study was supported by Provincial Secretariat for Health of the Autonomous Province of Vojvodina (Serbia) – the “Early detection of changes in maternal cardiac function and pattern of blood pressure during ABPM in hypertensive pregnancies” project. The preparation of this paper was supported by the Provincial Secretariat for Higher Education and Scientific Research of the Autonomous Province of Vojvodina (Serbia), grant number (0032710122024 09418 003 000 000 001 04 003).
The authors declare no conflict of interest.
References
Publisher’s Note: IMR Press stays neutral with regard to jurisdictional claims in published maps and institutional affiliations.