


 , Ali Fuat Tekin 2,3, Huseyin Baygin 4, Alparslan Unsal 5, Mustafa Gok 5,6,*
1 Department of Radiology, Silvan State Hospital, 21640 Diyarbakir, Turkiye
2 Department of Radiology, Basaksehir Cam Sakura City Hospital, 34480 Istanbul, Turkiye
3 Department of Biomedical Engineering, Bogazici University, 34470 Istanbul, Turkiye
4 Department of Rheumatology, Merkezefendi State Hospital, 45120 Manisa, Turkiye
5 Department of Radiology, Faculty of Medicine, Adnan Menderes University, 09010 Aydin, Turkiye
6 Faculty of Medicine and Health, University of Sydney, Sydney Medical School and School of Health Sciences, Sydney, NSW 2050, Australia
Abstract
Rheumatoid arthritis (RA) is a chronic, systemic autoimmune disease characterized by progressive joint deformity and increased mortality. RA patients typically exhibit elevated plasma levels of inflammatory markers, contributing to endothelial dysfunction and increased arterial wall stiffness—a recognized marker of subclinical atherosclerosis and heightened cardiovascular risk. This study aimed to evaluate carotid arterial wall stiffness in RA patients using ultrasound (US) imaging modality with speckle tracking carotid strain (STCS) software, a non-invasive method for assessing subclinical cardiovascular disease indicators.
This analytical case–control study was conducted at Aydin Adnan Menderes University Hospital Department of Radiology and Department of Rheumatology. Patients who met the inclusion criteria were enrolled in the study. Data collection tools included an 11-item case report form developed by the researcher based on relevant literature and carotid US examinations performed.
The study included 143 participants: 75 RA patients (60 female and 15 male) and 68 control subjects (54 female and 14 male). The mean age was 50.9 ± 11.4 years (range: 25.0–74.0) for the RA group and 53.1 ± 12.6 years (range: 20.0–77.0) for the control group. Systolic blood pressure (SBP) and C-reactive protein (CRP) levels (mean ± SD) were 7.4 ± 11.5 in the RA group and 8.6 ± 22.2 in the control group. However, due to a few outliers in the control group, the median CRP was 3.3 mg/L (range: 2.0–71.9) in the RA group versus 2.0 mg/L (range: 0.8–145.0) in the controls. This nonparametric comparison showed significantly higher typical CRP levels in the RA group (p < 0.05). All stiffness and strain parameters in axial and longitudinal planes showed statistically significant differences between the two groups (p < 0.05), except the circumferential strain parameter “displacement (DP)” (p = 0.074). Although no significant correlation was found between the disease activity score (DAS) and any strain or stiffness parameter, the carotid intima-media thickness (CIMT) exhibited a significant positive correlation with disease duration (p = 0.001). After adjusting for confounding factors (age, gender, body mass index (BMI), and smoking status) using multivariate linear regression analysis, RA remained a significant predictor for all stiffness and strain parameters, except for the circumferential strain parameter DP.
Applying functional parameters to assess arterial wall stiffness and tension levels provides valuable insights for early detection of cardiovascular disease risk, preceding classical US findings such as increased intima-media thickness (IMT) and plaque formation. While preliminary, our findings from STCS measurements in RA patients show promise in evaluating cardiovascular disease risk in this population and potentially improving long-term outcomes through timely interventions.
Keywords
- arterial wall stiffness
- arterial wall strain
- cardiovascular disease
- carotid intima-media thickness
- rheumatoid arthritis
- speckle tracking carotid strain
- ultrasonography
Rheumatoid arthritis (RA) is a chronic, systemic inflammatory autoimmune disorder primarily characterized by joint inflammation and progressive joint deformity [1]. In addition to its impact on the joints, RA significantly increases the risk of cardiovascular diseases (CVDs), which are the leading cause of mortality in patients with RA [2]. The cardiovascular mortality rate in RA patients is approximately three times higher than in the general population; this heightened risk is largely attributed to chronic inflammation, which plays a pivotal role in the pathogenesis of both RA and atherosclerosis [3].
Chronic inflammation in RA has been associated with endothelial dysfunction and arterial wall stiffness, which are considered critical early indicators of subclinical atherosclerosis [4]. Recent studies have demonstrated that inflammation associated with RA accelerates the development of atherosclerosis, thereby increasing the risk of CVD even in the absence of traditional risk factors [5, 6]. Patients with RA display elevated levels of inflammatory markers, including cytokines, which have been linked to the progression of atherosclerosis [7]. A specific subset of RA patients present increased CD4+ CD28- cell numbers, which promote immune activation and play a role in destabilizing atherosclerotic plaques, thereby precipitating acute cardiovascular events [8]. In recent years, there has been a significant increase in the utilization of non-invasive imaging modalities for assessing early cardiovascular changes in RA patients. Among these techniques, speckle tracking carotid strain (STCS) and ultrasonography (US) methods have gained particular attention due to the capacity of these techniques to evaluate arterial wall stiffness and strain in real time (Fig. 1) [9]. STCS enables the functional assessment of the carotid arteries, measuring changes in arterial wall stiffness and strain parameters, critical indicators of subclinical atherosclerosis. STCS, in conjunction with other parameters, such as intima-media thickness (IMT) (Fig. 2) and pulse wave velocity (PWV), offers valuable insights into cardiovascular risk in RA patients [10].
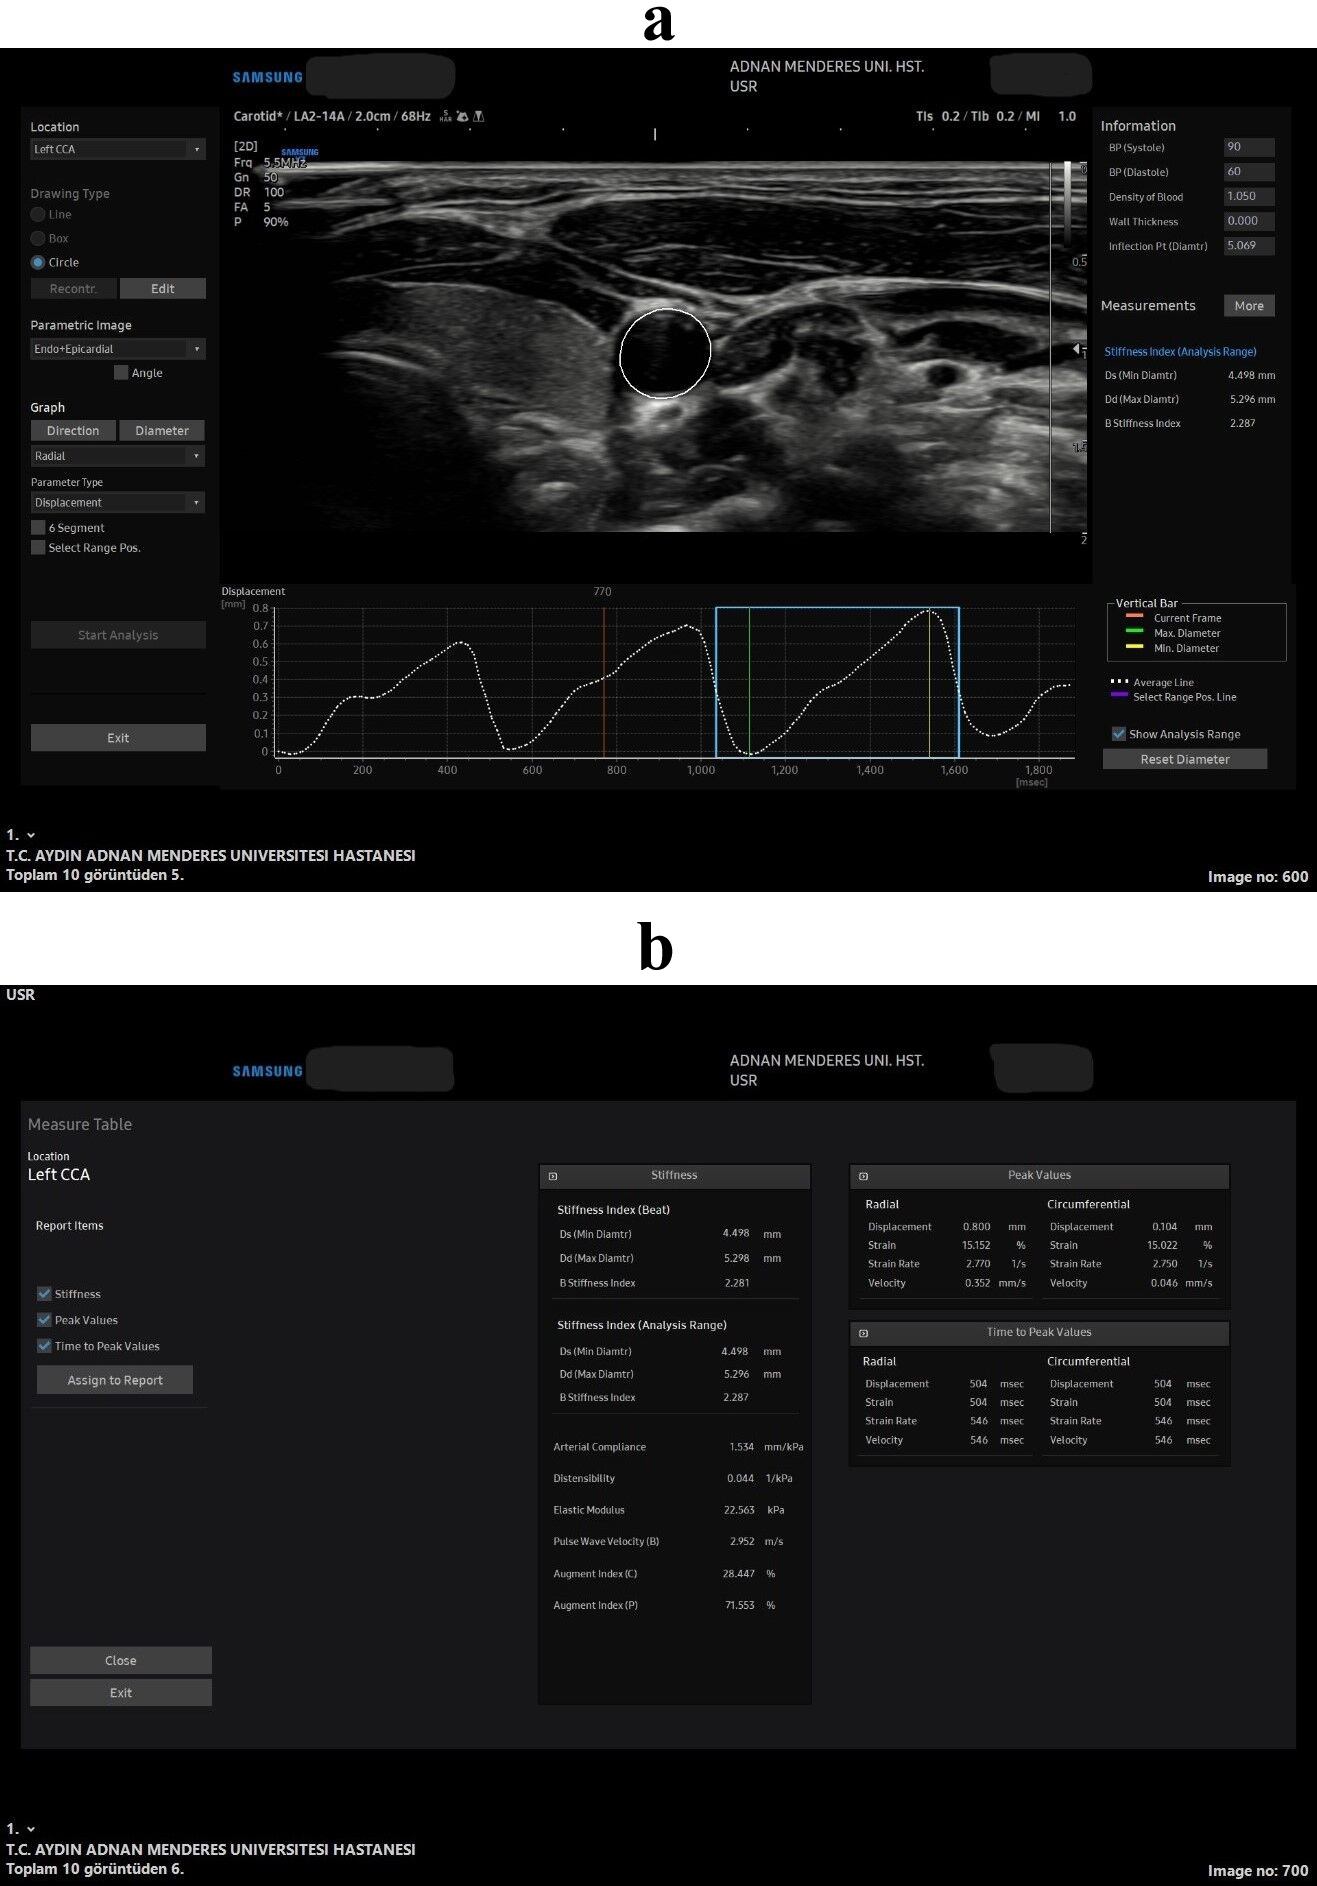 Fig. 1.
All stiffness and strain measurements in the speckle tracking carotid strain (STCS) software in the axial plane. Wave forms and the axial US image captured for the arterial analysis (a), all the measurements that was obtained from the soft-ware from that US wave form image (b). 2D, 2 Dimension; BP, blood pressure; Ds, diameter in systole; Dd, diameter in diastole; CCA, common carotis artery; US, ultrasonography.
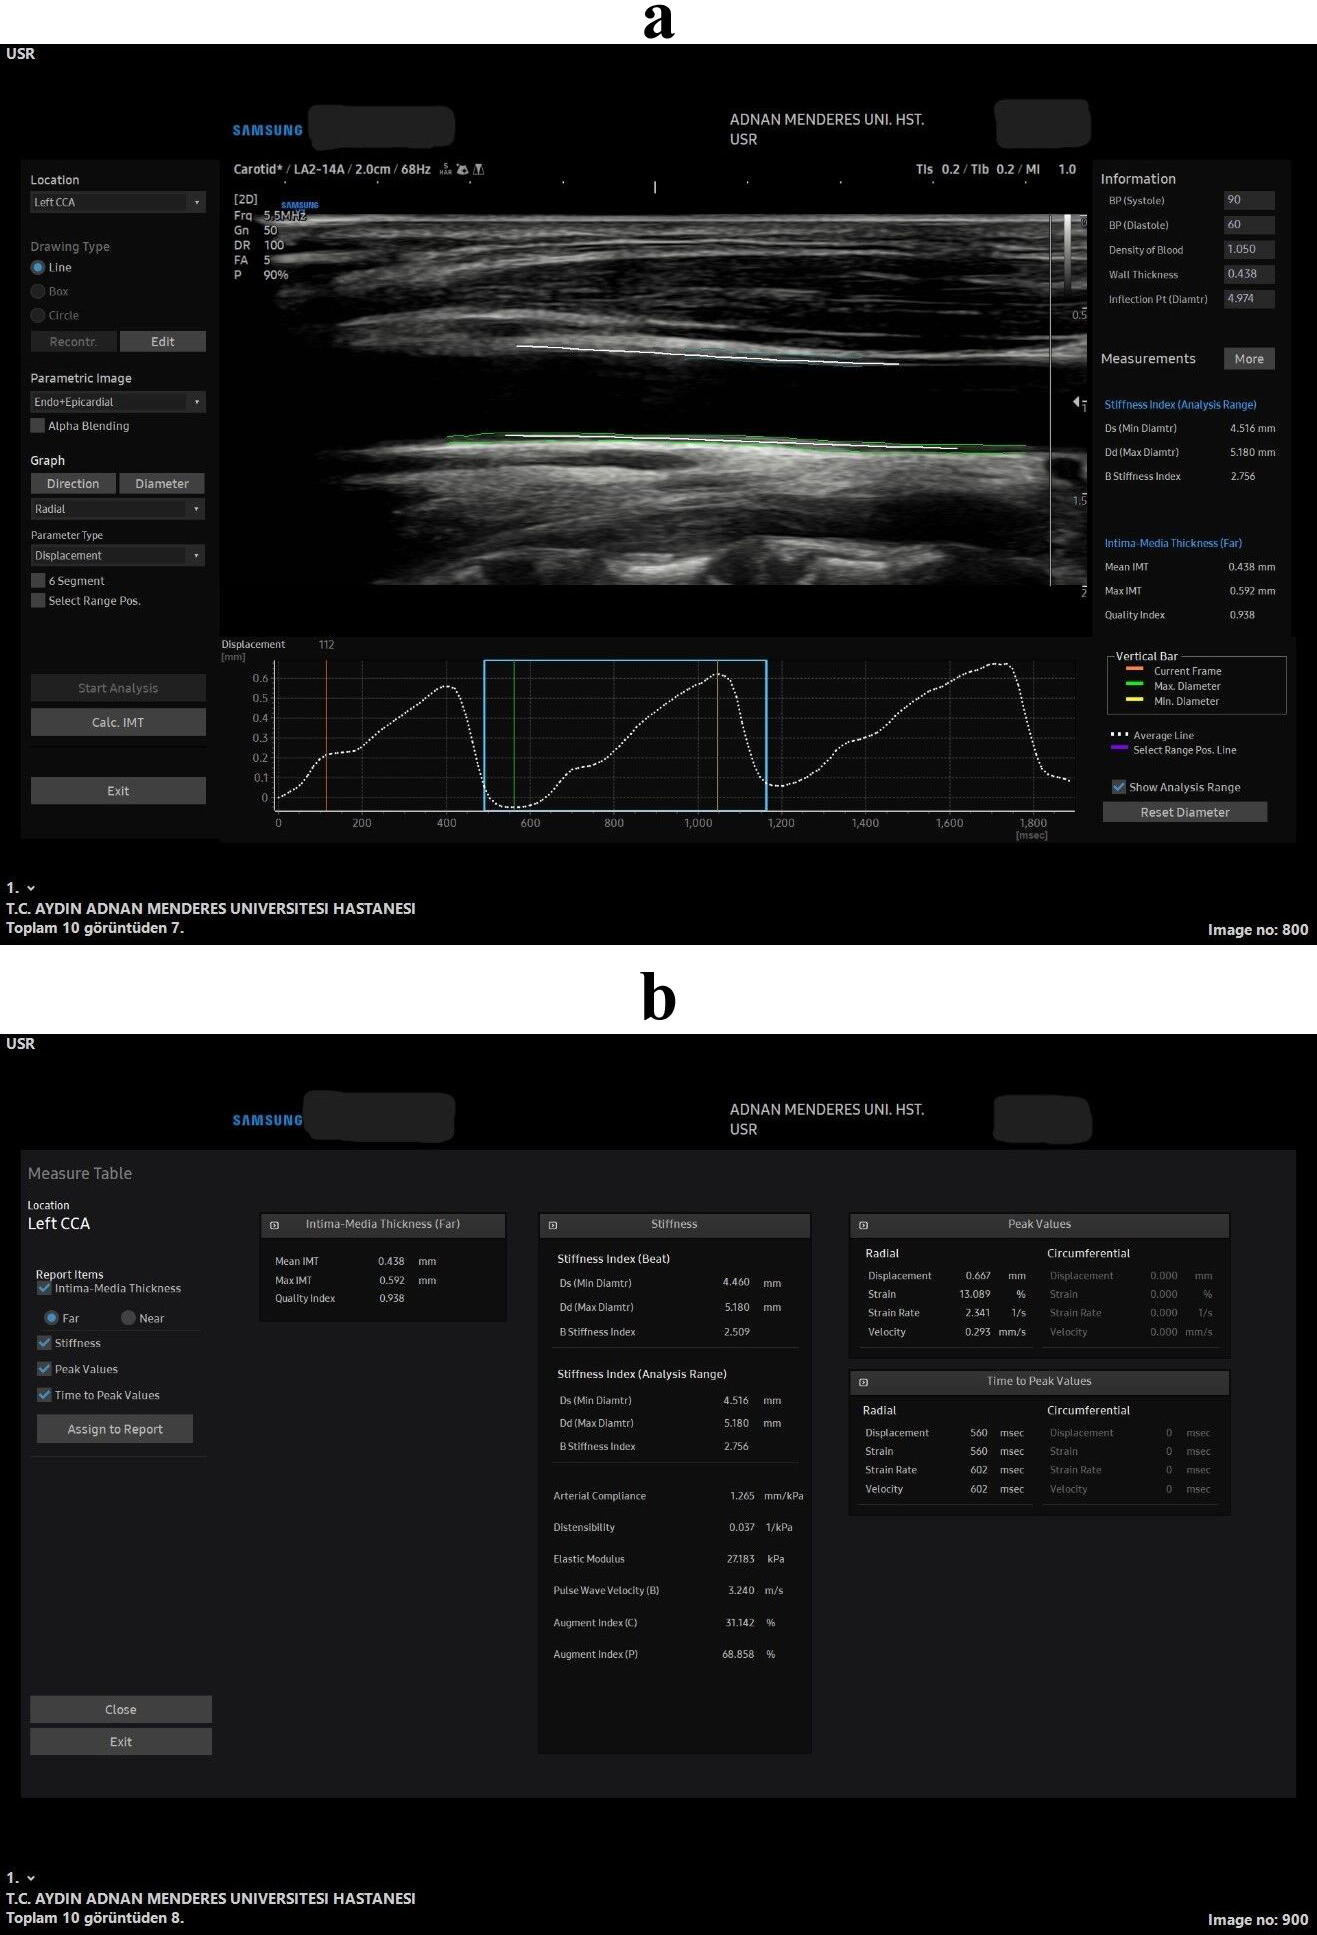 Fig. 2.
All stiffness and strain measurements in the speckle tracking carotid strain (STCS) software in the longitudinal plane. Wave forms and the longitudinal plane US image captured for the arterial analysis (a), all the measurements that was obtained from the soft-ware from that US wave form image (b).
This study aimed to assess arterial wall stiffness and subclinical CVD in RA patients using non-invasive US and STCS software (RS80 Prestige V.3.01, L3-12A transducer, ArterAnalysis, Samsung, Medison Co., Ltd., Seoul, Korea). By evaluating parameters such as arterial wall strain, compliance, and stiffness indices, this research seeks to improve our understanding of the cardiovascular implications of RA and the role of advanced imaging techniques in detecting early atherosclerotic changes. The value of this approach lies in its non-invasive and cost-effective nature, which could enable earlier detection of cardiovascular risk and timely intervention, potentially reducing morbidity and mortality. Compared to traditional methods, such as IMT and PWV, STCS offers a more comprehensive assessment of arterial functions. Thus, this study aimed to enhance early detection strategies and contribute to more personalized cardiovascular risk management in RA patients, ultimately improving long-term outcomes in this high-risk population.
Table 1 summarizes the descriptions of all indicators, such as PWV, augmentation index (AI), arterial distensibility (AD), arterial compliance (AC), elastic modulus (EM), stiffness index (SI), and strain.
| Parameters | Description |
|---|---|
| Arterial distensibility (AD) | Relative change in diameter concerning pressure increase |
| Arterial compliance (AC) | Absolute change in diameter in response to pressure increase |
| Elastic modulus (EM) | The pressure required for a 100% increase in basal diameter |
| Young elastic mod | Elastic modulus for each area |
| Pulse wave velocity (PWV) | Pulse propagation speed in the arterial system |
| Augmentation index (AI) | Increase in pressure after systolic peak |
| Beta stiffness index ( |
Ratio of relative diameter changes from systolic to diastolic |
| Strain | Ratio of diameter changes under stress to basal diameter |
This study was conducted in accordance with the ethical standards of the Institutional and National Research Committees and the 1964 Helsinki Declaration and its later amendments. The study protocol was approved by the Non-Interventional Clinical Research Ethics Committee of our Faculty of Medicine (approval date: 12.08.2021, decision number: 7).
This study included patients diagnosed with RA who presented to the Rheumatology
Clinic of our Tertiary Care Hospital between July 2021 and July 2022. The sample
size was calculated based on an a priori power analysis, which determined that at
least 120 participants were required to achieve a statistical power of 80% with
an effect size of 0.5 and a significance level (
The inclusion criteria for this study comprised the following: patients diagnosed with RA in the Rheumatology Department of our institution, as well as healthy control participants matched by age and gender with no history of RA or other autoimmune or inflammatory diseases. Eligible participants were required to provide informed consent, be between 20 and 80 years old, not be pregnant, and have no history of carotid artery surgery or intervention. Individuals with no evidence of dense calcific plaques or complete carotid artery occlusion on imaging were also included.
The exclusion criteria were designed to complement the inclusion criteria and ensure the homogeneity of the study population. Participants were excluded if they had a history of carotid artery surgery or intervention, complete carotid artery occlusion, dense calcific plaques in the carotid artery, were pregnant, or were outside the age range of 20 to 80 years. These criteria aimed to minimize the impact of confounding variables on the study outcomes while ensuring accurate and reliable ultrasound measurements.
The researcher developed a case report form consisting of 11 questions based on a review of relevant literature and utilized as the primary data collection tool. The form collected comprehensive demographic and clinical information from the patients included in the study. Demographic data included age, gender, height, weight, and body mass index (BMI). Vital signs such as systolic blood pressure (SBP) and diastolic blood pressure (DBP) were also recorded, alongside smoking status and medication usage.
In addition, laboratory findings were obtained, including total cholesterol, low-density lipoprotein (LDL), high-density lipoprotein (HDL), triglycerides (TGs), hemoglobin (Hb), platelet count, erythrocyte sedimentation rate (ESR), C-reactive protein (CRP), disease activity score (DAS), anti-cyclic citrullinated peptide (anti-CCP), and rheumatoid factor (RF). The data were sourced from the hospital’s electronic record system, and patient follow-up files were archived in the hospital. All collected information was systematically documented in the case report form to ensure accurate and consistent data handling throughout the study.
A certified radiologist with expertise in vascular imaging conducted all carotid US examinations in this study. The operator underwent comprehensive training on using the US device and STCS software. Pilot tests were performed before the main research to ensure protocol standardization, and a predefined procedure was strictly followed during all US evaluations.
To enhance measurement consistency, a single operator performed all analyses. The measurement protocols were based on established standards in the literature. For instance, a specific segment of the common carotid artery was selected for analysis, and measurements were conducted in axial and longitudinal planes as part of the protocol.
Carotid US examinations were performed using the Samsung RS80 US device with an L3-12A linear probe (Samsung Medison Co., Ltd., Seoul, Korea). The arterial analysis software (Samsung Medison Co., Ltd., Seoul, Korea) was employed to calculate strain and stiffness parameters. All the parameters estimated by the software are described in Table 1. Displacement of the common carotid artery (CCA) was automatically calculated to assess its functional capacity, with the segment just below the carotid bulb selected for analysis. The operator manually determined the control points on the CCA, and the arterial wall displacement was tracked using an optical flow algorithm integrated into the software.
Before the US examination, patients rested in a supine position for 10 minutes. Afterward, systolic and diastolic blood pressure and pulse rate were measured using a Reister sphygmomanometer (Reister 1312 Minimus II, Rudolf Riester GmbH, Jungingen, Germany). These values and the patient’s height and weight were entered into the arterial analysis software. The CCA was evaluated in both axial (Fig. 1) and longitudinal planes (Fig. 2), with the mean values of each measurement recorded for both the right and left CCA. All images and measurements were obtained during the research session—after the 10-minute rest period—ensuring that the image display time falls within the defined research time range.
The software automatically measured all strain and stiffness parameters in the axial (Fig. 1) and longitudinal (Fig. 2) planes. The carotid intima-media thickness (CIMT) was also assessed using the same software with the quality index (QI) measurement in the longitudinal plane only (Fig. 2). To achieve this, the interfaces of the blood–intima boundaries within the carotid artery (at least five points in total) were identified on a static image for both the anterior and posterior walls. The software automatically tracked the movement of these points to calculate the relevant parameters.
The research data were analyzed using SPSS version 21.0 (IBM Corp., Armonk, NY,
USA). The normality of the continuous variables was assessed using the
Shapiro–Wilk test and visual inspections (e.g., histograms and probability
plots). For variables with a normal distribution, data are presented as the mean
The Chi-square test was employed for categorical variables to evaluate differences between groups. Continuous variables with parametric distributions were compared between independent groups using the student’s t-test, while the Mann–Whitney U test was utilized for non-parametric continuous variables. This study used Pearson’s correlation test for parametric variables that met the assumptions of normality and linearity, while Spearman’s correlation test was employed for variables that did not meet these assumptions or where monotonic relationships were of interest. Although Spearman’s test is commonly associated with non-parametric variables, it is not limited to these and can also be used for ranked data or monotonic relationships in parametric datasets. This approach ensured that the most appropriate statistical method was applied based on the characteristics of the data, enhancing the robustness of the analysis.
The multivariable linear regression model in this study was designed to evaluate
the relationship between RA and arterial stiffness and strain parameters, with RA
as the independent variable (X) and stiffness and strain parameters as the
dependent continuous variables (Y). The model was adjusted for potential
confounders, including age, gender, BMI, and smoking status. These were selected
based on their well-established roles as cardiovascular risk factors in the
literature, independent of their correlation with the primary variables.
Additionally, variables showing significant associations in univariate analyses
were included to assess their contribution alongside the identified confounders.
This comprehensive approach ensures that the independent effect of RA on vascular
stiffness and strain is accurately evaluated, accounting for potential
confounding influences. Statistical tests were conducted using two-tailed
p-values to detect differences in either direction, with a significance
threshold of p
| 95% Confidence interval for |
p-value | ||||
| Lower bound | Upper bound | ||||
| CIMT, mean | 0.050 | 0.017 | 0.082 | 0.003 | |
| Axial plane | |||||
| Stiffness parameters | |||||
| –2.460 | –3.619 | –1.301 | |||
| AC (mm/kPa) | 0.098 | 0.016 | 0.179 | 0.019 | |
| AD (/kPa) | 0.002 | 0.001 | 0.003 | 0.001 | |
| EM (kPa) | –39.708 | –56.739 | –22.676 | ||
| PWV (m/s) | –0.711 | –1.141 | –0.280 | 0.001 | |
| Strain parameters (radial) | |||||
| DP (mm) | 0.048 | 0.013 | 0.082 | 0.007 | |
| Strain (%) | 0.834 | 0.355 | 1.313 | 0.001 | |
| SR (1/s) | 0.105 | 0.049 | 0.162 | ||
| Strain parameters (circumferential) | |||||
| DP (mm) | 0.003 | –0.002 | 0.009 | 0.226 | |
| Strain (%) | 0.819 | 0.342 | 1.295 | 0.001 | |
| SR (1/s) | 0.103 | 0.047 | 0.159 | ||
| Longitudinal plane | |||||
| Stiffness parameters | |||||
| –2.598 | –3.775 | –1.421 | |||
| AC (mm/kPa) | 0.144 | 0.069 | 0.218 | ||
| AD (/kPa) | 0.003 | 0.001 | 0.004 | ||
| EM (kPa) | –41.039 | –59.048 | –23.029 | ||
| PWV (m/s) | –0.862 | –1.304 | –0.419 | ||
| Strain parameters (radial) | |||||
| DP (mm) | 0.064 | 0.028 | 0.100 | 0.001 | |
| Strain (%) | 1.118 | 0.557 | 1.679 | ||
| SR (1/s) | 0.102 | 0.033 | 0.171 | 0.004 | |
*Adjusted for age, gender, body mass index, and presence of smoking. CIMT,
carotid intima-media thickness; DP, displacement; SR, strain rate. Bold p-values represent
p
A total of 143 participants were included in the study, of which 75 were RA
patients (60 females and 15 males) and 68 were healthy controls (54 females and
14 males). The mean age of the RA group was 50.9
| Group | p-value | ||||
| RA (n = 75) | Control (n = 68) | ||||
| Mean |
Median (min–max) | Mean |
Median (min–max) | ||
| Age^a^ (year) | 50.9 |
50.0 (25.0–74.0) | 53.1 |
53.0 (20.0–77.0) | 0.262^a^ |
| Height^a^ (cm) | 164.8 |
165.0 (151.0–181.0) | 164.3 |
163.5 (150.0–193.0) | 0.309^a^ |
| Weight^b^ (kg) | 74.7 |
74.0 (47.0–102.0) | 70.8 |
70.0 (45.0–117.0) | 0.066^b^ |
| BMI^b^ (kg/m2) | 27.6 |
27.5 (17.0–38.9) | 26.3 |
26.1 (17.5–39.1) | 0.127^b^ |
| SBP^a^ (mmHg) | 126.5 |
126.0 (100.0–230.0) | 118.2 |
120.0 (90.0–150.0) | 0.003^a^ |
| DBP^b^ (mmHg) | 78.3 |
80.0 (60.0–110.0) | 75.6 |
80.0 (60.0–100.0) | 0.244^b^ |
RA, rheumatoid arthritis; BMI, body mass index; SBP, systolic blood pressure;
DBP, diastolic blood pressure; SD, standard deviation;
^a^, independent samples t-test used
for normally distributed data (presented as the mean
Laboratory findings of both groups revealed that CRP levels were significantly
higher in the RA group compared to the control group (p
| Group | p-value | ||||||
| RA | Control | ||||||
| n | Mean |
Median (min–max) | n | Mean |
Median (min–max) | ||
| Total cholesterol^a^ | 73 | 203.3 |
200.0 (120.0–321.0) | 51 | 198.3 |
201.0 (94.0–276.0) | 0.501^a^ |
| LDL^a^ | 73 | 114.2 |
105.0 (49.0–223.0) | 51 | 116.7 |
115.0 (39.0–190.0) | 0.536^a^ |
| HDL^a^ | 73 | 66.8 |
64.3 (35.0–105.0) | 51 | 61.2 |
60.2 (27.6–94.1) | 0.071^a^ |
| TG^b^ | 73 | 109.6 |
95.0 (33.0–272.0) | 51 | 115.2 |
109.0 (48.0–253.0) | 0.549^b^ |
| Hb^a^ | 75 | 12.9 |
12.7 (10.4–16.8) | 64 | 16.4 |
13.1 (8.5–123.0) | 0.263^a^ |
| Platelet^a^ | 75 | 291,893.3 |
296,000.0 (113,000.0–458,000.0) | 64 | 284,562.5 |
273,000.0 (96,000.0–553,000.0) | 0.600^a^ |
| ESR^b^ | 75 | 31.8 |
31.0 (4.0–68.0) | 47 | 30.1 |
22.0 (2.0–137.0) | 0.101^b^ |
| CRP^b^ | 72 | 7.4 |
3.3 (2.0–71.9) | 53 | 8.6 |
2.0 (0.8–145.0) | 0.033^b^ |
min, minimum; max, maximum;
LDL, low-density lipoprotein; HDL, high-density lipoprotein; TG,
triglyceride; Hb, hemoglobin; ESR, erythrocyte sedimentation rate; CRP, C-reactive protein. Normality was assessed by the Shapiro–Wilk test. Bold
p-values represent p
| DAS (mean |
3.13 | ||
| Anti-CCP, n (%) | Negative | 13 (19.7) | |
| Positive | 53 (80.3) | ||
| Anti-CCP (mean |
78.42 | ||
| RF, n (%) | Negative | 16 (24.6) | |
| Positive | 49 (75.4) | ||
| RF (mean |
136.30 | ||
| Smoking, n (%) | No | 58 (77.3) | |
| Yes | 17 (22.7) | ||
| Duration after diagnosis (months) (mean |
82.99 | ||
DAS, disease activity score; Anti-CCP, antibodies cyclic citrullinated peptide; RF, rheumatoid factor; n, number.
Table 5 presents laboratory parameters specific to the RA group, including DAS, anti-CCP, RF, smoking status, and duration after diagnosis. These variables provide insights into the clinical characteristics of the RA cohort, supporting a deeper understanding of disease activity and its relationship with cardiovascular risk markers.
Meanwhile, Tables 6,7 compare the RA and control groups regarding arterial
wall stiffness and strain. For variables with a normal distribution, the mean
| Group | p-value | |||||||||
| RA (n = 75) | Control (n = 68) | |||||||||
| Mean |
Median | Min | Max | Mean |
Median | Min | Max | |||
| CIMT mean^a^ | 0.541 |
0.535 | 0.346 | 1.068 | 0.604 |
0.592 | 0.305 | 1.096 | 0.006^a^ | |
| CIMT QI^b^ | 0.884 |
0.958 | 0.423 | 1.000 | 0.872 |
0.949 | 0.381 | 1.000 | 0.493^b^ | |
| Stiffness parameters | ||||||||||
| 9.937 |
8.330 | 3.363 | 23.548 | 7.298 |
7.041 | 3.283 | 12.686 | 0.001^a^ | ||
| AC (mm/kPa)^b^ | 0.519 |
0.512 | 0.135 | 1.093 | 0.665 |
0.655 | 0.307 | 1.326 | 0.000^b^ | |
| AD (/kPa)^b^ | 0.009 |
0.010 | 0.002 | 0.025 | 0.012 |
0.011 | 0.006 | 0.032 | 0.000^b^ | |
| EM (kPa)^a^ | 134.357 |
111.180 | 42.235 | 461.259 | 93.008 |
90.944 | 32.380 | 165.550 | 0.000^a^ | |
| PWV (m/s)^b^ | 6.676 |
6.351 | 0.000 | 12.113 | 5.822 |
5.875 | 3.520 | 7.906 | 0.001^b^ | |
| Strain parameters (radial) | ||||||||||
| DP (mm)^b^ | 0.343 |
0.327 | 0.155 | 0.616 | 0.406 |
0.400 | 0.254 | 0.859 | 0.001^b^ | |
| Strain (%)^b^ | 5.678 |
5.451 | 2.578 | 11.051 | 6.757 |
6.484 | 4.140 | 12.751 | 0.000^b^ | |
| SR (1/s)^b^ | 0.592 |
0.561 | 0.223 | 1.169 | 0.698 |
0.693 | 0.309 | 1.698 | 0.001^b^ | |
QI, quality index. Note: Normality was
assessed using the Shapiro–Wilk test. The choice of mean
| Group | p-value | |||||||||
| RA (n = 75) | Control (n = 68) | |||||||||
| Mean |
Median | Min | Max | Mean |
Median | Min | Max | |||
| Stiffness parameters | ||||||||||
| 10.319 |
9.092 | 4.023 | 24.693 | 8.001 |
7.233 | 3.585 | 14.771 | 0.004^a^ | ||
| AC (mm/kPa)^b^ | 0.675 |
0.637 | 0.215 | 1.654 | 0.759 |
0.736 | 0.323 | 1.539 | 0.036^b^ | |
| AD (/kPa)^b^ | 0.009 |
0.008 | 0.002 | 0.020 | 0.011 |
0.011 | 0.006 | 0.029 | 0.001^b^ | |
| EM (kPa)^a^ | 139.505 |
120.937 | 50.528 | 473.135 | 101.938 |
95.897 | 35.365 | 182.030 | 0.001^a^ | |
| PWV (m/s)^b^ | 6.789 |
6.741 | 0.000 | 12.267 | 6.098 |
6.001 | 3.686 | 8.192 | 0.003^b^ | |
| Strain parameters (radial) | ||||||||||
| DP (mm)^b^ | 0.376 |
0.368 | 0.056 | 0.797 | 0.416 |
0.403 | 0.191 | 0.697 | 0.028^b^ | |
| Strain (%)^b^ | 5.474 |
5.170 | 2.930 | 11.272 | 6.201 |
6.053 | 3.268 | 11.807 | 0.006^b^ | |
| SR (1/s)^b^ | 0.594 |
0.573 | 0.340 | 1.346 | 0.688 |
0.665 | 0.389 | 1.610 | 0.004^b^ | |
| Strain parameters (circumferential) | ||||||||||
| DP (mm)^b^ | 0.051 |
0.048 | 0.032 | 0.177 | 0.054 |
0.053 | 0.025 | 0.091 | 0.074^b^ | |
| Strain (%)^b^ | 5.451 |
5.102 | 2.873 | 11.151 | 6.166 |
5.981 | 3.168 | 11.724 | 0.007^b^ | |
| SR (1/s)^b^ | 0.592 |
0.560 | 0.343 | 1.366 | 0.684 |
0.667 | 0.391 | 1.589 | 0.004^b^ | |
Normality was assessed using the Shapiro–Wilk test. Mean
Stiffness parameters: The RA group consistently exhibited higher
Strain parameters: Most radial and circumferential strain indices (displacement (DP), strain
%, strain rate (SR)) were significantly lower in RA patients (p
These findings underscore a pattern of increased stiffness and reduced compliance/strain in patients with RA. Only the axial plane circumferential DP did not reach statistical significance.
Tables 8,9 examine the correlations of stiffness and strain parameters with the DAS and disease duration in RA patients. Table 8 focuses on parameters in the longitudinal plane, while Table 9 presents those in the axial plane. The DAS reflects RA disease activity, and disease duration refers to the time elapsed since RA diagnosis. Among our 75 patients, the shortest recorded duration was 1 month, and the longest was 480 months, with a mean of 81.88 months. No significant correlation was found between the DAS and any stiffness or strain parameters in both planes. Regarding disease duration, only the CIMT mean parameter in the longitudinal plane (Table 8) showed a statistically significant correlation (r = 0.373, p = 0.001). In contrast, none of the axial plane parameters (Table 9) were significantly correlated with disease duration. The heterogeneity of the RA population included in the study may influence these results.
| DAS | Disease duration after diagnosis | |||
| CIMT mean | r | –0.156 | 0.373 | |
| p | 0.181 | 0.001 | ||
| Stiffness parameters | ||||
| β-SI | r | –0.099 | –0.019 | |
| p | 0.396 | 0.873 | ||
| AC (mm/kPa) | r | 0.051 | 0.086 | |
| p | 0.667 | 0.469 | ||
| AD (/kPa) | r | 0.094 | –0.009 | |
| p | 0.423 | 0.939 | ||
| EM (kPa) | r | –0.095 | 0.020 | |
| p | 0.419 | 0.867 | ||
| PWV (m/s) | r | –0.198 | 0.102 | |
| p | 0.089 | 0.387 | ||
| Strain parameters (radial) | ||||
| DP (mm) | r | 0.071 | 0.055 | |
| p | 0.547 | 0.642 | ||
| Strain (%) | r | 0.121 | –0.013 | |
| p | 0.303 | 0.910 | ||
| SR (1/s) | r | 0.091 | –0.081 | |
| p | 0.439 | 0.493 | ||
Bold p-values represent p
| DAS | Disease duration after diagnosis | |||
| Stiffness parameters | ||||
| r | –0.112 | 0.070 | ||
| p | 0.337 | 0.555 | ||
| AC (mm/kPa) | r | 0.035 | –0.037 | |
| p | 0.767 | 0.755 | ||
| AD (/kPa) | r | 0.162 | –0.131 | |
| p | 0.166 | 0.264 | ||
| EM (kPa) | r | –0.139 | 0.104 | |
| p | 0.234 | 0.377 | ||
| PWV (m/s) | r | –0.209 | 0.120 | |
| p | 0.071 | 0.307 | ||
| Strain parameters (radial) | ||||
| DP (mm) | r | 0.060 | –0.064 | |
| p | 0.609 | 0.586 | ||
| Strain (%) | r | 0.147 | –0.131 | |
| p | 0.208 | 0.265 | ||
| SR (1/s) | r | 0.127 | –0.186 | |
| p | 0.279 | 0.112 | ||
| Strain parameters (circumferential) | ||||
| DP (mm) | r | 0.094 | –0.073 | |
| p | 0.424 | 0.535 | ||
| Strain (%) | r | 0.148 | –0.130 | |
| p | 0.204 | 0.270 | ||
| SR (1/s) | r | 0.137 | –0.182 | |
| p | 0.240 | 0.120 | ||
The disease duration reflects the time elapsed since the clinical diagnosis of RA.
In the multivariate linear regression analysis adjusted for age, BMI, and
smoking, RA was negatively and independently associated with axial and
longitudinal
This study aimed to investigate the influence of RA on arterial stiffness and strain parameters using a novel, non-invasive imaging technique, STCS–US. Our findings demonstrated that RA patients exhibit significantly higher arterial stiffness and altered strain parameters compared to healthy controls, emphasizing the role of chronic inflammation in vascular remodeling. Using STCS–US, a novel imaging modality, we detected functional changes in the carotid arteries that precede structural changes such as plaque formation. These results align with previous studies assessing vascular stiffness in RA patients and highlight the potential of STCS–US in early cardiovascular risk stratification. Unlike traditional markers, stiffness and strain parameters offer a more sensitive evaluation of vascular health, providing a pathway for earlier intervention.
RA is a systemic, chronic inflammatory disease that primarily affects the joints. RA is associated with an increased risk of cardiovascular events. The mortality, adjusted for age and sex, is 0.5–2 times higher in RA patients than in healthy individuals, and CVD is responsible for about 50–60% of this mortality [11, 12]. Subsequently, the effects of RA on the cardiovascular system have become a growing area of interest [13]. Chronic inflammation, a hallmark of RA, promotes endothelial dysfunction, augmented arterial wall stiffness, and subclinical atherosclerosis, all early markers of cardiovascular events [14]. This study aimed to investigate the influence of RA on arterial wall stiffness and strain parameters using a novel, non-invasive imaging technique, STCS–US. By assessing these vascular parameters, we intended to identify early cardiovascular changes in patients with RA and compare them with a demographically matched control group.
The current literature on arterial wall stiffness and RA contains many original
articles, systematic reviews, and meta-analyses [15, 16]. The most common
technique in those studies was applanation tonometry; very few studies used
STCS–US technology in the RA group [9]. While our research builds upon the
foundational work of Lee et al. (2012) [9], who first applied speckle
tracking strain imaging to assess carotid arterial stiffness in RA patients, our
study extends this approach in several significant ways. Firstly, we conducted a
comprehensive parameter analysis by examining a broader range of stiffness and
strain metrics, including
Chronic inflammation is well-established as a critical driver of atherosclerosis and other cardiovascular complications in RA patients [21]. Several studies have shown that inflammatory markers, particularly CRP, are elevated in RA patients and are directly associated with increased cardiovascular risk [22]. In our study, CRP levels were significantly higher in the RA group compared to the control group, which is consistent with the current literature. This finding also aligns with the work of Myasoedova et al. [23], who demonstrated that serum CRP levels in RA patients frequently exceed the 3 mg/L and 10 mg/L cutoffs associated with high and very high cardiovascular risk in the general population. CRP reflects the inflammatory burden in RA and acts as an independent predictor of cardiovascular events [24]. Interestingly, our study found minimal differences in other lipid markers, such as total cholesterol, LDL, HDL, and TGs, between RA patients and controls, which is consistent with the findings of Erum et al. [25]. This phenomenon in RA, known as the “lipid paradox”, suggests that the relationship between lipids and cardiovascular risk in RA patients is more complex than in the general population. The role of inflammation in endothelial dysfunction is key, as it leads to arterial wall stiffening, which precedes the development of structural atherosclerotic changes, such as carotid plaque formation. This is supported by Popescu et al. [26], who found that RA patients have increased arterial wall stiffness compared to healthy controls, as measured by PWV.
Hypertension is a well-documented cardiovascular risk factor in RA patients, likely stemming from the same inflammatory pathways that drive atherosclerosis. Several studies have reported elevated blood pressure in RA patients, potentially linked to vascular endothelial dysfunction [27]. Bedeković et al. [28] found that the prevalence of hypertension in RA patients was significantly higher than in the general population, with rates ranging from 52% to 73%.
In a study by Manavathongchai et al. [27], significantly higher SBP was
observed in RA patients compared to controls (129
The increase in blood pressure is clinically significant as it exacerbates the already heightened cardiovascular risk in RA patients. Indeed, a paper by Jagpal and Navarro-Millán [31] showed that hypertension in RA was associated with an 84% increased risk of cardiovascular events (relative risk (RR) 1.84, 95% CI 1.38–2.46), thereby underscoring the importance of monitoring and managing blood pressure in RA patients to reduce their long-term cardiovascular morbidity and mortality.
The European League Against Rheumatism (EULAR) recommendations for
cardiovascular disease risk management emphasize the need for regular screening
and management of modifiable cardiovascular risk factors in RA patients,
including hypertension [32]. These guidelines suggest considering a blood
pressure target
In conclusion, hypertension is a significant comorbidity in RA patients that
requires careful attention and management to mitigate the increased
cardiovascular risk associated with the disease. Moreover, regular monitoring and
appropriate treatment of hypertension should be an integral part of the
comprehensive care of RA patients. In our study, even though our RA patients were
well monitored for hypertension, RA patients still had statically higher SBP than the
control group (Table 3; p
Arterial wall stiffness is a key marker of early vascular aging and is known to
precede the development of atherosclerotic plaques. Furthermore, increased
arterial wall stiffness is associated with a higher risk of cardiovascular
events, including myocardial infarction and stroke [33]. Our study used STCS–US
to assess arterial wall stiffness and strain parameters in RA patients and
healthy controls. We found significant differences in all the stiffness and
strain parameters between the two groups, with RA patients showing a
statistically significant increase in arterial wall stiffness (p
Carotid IMT is a well-established marker of subclinical atherosclerosis, and its
increase is often observed in patients with RA. Our study demonstrated that the
control group had significantly higher mean carotid IMT values compared to RA
patients (mean
The findings of this study have important clinical implications. RA patients are at a significantly increased risk of CVDs, and early detection of subclinical vascular changes is critical in preventing long-term cardiovascular events. Non-invasive imaging techniques, such as STCS, provide a valuable tool for early cardiovascular risk stratification. Since arterial wall stiffness and strain parameters often change before structural markers, such as IMT, are detected, incorporating these assessments into routine clinical practice could improve the early detection of cardiovascular risk in RA patients.
Furthermore, cardiovascular risk management in RA should be a multidisciplinary effort involving rheumatologists, cardiologists, and primary care providers. Aggressive inflammation management using disease-modifying antirheumatic drugs (DMARDs) and biologics, alongside traditional cardiovascular risk factors, such as hypertension and dyslipidemia, is essential. Longitudinal studies are needed to determine whether improvements in arterial wall stiffness and strain parameters correlate with reduced cardiovascular events over time, particularly in RA patients receiving biologic therapies that target inflammatory pathways.
This study has several limitations. First, its cross-sectional design prevents us from establishing a causal relationship between RA and increased arterial wall stiffness and strain. Thus, longitudinal studies are needed to evaluate whether the early vascular changes observed in this study predict future cardiovascular events. Even though this study adjusted for confounding factors such as age, gender, BMI, and smoking by implementing a multivariate linear regression analysis, other variables, such as treatment regimens and comorbidities, including diabetes or hypertension, were not fully accounted for. These factors could influence the observed vascular outcomes and should be considered in future studies. Additionally, a single radiologist performed our measurements only once; thus, no intra- and inter-observer variability evaluation could be conducted. Finally, the sample size, while sufficient for detecting significant differences, could be expanded in future research to improve the generalizability of the findings.
This study highlights the significant impact of RA on arterial wall stiffness and strain, markers of early cardiovascular risk. STCS–US can provide valuable insights into both functional and structural changes in the carotid arteries of RA patients, demonstrating that RA accelerates vascular aging and increases cardiovascular risk. These findings underscore the importance of early cardiovascular assessment and intervention in RA patients to mitigate the long-term burden of cardiovascular disease.
All the data generated during the study is presented in the results section.
VT, AFT, HB, AU and MG made substantial contributions to conception and design. VT and HB perform the acquisition of the data. VT, AFT, HB, AU and MG made substantial contributions to analysis and interpretation of data. VT, AFT, HB, AU and MG have been involved in drafting the manuscript and also contribute adding intellectual content. All authors contributed to editorial changes in the manuscript. All authors read and approved the final manuscript. All authors have participated sufficiently in the work and agreed to be accountable for all aspects of the work.
This study was conducted in accordance with the ethical standards of the institutional and national research committee and with the 1964 Helsinki Declaration and its later amendments. The study protocol was approved by the Non-Interventional Clinical Research Ethics Committee of Aydin Adnan Menderes University (No: 2021/138; approval date: 12.08.2021, decision number: 7). A written consent was signed by the patients or their families/legal guardians.
We are grateful to Dr. Yasam UMUTLU (Efeler District Health Directorate) for his valuable contribution to the statistical analysis.
This research received no external funding.
The authors declare no conflict of interest.
References
Publisher’s Note: IMR Press stays neutral with regard to jurisdictional claims in published maps and institutional affiliations.