


 , Hongwei Qiao 2,*
1 Department of Radiology, Kongjiang Hospital of Yangpu District, 200093 Shanghai, China
2 Department of Geriatrics, Kongjiang Hospital of Yangpu District, 200093 Shanghai, China
Abstract
Lipoprotein(a) [Lp(a)] is associated with the development of coronary artery calcification (CAC), yet its exact function is not fully understood. This study sought to assess the relationship between Lp(a) levels and the risk of CAC in elderly diabetic patients.
This cross-sectional study included 486 elderly diabetic patients. The exposure factor was Lp(a) levels, categorized into three groups (T1, T2, T3). The outcome was the presence of CAC. The relationship between Lp(a) levels and CAC was evaluated using several statistical methods, including univariate and multivariate logistic regression, multivariable stratified analysis, receiver operating characteristic (ROC) curve analysis, and restricted cubic spline (RCS) analysis.
The highest Lp(a) group (T3) showed significantly higher prevalence of CAC compared to the T1 and T2 groups. Univariate logistic regression indicated a significant link between Lp(a) and CAC. Furthermore, multivariate logistic regression supported the finding that elevated Lp(a) levels correlated with a heightened risk of CAC in all models. Specifically, each unit rise in Lp(a) was associated with a notable increase in CAC risk, and Log10Lp(a) and each 1 standard deviation increase in Lp(a) also significantly elevated CAC risk. Multivariable stratified analysis demonstrated significant differences in CAC risk across various subgroups, including age ≤70 years, males, females, smokers, hypertensive, non-hypertensive, hyperlipidemic, non-hyperlipidemic, non-stroke, and non-chronic kidney disease patients. ROC curve analysis showed that adding Lp(a) to the baseline model improved the area under the curve from 0.741 to 0.755. RCS analysis indicated a significant, approximately linear association between Log10Lp(a) and CAC risk (p nonlinear = 0.115).
In an elderly diabetic population, elevated levels of Lp(a) were strongly linked to a greater risk of CAC. Integrating Lp(a) measurements with conventional risk factors improves the predictive accuracy for CAC.
Keywords
- lipoprotein(a)
- coronary artery calcification
- diabetes
- elderly
- restricted cubic spline
Coronary artery disease (CAD) ranks among the top causes of mortality and health-related challenges globally [1]. Atherosclerosis is the underlying pathological process of CAD, with coronary artery calcification (CAC) being an important marker and predictor [2]. The presence of CAC indicates the maturity and calcification of coronary plaques, often signifying a high risk of future cardiovascular events [3]. Among the numerous factors influencing the development of calcification, lipoprotein(a) [Lp(a)] has received increased attention for its potential role in atherosclerosis [4, 5, 6].
Diabetes significantly increases the risk of developing cardiovascular disease (CVD) [7]. Persistent high blood sugar results in various metabolic disruptions, such as dyslipidemia, oxidative stress, and ongoing low-grade inflammation, which all play a role in the onset and advancement of atherosclerosis [8]. Diabetic patients exhibit accelerated atherosclerosis, with plaques that are more extensive and prone to calcification compared to non-diabetic individuals [9]. Elderly diabetic patients are particularly vulnerable due to the combined effects of aging and prolonged exposure to glucose during hyperglycemia, which significantly increases their cardiovascular risk. Aging is linked to issues like endothelial dysfunction, increased arterial stiffness, and heightened systemic inflammation, all of which exacerbate the atherosclerotic process [10]. As a result, older adults with diabetes face a significantly greater risk of developing CAD and suffering from negative cardiovascular events [11].
Lp(a) is a distinct lipoprotein made up of low-density lipoprotein (LDL) and apolipoprotein(a) [apo(a)], which are connected by a disulfide bond. The apo(a) structure exhibits considerable polymorphisms, with variations in the number of kringle IV type 2 repeats among individuals, resulting in notable differences in Lp(a) levels [12]. Research indicates that high Lp(a) levels serve as an independent risk factor for atherosclerotic cardiovascular disease (ASCVD) [13]. Lp(a) promotes atherosclerosis through various mechanisms, including lipid deposition, inflammatory responses, and thrombosis [14]. Due to its structural resemblance to plasminogen, Lp(a) can compete for binding sites within the fibrinolytic system, thereby hindering fibrinolysis and raising the likelihood of thrombosis [14].
Although the relationship between Lp(a) and atherosclerosis has been extensively studied, its specific association with CAC, particularly in elderly diabetic patients, requires further investigation [5]. Elevated Lp(a) levels may promote the development of CAC through multiple mechanisms, including the promotion of smooth muscle cell proliferation by oxidatively modified LDL, inhibition of fibrinolysis, and its pro-inflammatory and pro-thrombotic properties [15]. Current research demonstrates a positive relationship between increased Lp(a) levels and CAC, but the results are inconsistent, possibly due to differences in study populations, methodologies, and confounding factors [16, 17].
Consequently, investigating the link between Lp(a) and CAC in older adults with diabetes holds considerable clinical relevance and practical significance. We hypothesize that higher levels of Lp(a) are significantly associated with an increased risk of CAC in elderly diabetic patients, even after adjusting for other cardiovascular risk factors. First, this population has a markedly increased risk of cardiovascular events. Understanding the role of Lp(a) in the development of CAC can aid in more precise risk stratification and individualized treatment strategies. Second, as a potentially modifiable risk factor, new therapies aimed at lowering Lp(a) levels are under development. Identifying which patients are most likely to benefit will help optimize treatment regimens and improve patient outcomes. Furthermore, elderly diabetic patients often have multiple chronic conditions, making medication management complex. Understanding the role of Lp(a) in this context can provide a basis for developing more effective comprehensive treatment plans, lessening the impact of CVD and enhancing the quality of life for patients.
This cross-sectional study included 486 elderly diabetic patients who were hospitalized at Kongjiang Hospital of Yangpu District from January 2021 to January 2024. All participants gave informed consent, and the research received approval from the ethics committee at Kongjiang Hospital in Yangpu District (LL-2020-KY-25). The study was conducted in accordance with the Declaration of Helsinki. Inclusion criteria encompassed individuals aged 60 and above who were diagnosed with diabetes mellitus based on the standards set by the American Diabetes Association (ADA) [18]. Exclusion criteria included presence of severe liver disease (such as acute hepatitis, cirrhosis, and liver failure), active malignancy, recent major surgery (within the last six months), severe mental illness, and any other conditions that could affect Lp(a) levels, diabetes, or CAC, such as acute inflammatory diseases, severe infections, and autoimmune disorders.
Data were collected through patient interviews, medical record reviews, and
physical examinations to ensure comprehensiveness and accuracy. Information
collected included demographic data, behavioral information, medical history,
medication use, and physical measurements. Smoking status was classified into two
groups: current smokers and those who had never smoked Medical history included
hypertension, hyperlipidemia, stroke, and chronic kidney disease (CKD).
Hypertension was identified through a documented diagnosis in medical records,
the use of antihypertensive drugs, or by measuring a systolic blood pressure
(SBP) of 140 mmHg or higher, or a diastolic blood pressure (DBP) of 90 mmHg or
more after five minutes of resting [19]. Hyperlipidemia was identified through
documented diagnoses, the use of lipid-lowering medications, or by total
cholesterol levels of
Laboratory assessments comprised total cholesterol, LDL-C, HDL-C, triglycerides, apolipoprotein A1 (ApoA1), apolipoprotein B (ApoB), fasting plasma glucose (FPG), hemoglobin A1c (HbA1c), and uric acid concentrations All blood biomarkers were measured in fasting patients, from venous blood samples. The eGFR was calculated using the CKD-EPI formula [22]. Blood pressure measurements were taken using a standard method to measure SBP and DBP, with patients resting for at least 5 minutes before each measurement. Each participant underwent three blood pressure measurements, with the average value utilized for the analysis.
Lp(a) levels were assessed through an immunoturbidimetric method (Siemens
Healthineers, ADVIA Chemistry Lp(a) Assay Kit, Erlangen, Germany). Fasting venous
blood samples were collected from patients, centrifuged to separate the serum,
and analyzed using a commercial immunoturbidimetric kit containing specific
anti-Lp(a) antibodies. The concentration of Lp(a) was determined through
turbidimetric measurement. Each assay was calibrated with standard samples and
included high, medium, and low concentration quality control samples to ensure
accuracy and consistency. Lp(a) levels were expressed in milligrams per liter
(mg/L). The general reference range was 0–300 mg/L, although the specific
reference range may vary depending on racial and individual differences.
Participants were categorized into three groups according to the tertiles of
Lp(a) levels: T1 (lowest tertile:
CAC was detected using coronary computed tomography angiography (coronary CTA,
SOMATOM Definition Flash, Siemens, Berlin, Germany). During the procedure, an
iodine contrast agent was injected intravenously to enhance the visualization of
the coronary arteries. Patients lay flat on the scanning table with their arms
raised above their heads. The computed tomography (CT) scanner captured
cross-sectional images of the heart through continuous scanning. To minimize
motion artifacts and improve image quality, patients were required to hold their
breath during the scan. The scanned images were processed and reconstructed using
specialized software to identify and quantify calcified plaques in the coronary
arteries. The quantification of CAC was performed using the Agatston scoring
system, which calculates the score based on the area and density of the calcified
plaques [23]. Image analysis was conducted using specialized software to identify
calcified plaques in the coronary arteries. The Agatston score for each plaque
was determined by multiplying its area by a density factor derived from its
characteristics in the CTA images. The total Agatston score was obtained by
summing the scores of all the plaques. Participants were
divided into two categories according to their Agatston scores: a
non-calcification group (CAC = 0) and a calcification group (CAC
All statistical analyses were performed using relevant software, specifically SPSS version 26.0 (IBM Corp., Armonk, NY, USA) and R version 4.1.3 (R Foundation for Statistical Computing, Vienna, Austria). A two-tailed p-value of less than 0.05 was deemed statistically significant. Baseline characteristics were compared among groups with different Lp(a) levels using analysis of variance (ANOVA) for continuous variables and chi-square tests for categorical variables. Univariate logistic regression analysis was performed to evaluate the association between individual variables and CAC, calculating odds ratios (OR) and 95% confidence interval (CI). Multivariate logistic regression analysis was performed using three different models: Model 1 (unadjusted), Model 2 (adjusted for age and gender), and Model 3 (adjusted for age, gender, smoking status, hypertension, CKD, antihypertensive medications, systolic blood pressure, and eGFR) to assess the relationship between Lp(a) levels and CAC while controlling for potential confounding factors. Multivariable stratified analysis was performed to explore potential effect modifications of different subgroups, evaluating the relationship between Lp(a) and CAC across subgroups categorized by age, gender, and smoking status, hypertension, hyperlipidemia, stroke, and CKD. Adjustments were made for age, sex, smoking, hypertension, CKD, antihypertensive drugs, SBP, and eGFR, with interaction terms included in the models to test for statistical interaction. Receiver operating characteristic (ROC) curve analysis was utilized to assess the predictive capability of Lp(a) for CAC, determining the area under the curve (AUC) for Lp(a) by itself, the baseline model (which included age, sex, smoking status, hypertension, CKD, antihypertensive medications, SBP, and eGFR), and the combined model incorporating both Lp(a) and the baseline factors. Comparisons of AUCs determined the added predictive value of Lp(a). Finally, RCS analysis explored the possible nonlinear relationship between Log10Lp(a) levels and the risk of CAC. The spline function allowed flexible modeling of the relationship without assuming linearity. The overall significance of the association was assessed, reporting the p value for nonlinearity. A p value below 0.05 was considered to reflect a significant overall association, while a p value of less than 0.05 for nonlinearity indicated a significant nonlinear relationship.
Significant differences in baseline characteristics (Table 1) were found among
the groups categorized by varying Lp(a) levels. There were significant
differences among the three groups T1, T2, and T3 in hypertension, CKD, total
cholesterol, LDL-C, ApoA1, ApoB, eGFR, uric acid, and CAC (p
| Total patients | T1 | T2 | T3 | p value | ||
| N | 486 | 164 | 160 | 162 | ||
| Age, years | 72.66 |
72.45 |
72.42 |
73.12 |
0.562 | |
| Male, n (%) | 295 (60.70%) | 105 (64.00%) | 94 (58.80%) | 96 (59.30%) | 0.561 | |
| Smoking, n (%) | 174 (35.80%) | 65 (39.60%) | 53 (33.10%) | 56 (34.60%) | 0.437 | |
| Medical history, n (%) | ||||||
| Hypertension | 386 (79.40%) | 139 (84.80%) | 114 (71.30%) | 133 (82.10%) | 0.006 | |
| Hyperlipidemia | 213 (43.80%) | 71 (43.30%) | 64 (40.00%) | 78 (48.10%) | 0.333 | |
| Stroke | 143 (29.40%) | 48 (29.30%) | 46 (28.80%) | 49 (30.20%) | 0.956 | |
| CKD | 157 (32.30%) | 39 (23.80%) | 54 (33.80%) | 64 (39.50%) | 0.009 | |
| Antihypertensive drugs | 333 (68.50%) | 117 (71.30%) | 99 (61.90%) | 117 (72.20%) | 0.086 | |
| Lipid-lowering drugs | 11 (2.30%) | 5 (3.0%) | 4 (2.50%) | 2 (1.20%) | 0.529 | |
| BMI, kg/m2 | 24.66 |
24.47 |
25.01 |
24.51 |
0.302 | |
| SBP, mmHg | 134.63 |
133.57 |
135.72 |
134.64 |
0.711 | |
| DBP, mmHg | 75.80 |
76.51 |
75.89 |
74.99 |
0.604 | |
| Triglyceride, mmol/L | 1.41 (1.04, 2.04) | 1.42 (1.04, 2.09) | 1.43 (1.07, 1.97) | 1.41 (1.02, 2.11) | 0.762 | |
| Total cholesterol, mmol/L | 4.49 |
4.29 |
4.41 |
4.79 |
0.001 | |
| LDL-C, mmol/L | 2.70 |
2.48 |
2.67 |
2.96 |
||
| HDL-C, mmol/L | 1.15 |
1.17 |
1.13 |
1.15 |
0.474 | |
| ApoA1, g/L | 1.06 |
1.10 |
1.04 |
1.03 |
0.021 | |
| ApoB, g/L | 0.84 |
0.77 |
0.82 |
0.92 |
||
| eGFR, mL/min/1.73 m2 | 74.45 |
82.09 |
73.10 |
68.03 |
0.001 | |
| Uric acid, µmol/L | 362.16 |
348.38 |
355.16 |
383.04 |
0.020 | |
| FPG, mmol/L | 8.30 (7.13, 10.75) | 8.38 (7.33, 10.88) | 8.42 (7.20, 11.20) | 8.01 (7.02, 10.59) | 0.453 | |
| HbA1c, % | 7.80 |
7.70 |
7.83 |
7.86 |
0.758 | |
| CAC, n (%) | ||||||
| Yes | 266 (54.70%) | 81 (49.40%) | 75 (46.90%) | 110 (67.90%) | ||
| No | 220 (45.30%) | 83 (50.60%) | 85 (53.10%) | 52 (32.10%) | ||
CKD, chronic kidney disease; BMI, body mass index; SBP, systolic blood pressure; DBP, diastolic blood pressure; LDL-C, low-density lipoprotein cholesterol; HDL-C, high-density lipoprotein cholesterol; ApoA1, apolipoprotein A1; ApoB, apolipoprotein B; eGFR, estimated glomerular filtration rate; FPG, fasting plasma glucose; HbA1c, hemoglobin A1c; CAC, coronary artery calcification; Lp(a), lipoprotein(a).
Univariate logistic regression of Table 2 showed, age (odd
ratio (OR) = 1.144, 95% CI: 1.108–1.182, p
| OR (95% CI) | p value | |
| Age | 1.144 (1.108, 1.182) | |
| Male | 0.433 (0.296, 0.632) | |
| Smoking | 1.613 (1.110, 2.343) | 0.012 |
| Hypertension | 2.011 (1.286, 3.144) | 0.002 |
| Hyperlipidemia | 1.376 (0.958, 1.976) | 0.084 |
| Stroke | 1.116 (0.753, 1.653) | 0.585 |
| CKD | 1.656 (1.122, 2.444) | 0.011 |
| Antihypertensive drugs | 2.144 (1.453, 3.165) | |
| Lipid-lowering drugs | 3.817 (0.816, 17.855) | 0.089 |
| BMI | 0.960 (0.911, 1.011) | 0.123 |
| SBP | 1.010 (1.002, 1.018) | 0.017 |
| DBP | 0.996 (0.983, 1.009) | 0.508 |
| Triglyceride | 0.953 (0.818, 1.110) | 0.535 |
| Total cholesterol | 1.113 (0.964, 1.286) | 0.143 |
| LDL-C | 1.131 (0.931, 1.374) | 0.215 |
| HDL-C | 1.606 (0.842, 3.064) | 0.150 |
| ApoA1 | 1.283 (0.648, 2.541) | 0.474 |
| ApoB | 1.591 (0.806, 3.140) | 0.181 |
| Lp(a) | 1.002 (1.001, 1.002) | |
| eGFR | 0.992 (0.987, 0.998) | 0.006 |
| Uric acid | 1.001 (0.999, 1.003) | 0.205 |
| FPG | 0.970 (0.933, 1.008) | 0.123 |
| HbA1c | 0.987 (0.874, 1.116) | 0.837 |
CAC, coronary artery calcification; CKD, chronic kidney disease; BMI, body mass index; SBP, systolic blood pressure; DBP, diastolic blood pressure; LDL-C, low-density lipoprotein cholesterol; HDL-C, high-density lipoprotein cholesterol; ApoA1, apolipoprotein A1; ApoB, apolipoprotein B; Lp(a), lipoprotein(a); eGFR, estimated glomerular filtration rate; FPG, fasting plasma glucose; HbA1c, hemoglobin A1c; OR, odd ratio; CI, confidence interval.
In the multi-model analysis examining the relationship between Lp(a) and CAC
(Table 3), Model 1 (unadjusted), Model 2 (adjusted for age and gender), and Model
3 (adjusted for age, gender, smoking status, hypertension, CKD, antihypertensive
medications, SBP, and eGFR) all produced significant findings. Specifically, in
comparison to the T1 group, the T3 group exhibited an increased risk of CAC
across all models (Model 1: OR = 2.168, 95% CI: 1.382–3.400, p =
0.001; Model 2: OR = 2.164, 95% CI: 1.326–3.532, p = 0.002; Model 3:
OR = 2.210, 95% CI: 1.347–3.625, p = 0.002). In all models, each unit
rise in Lp(a) corresponded to a significant increase in the risk of CAC (Model 1:
OR = 1.002, 95% CI: 1.001–1.002, p
| Model 1 | Model 2 | Model 3 | ||||
| OR (95% CI) | p value | OR (95% CI) | p value | OR (95% CI) | p value | |
| Lp(a): T1 | Ref | - | Ref | - | Ref | - |
| Lp(a): T2 | 0.904 (0.585, 1.398) | 0.651 | 0.849 (0.523, 1.379) | 0.509 | 0.908 (0.556, 1.483) | 0.699 |
| Lp(a): T3 | 2.168 (1.382, 3.400) | 0.001 | 2.164 (1.326, 3.532) | 0.002 | 2.210 (1.347, 3.625) | 0.002 |
| p for trend | 0.001 | |||||
| Lp(a) (per 1-unit) | 1.002 (1.001, 1.002) | 1.002 (1.001, 1.002) | 0.001 | 1.002 (1.001, 1.003) | 0.001 | |
| Log10Lp(a) | 2.408 (1.524, 3.806) | 2.239 (1.352, 3.705) | 0.002 | 2.344 (1.405, 3.911) | 0.001 | |
| Lp(a) (per 1 SD) | 1.472 (1.200, 1.804) | 1.466 (1.177, 1.826) | 0.001 | 1.483 (1.186, 1.854) | 0.001 | |
Model 1: unadjusted; Model 2: adjusted for age and sex; Model 3: adjusted for age, sex, smoking, hypertension, CKD, antihypertensive drugs, systolic blood pressure, and eGFR. Lp(a), lipoprotein(a); CAC, coronary artery calcification; CKD, chronic kidney disease; eGFR, estimated glomerular filtration rate; OR, odd ratio; CI, confidence interval; Ref, reference.
In the multivariable stratified analysis (Table 4),
adjustments were made for age, sex, smoking status,
hypertension, CKD, antihypertensive drugs, SBP, and eGFR. The association between
Lp(a) and CAC showed significant differences across multiple subgroups.
Specifically, the T3 group exhibited significantly higher CAC risk in subgroups
including age
| Lp(a): T1 | Lp(a): T2 | Lp(a): T3 | p trend | p interaction | ||
| OR (95% CI) | OR (95% CI) | OR (95% CI) | ||||
| Age | 0.122 | |||||
| Ref | 1.006 (0.342, 2.957) | 4.513 (1.653, 12.319)** | 0.004 | |||
| Ref | 0.895 (0.473, 1.696) | 1.366 (0.716, 2.605) | 0.413 | |||
| Sex | 0.872 | |||||
| Male | Ref | 0.731 (0.380, 1.406) | 2.023 (1.071, 3.825)* | 0.008 | ||
| Female | Ref | 1.056 (0.490, 2.274) | 2.357 (1.019, 5.451)* | 0.080 | ||
| Smoking | 0.245 | |||||
| Yes | Ref | 1.047 (0.383, 2.859) | 3.044 (1.185, 7.821)* | 0.033 | ||
| No | Ref | 0.774 (0.428, 1.400) | 1.834 (0.996, 3.380) | 0.016 | ||
| Hypertension | 0.195 | |||||
| Yes | Ref | 0.763 (0.437, 1.333) | 1.811 (1.054, 3.114)* | 0.009 | ||
| No | Ref | 1.984 (0.573, 6.867) | 6.769 (1.768, 25.918)** | 0.012 | ||
| Hyperlipidemia | 0.150 | |||||
| Yes | Ref | 1.250 (0.565, 2.765) | 2.185 (1.004, 4.755)* | 0.126 | ||
| No | Ref | 0.792 (0.418, 1.503) | 2.209 (1.133, 4.309)* | 0.008 | ||
| Stroke | 0.660 | |||||
| Yes | Ref | 0.676 (0.272, 1.682) | 1.560 (0.642, 3.789) | 0.185 | ||
| No | Ref | 1.023 (0.560, 1.871) | 2.625 (1.421, 4.849)** | 0.002 | ||
| CKD | 0.469 | |||||
| Yes | Ref | 1.374 (0.511, 3.691) | 2.588 (0.985, 6.798) | 0.123 | ||
| No | Ref | 0.675 (0.378, 1.207) | 2.009 (1.111, 3.633)* | 0.002 | ||
*p
Fig. 1 showed the ROC curve analysis results of Lp(a) in
predicting CAC. The baseline model consisted of all variables
from Table 3 (age, sex, smoking, hypertension, CKD, antihypertensive drugs, SBP,
and eGFR). The results indicated that the AUC for predicting CAC using Lp(a)
alone was 0.601 (95% CI: 0.551–0.651, p
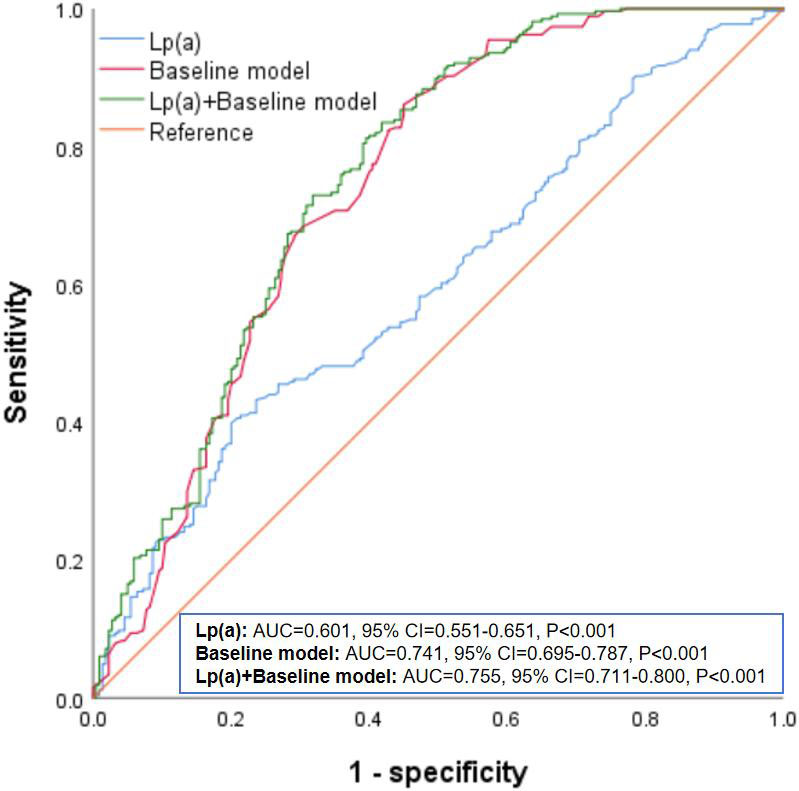 Fig. 1.
ROC analysis of Lp(a) in predicting CAC. Lp(a), lipoprotein(a); CAC, coronary artery calcification; ROC, receiver operating characteristic; AUC, area under the curve; CI, confidence interval.
Fig. 2 presented the RCS plot illustrating the nonlinear relationship between Lp(a) and CAC. The findings revealed a significant link between Log10Lp(a) and CAC risk (p = 0.002), while the p-value for nonlinearity was 0.115, indicating it was not statistically significant. This implied that as the Log10Lp(a) increased, the risk of CAC also significantly increased, and this relationship was approximately linear within the observed range.
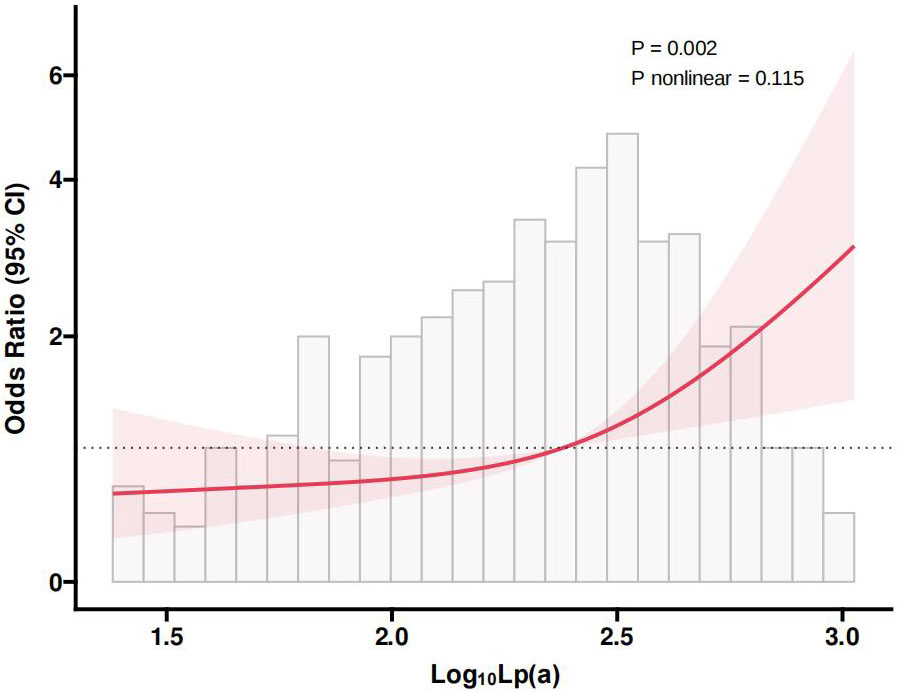 Fig. 2.
RCS plot of the nonlinear association between Lp(a) and CAC. Lp(a), lipoprotein(a); CAC, coronary artery calcification; RCS, restricted cubic spline; CI, confidence interval.
This study, conducted a cross-sectional analysis of 486 elderly diabetic patients, found a significant positive association between Lp(a) levels and the risk of CAC. The group with the highest Lp(a) levels (T3) demonstrated a notably greater prevalence of CAC, a result supported by both univariate and multivariate logistic regression analyses. Additionally, the multivariate logistic regression confirmed that elevated Lp(a) levels correlated with a higher risk of CAC, with each unit increase in Lp(a) significantly raising this risk. Stratified analysis indicated that the impact of Lp(a) levels on CAC risk was consistent across different subgroups. The ROC curve analysis demonstrated that adding Lp(a) levels to the baseline model improved the AUC from 0.741 to 0.755, indicating enhanced predictive accuracy for CAC. The RCS analysis revealed a notable linear association between Log10Lp(a) and the risk of CAC.
Currently, while numerous studies have identified a link between Lp(a) and CVD,
including its severity, adverse outcomes, and mortality, the connection between
Lp(a) and CAC remains inconsistent [24, 25, 26, 27, 28]. Consistent with our study, certain
studies have indicated a positive association between increased Lp(a) levels and
CAC. For instance, Ong et al. [29] discovered that increased plasma
Lp(a) levels were significantly linked to a rise in CAC volume, particularly in
those with elevated inflammatory and coagulation markers, which suggests that
Lp(a) could act as a possible biomarker for the progression of CAC volume,
highlighting its importance in cardiovascular disease risk assessment.
Additionally, a substantial prospective cohort study from the Multi-Ethnic Study
of Atherosclerosis (MESA) found that increased Lp(a) levels were linked to a
faster progression of CAC [30]. A meta-analysis involving 23,105 asymptomatic
patients conducted by Martignoni et al. [16] discovered a significant
link between increased Lp(a) levels and an elevated risk of CAC, particularly
with a CAC
The mechanisms by which Lp(a) influences atherosclerosis and CAC are multifaceted. First, the structure of Lp(a) contains components similar to plasminogen, allowing it to compete for binding sites in the fibrinolytic system, thereby inhibiting fibrinolysis and increasing the risk of thrombosis. In this manner, Lp(a) can enhance the instability of atherosclerotic plaques and promote the development of CAC [15]. Second, oxidized LDL may promote the proliferation and migration of smooth muscle cells, further enhancing arterial wall calcification. The oxidized LDL component within Lp(a) can activate smooth muscle cells, transforming them into osteoblast-like cells, thereby depositing calcium salts in the arterial wall and promoting CAC formation [14]. Third, Lp(a) possesses pro-inflammatory properties, activating inflammatory cells and releasing pro-inflammatory cytokines, which increase inflammation in the arterial wall. This inflammatory response not only leads to the instability of atherosclerotic plaques, but also promotes the calcification process, thereby increasing the risk of CAC [36]. Fourth, the pro-thrombotic nature of Lp(a) increases the risk of thrombosis within atherosclerotic plaques, further enhancing plaque instability and calcification. By increasing the frequency of thrombus formation within plaques, Lp(a) can accelerate the development of CAC [37].
This study has several limitations. Firstly, being a cross-sectional study, it does not allow for the determination of a causal relationship between Lp(a) levels and CAC. Longitudinal studies in the future are necessary to confirm this association. Secondly, the participants were exclusively elderly diabetic patients, which may limit the generalizability of the findings to other groups, especially non-diabetic or younger individuals. Research in more diverse populations is needed to verify the generalizability of our findings. Additionally, although multiple confounding factors were adjusted for in the statistical analysis, unmeasured confounders may still influence the results. For instance, genetic polymorphisms and lifestyle factors might affect Lp(a) levels and CAC risk. Furthermore, the sample size and regional scope of this study may limit the generalizability of the results. Verification in larger-scale studies and in different regions is necessary to confirm the reliability and broad applicability of these research findings. Finally, one of the limitations of this study was that it did not explore the “zero calcium phenomenon” in CAC and the potential progression of calcification in the future. Previous research has shown that the prevalence of a zero CAC score in the Asian population is 18.2%, and the risk of subclinical CAC progression may increase after five years [38]. Furthermore, differences in subclinical CAC progression between genders were not addressed in this study. Therefore, future research should focus on the zero calcium phenomenon and the long-term progression of CAC to provide a more comprehensive basis for cardiovascular risk assessment in the Asian population.
In summary, this research demonstrated a significant relationship between elevated Lp(a) levels and a greater risk of CAC among older diabetic patients. Incorporating Lp(a) levels with traditional risk factors improves the predictive accuracy for CAC. Understanding the role of Lp(a) in the development of CAC can aid in more precise risk stratification and individualized treatment strategies, ultimately improving cardiovascular health and overall prognosis in this high risk population. Future studies should aim to be large-scale, prospective research projects to validate the causal link between Lp(a) and CAC, as well as to explore the specific mechanisms through which Lp(a) contributes to CAC. Additionally, exploring interventions to lower Lp(a) levels and their effects on CAC progression and cardiovascular events is crucial. Investigating other potential biomarkers and imaging techniques will also help to enhance the accuracy of CAC risk assessment, providing more effective clinical tools to manage these high risk populations.
The raw data used in this study is available from the corresponding author upon reasonable request.
LQ—conceptualization, methodology, software, data curation, writing-original draft. HQ—conceptualization, funding acquisition, project administration, supervision, writing-review & editing. Both authors read and approved the final manuscript. Both authors have participated sufficiently in the work and agreed to be accountable for all aspects of the work.
The protocol was in accordance with the Declaration of Helsinki and approved by the ethics committee of Kongjiang Hospital of Yangpu District (LL-2020-KY-25), and informed consent was obtained from all patients.
Not applicable.
This research received no external funding.
The authors declare no conflict of interest.
References
Publisher’s Note: IMR Press stays neutral with regard to jurisdictional claims in published maps and institutional affiliations.