


 , Hong-Xia Yang 1, Jin-Wen Wang 2, Xian-Tao Song 1, Hui-Juan Zuo 2,*
1 Department of Cardiology, Beijing Anzhen Hospital, Capital Medical University, 100029 Beijing, China
2 Department of Community Health Research, Beijing Institute of Heart Lung and Blood Vessel Diseases, Beijing Anzhen Hospital, Capital Medical University, 100029 Beijing, China
†These authors contributed equally.
Abstract
Lowering low-density lipoprotein cholesterol (LDL-C) is a well-established strategy for the secondary prevention of coronary heart disease (CHD). However, the effectiveness of specific LDL-C parameters in predicting myocardial infarction (MI) recurrence in real-world settings remains inadequately explored. This study aims to examine the relationship between MI recurrence and various LDL-C parameters in young CHD patients.
This retrospective cohort study involved 1013 patients aged 18–44 at the time of initial CHD diagnosis, collected from the cardiology department clinics at Beijing Anzhen Hospital between October 2022 and October 2023. LDL-C levels were assessed at the time of CHD diagnosis and at the final follow-up. The primary outcome was MI events, analyzed using survival analysis and logistic regression models to determine associations with LDL-C parameters.
The study included 1013 patients (mean age: 38.5 ± 3.9 years; 94.7% men), with a median follow-up time of 1.7 years. Initially, 13.6% had LDL-C levels <1.8 mmol/L, which increased to 37.8% by the study’s end. During follow-up, 96 patients (9.5%) experienced MI. While LDL-C <1.8 mmol/L at baseline showed a slightly lower cumulative incidence of MI than LDL-C ≥1.8 mmol/L, the difference was not statistically significant (log-rank p = 0.335). Reductions in LDL-C levels of ≥50% and the patterns of change did not correlate with decreased MI risk. However, LDL-C <1.4 mmol/L at the final measurement was associated with a reduced MI risk (adjusted odds ratio [OR]: 0.57, 95% confidence interval [CI]: 0.33–0.98) compared with LDL-C ≥2.6 mmol/L.
This study suggests that the most important parameter related to LDL-C for predicting the recurrence of MI in young patients with a history of CHD is the ideal target LDL-C level. Lowering LDL-C to <1.4 mmol/L could potentially reduce MI risk, regardless of baseline LDL-C levels.
Keywords
- coronary heart disease
- LDL cholesterol
- myocardial infarction
- secondary prevention
Cardiovascular disease (CVD) is increasingly prevalent among younger individuals (aged 15–44), with the absolute number of CVD incidents and related deaths rising by 45.5% and 21.6%, respectively, from 1990 to 2019. Coronary heart disease (CHD) remains the leading cause of disability-adjusted life years (DALY) burden [1]. Previous studies have shown that individuals with a history of CHD are at an elevated risk for recurrent CHD events or cardiovascular-related hospitalizations across all age groups [2, 3, 4]. However, data on recurrent events in younger patients are scarce [5].
Lowering low-density lipoprotein cholesterol (LDL-C) is a crucial measure for
both primary and secondary CHD prevention. Current evidence suggests that
reducing LDL-C by
This real-world cohort study aimed to identify the LDL-C parameters that are most effective in predicting myocardial infarction (MI) recurrence in young patients with a history of CHD. We assessed the relationship between baseline LDL-C levels, LDL-C control at the end of the study, extent of LDL-C reduction, and patterns of LDL-C changes with subsequent MI events in patients aged 18–44 years at the time of their initial hospitalization for CHD.
This retrospective cohort study involved 1013 patients aged 18–44 years who
were hospitalized for their first occurrence of CHD. Data were collected from the
cardiology department at Beijing Anzhen Hospital between October 2022 and October
2023. Patients with secondary diagnoses of prior CHD, previous percutaneous
coronary intervention (PCI), coronary artery bypass grafting (CABG), post-acute
myocardial infarction (AMI) syndrome, chronic ischemic heart disease, heart
failure (before or after CHD diagnosis), arteritis, congenital heart disease, and
cancer, as well as those without specific information at the time of their first
CHD diagnosis and those with a history of CHD
The study protocol was reviewed and approved by the Ethics Committee of Beijing Anzhen Hospital. Written informed consent was obtained from all participants prior to their inclusion in the study.
Baseline information was collected from the hospital’s electronic medical
records and other medical documents by trained abstractors. Collected demographic
information included sex and age, while exposure to risk factors was assessed,
including obesity, medical history of hypertension and diabetes, LDL-C levels,
and smoking habits. Data on secondary prevention therapies, such as the use of
aspirin,
Hypertension and diabetes were defined based on documented histories in medical
records. Body mass index (BMI) was calculated as weight (kg) divided by the
square of height (m2), with obesity defined as BMI
The primary endpoint was secondary MI events. MI was defined according to established criteria [19], which included both ST-segment elevation MI (STEMI) and non-ST-segment elevation MI (NSTEMI), with information obtained from relevant hospital records.
Categorical variables were expressed as counts and percentages, with differences
in groups compared using chi-square tests or Fisher’s exact tests when any
expected cell count was
Our study included 1013 patients, with a mean age of 38.5
At baseline, the prevalence rates of hypertension (48.0% vs. 55.0%) and
diabetes (19.6% vs. 26.7%) were lower than those at the end of the study.
Conversely, the prevalence rates of smoking (75.1% vs. 36.2%) and obesity
(37.9% vs. 34.2%) were higher at baseline. Among the patients who smoked at
baseline, 51.8% (394 of 761) quit smoking during the study period. Significant
improvements were observed in the mean levels of HbA1c, diastolic blood pressure
(DBP), TC, LDL-C, HDL-C, non-HDL-C, and TG at the end of the study (all
p
| Parameters | Baseline | Study end | p value | |
| Risk factors | ||||
| Hypertension, n (%) | 486 (48.0) | 557 (55.0) | 0.002 | |
| Diabetes, n (%) | 199 (19.6) | 270 (26.7) | ||
| BMI |
384 (37.9) | 346 (34.2) | 0.079 | |
| Current smoker, n (%) | 761 (75.1) | 367 (36.2) | ||
| HbA1c (%) | 6.2 |
6.1 |
0.011 | |
| SBP (mmHg, |
125 |
124 |
0.154 | |
| DBP (mmHg, |
79 |
78 |
0.004 | |
| TC (mmol/L, |
4.53 |
3.90 |
||
| LDL-C (mmol/L, |
2.83 |
2.28 |
||
| HDL-C (mmol/L, |
0.90 |
0.94 |
||
| Non-HDL-C (mmol/L, |
2.59 |
1.98 |
||
| TG (mmol/L, median [IQR]) | 1.93 (1.37, 2.81) | 1.66 (1.15, 2.40) | ||
| Drug use for secondary prevention | ||||
| Aspirin, n (%) | 942 (93.0) | 964 (95.2) | 0.038 | |
| Beta receptor blocker, n (%) | 772 (76.2) | 855 (84.4) | ||
| ARB/ACEI, n (%) | 604 (59.6) | 735 (72.6) | ||
| Statin, n (%) | 895 (88.4) | 924 (91.2) | 0.033 | |
| Ezetimibe, n (%) | 86 (8.5) | 367 (36.2) | ||
| PCSK9 inhibitor, n (%) | 0 | 38 (3.8) | ||
ARB/ACEI, angiotensin receptor blocker/angiotensin-converting enzyme inhibitor; BMI, body mass index; DBP, diastolic blood pressure; HbA1c, hemoglobin A1c; HDL-C, high-density lipoprotein cholesterol; IQR, interquartile range; LDL-C, low-density lipoprotein cholesterol; PCSK9, proprotein convertase subtilisin/kexin type 9; SBP, systolic blood pressure; TC, total cholesterol; TG, triglyceride.
Lipid levels, including LDL-C, non-HDL-C, HDL-C, and TG, were assessed at
various time points following discharge (Table 2). Compared with baseline, all
lipid indicators showed significant improvements. The percentage of patients
achieving ideal targets for LDL-C, non-HDL-C, and TG peaked in the first year
post-discharge, followed by a subsequent decline (p
| Lipid parameters | Baseline (n = 1013) | Years from discharge | |||||
| 1–3 (n = 349) | p value | ||||||
| LDL-C group (mmol/L) | 5.973 | 0.016 | |||||
| 47 (4.6) | 81 (17.2) | 43 (12.3) | 24 (12.5) | ||||
| 1.4–1.79 | 91 (9.0) | 97 (20.6) | 69 (19.8) | 31 (16.1) | |||
| 1.8–2.59 | 341 (33.7) | 181 (38.3) | 122 (35.0) | 66 (34.4) | |||
| 534 (52.7) | 113 (23.9) | 115 (33.0) | 71 (37.0) | ||||
| HDL-C group (mmol/L) | 1.888 | 0.169 | |||||
| 747 (73.7) | 302 (64.0) | 229 (65.6) | 134 (69.8) | ||||
| 266 (26.3) | 170 (36.0) | 120 (34.4) | 58 (30.2) | ||||
| Non-HDL-C group (mmol/L) | 27.440 | ||||||
| 199 (19.6) | 333 (49.4) | 146 (41.8) | 67 (34.9) | ||||
| 2.6–3.39 | 311 (30.7) | 146 (30.9) | 92 (26.4) | 57 (29.7) | |||
| 3.4–4.09 | 210 (20.7) | 51 (10.8) | 48 (13.8) | 24 (12.5) | |||
| 293 (28.9) | 42 (8.9) | 63 (18.1) | 44 (22.9) | ||||
| TG group (mmol/L) | 20.374 | ||||||
| 409 (40.4) | 281 (59.5) | 165 (47.3) | 81 (42.2) | ||||
| 1.7–2.29 | 225 (22.2) | 86 (18.2) | 75 (21.5) | 44 (22.9) | |||
| 379 (37.4) | 105 (22.2) | 109 (31.2) | 67 (34.9) | ||||
HDL-C, high-density lipoprotein cholesterol; LDL-C, low-density lipoprotein cholesterol; TG, triglyceride.
At the study’s outset, 138 of 1013 individuals achieved the ideal LDL-C target
of
We calculated the difference between baseline LDL-C and the endpoint levels,
revealing the distribution of LDL-C reductions: 26.9% of patients experienced an
increase in LDL-C (reduction
During a median follow-up period of 1.7 years (interquartile range: 1.0–3.0
years), 96 new cases of MI were identified. The crude rates of MI events over
time were as follows: 1-year MI rate: 2.1%, 3-year rate: 5.8%, 5-year rate:
8.2%, and
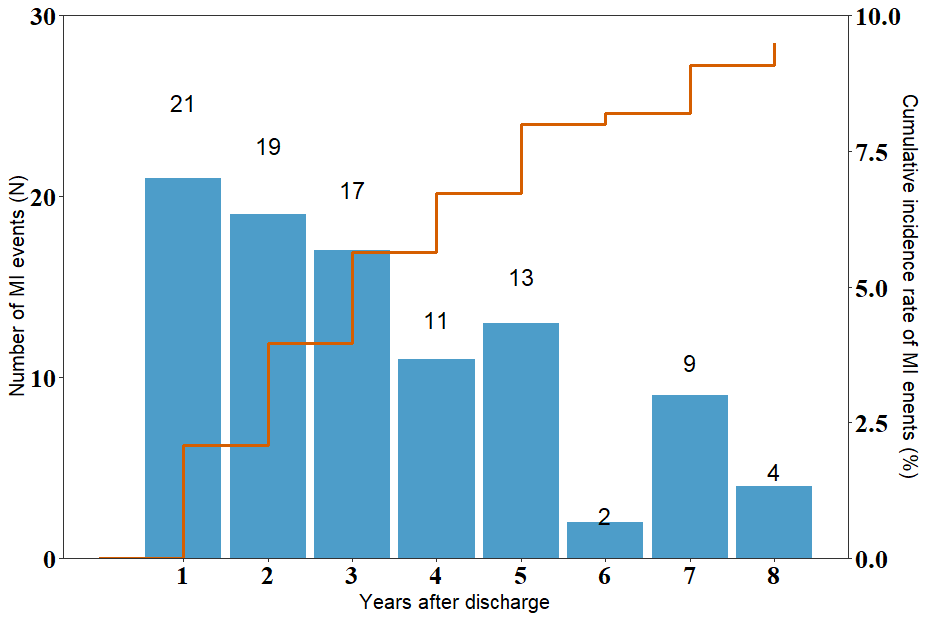 Fig. 1.
Distribution of myocardial infarction (MI) events during a median follow-up period of 1.7 years.
Kaplan-Meier survival analysis curves (Fig. 2) illustrated the cumulative
incidence of MI events in two groups, based on a baseline LDL-C threshold of 1.8
mmol/L. The group with LDL-C levels
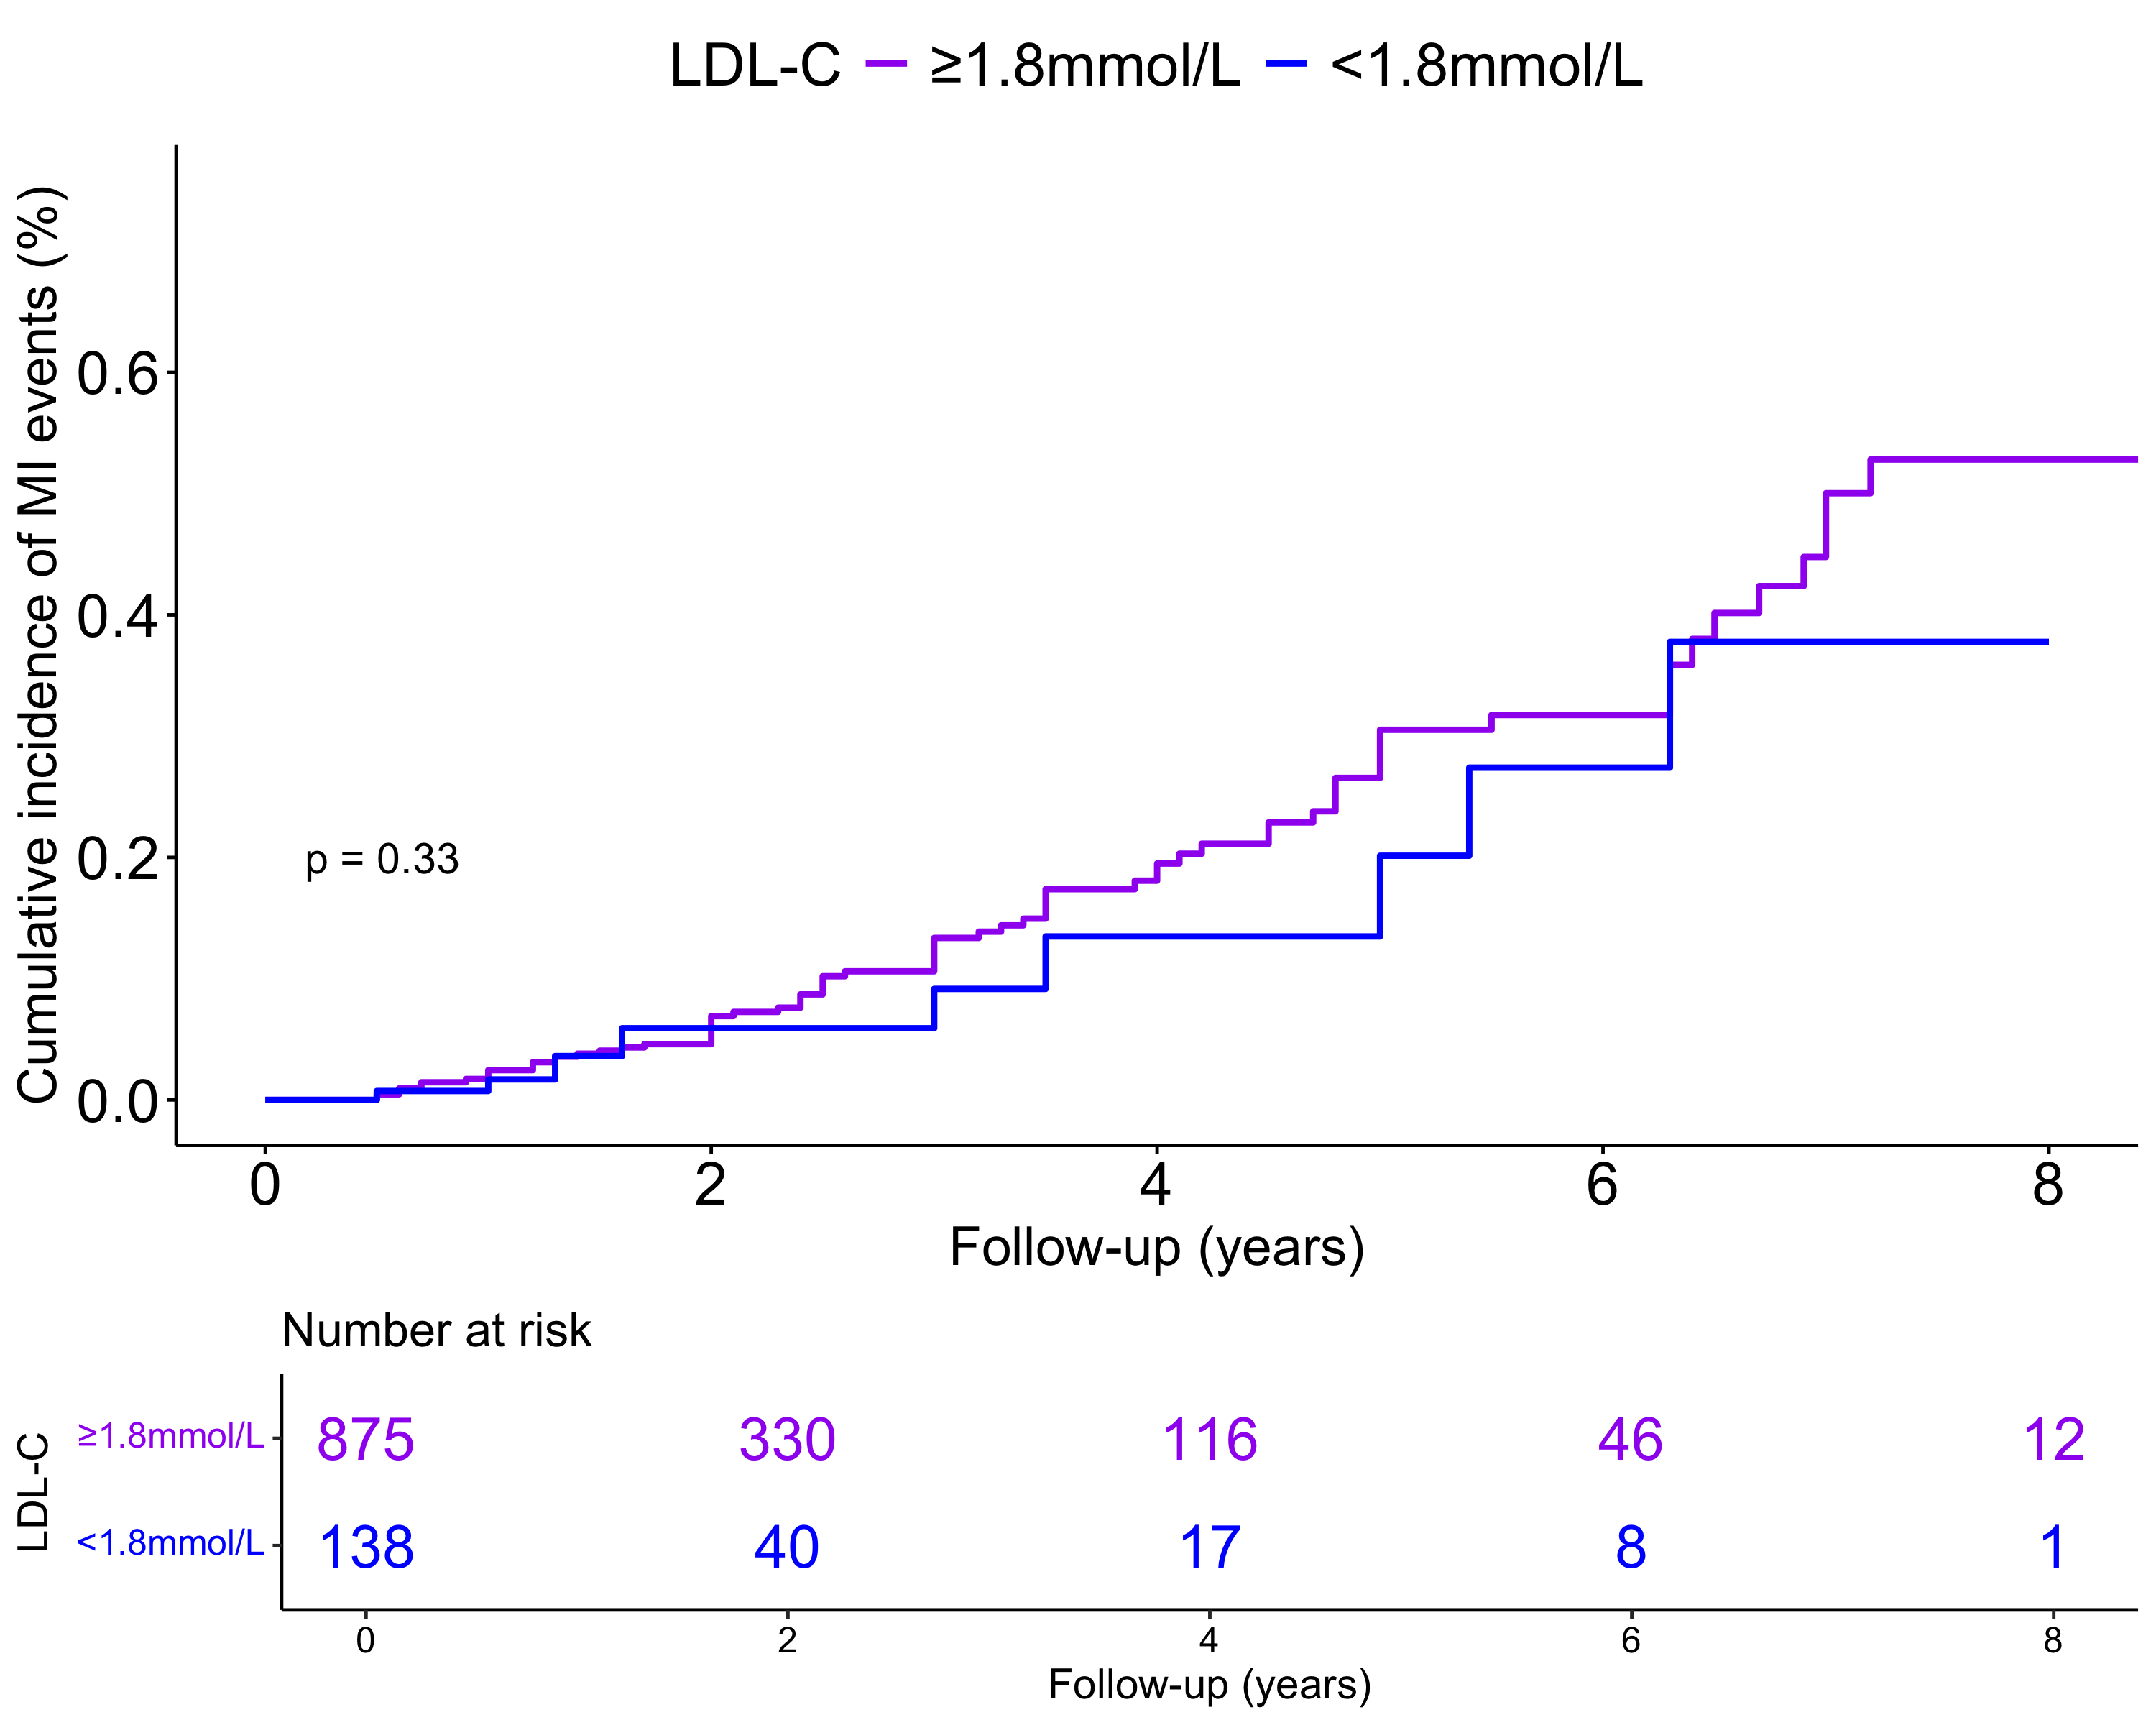 Fig. 2.
Kaplan-Meier survival analysis curves for myocardial infarction (MI) events. LDL-C, low-density lipoprotein cholesterol.
Univariate Cox regression analysis indicated no significant association between
baseline LDL-C levels and the risk of MI occurrence (HR = 0.99, 95% CI:
0.84–1.17). After adjusting for age, sex, history of AMI, three-vessel disease,
and treatment measures (Model 2), as well as for hypertension, diabetes, smoking
status, HDL-C, TG, and BMI (Model 3), LDL-C levels remained insignificantly
associated with MI risk (all p
| Variable | Model 1 | Model 2 | Model 3 | |||||||
| HR | 95% CI | p value | HR | 95% CI | p value | HR | 95% CI | p value | ||
| Continuous LDL-C level | 0.99 | 0.84–1.17 | 0.898 | 0.98 | 0.85–1.13 | 0.791 | 0.96 | 0.83–1.12 | 0.608 | |
| LDL-C group | ||||||||||
| ref | ref | ref | ||||||||
| 0.72 | 0.35–1.42 | 0.340 | 0.63 | 0.36–1.09 | 0.100 | 0.64 | 0.36–1.12 | 0.119 | ||
Model 1: unadjusted; Model 2: adjusted for age, sex, history of AMI, three-vessel disease, and treatment measures; Model 3: adjusted for age, sex, history of AMI, three-vessel disease, treatment measures, hypertension, diabetes, current smoking, HDL-C, TG, and BMI at baseline. AMI, acute myocardial infarction; BMI, body mass index; CI, confidence interval; HDL-C, high-density lipoprotein cholesterol; HR, hazard ratio; LDL-C, low-density lipoprotein cholesterol; MI, myocardial infarction; TG, triglyceride.
We analyzed the relationship between the pattern of LDL-C changes and the risk of MI events, using LDL-C-uncontrolled as the reference group. Both univariate and multivariate analyses failed to demonstrate a significant correlation between the trajectory of LDL-C changes (including LDL-C-worsen, LDL-C-improved, and LDL-C-controlled) and the occurrence of MI events (Table 4).
| Changes in LDL-C | Model 1 | Model 2 | Model 3 | ||||||||
| OR | 95% CI | p value | OR | 95% CI | p value | OR | 95% CI | p value | |||
| Pattern of LDL-C changes | |||||||||||
| LDL-C- uncontrolled | 1 | 1 | 1 | ||||||||
| LDL-C-worsen | 0.22 | 0.03–1.61 | 0.135 | 0.26 | 0.03–1.94 | 0.188 | 0.31 | 0.04–2.36 | 0.260 | ||
| LDL-C-improved | 0.69 | 0.41–1.18 | 0.172 | 0.80 | 0.46–1.39 | 0.429 | 0.83 | 0.47–1.44 | 0.497 | ||
| LDL-C-controlled | 0.73 | 0.34–1.56 | 0.411 | 0.84 | 0.38–1.87 | 0.672 | 0.93 | 0.41–2.09 | 0.853 | ||
| Degree of LDL-C lowing (mmol/L) | |||||||||||
| Continuous LDL-C lowing | 0.996 | 0.99–1.00 | 0.302 | 0.996 | 0.99–1.00 | 0.303 | 0.98 | 0.99–1.00 | 0.247 | ||
| Group | |||||||||||
| By 0–29.9% | 1 | 1 | 1 | ||||||||
| By 30–49.9% | 1.03 | 0.60–1.79 | 0.907 | 1.02 | 0.58–1.80 | 0.944 | 1.12 | 0.63–1.99 | 0.691 | ||
| By |
0.65 | 0.23–1.58 | 0.342 | 0.62 | 0.25–1.55 | 0.307 | 0.63 | 0.25–1.59 | 0.325 | ||
| By |
1.22 | 0.73–2.02 | 0.452 | 1.15 | 0.68–1.94 | 0.616 | 1.26 | 0.74–2.16 | 0.402 | ||
| Last LDL-C measurement level (mmol/L) | |||||||||||
| Continuous LDL-C level | 1.39 | 1.15–1.68 | 0.001 | 1.32 | 1.08–1.61 | 0.006 | 1.24 | 1.02–1.52 | 0.035 | ||
| Group | |||||||||||
| 1 | 1 | 1 | |||||||||
| 1.8–2.59 | 0.43 | 0.21–0.95 | 0.022 | 0.53 | 0.25–1.12 | 0.097 | 0.55 | 0.26–1.17 | 0.161 | ||
| 1.4–1.79 | 0.56 | 0.31–1.02 | 0.057 | 0.71 | 0.39–1.32 | 0.283 | 0.78 | 0.41–1.47 | 0.437 | ||
| 0.45 | 0.27–0.75 | 0.002 | 0.53 | 0.32–0.92 | 0.023 | 0.57 | 0.33–0.98 | 0.043 | |||
Model 1: Unadjusted; Model 2: Adjusted for sex and age, history of MI, multi-vessel disease, treatment measures, and duration of CHD; Model 3: adjusted for sex and age, history of MI, multi-vessel disease, treatment measures, and duration of CHD, smoking status, BMI, hypertension, diabetes, TG, HDL-C at the end of the study. BMI, body mass index; CHD, coronary heart disease; CI, confidence interval; HDL-C, high-density lipoprotein cholesterol; LDL-C, low-density lipoprotein cholesterol; MI, myocardial infarction; OR, odds ratio; TG, triglyceride.
We also compared the risk of MI based on the degree of LDL-C level reduction,
using a reduction of 0–29.9% as the reference group. The findings indicated
that reductions of 30–49.9% or
Additionally, we examined the association between LDL-C levels at the last
recorded measurement and MI risk, with LDL-C
Lowering LDL-C is a critical strategy for the secondary prevention of CHD. This
study aimed to assess the association between various LDL-C parameters and MI
incidence among young patients with a history of CHD. Our findings revealed no
correlation between baseline LDL-C levels, extent of LDL-C reduction, or pattern
of LDL-C changes and the risk of secondary MI events. However, individuals with
LDL-C levels
Previous studies have shown that elevated LDL-C levels at a young age may have a
stronger association with CHD than lower LDL-C levels in adulthood [16, 17, 18]. This
emphasizes the importance of baseline LDL-C levels before the onset of CHD.
Moreover, increasing evidence suggests that reducing and maintaining LDL-C
It is important to note that baseline LDL-C status does not represent time-varying exposure. During the follow-up period, LDL-C levels can be modified through interventions, such as LDL-C-lowering therapies and lifestyle changes [7]. Therefore, investigating the associations between dynamic changes in LDL-C status and the risks of secondary CHD events is essential [8]. Previous studies have examined the impact of dynamic changes in metabolic syndrome on CVD outcomes, finding that these changes can significantly affect long-term prognosis [20, 21]. In our study, participants were categorized into four groups based on LDL-C changes; however, the results indicated that these dynamic changes did not significantly alter the risks of MI events.
Clinical practice guidelines recommend aggressive LDL-C-lowering strategies with
optimal targets, such as
Despite improvements in guideline-recommended secondary prevention treatments,
approximately 30% of patients with CHD achieved target reductions in LDL-C
levels [2, 8, 23, 24, 25]. In China, only 13% of patients with very-high-risk ASCVD
aged
This study has some potential limitations. First, it was conducted at a single center with a relatively small sample size, which may increase the risk of sampling bias and limit the generalizability of the findings. Second, the study included only patients who could provide hospital medical records for their initial CHD diagnosis and who consented to participate. This may introduce selection bias, potentially rendering the findings unrepresentative of all young patients with CHD. Third, we did not consider the type and dosage of statins and other medications used for LDL-C reduction, which limits our ability to assess the impact of different lipid-lowering strategies. Fourth, we did not collect data on lifestyle changes, such as dietary modifications and physical activity after discharge. These lifestyle factors can significantly influence cardiovascular outcomes and may serve as confounding variables when evaluating the impact of LDL-C-related indicators on MI. Finally, larger observational studies are needed to enhance the clinical implications of our findings.
In conclusion, this study suggests that the most important parameter related to
LDL-C for predicting the recurrence of MI in young patients with a history of CHD
is focusing on the ideal target LDL-C level. When LDL-C levels are reduced to
sufficiently low levels, such as
The raw dataset analyzed in the current study are available from the corresponding author on reasonable request.
HJZ and XTS conceived and designed the study. FX, HXY, JWW and HRX collected and analyzed data. HJZ contributed to interpreted results. FX and HRX wrote the manuscript. HJZ, XTS, HXY and JWW revised the manuscript. All authors read and approved the final manuscript. All authors have participated sufficiently in the work and agreed to be accountable for all aspects of the work.
The study was carried out in accordance with the guidelines of the Declaration of Helsinki and approved by the Ethics Committee of Beijing Anzhen Hospital, Capital Medical University (KS2022070). Written consent was obtained from all participants.
The authors thank all postgraduates (Zhao Ma, Xueyao Yang, Xin Zhao) of the department of cardiology, Beijing Anzhen Hospital for their extracting data from the electronic records and other medical documents.
Capital funds for health improvement and research, funded by Beijing Municipal Health Commission (No. 2022-2G-1055).
The authors declare no conflict interest.
References
Publisher’s Note: IMR Press stays neutral with regard to jurisdictional claims in published maps and institutional affiliations.