


 , Shaoyong Chen 1, Junke Luo 2, Pengfeng Xiong 1, Zhenyun Nie 1, Lei Huang 1, Yao Wang 1, Zhen Lei 3, Lihui Zhang 4,5,*
 , Jing Wang 6,*
1 Department of Cardiology, Fengcheng People’s Hospital, The Affiliated Fengcheng Hospital of Yichun University, 331100 Fengcheng, Jiangxi, China
2 Department of Cardiac Intensive Care Unit, Fengcheng People’s Hospital, The Affiliated Fengcheng Hospital of Yichun University, 331100 Fengcheng, Jiangxi, China
3 Department of Thoracic Surgery, Fengcheng People’s Hospital, The Affiliated Fengcheng Hospital of Yichun University, 331100 Fengcheng, Jiangxi, China
4 Health Care Bureau, Health Commission of Shanxi Province, 030032 Taiyuan, Shanxi, China
5 Department of Cardiology, The Third Clinical Medical College of Shanxi Medical University, 030032 Taiyuan, Shanxi, China
6 Prevention & Healthcare Department, Shanxi Bethune Hospital, Shanxi Academy of Medical Sciences, Tongji Shanxi Hospital, Third Hospital of Shanxi Medical University, 030032 Taiyuan, Shanxi, China
Abstract
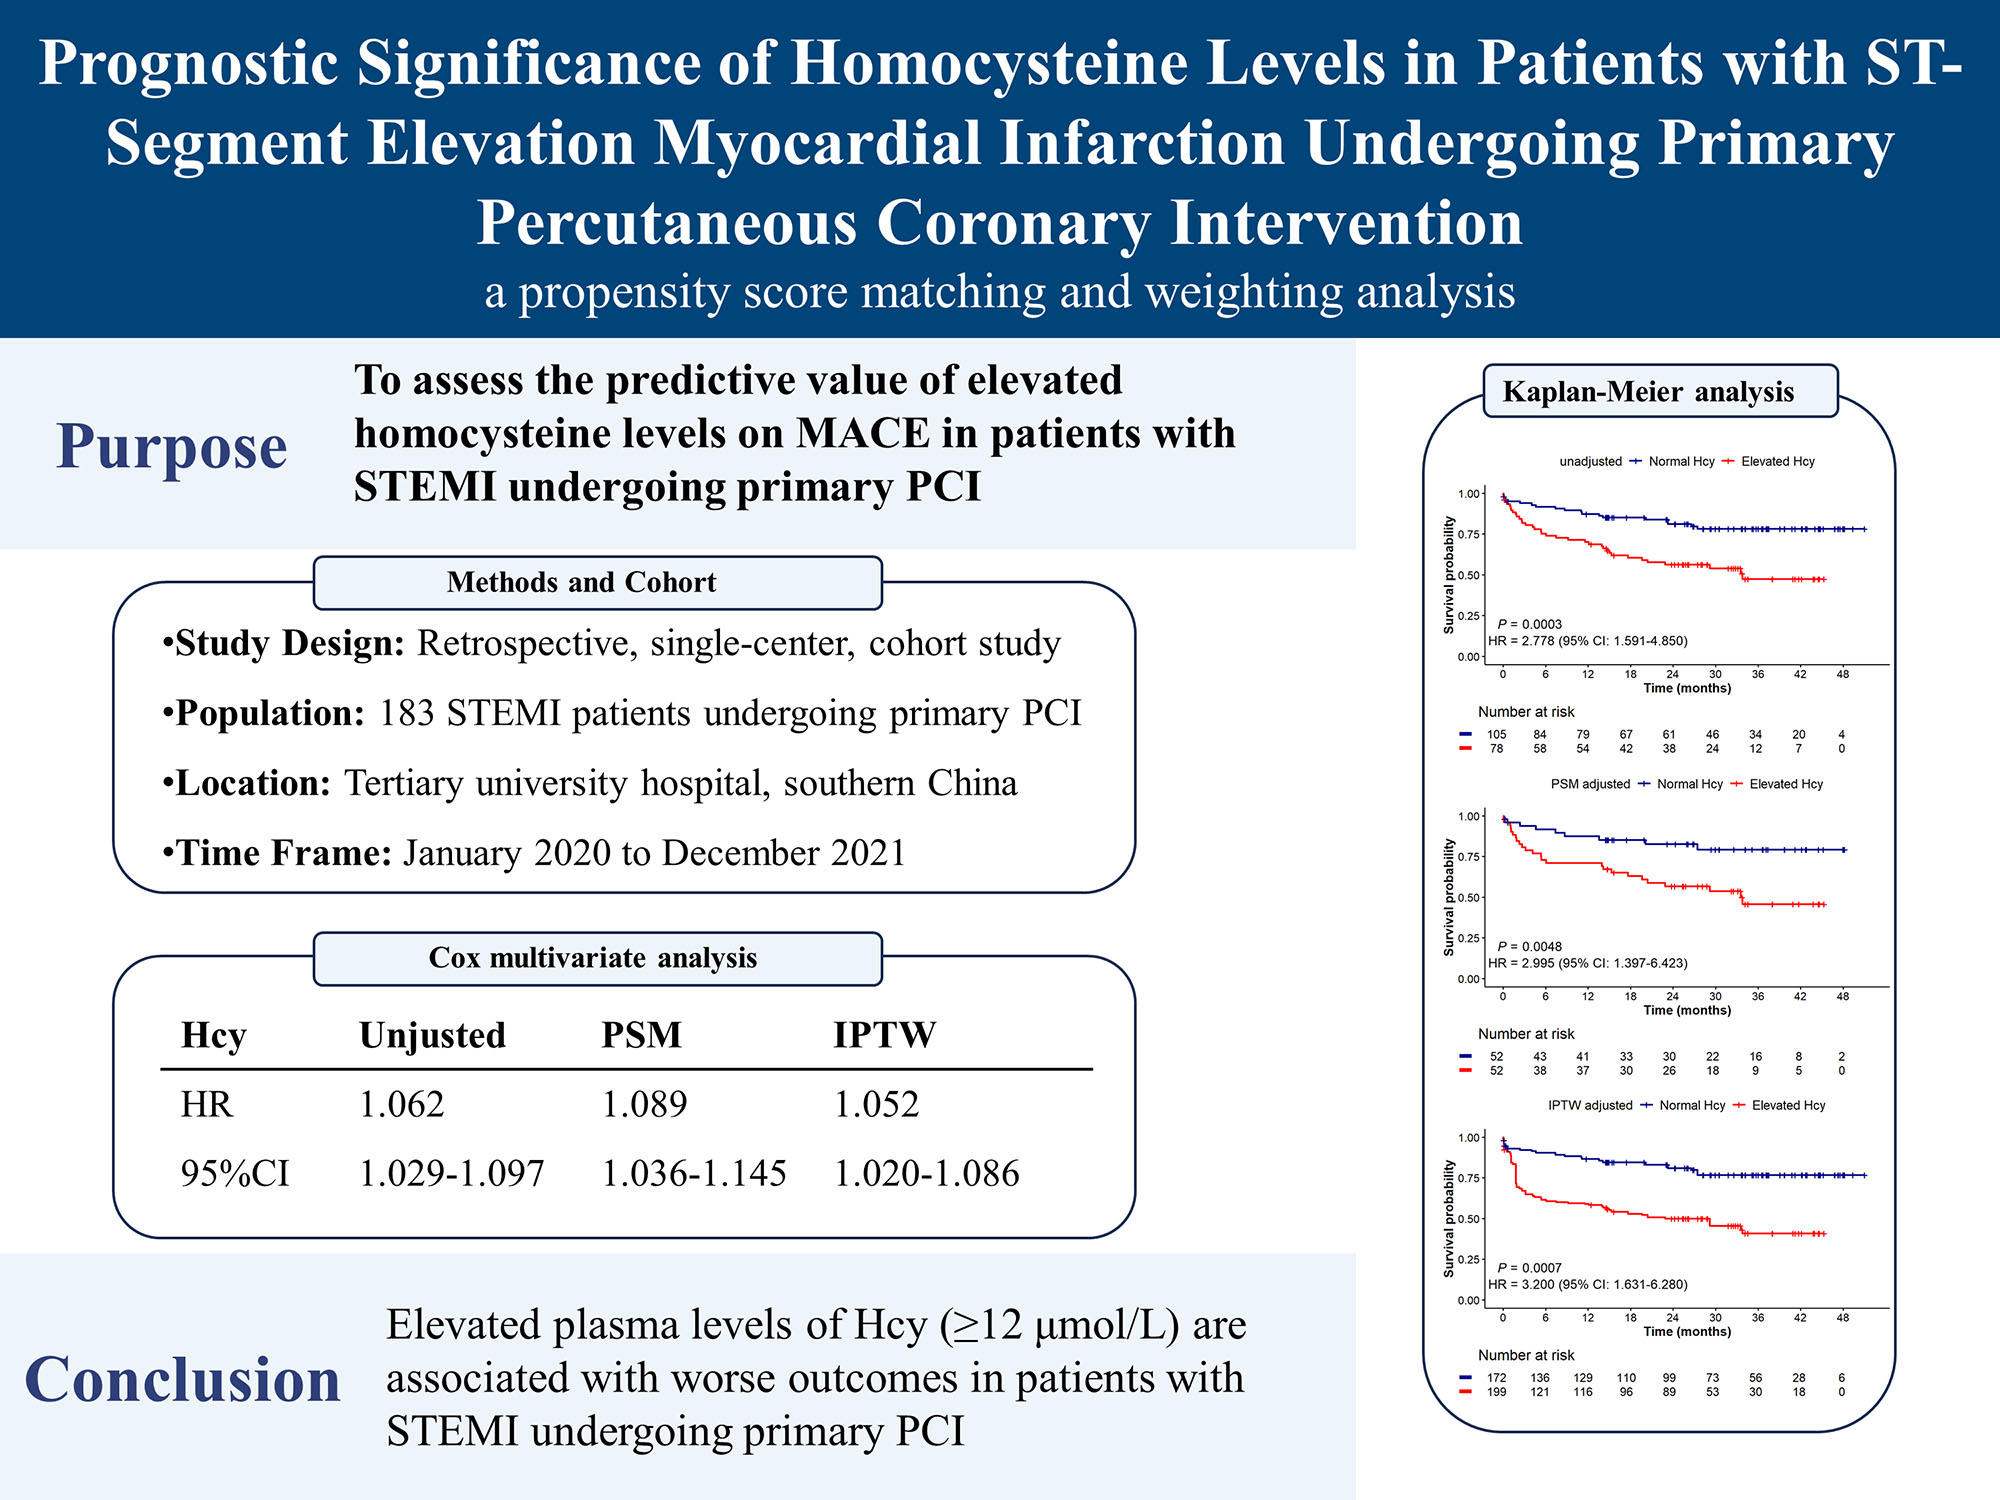
Elevated homocysteine (Hcy) levels have been linked to poorer outcomes in acute coronary syndrome. This study aimed to assess the predictive value of elevated Hcy levels for major adverse cardiac events (MACE) in patients with ST-segment elevation myocardial infarction (STEMI) undergoing primary percutaneous coronary intervention (PCI).
This retrospective cohort study included 183 STEMI patients who underwent primary PCI at a tertiary university hospital in southern China from January 2020 to December 2021. Laboratory values, including Hcy levels, were obtained within 24 hours of admission. Patients were categorized into elevated and normal Hcy groups using a threshold of 12 μmol/L. The study outcome was the occurrence of 6-point MACE, defined as cardiac death, nonfatal myocardial infarction, stroke, ischemia-driven revascularization (PCI or coronary artery bypass grafting), heart failure and all-cause death. Survival analyses were conducted using Kaplan-Meier and Cox proportional hazard methods. Propensity score matching (PSM) and inverse probability of treatment weighting (IPTW) approaches were employed to minimize bias.
The mean age of the patients was 64.8 years, with 76.0% being male. After adjusting with PSM or IPTW, covariate imbalances between the two groups were corrected. Over a median follow-up period of 25.8 months, 55 MACE events occurred, resulting in an event rate of 30.1%. Patients with elevated Hcy levels had a higher incidence of MACE in both unadjusted (hazard ratio [HR] = 2.778; 95% confidence interval [CI]: 1.591–4.850; p < 0.001) and adjusted analyses (PSM: HR = 2.995; 95% CI: 1.397–6.423, p = 0.005; IPTW: HR = 3.2; 95% CI: 1.631–6.280, p < 0.001). Multivariate Cox regression further confirmed that elevated Hcy levels were associated with a worse prognosis across the entire cohort (HR = 1.062, 95% CI: 1.029–1.097, p < 0.001), PSM cohort (HR = 1.089, 95% CI: 1.036–1.145, p < 0.001), and IPTW cohort (HR = 1.052, 95% CI: 1.020–1.086, p = 0.001).
Elevated plasma levels of Hcy (≥12 μmol/L) are associated with worse outcomes in STEMI patients undergoing primary PCI, highlighting the potential role of Hcy as a prognostic marker in this population.
Graphical Abstract
Keywords
- homocysteine
- ST-segment elevation myocardial infarction
- primary percutaneous coronary intervention
- major adverse cardiac events
- propensity score
Acute coronary syndrome (ACS), which affects millions of people annually, encompasses three types of coronary artery disease (CAD) and leads to approximately 7 million new diagnoses worldwide each year [1]. ST-segment elevation myocardial infarction (STEMI), the most critical type of ACS, constitutes about 36% of all ACS cases and results from the rupture of a vulnerable atherosclerotic plaque in a coronary artery, leading to complete occlusion and blockage of blood flow [1]. Accordingly, timely coronary catheterization and percutaneous coronary intervention (PCI) are the most effective strategies to reduce mortality in STEMI patients. However, some patients will still experience certain adverse events, such as heart failure, stroke, recurrent myocardial infarction, and even death [2]. Although traditional risk factors are still the main focus for risk stratification, emerging biomarkers like homocysteine (Hcy) hold promise for more accurately predicting residual risk and improving the efficacy of secondary prevention measures [3].
Discovered almost a century ago, Hcy is a sulfur-containing amino acid that undergoes metabolism via two main pathways: remethylation, which transform Hcy into methionine, and transsulfuration, which converts it into cysteine. Hcy levels can be significantly elevated due to deficiencies in dietary folate and B vitamins, as well as in individuals with the MTHFR 677 TT genotype. Conversely, B vitamin supplementation, including folic acid, B6, and B12, can lower Hcy levels. Several factors such as nutrition, age, gender, ethnicity, and genetics may also influence Hcy levels [4].
In the 1960s, pathologist Kilmer McCully made the seminal clinical observation that connected elevated plasma Hcy concentrations with vascular disease. This led him to propose the “homocysteine theory of atherosclerosis” [5], which spurred epidemiological studies revealing significant associations between even slight elevations in blood homocysteine and major vascular diseases including cardiovascular, cerebrovascular, and peripheral vascular diseases [4]; more recent studies, particularly those conducted in Chinese populations, have further corroborated these findings, demonstrating that hyperhomocysteinemia is an independent risk factor for CAD and highlighting its predictive value for obstructive CAD [6, 7].
Nonetheless, the relationship between Hcy levels and adverse outcomes in ACS remains unclear. This study, therefore, sought to evaluate the prognostic significance of elevated Hcy levels in predicting major adverse cardiac events (MACE) among STEMI patients undergoing primary PCI.
This single-center retrospective cohort study involved 183 consecutive STEMI
patients who underwent primary PCI at The Affiliated Fengcheng Hospital of Yichun
University, a tertiary care institution in southern China, from January 2020 to
December 2021. The study protocol adhered to the 1975 Declaration of Helsinki and
was approved by the Ethics Committee of The Affiliated Fengcheng Hospital of
Yichun University (Approval No. 202256). A threshold of 12 µmol/L was set
to define hyperhomocysteinemia [8]. Based on this cutoff, patients were
categorized into two groups: the normal Hcy group, with a median Hcy level of 8.7
µmol/L (range: 6.9–10.0 µmol/L), and the elevated Hcy group, with a
median Hcy level of 16.6 µmol/L (range: 14.3–18.9 µmol/L). STEMI was
defined by the presence of the following criteria: (1) prolonged chest pain
(
Two authors independently reviewed hospital medical records and the China Chest Pain Center Data Reporting Platform to collect baseline data for each
patient, including demographic characteristics, laboratory findings, medical
history, and angiographic and procedural details. Demographic and clinical
characteristics included age, sex, body mass index (BMI), heart rate, blood
pressure, Killip classification, left ventricular ejection fraction (LVEF), and
laboratory results. Laboratory results primarily included blood tests conducted
within 24 hours of admission, with troponin representing the highest value within
72 hours of admission, and LVEF reflecting the lowest value during
hospitalization. Collected medical history data consisted of current smoking
status, alcohol consumption, diabetes, hypercholesterolemia, hypertension, and
chronic obstructive pulmonary disease (COPD). The diagnostic criteria for
baseline characteristics were defined as follows: Hypertension was defined as
having a systolic blood pressure
The primary endpoint was the incidence of MACE, which included cardiac death,
nonfatal myocardial infarction, stroke, ischemia-driven revascularization (PCI or
coronary artery bypass grafting [CABG]), heart failure and all-cause death.
Stroke was defined as a sudden onset of neurological deficit caused by ischemia
or hemorrhage within the brain, confirmed by clinical presentation and imaging
studies. Heart failure is defined as a clinical syndrome characterized by
symptoms and/or signs resulting from functional or structural cardiac
abnormalities, typically confirmed by echocardiographic findings, evidence of
pulmonary or systemic congestion, and/or elevated serum biomarkers such as
proB-type natriuretic peptide (proBNP) [11]. Ischemia-driven revascularization
was defined as revascularization procedures, such as PCI or CABG, prompted by
symptoms or objective evidence of myocardial ischemia, which includes significant
stenosis (
All statistical analyses were performed using R software (version 4.3.2, R Foundation for Statistical Computing, Vienna, Austria) and SPSS software (version 22.0, IBM Corporation, Armonk, NY, USA). The Shapiro-Wilk test was employed to evaluate the normality of continuous variables. Variables following a normal distribution were summarized as mean (standard deviation) and compared between groups using an independent t-test. Those that did not follow a normal distribution were presented as median (Q1–Q3) and analyzed with the Mann-Whitney U test. Categorical variables were described as frequencies (percentages) and assessed using the chi-square test. Variables with less than 10% missing data in both groups were imputed using multiple imputation.
To adjust for between-group differences, propensity score-based methods were utilized, including propensity score matching (PSM) and inverse probability of treatment weighting (IPTW) [13]. For PSM, a greedy nearest-neighbor matching algorithm with a caliper width of 0.2 was applied for 1:1 matching. All covariates were initially considered for matching in PSM. To further validate our findings, we conducted sensitivity analyses using different sets of covariates, as detailed in Supplementary Table 1. For IPTW, the inverse propensity score was used as the weight for patients with elevated Hcy levels, and 1 minus the inverse propensity score was used as the weight for patients with normal Hcy levels. We also conducted a sensitivity analysis with E-values to evaluate the robustness of our results against potential unmeasured confounders [14]. The E-value quantifies the minimum association strength that an unmeasured confounder would require with both the exposure (elevated Hcy levels) and the outcome (MACE) to completely account for the observed relationship.
Survival analysis was conducted using Kaplan-Meier curves and Cox proportional
hazards models to evaluate the association between elevated Hcy levels and MACE
in STEMI patients undergoing primary PCI. Kaplan-Meier survival estimates were
compared using the log-rank test. Univariate Cox regression analysis was
initially conducted, and variables with a p-value
A total of 183 STEMI patients who underwent primary PCI were included in the
final analysis of this study (Fig. 1). Among these patients, 76.0% were male,
and the mean age was 64.8
 Fig. 1.
Study flow diagram. Abbreviations: STEMI, ST-segment elevation myocardial infarction; Hcy, homocysteine; PSM, propensity score matching; IPTW, inverse probability of treatment weighting.
| Overall (n = 183) | Normal Hcy (n = 105) | Elevated Hcy (n = 78) | p-value | |||
| Demographics | ||||||
| Age, year | 64.8 (12.4) | 63.6 (12.8) | 66.4 (11.7) | 0.128 | ||
| Male, n (%) | 139 (76.0%) | 75 (71.4%) | 64 (82.1%) | 0.688 | ||
| BMI, kg·m-2 | 23.8 (3.2) | 23.8 (3.2) | 23.6 (3.0) | 0.634 | ||
| HR, bpm | 73 (63, 86) | 74.0 (63, 86) | 73.0 (65, 87) | 0.766 | ||
| SBP, mmHg | 131 (113, 147) | 131 (113, 150) | 131 (110, 145) | 0.459 | ||
| DBP, mmHg | 81 (70, 94) | 81 (73, 94) | 80 (68, 91) | 0.176 | ||
| Troponin, ng/mL | 28.8 (10.7, 50.0) | 28.4 (13.0, 50.0) | 31.6 (8.7, 50.0) | 0.402 | ||
| NT-proBNP, pg/mL | 1314.0 (323.0, 2852.1) | 1085.1 (306.2, 3208.0) | 1368.2 (349.4, 2642.8) | 0.548 | ||
| TC, mmol/L | 4.6 (1.1) | 4.8 (1.1) | 4.4 (1.0) | 0.022 | ||
| TG, mmol/L | 1.1 (0.7, 1.5) | 1.1 (0.8, 1.6) | 1.0 (0.7, 1.4) | 0.056 | ||
| HDL-C, mmol/L | 1.1 (1.0, 1.4) | 1.2 (1.0, 1.4) | 1.1 (1.0, 1.3) | 0.280 | ||
| LDL-C, mmol/L | 2.9 (0.8) | 3.0 (0.8) | 2.8 (0.9) | 0.046 | ||
| WBC, 109/L | 10.4 (8.4, 12.9) | 11.3 (8.7, 13.3) | 10.0 (7.9, 12.1) | 0.062 | ||
| RBC, 1012/L | 4.2 (0.6) | 4.2 (0.6) | 4.1 (0.6) | 0.216 | ||
| PLT, 109/L | 203.0 (173.5, 249.0) | 206.0 (182.0, 250.0) | 197.0 (170.3, 243.3) | 0.223 | ||
| HB, g/L | 132.0 (116.0, 144.0) | 132.0 (119.0, 145.0) | 130.0 (113.3, 142.8) | 0.259 | ||
| HCT, % | 38.3 (32.5, 41.9) | 38.8 (33.3, 42.1) | 36.7 (31.2, 40.9) | 0.194 | ||
| D-dimer, mg/L | 0.4 (0.3, 0.6) | 0.4 (0.2, 0.6) | 0.4 (0.3, 0.7) | 0.378 | ||
| Serum creatinine, µmol/L | 70.0 (60.0, 87.0) | 66.1 (57.2, 76.9) | 76.7 (65.9, 102.0) | |||
| Na+, mmol/L | 139.0 (136.8, 141.0) | 138.6 (136.8, 140.3) | 139.7 (137.0, 141.5) | 0.122 | ||
| K+, mmol/L | 3.9 (3.7, 4.2) | 3.9 (3.7, 4.2) | 4.0 (3.7, 4.3) | 0.311 | ||
| Uric acid, µmol/L | 363.0 (125.4) | 350.5 (114.5) | 379.8 (137.7) | 0.119 | ||
| LVEF |
170 (92.9) | 96 (91.4) | 74 (94.9) | 0.545 | ||
| Killip classification |
39 (21.3) | 24 (22.9) | 15 (19.2) | 0.682 | ||
| Medical history | ||||||
| Smoking, n (%) | 101 (55.2) | 50 (47.6) | 51 (65.4) | 0.025 | ||
| Alcohol, n (%) | 32 (17.5) | 17 (16.2) | 15 (19.2) | 0.735 | ||
| Hypertension, n (%) | 108 (59.0) | 55 (52.4) | 53 (68.0) | 0.049 | ||
| Diabetes, n (%) | 47 (25.7) | 27 (25.7) | 20 (25.6) | 1 | ||
| Hyperlipidemia, n (%) | 28 (15.3) | 18 (17.1) | 10 (12.8) | 0.551 | ||
| COPD, n (%) | 20 (10.9) | 8 (7.6) | 12 (15.4) | 0.154 | ||
| Angiographic characteristics | ||||||
| D2W, mins | 80 (62, 105) | 83 (62, 106) | 79 (63, 100) | 0.715 | ||
| Culprit lesion | 0.640 | |||||
| RCA, n (%) | 72 (39.3) | 40 (38.1) | 32 (41.0) | |||
| LAD, n (%) | 91 (49.7) | 55 (52.4) | 36 (46.2) | |||
| LCX, n (%) | 20 (10.9) | 10 (9.5) | 10 (12.8) | |||
| Multivessel disease, n (%) | 116 (63.4) | 70 (66.7) | 46 (59.0) | 0.361 | ||
| Preprocedural TIMI flow |
51 (27.9) | 27 (25.7) | 24 (30.8) | 0.557 | ||
| Number of stents |
82 (44.8) | 51 (48.6) | 31 (39.7) | 0.300 | ||
Notes: Data are presented as mean (standard deviation), median (inter-quartile range), or n (%).
Abbreviations: BMI, body mass index; HR, heart rate; SBP, systolic blood pressure; DBP, diastolic blood pressure; NT-proBNP, N-terminal proB-type natriuretic peptide; TC, total cholesterol; TG, triglycerides; HDL-C, high-density lipoprotein cholesterol; LDL-C, low-density lipoprotein cholesterol; WBC, white blood cell; RBC, red blood cell; PLT, platelet count; HB, hemoglobin; HCT, hematocrit; LVEF, left ventricular ejection fraction; COPD, chronic obstructive pulmonary disease; D2W, door-to-wire time; RCA, right coronary artery; LAD, left anterior descending; LCX, left circumflex artery; TIMI, thrombolysis in myocardial infarction; Hcy, homocysteine.
After adjustment with the PSM or IPTW method, baseline covariates were balanced between the groups (Table 2). The propensity score jitter plot demonstrates that the distribution of propensity scores is well balanced following PSM adjustment (Fig. 2).
 Fig. 2.
Jitter plot of propensity score matching (PSM). This figure illustrates the distribution of propensity scores before and after matching between the elevated Hcy group (treated units) and the normal Hcy group (control units). “Unmatched Treated Units” and “Unmatched Control Units” represent the propensity scores of patients before matching, while “Matched Treated Units” and “Matched Control Units” indicate the scores after PSM. Hcy, homocysteine.
| PSM adjusted | p-value | IPTW adjusted | p-value | |||||
| Normal Hcy (n = 52) | Elevated Hcy (n = 52) | Normal Hcy (n = 172) | Elevated Hcy (n = 199) | |||||
| Demographics | ||||||||
| Age, year | 64.6 (13.0) | 65.7 (12.2) | 0.659 | 64.9 (12.7) | 68.6 (15.1) | 0.376 | ||
| Male, n (%) | 42 (80.8) | 40 (76.9) | 0.810 | 125.1 (72.8) | 134.9 (68.0) | 0.663 | ||
| BMI, kg·m-2 | 23.4 (3.1) | 23.7 (2.9) | 0.542 | 23.5 (3.2) | 23.4 (2.9) | 0.828 | ||
| HR, bpm | 77 (63, 85) | 73 (65, 86) | 0.782 | 74 (62, 88) | 75 (66, 88) | 0.717 | ||
| SBP, mmHg | 130 (118, 149) | 134 (112, 14) | 0.656 | 130 (113, 145) | 131 (106, 152) | 0.868 | ||
| DBP, mmHg | 80 (72, 94) | 84 (74, 91) | 0.940 | 80 (72, 92) | 82 (69, 94) | 0.798 | ||
| Troponin, ng/mL | 28.0 (11.6, 50.0) | 32.4 (9.9, 50.0) | 0.675 | 26.7 (9.3, 50.0) | 44.7 (11.1, 50.0) | 0.293 | ||
| NT-proBNP, pg/mL | 1010.2 (314.6, 2285.8) | 1386.3 (315.4, 2761.3) | 0.656 | 1071.1 (254.5, 3420.8) | 1599.7 (459.1, 4699.5) | 0.250 | ||
| TC, mmol/L | 4.6 (1.0) | 4.52 (1.1) | 0.879 | 4.6 (1.1) | 4.7 (1.1) | 0.675 | ||
| TG, mmol/L | 1.0 (0.7, 1.5) | 1.0 (0.7, 1.5) | 0.861 | 1.0 (0.7, 1.5) | 1.0 (0.7, 1.4) | 0.829 | ||
| HDL-C, mmol/L | 1.1 (1.0, 1.4) | 1.2 (1.1, 1.4) | 0.580 | 1.1 (1.0, 1.4) | 1.1 (0.9, 1.3) | 0.369 | ||
| LDL-C, mmol/L | 2.9 (0.8) | 2.9 (0.9) | 0.984 | 2.9 (0.9) | 3.0 (1.0) | 0.748 | ||
| WBC, 109/L | 10.5 (8.4, 13.2) | 10.2 (8.3, 12.4) | 0.772 | 11.2 (8.6, 13.1) | 10.6 (9.0, 15.0) | 0.649 | ||
| RBC, 1012/L | 4.2 (0.7) | 4.1 (0.5) | 0.564 | 4.1 (0.7) | 4.1 (0.6) | 0.951 | ||
| PLT, 109/L | 207.5 (176.0, 240.0) | 200.5 (173.8, 241.8) | 0.974 | 205.0 (173.7, 249.5) | 194.5 (176.3, 241.6) | 0.615 | ||
| HB, g/L | 133.0 (118.3, 145.0) | 130.5 (115.5, 142.3) | 0.491 | 132.0 (117.0, 144.4) | 126.9 (112.0, 140.0) | 0.283 | ||
| HCT, % | 38.6 (32.0, 42.0) | 36.7 (32.4, 39.6) | 0.246 | 38.5 (30.0, 41.8) | 37.0 (32.8, 39.3) | 0.475 | ||
| D-dimer, mg/L | 0.4 (0.3, 0.5) | 0.4 (0.3, 0.6) | 0.644 | 0.4 (0.3, 0.6) | 0.4 (0.3, 0.9) | 0.286 | ||
| Serum creatinine, µmol/L | 72.2 (62.9, 86.1) | 70.5 (60.7, 86.9) | 0.984 | 69.9 (59.0, 83.0) | 70.0 (65.0, 80.9) | 0.421 | ||
| Na+, mmol/L | 138.2 (136.7, 140.4) | 139.1 (137.2, 141.1) | 0.235 | 138.5 (136.7, 140.3) | 138.9 (137.2, 141.2) | 0.609 | ||
| K+, mmol/L | 3.9 (3.7, 4.3) | 4.0 (3.7, 4.2) | 0.718 | 3.9 (3.6, 4.2) | 3.9 (3.8, 4.1) | 0.873 | ||
| Uric acid, µmol/L | 364.7 (110.1) | 364.6 (137.4) | 0.997 | 355.5 (279.8, 437.8) | 382.63 (286.9, 423.7) | 0.393 | ||
| LVEF |
49 (94.2) | 48 (92.3) | 1 | 158.54 (92.3) | 162.9 (82.0) | 0.229 | ||
| Killip classification |
10 (19.2) | 11 (21.2) | 1 | 36.84 (21.4) | 48.72 (24.5) | 0.713 | ||
| Medical history | ||||||||
| Smoking, n (%) | 33 (63.5) | 32 (61.5) | 1 | 91.1 (53.0) | 107.3 (54.1) | 0.923 | ||
| Alcohol, n (%) | 11 (21.2) | 9 (17.3) | 0.804 | 28.3 (16.5) | 31.7 (16.0) | 0.939 | ||
| Hypertension, n (%) | 30 (57.7) | 32 (61.5) | 0.842 | 93.0 (54.1) | 101.6 (51.2) | 0.778 | ||
| Diabetes, n (%) | 12 (23.1) | 10 (19.2) | 0.81 | 38.0 (22.1) | 37.9 (19.1) | 0.651 | ||
| Hyperlipidemia, n (%) | 8 (15.4) | 7 (13.5) | 1 | 25.0 (14.6) | 27.3 (13.8) | 0.898 | ||
| COPD, n (%) | 6 (11.5) | 5 (9.6) | 1 | 13.7 (8.0) | 18.0 (9.1) | 0.790 | ||
| Angiographic characteristics | ||||||||
| D2W, mins | 84 (62, 102) | 78 (64, 98) | 0.770 | 78.0 (57.6, 98.0) | 80.0 (66.0, 97.1) | 0.677 | ||
| Culprit lesion | 0.815 | 0.947 | ||||||
| RCA, n (%) | 20 (38.5) | 20 (38.5) | 63.3 (36.8) | 71.0 (35.8) | ||||
| LAD, n (%) | 25 (48.1) | 27 (51.9) | 91.4 (53.2) | 103.8 (52.3) | ||||
| LCX, n (%) | 7 (13.5) | 5 (9.6) | 17.2 (10.0) | 23.7 (12.0) | ||||
| Multivessel disease, n (%) | 34 (65.4) | 31 (59.6) | 0.685 | 115.7 (67.4) | 141.94 (71.5) | 0.607 | ||
| Preprocedural TIMI flow |
17 (32.7) | 17 (32.7) | 1 | 47.1 (27.4) | 64.44 (32.5) | 0.634 | ||
| Number of stents |
28 (53.9) | 23 (44.2) | 0.433 | 79.8 (46.5) | 105.47 (53.1) | 0.511 | ||
Notes: Data are presented as mean (standard deviation), median (inter-quartile range), or n (%).
Abbreviations: PSM, propensity score matching; IPTW, inverse probability of treatment weighting; BMI, body mass index; HR, heart rate; SBP, systolic blood pressure; DBP, diastolic blood pressure; NT-proBNP, N-terminal proB-type natriuretic peptide; TC, total cholesterol; TG, triglycerides; HDL-C, high-density lipoprotein cholesterol; LDL-C, low-density lipoprotein cholesterol; WBC, white blood cell; RBC, red blood cell; PLT, platelet count; HB, hemoglobin; HCT, hematocrit; LVEF, left ventricular ejection fraction; COPD, chronic obstructive pulmonary disease; D2W, door-to-wire time; RCA, right coronary artery; LAD, left anterior descending; LCX, left circumflex artery; TIMI, thrombolysis in myocardial infarction; Hcy, homocysteine.
Over a median follow-up period of 25.8 (10.1, 35.9) months, 55 patients (30.1%)
experienced MACE, with 19 cases in the normal Hcy group and 36 in the elevated
Hcy group. The incidence rates of different events are detailed in
Supplementary Table 2. The Kaplan-Meier survival plot (Fig. 3)
demonstrated a significantly higher incidence of MACE in the elevated Hcy group
according to the Cox proportional hazard model (HR = 2.778, 95% CI:
1.591–4.850, p
 Fig. 3.
Kaplan-Meier survival analysis for MACE according to Hcy levels: (A) unadjusted analysis, (B) PSM adjusted, (C) IPTW adjusted. The survival analysis is performed with the use of the Cox proportional-hazard model. The Kaplan-Meier survival analysis shows that the elevated Hcy group has a lower survival probability compared to the normal Hcy group, with unadjusted, PSM-adjusted, and IPTW-adjusted analyses all confirming an increased risk of MACE associated with higher Hcy levels and demonstrating the robustness of this association after adjusting for confounding factors. Hcy, homocysteine; HR, hazard ratio; CI, confidence interval; PSM, propensity score matching; IPTW, inverse probability of treatment weighting; MACE, major adverse cardiac events.
The E-values for the unadjusted, PSM, and IPTW analyses were 5.000, 5.439, and 5.853, respectively, suggesting that an unmeasured confounder would require a strong association with both Hcy levels and MACE to fully explain away these findings (Supplementary Table 3). These findings support the robustness of the observed association between elevated Hcy levels and an increased risk of MACE, even in the presence of potential unmeasured confounders.
Subgroup analysis revealed varying associations between elevated homocysteine
levels and MACE across different subgroups (Supplementary Fig. 1). The
P-interaction values indicated no significant interaction effects among subgroups
(all p
In the multivariate Cox proportional hazards analysis, age (HR = 1.052, 95% CI:
1.023–1.081, p
| Univariate | Multivariate | ||||
| HR (95% CI) | p-value | HR (95% CI) | p-value | ||
| Age | 1.072 (1.044–1.102) | 1.052 (1.023–1.081) | |||
| Male | 0.699 (0.391–1.251) | 0.228 | |||
| BMI | 0.978 (0.896–1.066) | 0.609 | |||
| Heart rate | 1.009 (0.996–1.022) | 0.196 | |||
| SBP | 1.008 (0.999–1.016) | 0.098 | |||
| DBP | 0.998 (0.984–1.012) | 0.771 | |||
| Troponin | 1.004 (0.999–1.009) | 0.149 | |||
| NT-proBNP | 1.001 (0.999–1.001) | 0.241 | |||
| TC | 1.008 (0.785–1.294) | 0.952 | |||
| TG | 0.781 (0.519–1.177) | 0.238 | |||
| HDL-C | 0.946 (0.474–1.888) | 0.874 | |||
| LDL-C | 1.267 (0.907–1.77) | 0.166 | |||
| WBC | 0.983 (0.922–1.048) | 0.605 | |||
| RBC | 0.474 (0.299–0.751) | 0.001 | 1.32 (0.549–3.171) | 0.535 | |
| PLT | 1.003 (1–1.006) | 0.068 | |||
| HB | 0.974 (0.96–0.988) | 0.984 (0.954–1.014) | 0.299 | ||
| HCT | 0.982 (0.968–0.997) | 0.019 | 0.99 (0.972–1.008) | 0.260 | |
| D-dimer | 1.72 (1.227–2.413) | 0.002 | 1.444 (0.881–2.367) | 0.145 | |
| Serum creatinine | 1.005 (1.001–1.009) | 0.013 | 0.997 (0.991–1.003) | 0.270 | |
| Na+ | 0.997 (0.984–1.01) | 0.615 | |||
| K+ | 0.978 (0.878–1.089) | 0.682 | |||
| Uric acid | 1.001 (0.999–1.003) | 0.357 | |||
| Hcy | 1.035 (1.011–1.059) | 0.004 | 1.062 (1.029–1.097) | ||
| LVEF |
0.187 (0.094–0.375) | 0.251 (0.116–0.543) | |||
| Killip classification |
1.166 (0.614–2.211) | 0.639 | |||
| Smoking | 0.829 (0.488–1.407) | 0.487 | |||
| Alcohol | 1.029 (0.518–2.042) | 0.935 | |||
| Hypertension | 1.297 (0.744–2.262) | 0.359 | |||
| Diabetes | 1.106 (0.611–2.003) | 0.739 | |||
| Hyperlipidemia | 1.228 (0.619–2.438) | 0.556 | |||
| COPD | 1.711 (0.836–3.504) | 0.142 | |||
| D2W | 1.002 (0.997–1.008) | 0.402 | |||
| Culprit lesion | |||||
| RCA | 1 (reference) | ||||
| LAD | 0.932 (0.528–1.645) | 0.808 | |||
| LCX | 1.262 (0.539–2.955) | 0.592 | |||
| Multivessel disease | 1.047 (0.604–1.814) | 0.870 | |||
| Preprocedural TIMI flow |
0.736 (0.395–1.371) | 0.334 | |||
| Number of stents |
0.966 (0.567–1.647) | 0.900 | |||
Notes: Variables with a p-value
Abbreviations: BMI, body mass index; SBP, systolic blood pressure; DBP, diastolic blood pressure; NT-proBNP, N-terminal proB-type natriuretic peptide; TC, total cholesterol; TG, triglycerides; HDL-C, high-density lipoprotein cholesterol; LDL-C, low-density lipoprotein cholesterol; WBC, white blood cell; RBC, red blood cell; PLT, platelet count; HB, hemoglobin; HCT, hematocrit; LVEF, left ventricular ejection fraction; COPD, chronic obstructive pulmonary disease; D2W, door-to-wire time; RCA, right coronary artery; LAD, left anterior descending; LCX, left circumflex artery; TIMI, thrombolysis in myocardial infarction; Hcy, homocysteine; HR, hazard ratio; CI, confidence interval; MACE, major adverse cardiac events.
| PSM adjusted | IPTW adjusted | ||||||||
| Univariate | Multivariate | Univariate | Multivariate | ||||||
| HR (95% CI) | p-value | HR (95% CI) | p-value | HR (95% CI) | p-value | HR (95% CI) | p-value | ||
| Age | 1.062 (1.029–1.097) | 1.045 (1.012–1.079) | 0.008 | 1.065 (1.041–1.089) | 1.051 (1.019–1.084) | 0.002 | |||
| Male | 0.727 (0.329–1.607) | 0.431 | 0.432 (0.2–0.934) | 0.033 | 1.383 (0.708–2.702) | 0.343 | |||
| BMI | 0.954 (0.855–1.064) | 0.395 | 0.952 (0.861–1.053) | 0.341 | |||||
| Heart rate | 1.022 (1.001–1.043) | 0.037 | 0.998 (0.97–1.027) | 0.895 | 1.016 (0.998–1.033) | 0.075 | |||
| SBP | 1.010 (0.998–1.021) | 0.090 | 1.008 (0.994–1.022) | 0.271 | |||||
| DBP | 1.002 (0.984–1.021) | 0.812 | 1 (0.982–1.018) | 0.959 | |||||
| Troponin | 1.004 (0.998–1.009) | 0.186 | 1.003 (1.001–1.007) | 0.062 | |||||
| NT-proBNP | 1.001 (0.999–1.001) | 0.649 | 1.001 (0.999–1.001) | 0.844 | |||||
| TC | 1.166 (0.827–1.643) | 0.381 | 1.27 (0.939–1.718) | 0.121 | |||||
| TG | 0.653 (0.333–1.278) | 0.214 | 0.777 (0.49–1.232) | 0.284 | |||||
| HDL-C | 0.914 (0.395–2.117) | 0.834 | 0.482 (0.177–1.313) | 0.154 | |||||
| LDL-C | 1.663 (1.077–2.567) | 0.022 | 1.866 (1.162–2.996) | 0.010 | 1.729 (1.083–2.761) | 0.022 | 2.765 (1.692–4.520) | ||
| WBC | 0.989 (0.897–1.09) | 0.825 | 1.048 (0.99–1.11) | 0.107 | |||||
| RBC | 0.557 (0.303–1.025) | 0.060 | 0.586 (0.363–0.947) | 0.029 | 1.192 (0.396–3.588) | 0.754 | |||
| PLT | 1.003 (0.998–1.008) | 0.250 | 1.002 (0.998–1.006) | 0.263 | |||||
| HB | 0.982 (0.963–1.001) | 0.061 | 0.98 (0.962–0.999) | 0.035 | 0.968 (0.927–1.011) | 0.145 | |||
| HCT | 0.982 (0.964–0.999) | 0.048 | 0.988 (0.968–1.008) | 0.235 | 0.985 (0.97–1) | 0.054 | |||
| D-dimer | 4.856 (2.655–8.881) | 5.306 (2.354–11.955) | 2.067 (1.36–3.142) | 0.001 | 1.566 (0.991–2.473) | 0.054 | |||
| Serum creatinine | 1.005 (0.998–1.011) | 0.139 | 1.001 (0.995–1.007) | 0.739 | |||||
| Na+ | 1.036 (0.935–1.148) | 0.499 | 0.998 (0.995–1.001) | 0.177 | |||||
| K+ | 1.361 (0.604–3.065) | 0.457 | 0.983 (0.955–1.011) | 0.228 | |||||
| Uric acid | 1.001 (0.998–1.004) | 0.412 | 1 (0.997–1.003) | 0.828 | |||||
| Hcy | 1.072 (1.027–1.118) | 0.001 | 1.089 (1.036–1.145) | 1.047 (1.016–1.079) | 0.003 | 1.052 (1.020–1.086) | 0.001 | ||
| LVEF |
0.137 (0.055–0.344) | 0.339 (0.075–1.529) | 0.159 | 0.138 (0.07–0.274) | 0.259 (0.111–0.605) | 0.002 | |||
| Killip Classification |
1.495 (0.677–3.304) | 0.320 | 1.276 (0.503–3.234) | 0.608 | |||||
| Smoking | 0.639 (0.325–1.258) | 0.195 | 0.562 (0.275–1.149) | 0.114 | |||||
| Alcohol | 1.709 (0.796–3.667) | 0.169 | 1.433 (0.614–3.344) | 0.406 | |||||
| Hypertension | 1.391 (0.678–2.855) | 0.368 | 0.711 (0.339–1.49) | 0.366 | |||||
| Diabetes | 1.290 (0.584–2.851) | 0.529 | 0.84 (0.406–1.736) | 0.638 | |||||
| Hyperlipidemia | 1.357 (0.562–3.279) | 0.498 | 0.808 (0.349–1.875) | 0.620 | |||||
| COPD | 1.988 (0.82–4.819) | 0.128 | 1.297 (0.599–2.807) | 0.509 | |||||
| D2W, mins | 1.004 (0.998–1.011) | 0.165 | 1.004 (0.999–1.008) | 0.135 | |||||
| Culprit lesion | |||||||||
| RCA | 1 (reference) | 1 (reference) | |||||||
| LAD | 1.177 (0.571–2.425) | 0.659 | 1.084 (0.479–2.454) | 0.846 | |||||
| LCX | 0.722 (0.203–2.562) | 0.614 | 1.274 (0.387–4.193) | 0.691 | |||||
| Multivessel disease | 1.280 (0.624–2.628) | 0.500 | 1.676 (0.872–3.221) | 0.121 | |||||
| Preprocedural TIMI flow |
0.612 (0.277–1.353) | 0.225 | 0.971 (0.362–2.603) | 0.954 | |||||
| Number of stents |
1.056 (0.539–2.069) | 0.874 | 1.403 (0.68–2.892) | 0.359 | |||||
Notes: Variables with a p-value
Abbreviations: MACE, major adverse cardiac events; PSM, propensity score matching; IPTW, inverse probability of treatment weighting; BMI, body mass index; SBP, systolic blood pressure; DBP, diastolic blood pressure; NT-proBNP, N-terminal proB-type natriuretic peptide; TC, total cholesterol; TG, triglycerides; HDL-C, high-density lipoprotein cholesterol; LDL-C, low-density lipoprotein cholesterol; WBC, white blood cell; RBC, red blood cell; PLT, platelet count; HB, hemoglobin; HCT, hematocrit; LVEF, left ventricular ejection fraction; COPD, chronic obstructive pulmonary disease; D2W, door-to-wire time; RCA, right coronary artery; LAD, left anterior descending; LCX, left circumflex artery; TIMI, thrombolysis in myocardial infarction; Hcy, homocysteine; HR, hazard ratio; CI, confidence interval.
In this cohort of 183 STEMI patients undergoing primary PCI, we observed that
those with hyperhomocysteinemia (
Hcy, an intermediate metabolite of methionine, contributes to endothelial dysfunction and inflammation, smooth muscle cell proliferation, platelet activation, and increased risk of thrombosis [5, 15]. With the advent of high-performance liquid chromatography methods for the rapid measurement of Hcy concentrations, epidemiological studies have uncovered significant links between modest increases in blood Hcy levels and cardiovascular, cerebrovascular, and peripheral vascular diseases [16, 17]. Several in vitro and in vivo studies using pathogenic concentrations of Hcy and hyperhomocysteinemia animal models have demonstrated that Hcy induces harmful effects on both vascular resident cells and circulating leukocytes [18]. As an amino acid containing a reactive sulfhydryl group, Hcy is thought to contribute to vascular inflammation and injury by promoting oxidative stress through the accumulation of reactive oxygen species [19]. This oxidative stress can lead to endothelial dysfunction, smooth muscle cell proliferation, and vascular calcification, thereby increasing the risk of cardiac and vascular diseases [18]. Supporting this hypothesis, hyperhomocysteinemia has consistently been linked to a heightened risk of various cardiovascular conditions, including atherosclerosis, coronary heart disease, heart failure, and atrial fibrillation. Moreover, it is strongly correlated with a higher incidence of stroke and greater overall mortality [20].
Despite the strong associations mentioned above, early large-scale trials of Hcy lowering with vitamins therapy, such as the Vitamin Intervention for Stroke Prevention (VISP) [21] and the Heart Outcomes Prevention Evaluation 2 (HOPE-2) trial [22], did not demonstrate a reduction in stroke incidence. However, in 2015, the China Stroke Primary Prevention Trial (CSPPT), which included over 20,000 participants and had a five-year follow-up period, demonstrated that folic acid supplementation significantly reduced the incidence of stroke [23]. The underlying causes of these contradictory findings remain uncertain and may be linked to variations in ethnicity, genetics factors, or dietary habits. Notably, the traditional Chinese diet typically involves lower meat consumption, higher vegetable intake, and lacks folic acid fortification [24]. A meta-analysis has demonstrated a weaker association between Hcy levels and coronary heart disease compared to stroke, potentially due to differences in the pathogenesis of cardiovascular and cerebrovascular diseases [25].
Another interesting point of view is that prospective studies exhibited significantly weaker associations between homocysteine levels and the risks of ischemic heart disease compared to retrospective studies [25]. Both retrospective and prospective cohort data were included in this meta-analysis, and the target populations, follow-up times, and Hcy cut-off values varied. This discrepancy may arise from biases inherent in retrospective studies, including difficulties in selecting appropriate controls and the impact of changes in treatment and other factors following disease onset. Several studies have concluded that high Hcy levels adversely affect the prognosis of patients with ACS, increasing the risk of MACE [26, 27, 28, 29, 30, 31] and all-cause mortality [31, 32, 33], with a targeted meta-analysis [34] indicating that the risk can more than double. Conversely, other studies have concluded that homocysteine acts as a bystander rather than a causative factor and does not independently predict cardiovascular mortality in STEMI patients [35, 36]. Therefore, the heterogeneity among studies complicates the interpretation of the true effect of Hcy. Differences in race, geographic region, socioeconomic status, and dietary habits may contribute to the observed discrepancies. However, recent advancements in primary PCI, new-generation drug-eluting stents, and novel P2Y12 inhibitors are more likely to have diminished the prognostic significance of Hcy in cardiovascular outcomes. To date, it remains unknown whether Hcy level has a prognostic impact on STEMI patients undergoing primary PCI. In this study, Kaplan-Meier survival analysis demonstrated a higher incidence of MACE in the elevated Hcy group compared to the normal Hcy group, and these results remain robust after adjusting for confounders using PSM and IPTW. Subgroup analysis further confirmed the consistency of this association across various patient subgroups. The calculated E-value supported the robustness of the observed association between elevated Hcy levels and increased MACE risk, indicating that the findings are unlikely to be explained by unmeasured confounding alone. Cox regression analysis identified several factors significantly associated with prognosis, including Hcy, age, and LDL-C, indicating that these factors should be considered critical in assessing patient risk profiles.
This study has several strengths and limitations. One of the main strengths is the use of propensity score adjustments to account for various potential confounding factors, such as medical history and laboratory results. By employing two propensity score-based adjustment methods, we achieved a balanced distribution of baseline covariates between the elevated and the normal Hcy group, allowing for a more comprehensive evaluation of the results. To our knowledge, this is the first study to establish an association between Hcy levels and the risk of MACE in STEMI patients undergoing primary PCI in Southern China, a region without folic acid fortification. However, several limitations should be considered. The retrospective observational design, single-center setting, and relatively small sample size may affect the generalizability of our findings. Additionally, the absence of Hcy level monitoring during the follow-up period may have influenced the results. Although PSM and IPTW were employed to minimize selection bias, potential limitations inherent to a non-randomized study design may still be present.
In conclusion, elevated Hcy levels were a significant predictor of MACE in STEMI patients undergoing primary PCI. While these findings are encouraging, the current data highlight the need for future well-designed randomized controlled trials to investigate the long-term benefits of regulating Hcy levels in patients with coronary artery disease. The prevailing view is that lowering Hcy levels with folic acid and vitamin therapies does not change the prognosis for coronary artery disease [37, 38]. Several factors may contribute to this phenomenon. Firstly, since Hcy is linked to coronary restenosis [39] and slow blood flow [15], the potential benefits of Hcy-lowering therapies may have been obscured by the widespread use of antiplatelet agents and intensive lipid modulation, especially with the availability of newer-generation drug-eluting stents. Additionally, dietary variations across different regions lead to varying folate levels, which might influence the effectiveness of such therapies. Finally, the benefits of these therapies might only become apparent over longer treatment durations and extended follow-up periods. Folic acid and vitamin B are inexpensive and readily accessible, and their potential to lower Hcy levels and reduce cardiovascular risk warrants further exploration from a health economics standpoint. Given the low commercial incentives to test these affordable and non-patentable drugs, it is incumbent upon health authorities to take special responsibility in promoting and supporting such trials.
The datasets are available from the corresponding author on reasonable request.
QX contributed to the conception and design of the study, played a key role in the analysis and interpretation of data, and was responsible for preparing the manuscript and tables. SC and JL were involved in data acquisition, contributed significantly to data analysis and interpretation, and provided critical revisions to the manuscript for important intellectual content. YW, LH, PX, ZN, and ZL were responsible for patient follow-up and actively participated in the analysis and interpretation of the data. They also critically reviewed the manuscript and provided feedback for intellectual improvements. LZ and JW designed the manuscript outline, critically revised the manuscript for important intellectual content, and supervised the study. All authors reviewed and approved all versions of the article prior to submission, and agreed to be accountable for all aspects of the work to ensure accuracy and integrity.
The study was carried out in accordance with the guidelines of the Declaration of Helsinki and approved by the Ethics Committee of The Affiliated Fengcheng Hospital of Yichun University (Protocol No. 202256). In accordance with the guidelines of the Institutional Review Board, informed consent was waived due to the retrospective nature of the study and the use of de-identified data.
Not applicable.
This study was supported by the Science and Technology Plan Project of Jiangxi Provincial Health Commission (No. 202312257).
The authors declare no conflict of interest.
Supplementary material associated with this article can be found, in the online version, at https://doi.org/10.31083/RCM25518.
References
Publisher’s Note: IMR Press stays neutral with regard to jurisdictional claims in published maps and institutional affiliations.