


 , Jing Xu 2,†, Qiucang Xue 3, Hongming Yu 3, Jing Liang 3, Xiuzheng Yue 4, Yuying Liu 5, Dan Mu 1,3,6,*
1 Department of Radiology, Nanjing Drum Tower Hospital Clinical College of Jiangsu University, 210008 Nanjing, Jiangsu, China
2 Department of Radiology, Nanjing Drum Tower Hospital Clinical College of Nanjing Medical University, 210008 Nanjing, Jiangsu, China
3 Department of Radiology, Nanjing Drum Tower Hospital, Affiliated Hospital of Medical School, Nanjing University, 210008 Nanjing, Jiangsu, China
4 Philips Healthcare, 100020 Beijing, China
5 Laboratory National Key Laboratory for Novel Software Technology, Department of Computer Science and Technology, Nanjing University, 210023 Nanjing, Jiangsu, China
6 Department of Radiology, Shanghai Tenth People's Hospital, Tongji University School of Medicine, 200125 Shanghai, China
†These authors contributed equally.
Abstract
Atrial fibrillation (AF) is a major complication of hypertrophic cardiomyopathy (HCM) with significant prognostic implications. Current risk prediction models lack the integration of comprehensive cardiac magnetic resonance (CMR) metrics and subtype-specific analyses.
A retrospective study of 405 HCM patients (86 with AF) was performed from 2019 to 2024. After excluding highly correlated variables (|r| > 0.8), the cohort was split into training and validation sets in a 7:3 ratio. Least Absolute Shrinkage and Selection Operator (LASSO) regression and multivariable logistic regression analyses were used to identify predictors, with model performance assessed via receiver operating characteristic (ROC) curves, calibration plots, and decision curve analysis. Subgroup analyses were conducted for obstructive (HOCM) and non-obstructive (HNCM) subtypes.
Independent predictors of AF in the overall HCM cohort included right atrial diameter anteroposterior (RAD anteroposterior: odds ratio (OR) = 1.819, 95% confidence interval (CI) 1.130–3.007; p = 0.016), left ventricular end-systolic volume (LVESV: OR = 0.978, 95% CI 0.963–0.991; p = 0.002), septal mitral annular plane systolic excursion (MAPSE septal: OR = 0.850, 95% CI 0.736–0.976; p = 0.023), tricuspid annular plane systolic excursion (TAPSE: OR = 0.919, 95% CI 0.852–0.987; p = 0.022), and maximum left atrial volume (MaxLAV: OR = 1.016, 95% CI 1.004–1.029; p = 0.010). The model achieved an area under the curve (AUC) value of 0.850 in the training set and an AUC of 0.861 in the validation set. The HOCM subtype predictors included septal MAPSE and left atrial ejection fraction (LAEF); meanwhile, the HNCM predictors included septal MAPSE, maximal left atrial volume (MaxLAV), and right atrial ejection fraction (RAEF).
A validated multiparametric CMR model can accurately predict AF risk in HCM patients, with subtype-specific predictors enabling personalized monitoring and early intervention.
Keywords
- hypertrophic cardiomyopathy
- atrial fibrillation
- cardiac magnetic resonance imaging
- risk prediction model
- obstructive and non-obstructive subtypes
Atrial fibrillation (AF) is a common and clinically important complication in hypertrophic cardiomyopathy (HCM), occurring in about 20%–25% of patients and associated with a poorer prognosis due to increased risks of thromboembolism and heart failure [1, 2, 3]. Timely diagnosis and management are critical, as early anticoagulation and rhythm control can significantly lower stroke risk and prevent heart failure progression. While AF is usually identified by standard electrocardiography (ECG) or Holter monitoring after symptoms appear, these methods often detect the arrhythmia only when it is already sustained or symptomatic, leading to delays in intervention. Existing models for predicting AF risk, such as the HCM-AF risk calculator, depend mainly on baseline clinical factors and standard echocardiographic measures—particularly left atrial size and left ventricular wall thickness [4, 5, 6]. Although useful, these models cannot fully capture subclinical atrial remodeling, early systolic or diastolic dysfunction, or myocardial fibrosis, all key factors in AF development. Their dependence on conventional echocardiography also limits evaluation of complex structural and tissue-level changes that contribute to AF in HCM.
Cardiac magnetic resonance (CMR) has become the reference standard for comprehensive assessment of cardiac structure, function, and tissue characteristics in HCM. It allows accurate quantification of left ventricular mass, ejection fraction, and fibrosis through late gadolinium enhancement (LGE) [7], while feature tracking (FT) CMR provides more detailed myocardial strain analysis than echocardiography [8]. With its ability to perform multiparametric evaluation of left and right heart remodeling, CMR offers deeper insights into AF mechanisms and improves prediction [9, 10, 11, 12]. Recent evidence highlights the value of specific CMR-derived measures, including maximal left atrial volume (MaxLAV) and mitral annular plane systolic excursion (MAPSE), as strong predictors of AF. These parameters can identify early systolic impairment before a reduction in left ventricular ejection fraction (LVEF) occurs [13, 14, 15, 16]. Given the frequent presence of asymmetric hypertrophy in HCM, MAPSE is particularly relevant for assessing septal function [14, 15].
Notably, the role of right heart dynamics in HCM-related AF remains understudied [17, 18, 19, 20, 21]. Reduced tricuspid annular plane systolic excursion (TAPSE) and abnormal TAPSE-to-pulmonary artery systolic pressure (PASP) ratios, indicative of impaired right ventricular-pulmonary artery coupling, have been linked to AF susceptibility [19]. HCM patients with AF also exhibit unique patterns of right atrial dilation and TAPSE reduction [15], suggesting a critical yet overlooked contribution of right heart remodeling to AF pathogenesis.
Obstructive (HOCM) and nonobstructive (HNCM) HCM subtypes display distinct hemodynamic profiles, fibrosis distributions, and atrial remodeling patterns [20, 21, 22]. HOCM patients experience elevated left atrial afterload due to outflow tract obstruction, accelerating atrial fibrosis [23], whereas HNCM is associated with right atrial structural changes secondary to myocardial hypertrophy [24]. Critically, existing AF risk models lack subtype-specific analyses, failing to account for the heterogeneous mechanisms underlying AF in HOCM versus HNCM. This limitation hinders precise risk stratification and personalized management.
This study aimed to: (1) identify key CMR-derived parameters associated with AF in patients with HCM; and (2) develop and validate a novel risk score based on these parameters specifically for predicting AF risk in this patient population. Additionally, we sought to explore the differential contributions of HOCM and HNCM phenotypes to atrial remodeling and AF risk.
This retrospective study included 405 patients with HCM who underwent CMR and were hospitalized at Nanjing Gulou Hospital between January 2019 and December 2024. The main admission diagnoses of these patients covered categories: chest pain, dyspnea, palpitations, syncope, or routine follow-up for HCM. The study protocol was approved by the Institutional Ethics Committee (2024-551-01) with a waiver for informed consent.
Inclusion Criteria (Based on the 2024 American Heart Association guidelines
[21]): (a) Septal thickness
Exclusion Criteria: (a) Age
AF was diagnosed according to the 2023 American College of Cardiology/American
Heart Association/American College of Chest Physicians/Heart Rhythm Society
(ACC/AHA/ACCP/HRS) AF diagnostic guidelines [25]. The diagnostic criteria were:
(a) ECG findings: A single-lead ECG recording for
CMR scans were performed during hospitalization using a 3.0-T MRI system (Philips Healthcare, Best, Netherlands) in accordance with standardized imaging protocols recommended by the Society for Cardiovascular Magnetic Resonance (SCMR) [26]. All scans were completed during sinus rhythm to ensure accurate measurement of cardiac volume and functional parameters. Scans were acquired at end-expiration using vector ECG-gated techniques with the patient in the supine position. A balanced turbo field echo (B-TFE) movie sequence was used to capture two-, triple-, and four-lumen long-axis views of the left ventricle (LV), as well as successive short-axis slices. For T1 mapping imaging, a breath-hold modified MOLLI (Modified Look-Locker Inversion Recovery) sequence was employed to acquire three short-axis slices at the basal, midventricular, and apical levels. Enhanced T1 measurements were performed 10–15 minutes after intravenous administration of 0.2 mmol/kg gadolinium-based contrast agent (Magnevist, Bayer Healthcare, Berlin, Germany). Images were then translated to the hospital’s Picture Archiving and Communication System (PACS). All CMR analyses were independently conducted by two experienced radiologists using PACS and CVI42 software (version 6.1, Circle Cardiovascular Imaging, Alberta, Canada) (Fig. 1).
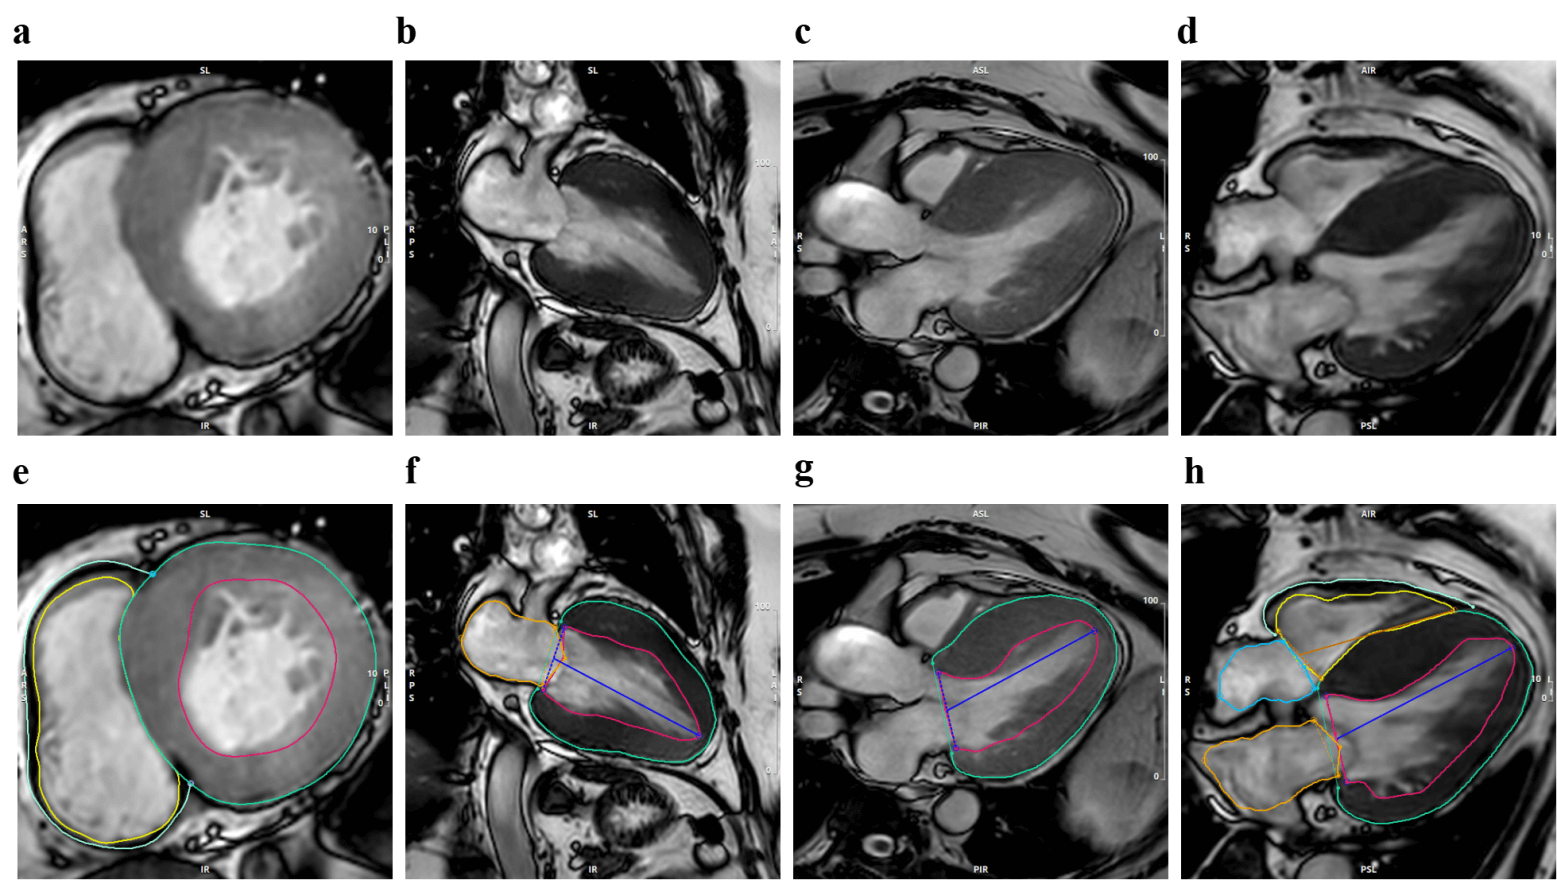 Fig. 1.
Typical cardiac magnetic resonance imaging (CMRI) presentation in patients with hypertrophic cardiomyopathy (HCM). This figure shows representative cardiac MRI images and contoured images obtained from patients with HCM, utilizing cinematic MRI technology to precisely depict the structural and functional characteristics of the heart in various anatomical planes. Where (a–d) correspond to the short-axis (SAX), two-chamber (2CH), three-chamber (3CH), and four-chamber (4CH) views of the original cinematic MRI, respectively; (e–h) corresponding to the SAX, 2CH, 3CH, and 4CH views of the cinematic MRI contoured in the original image, respectively.
Cardiac structure: right atrial diameter (RAD) anteroposterior, LA diameter (LAD) anteroposterior, left ventricular wall thickness (LVWT), and interventricular septum thickness (IVST) were measured using the short cine image.
Functional parameters: MAPSE (assessing left ventricular longitudinal systolic function, including inferior, anterior, lateral, and septal walls) and TAPSE (assessing right ventricular systolic function)—were measured using two- and four-chamber cine images.
Other parameter: LV and RV overall strain—global circumferential strain (GCS), global longitudinal strain (GLS), and global radial strain (GRS)—measured by FT-CMR. Pre-contrast T1 values, post-contrast T1 values, and extracellular volume (ECV) were obtained using the tissue T1 mapping function (see Supplementary Table 1 for the specific parameter list).
In order to avoid the limitations of traditional models that rely solely on 2D ultrasound, this study integrated clinical baseline data with multi-dimensional CMR parameters to develop a predictive model through the following steps:
Variables with more than 10% missing values were eliminated (e.g., T1
mapping-related parameters were excluded due to high rates of missing data)
(Supplementary Table 2). Multicollinear variables were removed based on
Pearson correlation analysis, retaining only one variable from each group of
highly correlated variables (
Patients were randomly divided into a training set (model development) and a validation set in a 7:3 ratio to ensure that the baseline characteristics of the two groups—such as age, gender, and incidence of AF—were balanced.
In the training set, Least Absolute Shrinkage and Selection Operator (LASSO)
regression was applied. Specifically, 10-fold cross-validation was performed, and
the optimal regularization parameter
Variables selected through LASSO regression were incorporated into a multivariable logistic regression model. Predictors with a p-value less than 0.05 were considered significant and retained, leading to the construction of a prediction model that included both clinical and radiological indicators. Subsequently, the risk scores from this model were visualized using a nomogram.
Discrimination was assessed using the receiver operating characteristic curve (AUC) and the concordance index (C-index). The agreement between predicted probabilities and actual outcomes was evaluated through calibration curves generated with 1000 bootstrap resamples. Additionally, decision curve analysis (DCA) was performed to assess the net benefit across various risk thresholds, thereby enabling the evaluation of the model’s clinical utility.
Stratification was based on LVOT gradient (
Each subgroup underwent the same modeling pipeline, ensuring methodological consistency. This approach enables identification of subtype-specific predictors and quantifies how obstruction modifies predictive performance.
All statistical analyses were conducted using R software (version 4.3.2, R
Foundation for Statistical Computing, Vienna, Austria). Continuous variables were
summarized as mean
This study enrolled 405 patients with HCM, and the participant screening process was illustrated in (Fig. 2). The baseline characteristics of the AF and non-AF groups are as follows: (1)
Significant differences were observed between the two groups regarding gender,
age, eosinophil count, aspartate aminotransferase (AST), lactate dehydrogenase
(LDH), direct bilirubin, cholinesterase, urea, creatinine, estimated glomerular
filtration rate (eGFR), free triiodothyronine (FT3), and free thyroxine (FT4)
(all p
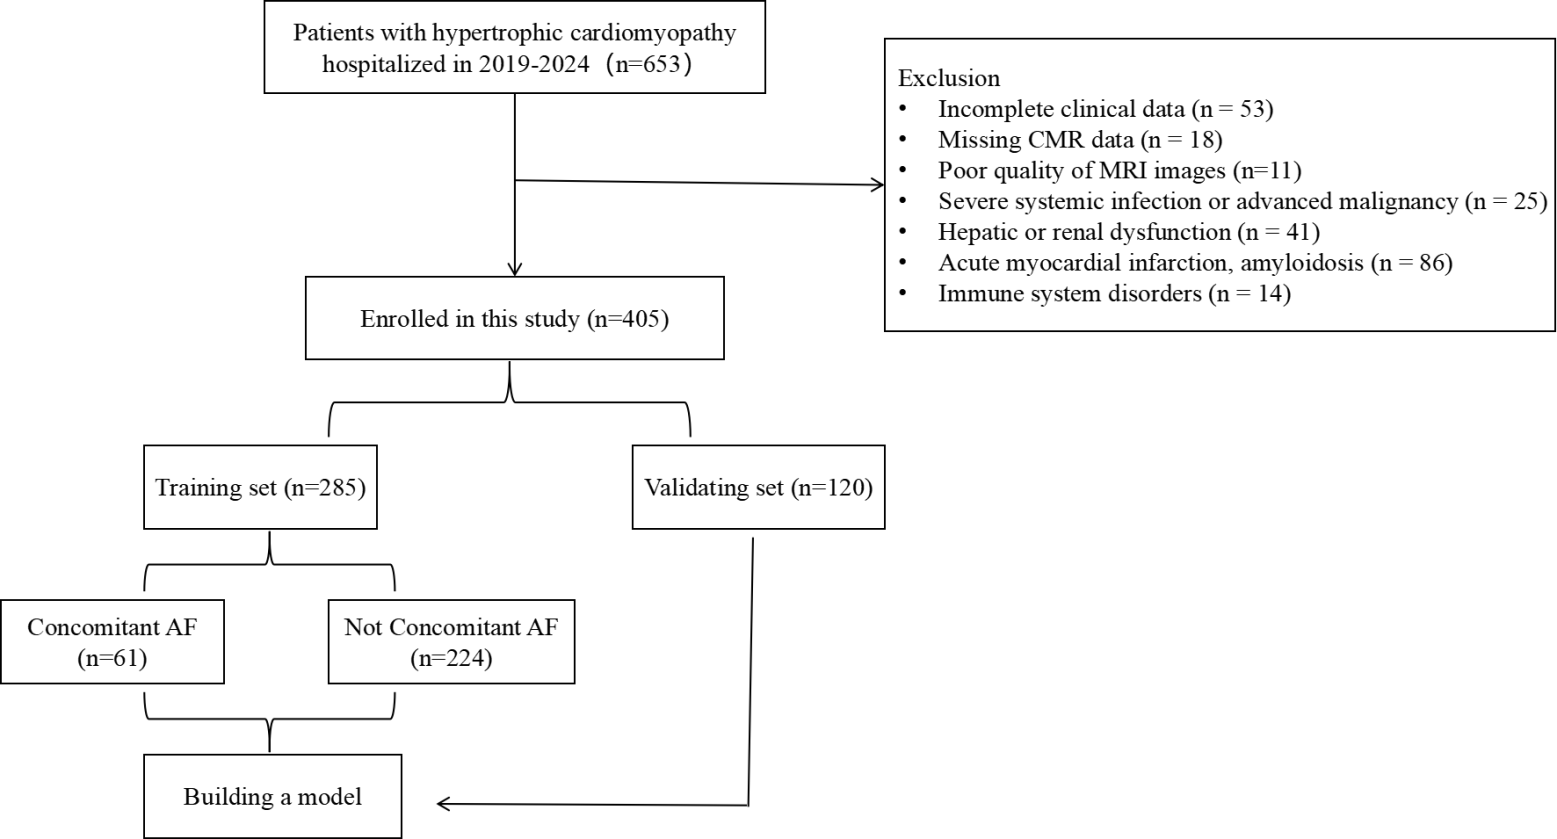 Fig. 2.
Flow chart for patient selection. AF, Atrial Fibrillation.
| Variables | Total (n = 405) | No_AF (n = 319) | AF (n = 86) | p-value | |
| CHD, n (%) | |||||
| Yes | 73 (18%) | 57 (18%) | 16 (19%) | 1.000 | |
| Obstruction, n (%) | |||||
| Yes | 154 (38%) | 125 (39%) | 29 (34%) | 0.423 | |
| Gender, n (%) | |||||
| Male | 263 (65%) | 217 (68%) | 46 (53%) | 0.017 | |
| Age | 57 (48, 66) | 56 (46, 66) | 63 (55, 69) | ||
| Heart rate (times/minute) | 69 (62, 76) | 69 (62, 76) | 69 (61, 77) | 0.814 | |
| Hypertension, n (%) | |||||
| Yes | 218 (54%) | 172 (54%) | 46 (53%) | 1.000 | |
| Diabetes, n (%) | |||||
| Yes | 48 (12%) | 34 (11%) | 14 (16%) | 0.214 | |
| Alcohol, n (%) | |||||
| Yes | 75 (19%) | 60 (19%) | 15 (17%) | 0.894 | |
| Smoking, n (%) | |||||
| Yes | 129 (32%) | 109 (34%) | 20 (23%) | 0.072 | |
| BMI | 25.77 |
25.75 |
25.85 |
0.811 | |
| White blood cell (109/L) | 6.1 (5.1, 7.4) | 6.1 (5.2, 7.4) | 5.8 (5.03, 7.35) | 0.457 | |
| NLR | 2.00 (1.58, 2.80) | 2.05 (1.57, 2.82) | 2.00 (1.59, 2.71) | 0.902 | |
| Monocyte (109/L) | 0.4 (0.3, 0.5) | 0.4 (0.3, 0.5) | 0.4 (0.3, 0.5) | 0.278 | |
| Eosinophil (109/L) | 0.13 (0.08, 0.20) | 0.13 (0.08, 0.21) | 0.11 (0.07, 0.18) | 0.043 | |
| Basophil (109/L) | 0.03 (0.02, 0.04) | 0.03 (0.02, 0.04) | 0.03 (0.02, 0.04) | 0.895 | |
| Red blood cell (1012/L) | 4.59 (4.23, 4.95) | 4.6 (4.23, 4.96) | 4.54 (4.22, 4.93) | 0.555 | |
| Hemoglobin (g/L) | 140 (128, 152) | 141 (128, 153) | 139 (128, 151) | 0.460 | |
| Platelet (109/L) | 188 (150, 228) | 191 (153, 233) | 185 (147, 220) | 0.278 | |
| Alanine aminotransferase (U/L) | 20.1 (14.6, 29.1) | 19.9 (14.5, 28.8) | 20.55 (15.05, 29.77) | 0.619 | |
| Aspartate aminotransferase (U/L) | 21.1 (17.8, 25.8) | 20.6 (17.4, 25.1) | 23.6 (19, 29.0) | 0.002 | |
| Alkaline phosphatase (U/L) | 69.3 (56.2, 80.4) | 69.5 (56.3, 81.1) | 66.6 (55.8, 77.7) | 0.510 | |
| Glutamyl transpeptidase (U/L) | 27.6 (18.9, 44.3) | 27.2 (18.8, 42.7) | 30.3 (19.3, 45.7) | 0.299 | |
| Lactate dehydrogenase (U/L) | 200 (176, 234) | 197 (175, 226) | 220.6 (185.3, 262.5) | 0.001 | |
| Direct bilirubin (umol/L) | 2.4 (1.8, 3.3) | 2.4 (1.75, 3.22) | 2.8 (2.0, 4.4) | 0.003 | |
| Cholinesterase (KU/L) | 7.9 (6.7, 9.1) | 8.0 (6.9, 9.3) | 7.7 (6.1, 8.3) | 0.012 | |
| Albumin (g/L) | 40.8 (38.7, 42.4) | 40.9 (38.8, 42.4) | 40.2 (38.3, 42.1) | 0.091 | |
| Globulin (g/L) | 24.9 (21.9, 27.4) | 25.1 (21.9, 27.6) | 23.9 (21.9, 26.2) | 0.099 | |
| Leucine aminopeptidase (U/L) | 43.25 (29.6, 51.5) | 43.25 (29.65, 51.50) | 43.18 (29.45, 51.03) | 0.901 | |
| Adenosine deaminase (U/L) | 9.7 (7.8, 12.1) | 9.8 (7.8, 12.0) | 9.6 (7.6, 12.3) | 0.890 | |
| Urea (mmol/L) | 6 (4.9, 7.1) | 5.8 (4.8, 7.0) | 6.5 (5.2, 7.5) | 0.016 | |
| Creatinine (umol/L) | 70 (59, 80) | 69 (58, 78) | 74.5 (64.3, 83.8) | 0.004 | |
| Triglyceride (mmol/L) | 1.26 (0.91, 1.79) | 1.25 (0.91, 1.81) | 1.28 (0.89, 1.71) | 0.691 | |
| HDL-C (mmol/L) | 1.06 (0.90, 1.25) | 1.06 (0.90, 1.25) | 1.11 (0.90, 1.27) | 0.365 | |
| LDL-C (mmol/L) | 2.51 |
2.53 |
2.41 |
0.207 | |
| C-reactive protein (mg/L) | 3.5 (2.3, 5.5) | 3.3 (2.3, 5.5) | 3.85 (2.4, 5.5) | 0.352 | |
| eGFR (mL/min/1.73 m2) | 101.2 (83.9, 118.4) | 104.4 (88.4, 122.6) | 90.0 (71.5 101.4) | ||
| TSH (mLU/L) | 1.99 (1.34, 2.74) | 1.97 (1.34, 2.71) | 2.02 (1.35, 3.05) | 0.515 | |
| Free triiodothyronine (pmoL/L) | 4.66 (4.20, 5.11) | 4.73 (4.27, 5.18) | 4.53 (4.05, 4.86) | 0.008 | |
| Free thyroxine (pmoL/L) | 16.5 (14.8, 18.1) | 16.5 (14.6, 18.1) | 17.0 (15.6, 18.4) | 0.033 | |
CHD, Coronary Atherosclerotic Heart Disease; NLR, neutrophil-to-lymphocyte ratio; HDL-C, High-Density Lipoprotein Cholesterol; LDL-C, Low-Density Lipoprotein Cholesterol; eGFR, estimated Glomerular Filtration Rate; TSH, Thyroid Stimulating Hormone.
| Variables | Total (n = 405) | No_AF (n = 319) | AF (n = 86) | p-value |
| RAD anteroposterior (cm) | 3.3 (3.0, 3.9) | 3.3 (2.9, 3.7) | 3.7 (3.2, 4.6) | |
| LAD anteroposterior (cm) | 3.3 (2.8, 3.9) | 3.2 (2.6, 3.6) | 4.2 (3.4, 4.6) | |
| LVWT (cm) | 1.0 (0.8, 1.2) | 1.0 (0.8, 1.2) | 0.9 (0.7, 1.17) | 0.103 |
| IVST (cm) | 1.9 (1.6, 2.3) | 1.9 (1.6, 2.2) | 2.1 (1.7, 2.3) | 0.017 |
| LVEDV (mL) | 130.26 (112.18, 155.93) | 134.98 (114.1, 161.79) | 122.34 (107.02, 142.07) | |
| LVESV (mL) | 53.94 (41.05, 67.95) | 53.94 (40.84, 67.28) | 54.30 (42.56, 68.64) | 0.682 |
| LVEF | 58.69 (51.34, 64.51) | 59.39 (53.53, 64.96) | 53.97 (46.36, 61.24) | |
| LVCI (L/min/m2) | 2.74 (2.26, 3.27) | 2.77 (2.30, 3.33) | 2.61 (2.18, 2.92) | 0.004 |
| RVEDV (mL) | 112.12 (94.43, 136.40) | 117.06 (95.30, 137.80) | 103.18 (88.75, 127.76) | 0.008 |
| RVESV (mL) | 57.07 (44.23, 73.80) | 56.82 (44.26, 73.47) | 58.94 (44.32, 74.22) | 0.786 |
| RVEF | 50.11 (37.66, 58.31) | 51.32 (39.34, 58.90) | 46.52 (32.41, 53.89) | 0.004 |
| RVCO (L/min) | 3.69 (2.67, 4.78) | 3.81 (2.80, 5.01) | 3.26 (2.41, 4.26) | 0.008 |
| RVCI (L/min/m2) | 2.05 (1.47, 2.62) | 2.07 (1.51, 2.66) | 1.92 (1.30, 2.39) | 0.031 |
| MAPSE inferior (mm) | 9.88 |
10.44 |
7.81 |
|
| MAPSE anterior (mm) | 9.45 (7.00, 11.54) | 9.81 (7.58, 11.90) | 7.33 (5.44, 9.84) | |
| MAPSE lateral (mm) | 12.75 (10.02, 15.03) | 13.20 (10.87, 15.39) | 10.61 (8.65, 13.15) | |
| MAPSE septal (mm) | 8.93 |
9.50 |
6.83 |
|
| TAPSE (mm) | 17.77 (13.72, 21.62) | 18.60 (15.30, 22.36) | 13.45 (10.06, 17.85) | |
| LVGLS | –11.9 (–14.6, –9.0) | –12.47 (–14.80, –9.50) | –9.75 (–12.38, –7.12) | |
| LVGRS | 27.8 |
28.54 |
25.05 |
0.003 |
| RVGCS | –13.44 (–16.20, –10.47) | –13.55 (–16.39, –10.81) | –12.47 (–15.03, –9.38) | 0.029 |
| RVGLS | –23.51 (–26.62, –18.58) | –23.87 (–27.05, –19.22) | –20.70 (–24.97, –16.63) | 0.001 |
| MaxLAV (mL) | 83.3 (62.41, 109.47) | 76.53 (59.68, 99.03) | 115.7 (83.14, 151.93) | |
| MaxLAA (cm2) | 24.38 (20.49, 29.25) | 23.15 (19.89, 27.45) | 30.63 (25.18, 35.69) | |
| LAEF | 49.74 (39.82, 57.91) | 52.49 (45.25, 59.37) | 35.07 (21.93, 45.12) | |
| MinRAA (cm2) | 11.50 (9.05, 14.46) | 11.19 (8.66, 13.54) | 14.36 (10.87, 19.35) | |
| MaxRAV (mL) | 57.52 (44.98, 73.92) | 55.05 (43.66, 72.17) | 66.95 (53.72, 84.22) | |
| MaxRAA (cm2) | 19.02 (16.56, 22.60) | 18.68 (15.99, 21.97) | 20.97 (18.27, 25.31) | |
| RAEF | 48.56 (39.68, 57.27) | 50.28 (41.08, 58.43) | 42.39 (30.50, 49.53) |
LV, Left Ventricle; RV, Right Ventricle; LA, Left Atrium; RA, Right Atrium; RAD, Right Atrial Diameter; LAD, Left Atrial Diameter; LVWT, Left Ventricular Wall Thickness; IVST, Interventricular Septum Thickness; EDV, End-Diastolic Volume; ESV, End-Systolic Volume; EF, Ejection Fractions; CO, Cardiac Output; CI, Cardiac Index; MAPSE, Mitral Annular Plane Systolic Excursion; TAPSE, Tricuspid Annular Plane Systolic Excursion; GCS, Global Circumferential Strain; GLS, Global Longitudinal Strain; GRS, Global Radial Strain; LAV, LA Volume; LAA, LA Area; RAV, RA Volume; RAA, RA Area; LVESV, Left Ventricular End-Systolic Volume.
To further address the issue of multicollinearity, the research employed LASSO
regression for feature selection in the training dataset. Through 10-fold
cross-validation (K = 10), the optimal regularization parameter (
| Variable | OR | 95% CI | p-value |
| Age | 1.023 | 0.993–1.056 | 0.143 |
| eGFR | 0.991 | 0.976–1.006 | 0.239 |
| RAD Anteroposterior | 1.819 | 1.130–3.007 | 0.016 |
| LVESV | 0.978 | 0.963–0.991 | 0.002 |
| MAPSE Septal | 0.850 | 0.736–0.976 | 0.023 |
| TAPSE | 0.919 | 0.852–0.987 | 0.022 |
| MaxLAV | 1.016 | 1.004–1.029 | 0.010 |
| LAEF | 0.965 | 0.929–1.002 | 0.067 |
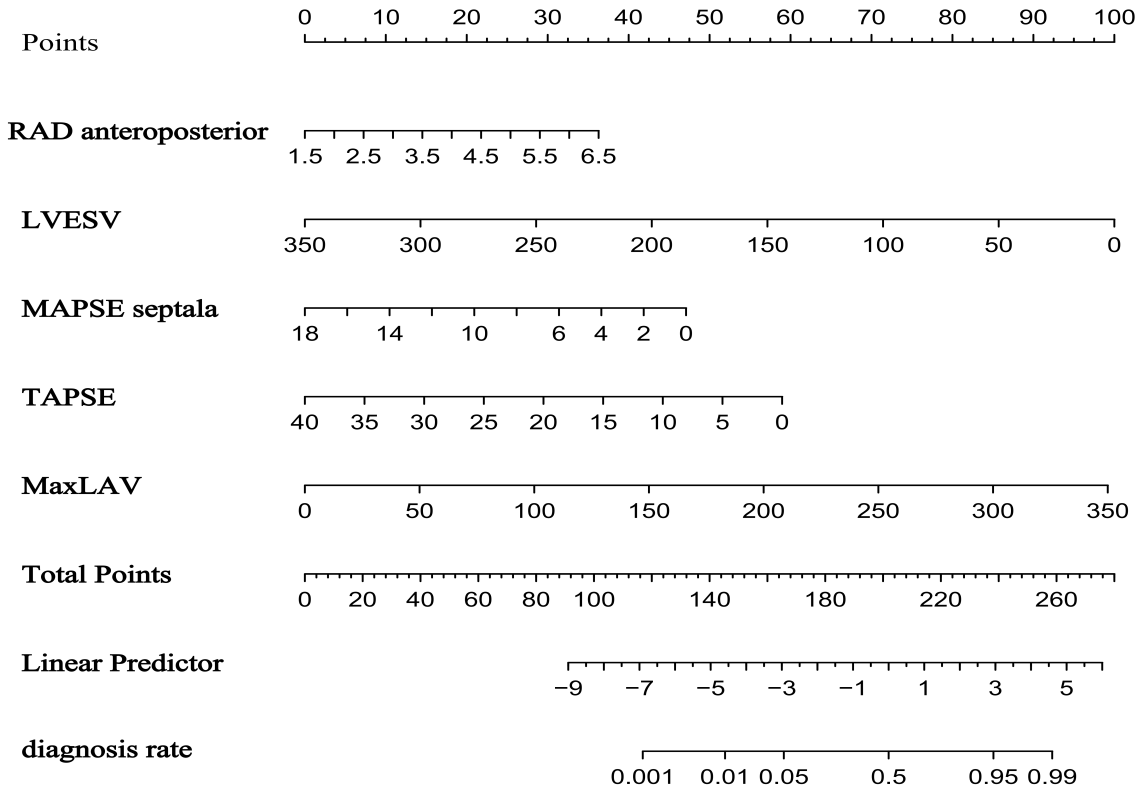 Fig. 3.
Nomogram for predicting atrial fibrillation risk in hypertrophic cardiomyopathy based on the training set.
The model demonstrated robust discriminative ability, with a AUC/C-index of 0.850 in the training set and an AUC of 0.861 (95% CI: 0.771–0.952) in the validation set (Fig. 4a). Calibration was assessed using the Hosmer-Lemeshow test, yielding non-significant p-values for both the training (p = 0.944) and validation (p = 0.836) sets, indicating excellent agreement between predicted and observed probabilities. Calibration curves closely approximated the ideal diagonal line (Fig. 5a,b). DCA revealed that the model provided net clinical benefit across a wide range of threshold probabilities (Fig. 6a,b). Specifically, the model outperformed both the “treat-all” and “treat-none” strategies within the threshold range of 10%–65%, suggesting optimal clinical utility for patients with moderate pretest probability. These findings underscore the model’s potential to inform personalized clinical decision-making.
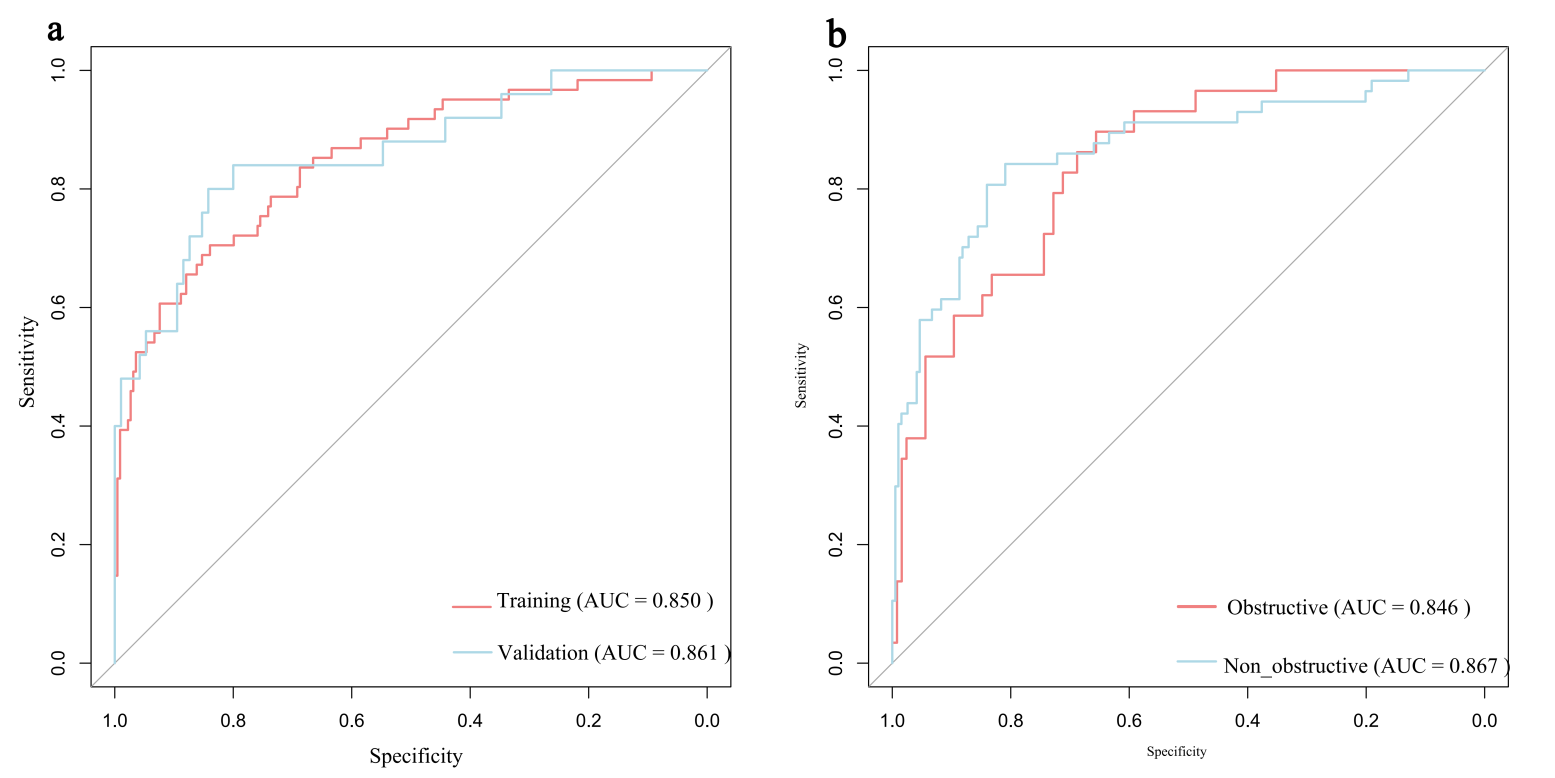 Fig. 4.
ROC curves for predicting AF risk in HCM. (a) ROC curve in the training set and the validation set. (b) ROC curve in the HOCM cohort and the HNCM cohort. HOCM, Hypertrophic Obstructive Cardiomyopathy; HNCM, Hypertrophic Non-Obstructive Cardiomyopathy.
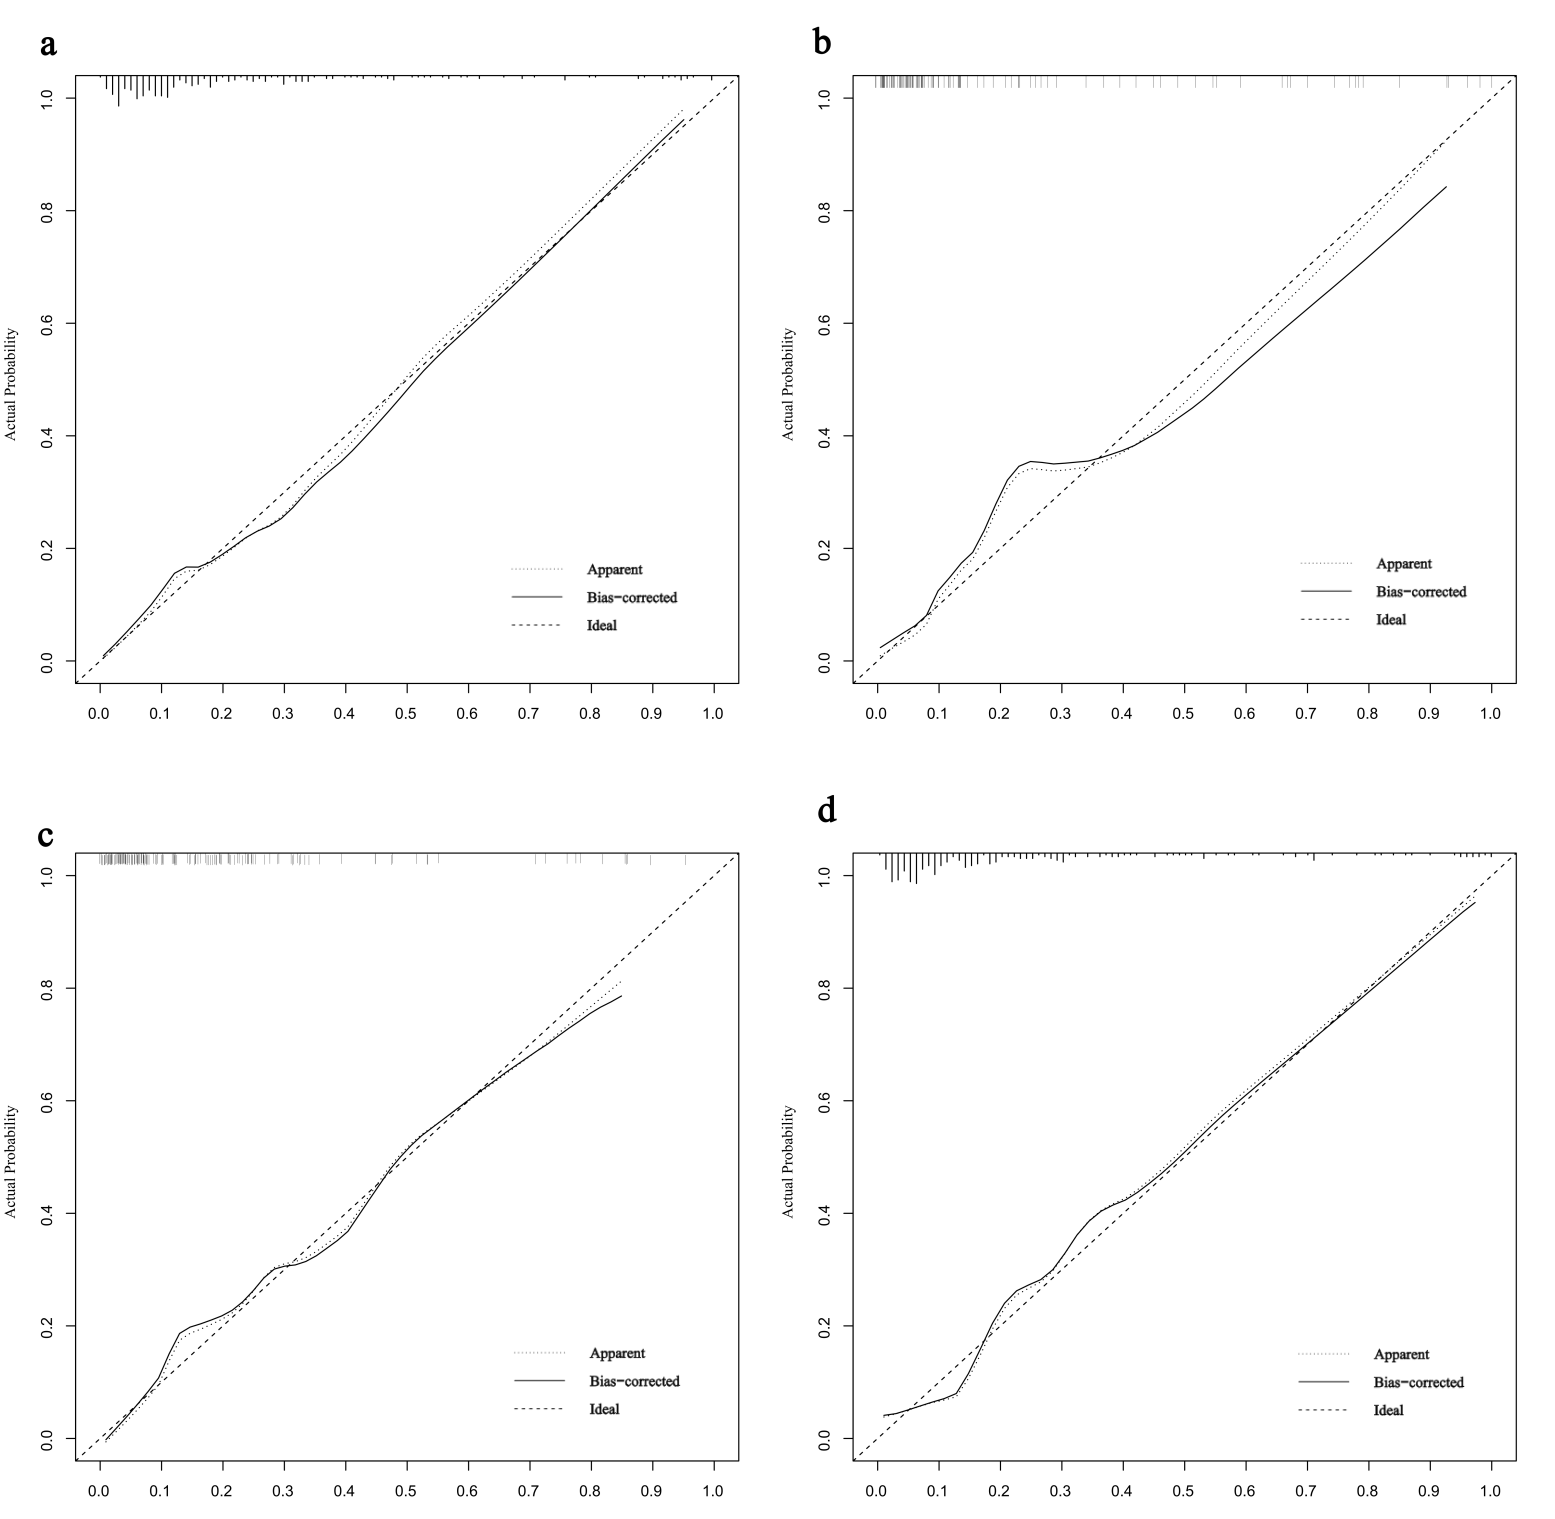 Fig. 5.
Calibration curves for predicting AF risk in HCM. (a) Calibration curve in the training set. (b) Calibration curve in the validation set. (c) Calibration curve in the HOCM cohort. (d) Calibration curve in the HNCM cohort.
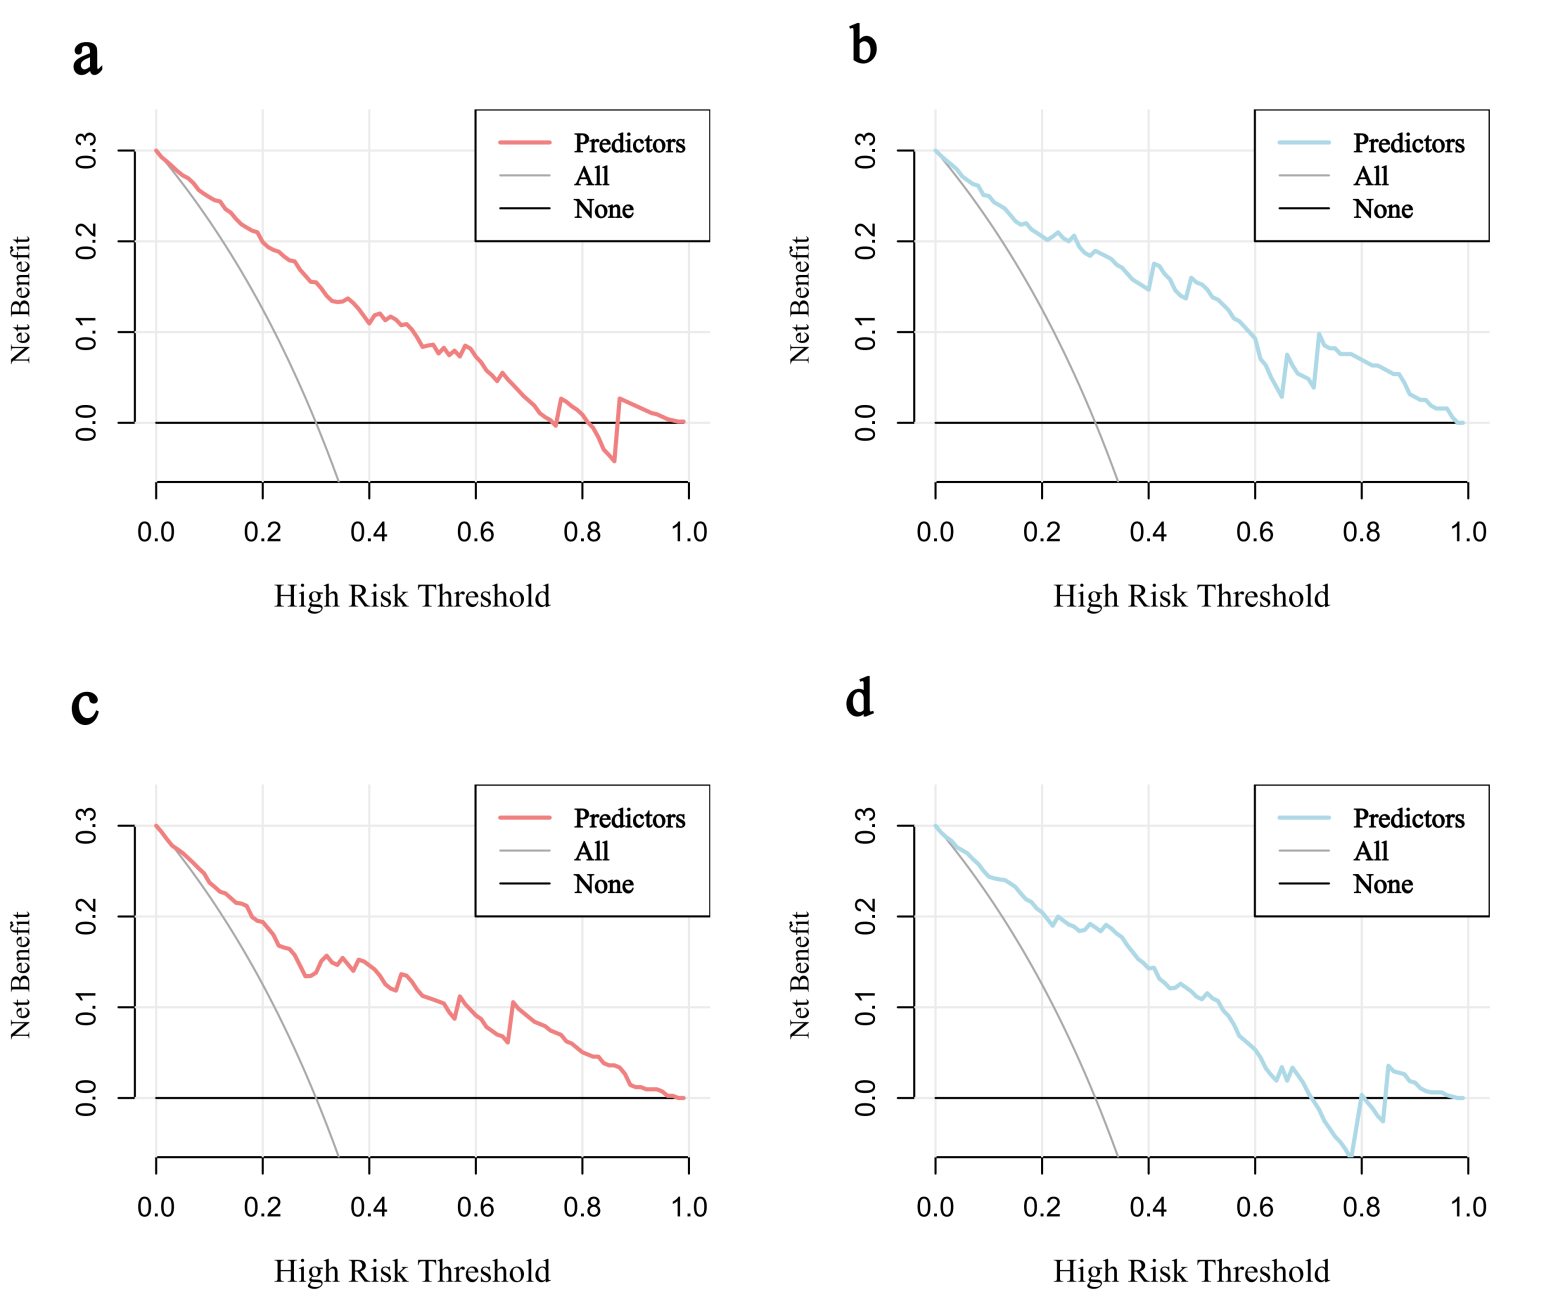 Fig. 6.
Decision curves for predicting AF risk in HCM. (a) Decision curve in the training set. (b) Decision curve in the validation set. (c) Decision curve in the HOCM cohort. (d) Decision curve in the HNCM cohort.
This study categorized patients into HOCM (n = 154, 38%) and HNCM (n = 251, 62%) based on left ventricular outflow tract obstruction. The HNCM group did not exhibit a significantly higher incidence of AF than the HOCM group (22.7% vs. 18.8%, p = 0.423 (Supplementary Table 5)). Additionally, given the potential disparities in anatomical structure and hemodynamics between obstructive and non-obstructive HCM, significant differences were observed between the two groups in baseline and CMR parameter characteristics, such as MaxLAV (p = 0.006) (Supplementary Table 5).
LASSO regression was employed for variable screening in HOCM and HNCM. The
optimal
HOCM: MAPSE septal (OR = 0.844, 95% CI: 0.710–0.991, p = 0.044) and
LAEF (OR = 0.900, 95% CI: 0.856–0.940, p
| Cohort | Variable | OR | 95% CI | p-value |
| HOCM | MAPSE Septal | 0.844 | 0.710–0.991 | 0.044 |
| LAEF | 0.900 | 0.856–0.940 | ||
| HNCM | RAD Anteroposterior | 1.315 | 0.783–2.229 | 0.303 |
| LAD Anteroposterior | 1.164 | 0.562–2.412 | 0.682 | |
| MAPSE Septal | 0.838 | 0.718–0.971 | 0.022 | |
| MaxLAV | 1.018 | 1.002–1.036 | 0.042 | |
| LAEF | 0.968 | 0.927–1.009 | 0.122 | |
| RAEF | 0.960 | 0.926–0.992 | 0.020 |
HNCM: MAPSE septal (OR = 0.838, 95% CI: 0.718–0.976, p = 0.022), MaxLAV (OR = 1.018, 95% CI: 1.002–1.036, p = 0.042), and right atrial ejection fraction (RAEF, OR = 0.960, 95% CI: 0.926–0.992, p = 0.020) (Table 4).
Nomograms were constructed for HOCM (Fig. 7a) and HNCM (Fig. 7b), yielding AUCs of 0.846 and 0.867, respectively (ROC curves shown in Fig. 4b). Calibration curves verified close alignment between predicted and observed probabilities (Fig. 5c,d). DCA revealed that subtype-specific models conferred greater net clinical benefit across their respective risk thresholds compared to “treat-all” or “treat-none” strategies (Fig. 6c,d).
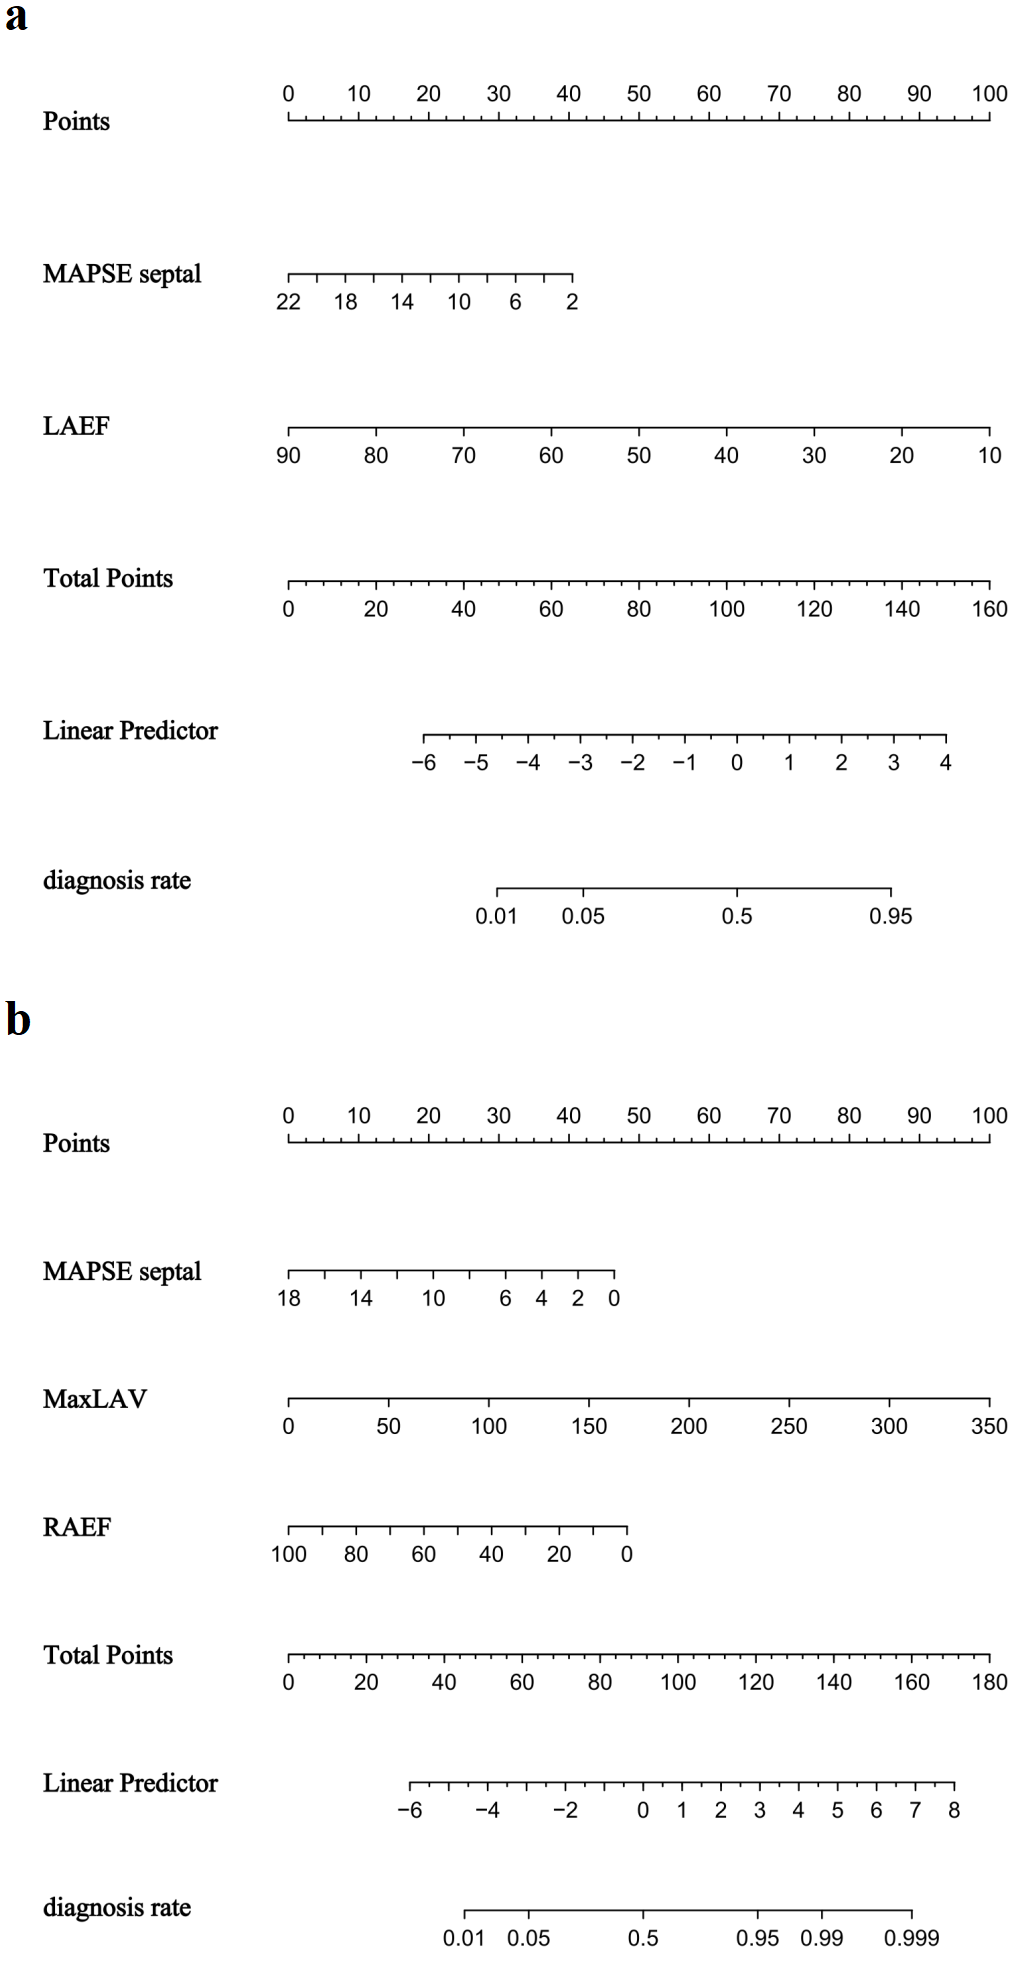 Fig. 7.
Nomogram for predicting atrial fibrillation risk in hypertrophic cardiomyopathy. (a) HOCM cohort. (b) HNCM cohort.
This study integrated CMR parameters and clinical data to develop an AF prediction model for HCM patients, overcoming the limitations of traditional echocardiography-based models. The model showed excellent performance in the validation set (AUC = 0.861), confirming that CMR-derived myocardial strain and atrial remodeling indices can detect early systolic dysfunction missed by LVEF. Moreover, CMR provides superior tissue characterization, including fibrosis assessment via LGE, which is not feasible with echocardiography. This allows for earlier identification of patients at high risk for AF, even before overt clinical symptoms or ECG changes occur. By differentiating between HOCM and HNCM subtypes, the study revealed distinct AF pathological mechanisms driven by hemodynamic heterogeneity. These findings establish CMR as central to precise AF monitoring in HCM and provide imaging evidence for targeted rhythm control strategies. Thus, incorporating CMR into routine HCM workup can facilitate proactive management and personalized intervention, ultimately improving clinical outcomes.
In recent years, the field of AF risk prediction in cardiomyopathy has witnessed substantial advancements. Multiple studies [28, 29, 30, 31] highlight the pivotal role of CMR in evaluating left heart structure/function, predicting AF onset, and guiding clinical management. Marstrand et al. [32] have confirmed that reduced left ventricular ejection fraction (LVEF) is strongly associated with increased AF risk in HCM, a finding mechanistically linked to hemodynamic imbalance and atrial remodeling secondary to systolic dysfunction. Additionally, Schmidt et al. [33] reveal a correlation between LVESV and AF via Mendelian randomization analysis. Building on these findings, our study introduced LVESV as a sensitive marker of early systolic reserve in HCM, overcoming LVEF’s limitation of relying on dynamic ejection fraction changes to enable earlier detection of systolic dysfunction. Notably, left atrial enlargement serves as a key prognostic factor for AF recurrence after ablation, with MaxLAV acting as an independent predictor (OR = 1.016, 95% CI: 1.004–1.029, p = 0.010) [13]—consistent with den Uijl et al. [34], who identify left atrial volume (LA) as the strongest independent predictor of AF recurrence (OR = 1.019, p = 0.018). By integrating LVESV with atrial remodeling indices, our study addresses a critical gap in traditional models (e.g., HCM-AF calculator) [4, 5] by incorporating CMR-derived ventricular-atrial coupling markers, thus providing a more comprehensive AF risk assessment framework.
The characteristic asymmetric left ventricular hypertrophy in HCM significantly
impairs interventricular septum function. As a core parameter for evaluating left
ventricular longitudinal systolic function [14], MAPSE septal exhibits distinct
abnormalities in HCM. Doesch et al. [15] have demonstrated that septal
MAPSE is significantly lower in HCM patients compared to healthy controls (1.57
This study innovatively integrated RAD anteroposterior and TAPSE into the
predictive model, highlighting the right heart’s independent role in AF
pathogenesis. Prabhu et al. [35] show that electrical/structural
remodeling in the RA correlates with LA remodeling in AF patients, supporting
interatrial crosstalk. Our data showed that RAD anteroposterior was a significant
AF predictor (OR = 1.82, 95% CI 1.13–3.01, p = 0.016), while TAPSE
independently predicted AF risk (OR = 0.919, 95% CI 0.852–0.987, p =
0.022). Mechanistically, reduced TAPSE reflects impaired right
ventricular-pulmonary artery (RV-PA) coupling, which exacerbates RA pressure load
and triggers AF [36]—a mechanism supported by a retrospective study showing
that lower TAPSE/PASP ratios increase AF risk [19]. Doesch et al. [15]
further validate the association between decreased TAPSE and right atrial
dilation in AF patients. This integration of right heart parameters confirms the
RV-PA coupling
HOCM patients exhibit significantly restricted left ventricular diastolic
function due to elevated left ventricular outflow tract gradient (LVOTG
The HCM-AF Risk Score we developed offers clinicians a straightforward tool to stratify AF risk in HCM patients during standard CMR assessments. By integrating parameters already routinely captured in most CMR protocols—such as LVESV and RAEF—this score requires no extra scanning time or additional costs to implement, enhancing its real-world usability. We see particular value in applying this score across three key clinical scenarios: First, it could help flag high-risk patients who might benefit from more rigorous rhythm monitoring (e.g., prolonged Holter monitoring or implantable loop recorders) to catch AF earlier. Second, it may support shared decision-making when anticoagulation prophylaxis is being considered for patients with ambiguous clinical indications. Third, it could refine pre-procedural risk assessment ahead of surgeries like myectomy, where undiagnosed AF might significantly influence perioperative care plans. Of course, broader adoption hinges on future validation. Prospective testing in multi-center cohorts and research exploring how this score impacts actual patient outcomes will be critical to integrating it into routine clinical practice.
First, the study’s single-center retrospective design may limit the external validity of the conclusions. Further validation through multicenter prospective studies is required to confirm generalizability. Second, the absence of long-term follow-up data means that the model’s clinical prognostic value remains unestablished. Future studies incorporating longitudinal follow-up are necessary to evaluate its predictive utility for clinical outcomes. Third, the exclusion of patients with pre-existing AF and the focus on in-hospital new-onset AF may limit the generalizability of our findings to the broader HCM population with prevalent or historical AF. Fourth, this study did not include data on mitral regurgitation or tricuspid regurgitation, which are known to be associated with atrial fibrillation and are particularly relevant in obstructive HCM due to their impact on left atrial remodeling and hemodynamic load. Future studies incorporating valvular assessment would enhance the comprehensiveness of AF risk prediction models.
This study developed and validated a novel CMR-based risk score that effectively predicts the risk of incident atrial fibrillation in patients with HCM. Independent predictors identified include RAD Anteroposterior, LVESV, MAPSE Septal, TAPSE, and MaxLAV. The model exhibited robust predictive performance in both the training and validation cohorts, with AUC values of 0.850 and 0.861, respectively. Subgroup analysis further revealed mechanistic heterogeneity in AF development between HOCM and HNCM. These findings establish an imaging-based framework for individualized AF risk stratification in HCM patients, offering potential clinical utility for early intervention and personalized management.
AF, Atrial fibrillation; HCM, Hypertrophic cardiomyopathy; CMR, Cardiac magnetic resonance; HOCM, Obstructive hypertrophic cardiomyopathy; HNCM, Non-obstructive hypertrophic cardiomyopathy; RAD, Right atrial diameter; LVESV, Left ventricular end-systolic volume; MAPSE, Mitral annular plane systolic excursion; TAPSE, Tricuspid annular plane systolic excursion; MaxLAV, Maximum left atrial volume; LAEF, Left atrial ejection fraction; RAEF, Right atrial ejection fraction.
The datasets used in this study are available from the corresponding author upon reasonable request.
AS, JX and DM conceived and designed the study. AS performed all CMR scans and data verification. JX developed the statistical models and performed bootstrap validation. QX collected clinical data and established quality control procedures. HY screened patients and maintained the clinical database. JL conducted laboratory tests and data cleaning. XY performed clinical assessments and endpoint adjudication. YL designed the statistical analysis plan and optimized modeling. DM supervised the entire research process and finalized the manuscript. All authors contributed to manuscript editing, read and approved the final version, participated sufficiently in the work and agreed to be accountable for all aspects of the work.
The study was carried out in accordance with the guidelines of the Declaration of Helsinki and approved by the Institutional Ethics Committee of Nanjing Drum Tower Hospital (No. 2024-551-01). Informed consent was waived due to the retrospective design.
We thank the radiology department of Nanjing Drum Tower Hospital for technical support.
This research was funded by the National Natural Science Foundation of China, grant number 82272065; Medical Research Project of Jiangsu Health Commission in 2022, grant number M2022066; The Nanjing Medical Science and technique Development Foundation, grant number ZKX23019; The 15th special supported project of China Postdoctoral Science Foundation, grant number 2022T150317; Nanjing Gulou Hospital New Technology Development Fund, grant numbers XJSFZJJ202026 and XJSFZLX202114.
Xiuzheng Yue is an employee of Philips Healthcare. However, the company had no role in the handling or conduct of the study. The authors had full access to all data in the study and take full responsibility for the integrity of the data and the accuracy of the data analysis.
Supplementary material associated with this article can be found, in the online version, at https://doi.org/10.31083/RCM45267.
References
Publisher’s Note: IMR Press stays neutral with regard to jurisdictional claims in published maps and institutional affiliations.