


 , Zi-han Lv 1,†, Yi-fei Wang 2, Yin-dong Sun 2, Tian Xu 2, Wei You 2, Pei-na Meng 2, Xiang-qi Wu 2, Zhi-ming Wu 2, Hai-bo Jia 1,*
 , Fei Ye 2
1 Department of Geriatrics, Nanjing First Hospital, Nanjing Medical University, 210006 Nanjing, Jiangsu, China
2 Department of Cardiology, Nanjing First Hospital, Nanjing Medical University, 210006 Nanjing, Jiangsu, China
†These authors contributed equally.
Abstract
The clinical value of remnant cholesterol (RC) in patients with in-stent restenosis (ISR) who undergo percutaneous coronary intervention (PCI) is unknown. Therefore, this study aimed to clarify the association between increased RC levels and clinical prognosis in patients with ISR.
This retrospective study enrolled 836 patients diagnosed with ISR. The study population was divided into four quartiles (Q1–Q4) according to median RC levels. Using a multivariate Cox proportional hazards model and Kaplan–Meier (KM) curve, the association between RC levels and the study endpoint, defined as target-vessel failure (TVF) within 3 years after PCI, was investigated. A discordance analysis was also performed with several definitions.
The KM curve showed an increased risk of TVF with elevated RC levels (p < 0.001). After adjustment, the RC level was identified as an independent predictor of TVF, regardless of whether the metric was considered as a continuous or categorical variable (hazard ratio (HR) = 1.37, 95% confidence interval (CI): 1.16–1.62; p < 0.001; HR = 3.43, 95% CI: 1.85–6.36; p < 0.001). Subgroup analysis showed that the RC-related TVF risk was more pronounced in patients with low-density lipoprotein cholesterol (LDL-C) <1.8 mmol/L (2.75 for each one standard deviation (SD) increase, 95% CI: 1.66–4.55; p for interaction < 0.001). In the discordance analysis, individuals with discordantly high RC levels rather than high LDL-C levels had an increased risk of TVF (HR = 2.02, 95% CI: 1.33–3.07; p < 0.001).
An increased RC level was associated with an elevated risk of TVF in patients with ISR who underwent PCI. Further, the RC-related risk was more pronounced in patients with LDL-C levels <1.8 mmol/L.
Keywords
- remnant cholesterol
- percutaneous coronary intervention
- in-stent restenosis
Arteriosclerotic cardiovascular disease (ASCVD) remains the primary cause of cardiac mortality worldwide [1]. Early revascularization and pharmacotherapy have improved clinical prognosis among patients with coronary artery disease [2]. As a stent failure event, in-stent restenosis (ISR) still occurs at an annual incidence rate of 1–2% even with the utilization of the new generation of drug-eluting stents (DES) [3, 4]. Compared with de novo lesions, patients with ISR have an increased cardiovascular risk, such as a higher incidence of post-percutaneous coronary intervention (PCI) myocardial infarction (MI) and repetitive target vessel revascularization (TVR) [5, 6]. Thus, risk classification and management in this population are important.
As one of the cornerstone treatments for ASCVD, Drugs that aim to reduce low-density lipoprotein cholesterol (LDL-C) have demonstrated considerable effects in stabilizing plaques and promoting plaque regression [7]. However, there are still several patients who experience residual risks for cardiac events even with adequate LDL-C control [8, 9]. Owing to this, researchers have recently shifted to non-LDL-C control because of the persistent residual cardiac risk, even in individuals who have undergone various lipid-lowering therapies [10, 11, 12, 13, 14].
Remnant cholesterol (RC), the cholesterol content within triglyceride-rich lipoproteins, has been established as a risk factor for ASCVD in primary or secondary prevention [15, 16]. In patients with ISR, the clinical value of RC levels on cardiovascular outcomes has not been clarified. Therefore, this study aimed to assess the association between increased RC levels and cardiac events among patients with ISR who underwent re-PCI and to evaluate its independent influence among different LDL-C levels.
This retrospective study included patients diagnosed with DES-ISR at Nanjing
First Hospital from January 2016 to February 2021. ISR was defined as a reduction
of
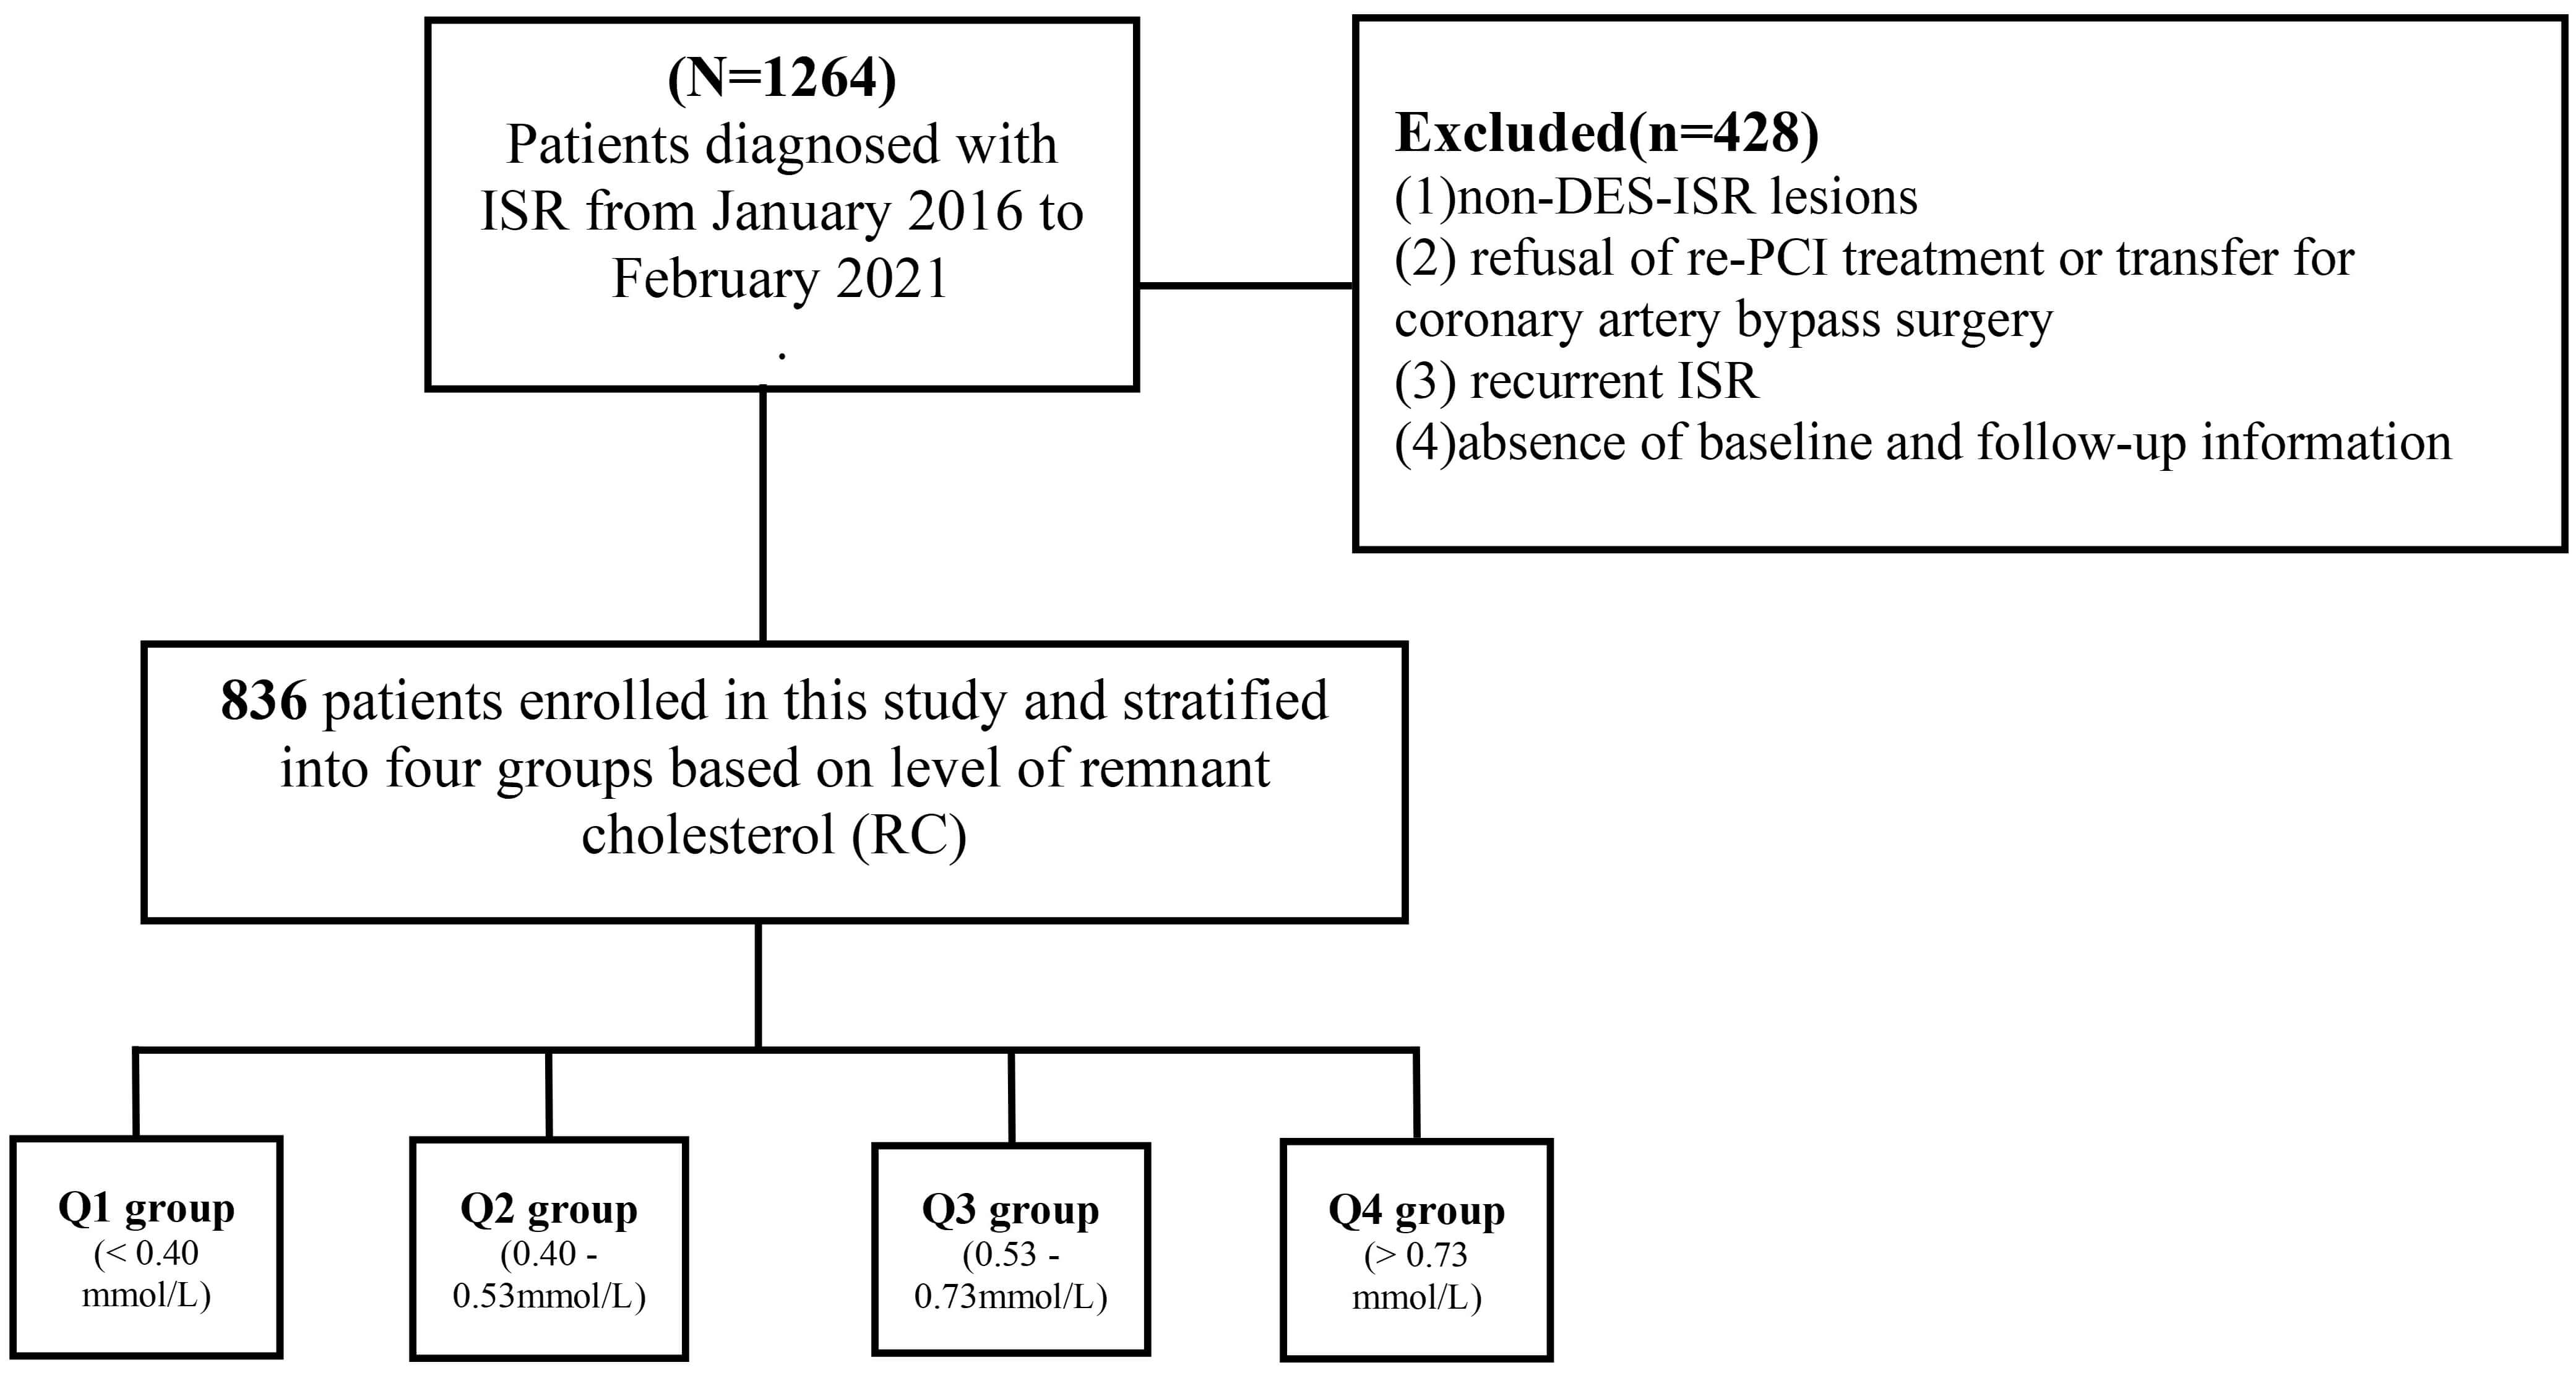 Fig. 1.
Study flowchart. Abbreviations: DCB, drug-coated balloon; DES, drug-eluting stent; ISR, in-stent restenosis; RC, remnant cholesterol; PCI, percutaneous coronary intervention.
Demographic and clinical characteristics were retrieved from the electronic
medical system at Nanjing First Hospital. Fasting venous blood samples were
procured at fixed time intervals and then analyzed at the central laboratory. The
level of RC was calculated as follows: RC level (mmol/L) = total cholesterol (TC)
level (mmol/L) minus high-density lipoprotein cholesterol (HDL-C) level (mmol/L)
minus LDL-C level (mmol/L) [19]. Body mass index (BMI) was defined as weight
(kg)/height (m2). Patients with a history of type 2 diabetes mellitus,
receiving hypoglycemic treatment, or individuals presenting with typical symptoms
of diabetes, such as fasting blood glucose
To further investigate the RC-associated risk beyond LDL-C level, this study
conducted discordance analyses. First, discordance was defined as a difference
greater than 10 percentile units (RC percentile minus LDL-C percentile). The
study population was then divided into: (1) RC percentile
The primary outcome of this research was target-vessel failure (TVF) during the follow-up period after PCI, which was defined as a composite of MI, TVR, and all-cause mortality [24]. The secondary outcome included each component of the primary outcome. MI was identified based on the third Universal Definition of Myocardial Infarction [25]. TVR was characterized as revascularization that was either angina/ischemia-induced or clinically motivated, including PCI or coronary artery bypass grafting [26, 27]. Clinical follow-up was conducted at 3–6 months intervals throughout the 3-year follow-up period. This work was carried out by independent clinical research coordinators who remained blinded to the study objective and research data.
Continuous variables that follow a normal distribution are presented in the form
of means
This study enrolled 836 individuals diagnosed with ISR. The average age was
66.22
| Variables | Total (n = 836) | Q1 (n = 209) | Q2 (n = 209) | Q3 (n = 209) | Q4 (n = 209) | p | ||
| Age | 66.22 |
65.98 |
66.61 |
67.16 |
65.14 |
0.236 | ||
| BMI | 25.09 |
24.79 |
24.71 |
25.18 |
25.70 |
0.007 | ||
| Male, n (%) | 662 (79.2) | 185 (88.5) | 164 (78.5) | 161 (77.0) | 152 (72.7) | |||
| Disease history | ||||||||
| Hypertension, n (%) | 623 (74.5) | 156 (74.6) | 154 (73.7) | 155 (74.2) | 158 (75.6) | 0.974 | ||
| Diabetes, n (%) | 318 (38.0) | 69 (33.0) | 80 (38.3) | 63 (30.1) | 106 (50.7) | 0.001 | ||
| Smoking, n (%) | 421 (50.4) | 105 (50.2) | 102 (48.8) | 106 (50.7) | 108 (51.7) | 0.996 | ||
| Diagnosis | ||||||||
| Stable angina | 138 (16.5) | 33 (15.8) | 38 (18.2) | 35 (16.8) | 32 (15.3) | 0.866 | ||
| Unstable angina | 532 (63.6) | 150 (71.8) | 129 (61.7) | 138 (66.0) | 115 (55.0) | 0.004 | ||
| Myocardial infarction | 166 (19.9) | 26 (12.4) | 42 (20.1) | 36 (17.2) | 62 (29.7) | |||
| Lesion and procedure characteristics | ||||||||
| Target lesion location, n (%) | 0.054 | |||||||
| LAD | 497 (59.5) | 116 (55.5) | 144 (68.9) | 120 (57.4) | 117 (56.0) | |||
| LCX | 88 (10.5) | 27 (12.9) | 19 (9.1) | 19 (9.1) | 23 (11.0) | |||
| RCA | 251 (30.0) | 66 (31.6) | 46 (22.0) | 70 (33.5) | 69 (33.0) | |||
| Average stent diameters, mm | 2.93 |
2.89 |
2.96 |
2.90 |
2.98 |
0.325 | ||
| Total length of stents, mm | 31.00 (18.00, 54.00) | 29.00 (18.00, 47.00) | 30.00 (18.00, 52.00) | 30.00 (18.00, 52.00) | 36.00 (18.00, 56.00) | 0.067 | ||
| Laboratory tests | ||||||||
| RC, mmol/L | 0.54 (0.40, 0.73) | 0.31 (0.25, 0.35) | 0.47 (0.44, 0.50) | 0.62 (0.58, 0.67) | 0.94 (0.81, 1.16) | |||
| TC, mmol/L | 3.36 (2.85, 4.08) | 2.84 (2.56, 3.37) | 3.13 (2.76, 3.56) | 3.49 (3.04, 4.10) | 4.30 (3.66, 5.15) | |||
| LDL-C, mmol/L | 1.78 (1.40, 2.39) | 1.59 (1.26, 2.01) | 1.69 (1.32, 2.06) | 1.83 (1.44, 2.42) | 2.32 (1.76, 3.04) | |||
| HDL-C, mmol/L | 0.94 (0.81, 1.10) | 0.96 (0.84, 1.16) | 0.95 (0.83, 1.12) | 0.96 (0.81, 1.10) | 0.91 (0.76, 1.03) | 0.007 | ||
| Triglycerides, mmol/L | 1.34 (0.96, 1.85) | 0.92 (0.74, 1.16) | 1.20 (0.93, 1.48) | 1.40 (1.10, 1.69) | 2.27 (1.77, 3.09) | |||
| WBC, 109/L | 6.56 (5.44, 7.83) | 6.30 (5.37, 7.35) | 6.69 (5.62, 8.14) | 6.52 (5.37, 7.79) | 6.68 (5.47, 8.07) | 0.083 | ||
| RBC, 1012/L | 4.40 (4.04, 4.77) | 4.45 (4.11, 4.76) | 4.37 (4.06, 4.72) | 4.45 (4.04, 4.80) | 4.38 (3.97, 4.80) | 0.595 | ||
| FBG, mmol/L | 5.61 (4.94, 7.14) | 5.39 (4.80, 6.81) | 5.43 (4.89, 6.94) | 5.43 (4.89, 6.59) | 6.29 (5.29, 8.84) | |||
| NT-pro BNP | 311.40 (100.00, 969.00) | 246.14 (100.00, 536.03) | 351.60 (129.94, 877.47) | 429.85 (145.98, 1971.01) | 279.77 (100.00, 969.00) | 0.001 | ||
| Scr | 75.45 (63.38, 92.00) | 75.00 (64.00, 87.00) | 72.00 (62.00, 87.00) | 79.00 (65.10, 96.00) | 77.00 (64.00, 96.00) | 0.008 | ||
| Meditation | ||||||||
| Statin, n (%) | 821 (98.2) | 205 (98.1) | 208 (99.5) | 207 (99.0) | 201 (96.2) | 0.081 | ||
| Ezetimibe, n (%) | 319 (38.2) | 66 (31.6) | 88 (42.1) | 84 (40.2) | 81 (38.8) | 0.132 | ||
| PCSK9-inhibitor, n (%) | 38 (4.6) | 12 (5.7) | 8 (3.8) | 6 (2.9) | 12 (5.7) | 0.395 | ||
BMI, body mass index; FBG, fasting Blood Glucose; HDL-C, high-density lipoprotein cholesterol; LAD, left anterior descending; LCX, left circumflex; LDL-C, low-density lipoprotein cholesterol; PCSK9, proprotein convertase subtilisin kexin/type 9; RBC, red blood cell; RC, remnant cholesterol; RCA, right coronary artery; Scr, Serum creatinine; TC, Total cholesterol; WBC, white blood cell; NT-pro BNP, N-terminal pro-B-type natriuretic peptide.
Over the 3 years of follow-up, 147 (17.6%) patients experienced TVF. The KM
curve showed significant differences among the four quartiles (Q1–Q4), with
individuals in the highest quartile having an elevated incidence of TVF compared
with others (10.5% vs. 16.3% vs. 17.7% vs. 25.8%; p
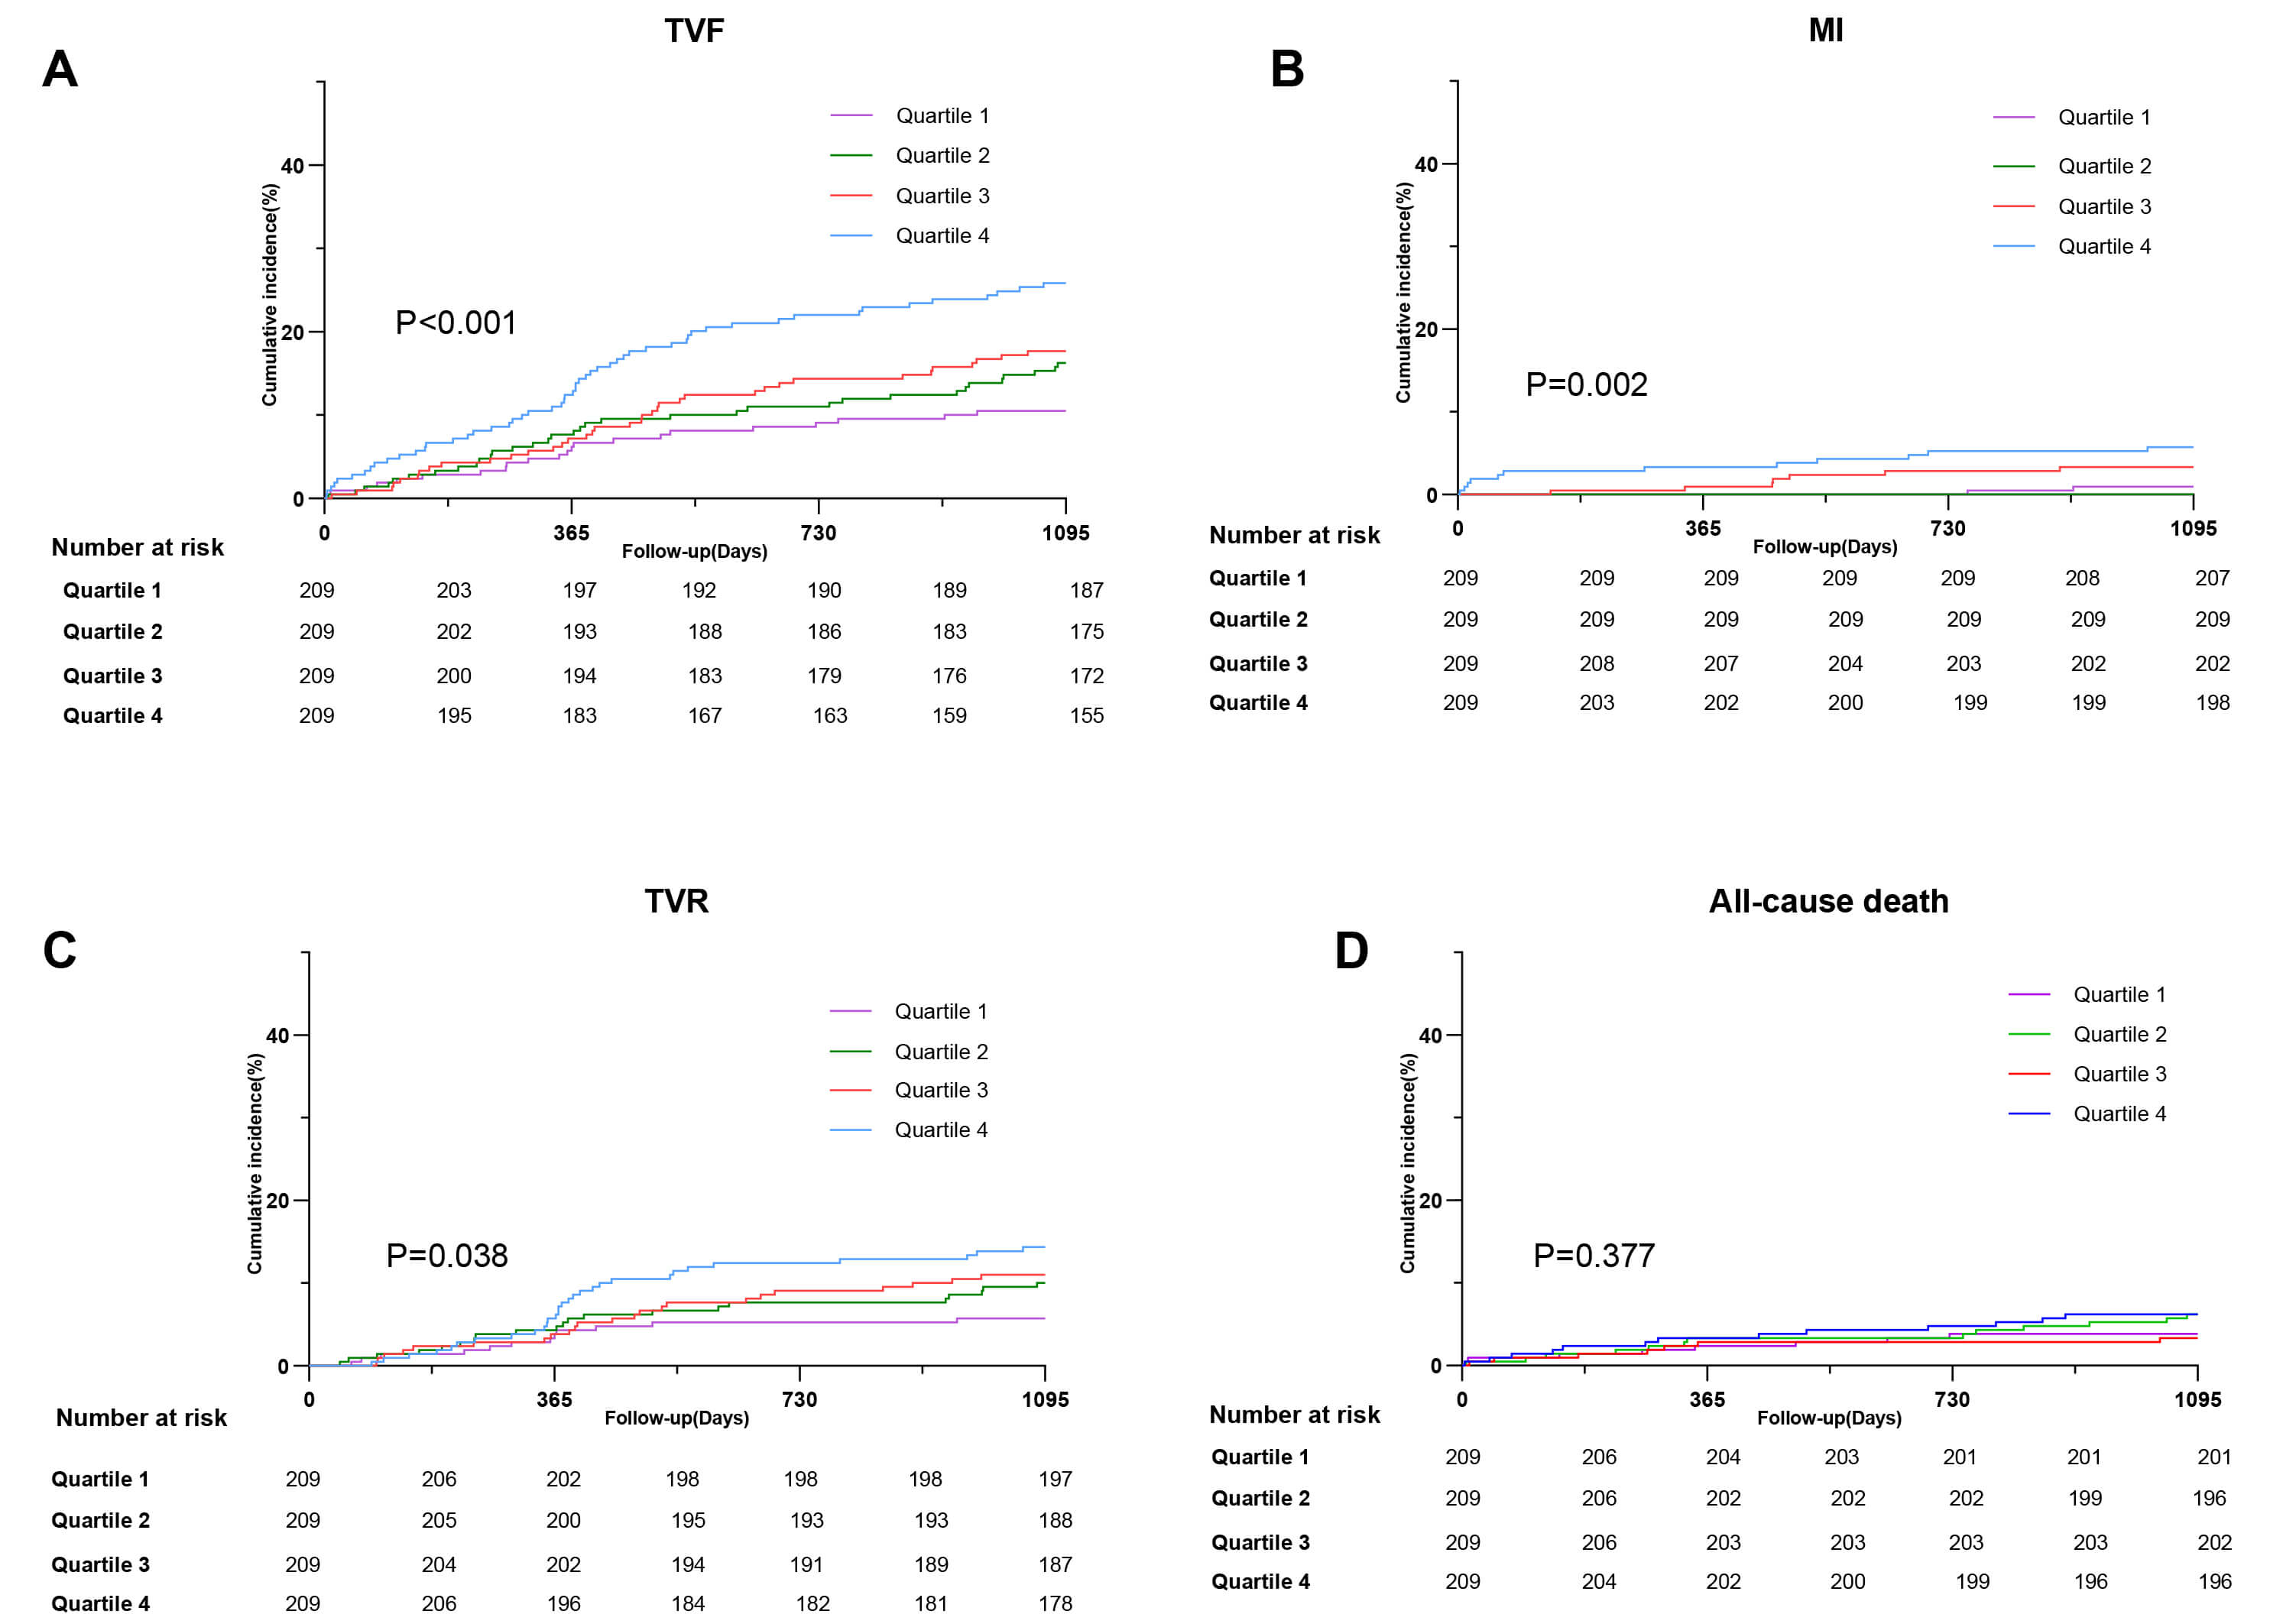 Fig. 2.
Incidence of clinical outcomes in patients with ISR with different quantiles of RC (A) TVF (B) MI (C) TVR (D) All-cause death. Abbreviations: ISR, in-stent restenosis; MI, myocardial infarction; TVR, target vessel revascularization; TVF, target-vessel failure.
A Cox regression model was used to explore the relation between RC level and TVF
(Table 2). In the univariate analysis, RC level was significantly associated with
the risk of TVF, whether considered as a continuous or categorical variable.
After adjusting for confounding factors, multivariable Cox analysis revealed that
RC level was associated with TVF risk (1.37 for each 1 SD increase, 95% CI:
1.16–1.62; p
| Variables | Univariate Cox regression model | Multivariable Cox regression model | |||
| p | HR (95% CI) | p | HR (95% CI) | ||
| Continuous | |||||
| RC level (mmol/L), per 1 SD increase | 1.19 (1.09 |
1.37 (1.16 | |||
| Categorical | |||||
| Q1 quartile | (Reference) | 1.00 | (Reference) | 1.00 | |
| Q2 quartile | 0.096 | 1.58 (0.92 |
0.047 | 1.99 (1.01 | |
| Q3 quartile | 0.042 | 1.73 (1.02 |
0.144 | 1.65 (0.84 | |
| Q4 quartile | 2.74 (1.67 |
3.43 (1.85 | |||
Adjusted for sex, age, diabetes, hypertension, NT-pro BNP, Lp(a), RBC, triglycerides, and Scr. RBC, red blood cell; RC, remnant cholesterol; Scr, Serum creatinine; TVF, target-vessel failure; Lp(a), Lipoprotein (a); HR, hazard ratio; CI, confidence interval.
To further clarify the influence of RC on post-PCI TVF, we conducted a subgroup
analysis (Fig. 3). The results showed no statistically significant interactions
between age, diagnosis, hypertension, and diabetes (all p for
interaction
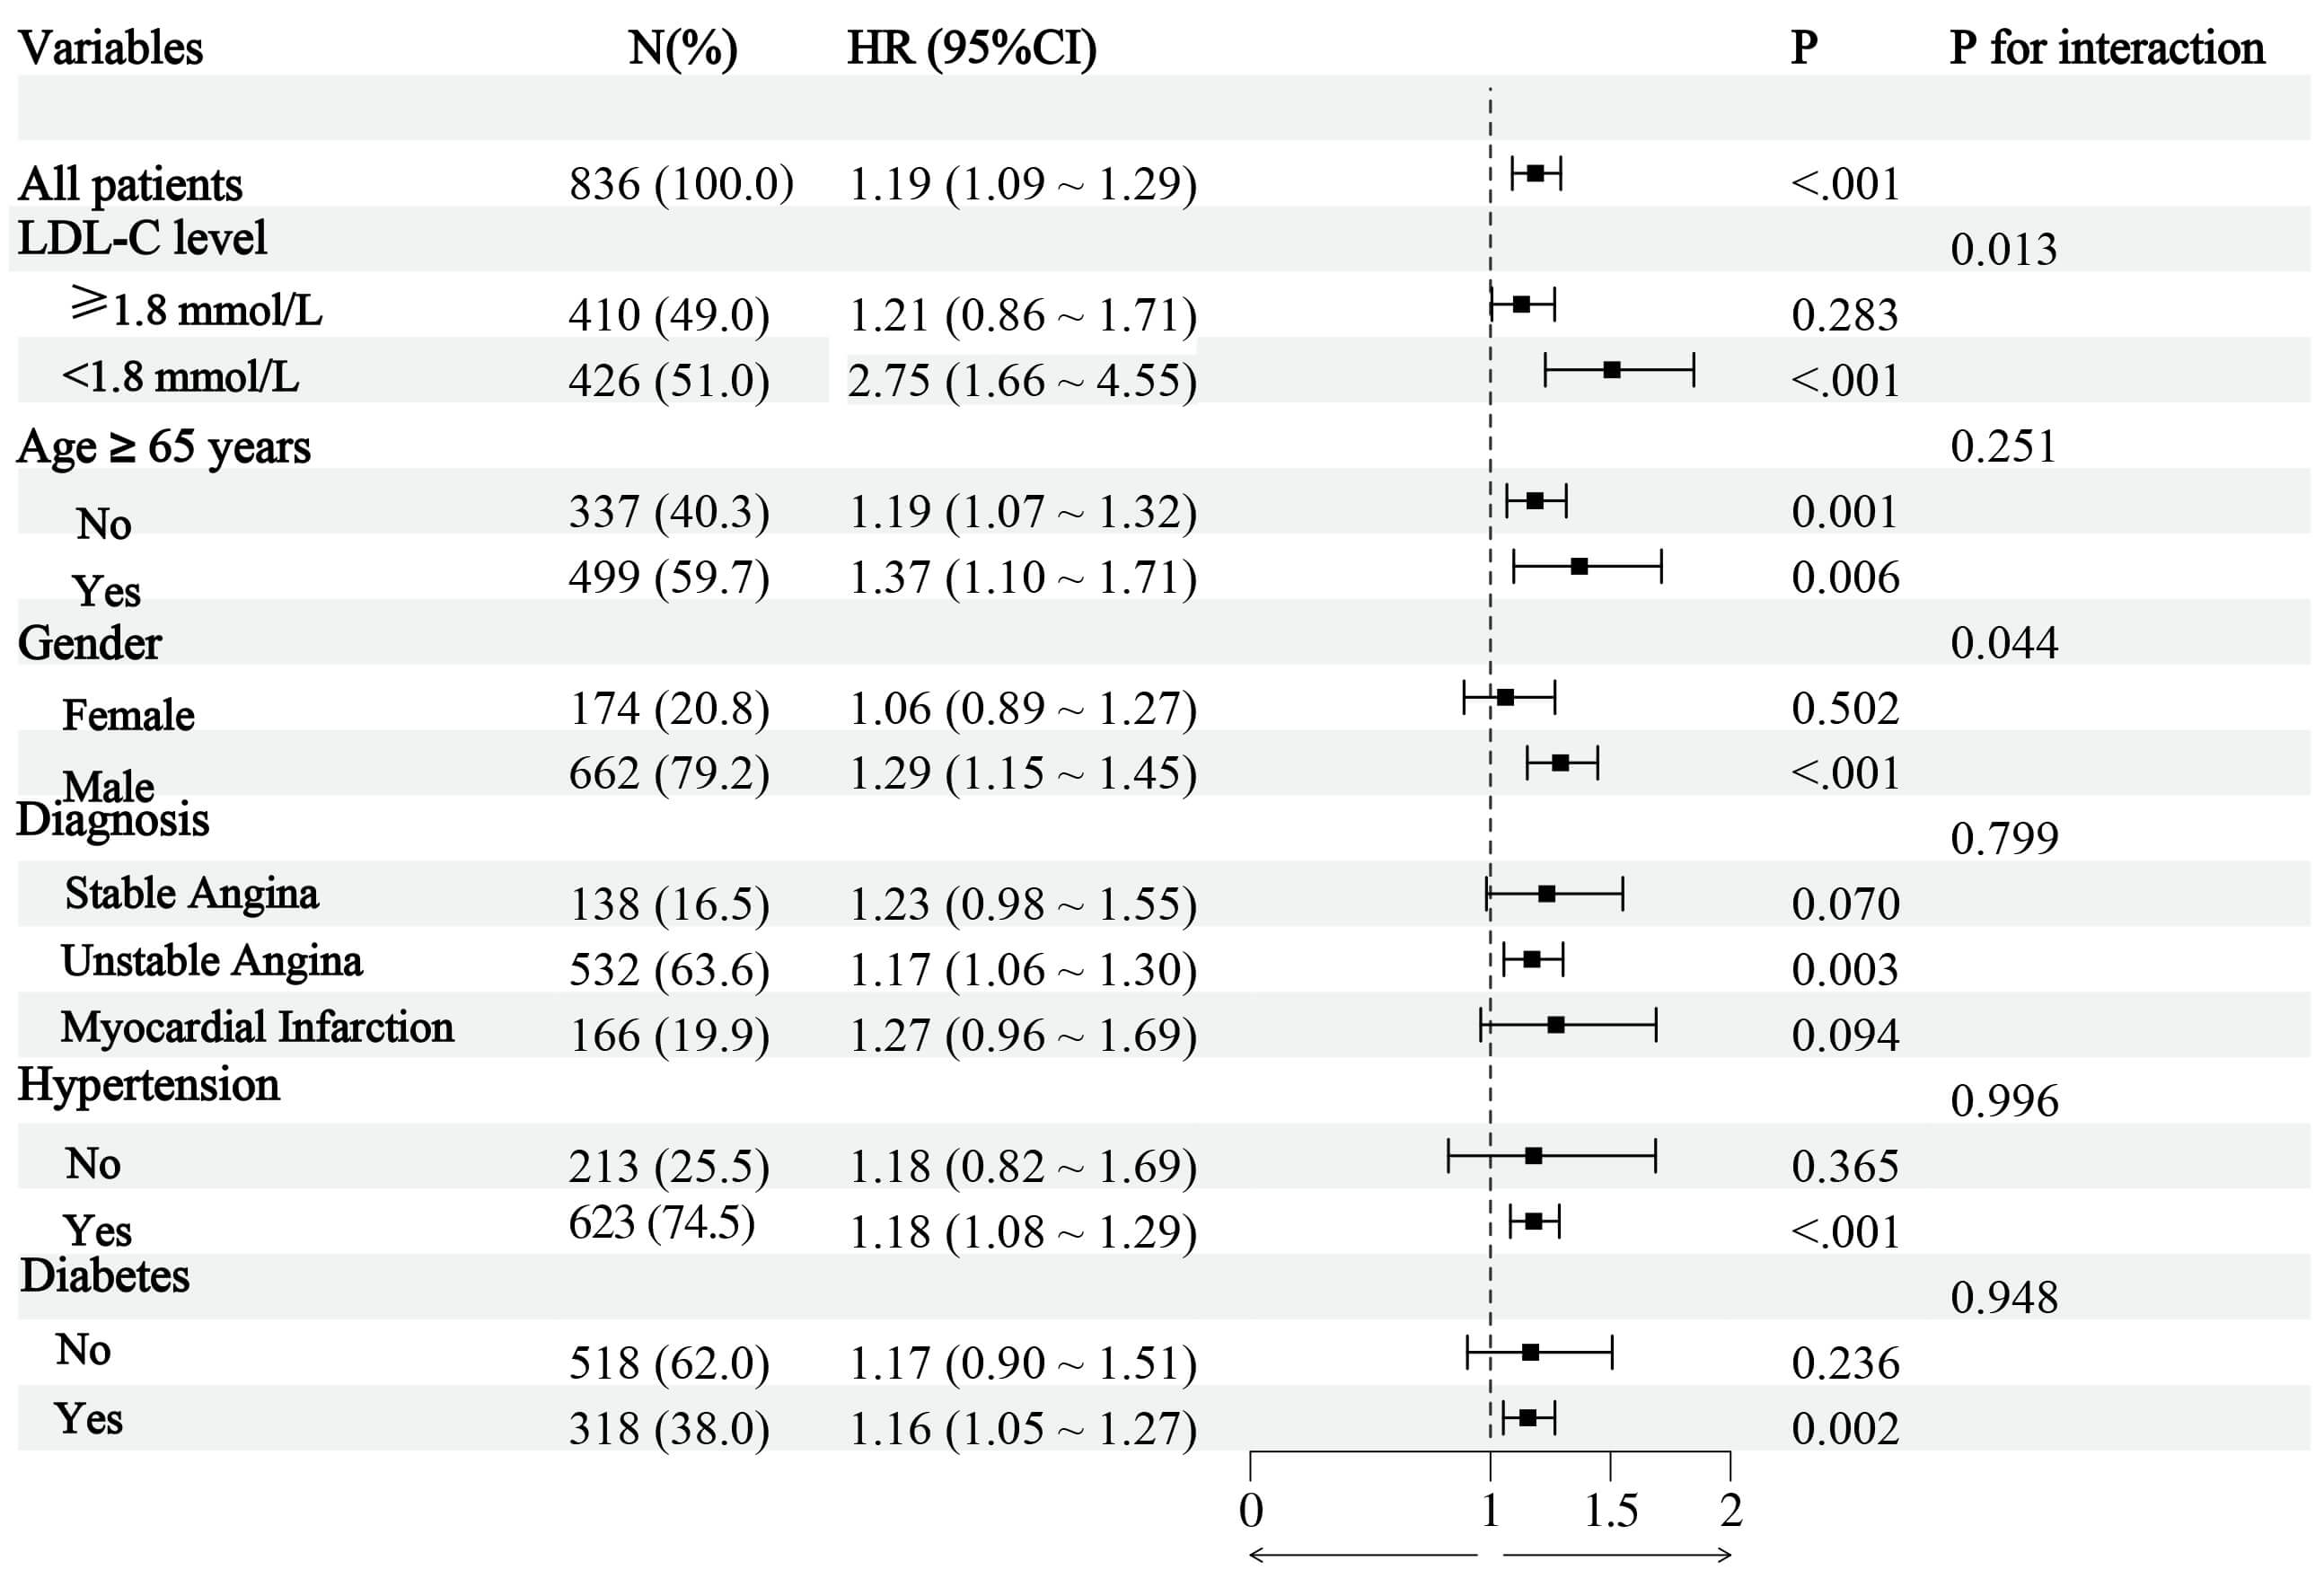 Fig. 3.
Subgroup analysis. Abbreviations: LDL-C, low-density lipoprotein cholesterol.
Fig. 4 shows the distribution of RC and LDL-C levels. The median remnant-C level
was 0.54 mmol/L (IQR, 0.40–0.73 mmol/L), and 160 (19.1%) were identified as
having a high RC level (
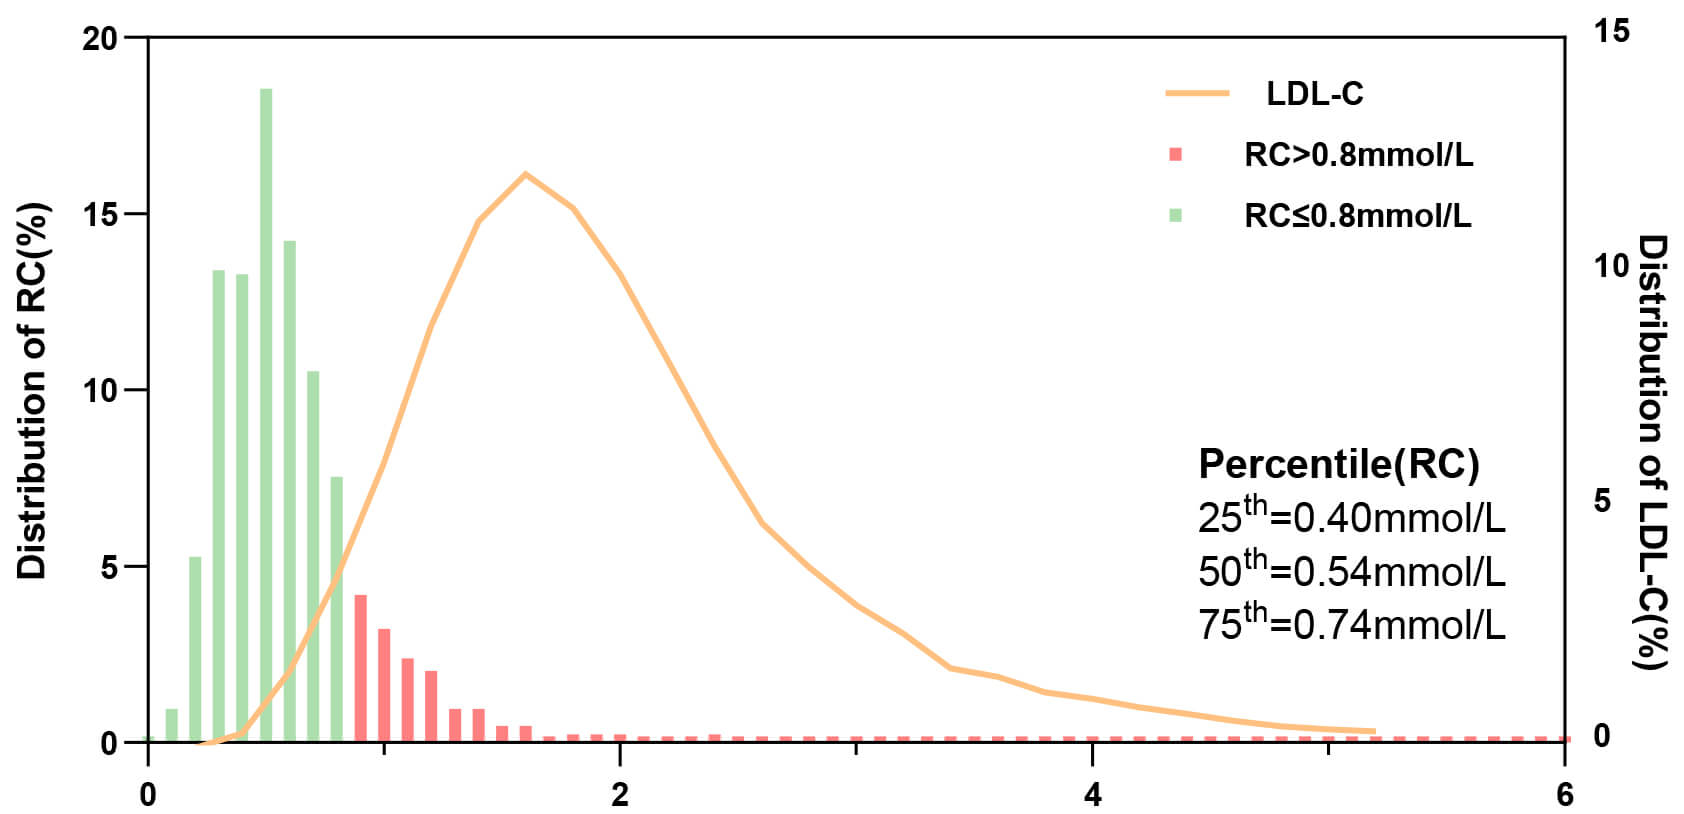 Fig. 4.
Distribution of RC and LDL-C levels in patients with ISR. Abbreviations: ISR, in-stent restenosis; RC, remnant cholesterol; LDL-C, low-density lipoprotein cholesterol.
In the discordance analysis, when identified by percentiles, approximately
thirty percent of individuals were categorized in the discordantly high RC/low
LDL-C group, and 302 patients were categorized in the discordantly low RC/high
LDL-C group. KM curves showed a significant difference in the incidence of 3-year
TVF among individuals with concordant/discordant RC levels (p = 0.025),
and the individuals with discordantly low RC/high LDL-C had the lowest incidence
of TVF (Fig. 5). To assess the reliability of these findings, discordance
analysis was repeated using the definition based on the clinical cutoff value.
The study population was divided into four groups: Concordant high RC/LDL-C group
(RC
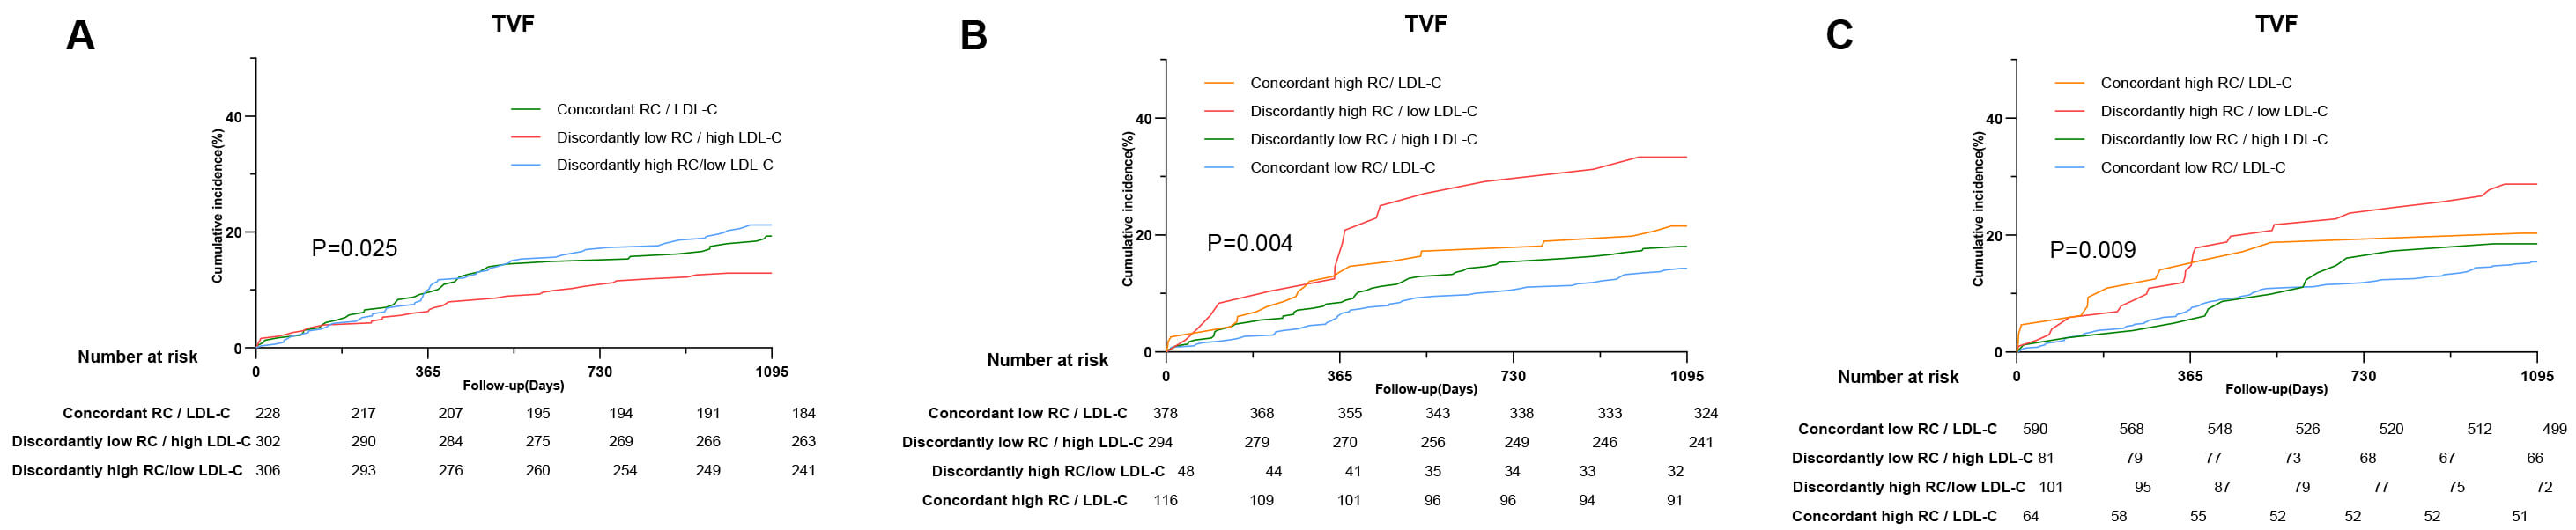 Fig. 5.
Discordance analyses of RC/LDL-C levels for the incidence of TVF. (A) Discordance is defined by percentiles. (B) Discordance is defined by clinical cutoff value (RC: 0.8 mmol/L; LDL-C: 1.8 mmol/L). (C) Discordance is defined by clinical cutoff value (RC: 0.8 mmol/L; LDL-C: 2.6 mmol/L). Abbreviations: RC, remnant cholesterol; LDL-C, low-density lipoprotein cholesterol.
The KM curves showed that individuals with discordantly high RC/low LDL-C levels
had the highest incidence of TVF events over the 3-year follow-up (p =
0.004; p = 0.009). Compared with the concordantly low RC individuals,
the HR (95% CI) for those who had discordantly high RC levels was 2.65
(1.52–4.64) for TVF risk (p
To further assess the predictive value of RC, ROC analysis was conducted based on the Cox regression model (Fig. 6). For reference, when LDL-C level was applied to the cohort of patients diagnosed with ISR, the AUC value (95% CI) was 0.51 (0.46–0.56). Further, RC level significantly outperformed LDL-C level in predicting the risk of TVF [0.61 (0.55–0.66) vs. 0.51 (0.46–0.56), p = 0.014]. In this ROC analysis, the discordance of RC/LDL-C, calculated as the percentile distance between RC and LDL-C, was considered as a continuous variable. When RC, LDL-C, and the discordance of RC/LDL-C were incorporated into the model, the predictive ability of the model for TVF was further enhanced [0.61 (0.56–0.67) vs. 0.51 (0.55–0.66), p = 0.007; IDI: 0.11, 95% CI: 0.05–0.18; NRI: 0.09, 95% CI: 0.05–0.16].
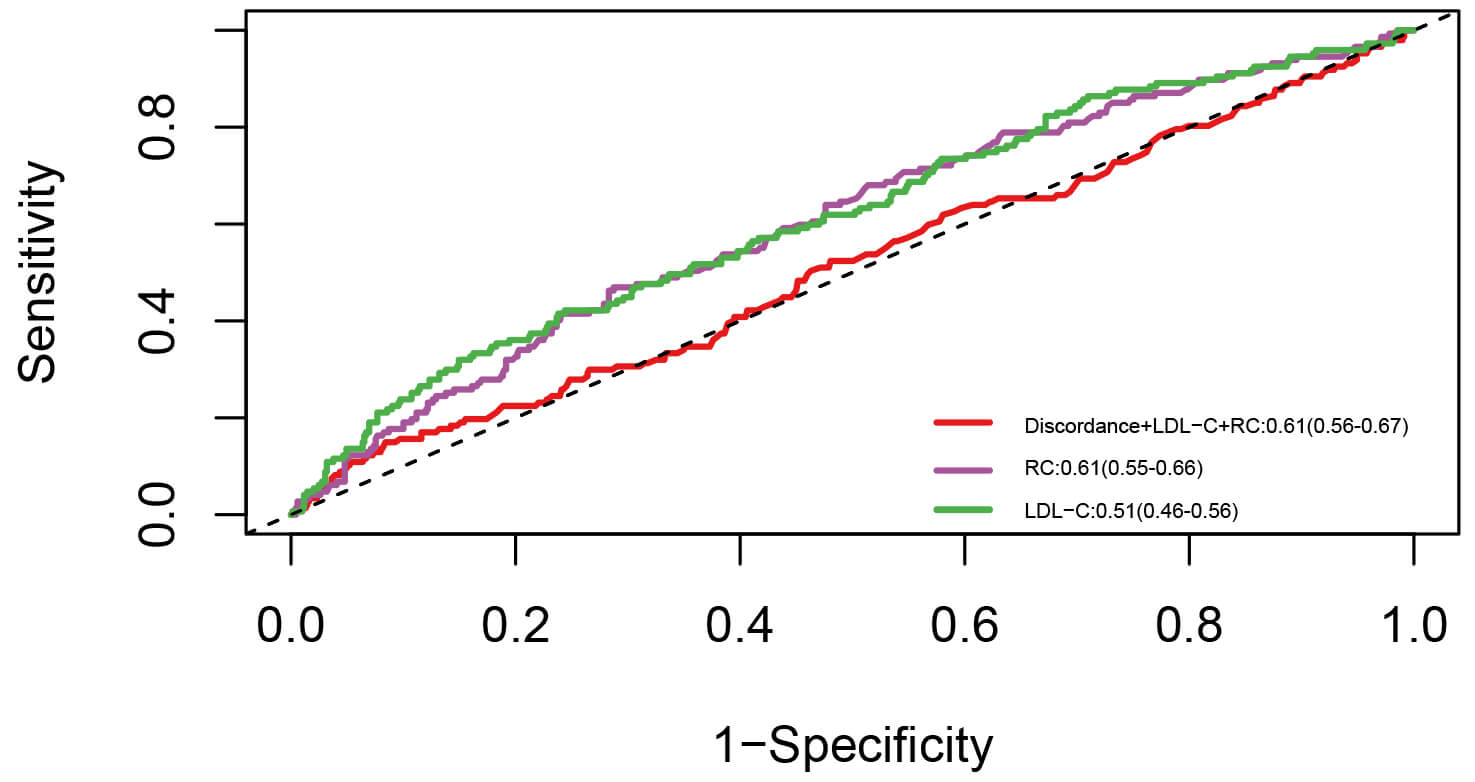 Fig. 6.
ROC curve. Abbreviations: RC, remnant cholesterol; LDL-C, low-density lipoprotein cholesterol; ROC, receiver operating characteristic.
This retrospective study explored the association between RC levels and TVF
among patients diagnosed with ISR who underwent re-PCI. The main findings were as
follows: (1) RC levels were associated with TVF risk, (2) the risk of TVF related
to RC was more pronounced in patients with LDL-C levels
Comprising the triglyceride-rich lipoproteins (TRL), RC is composed of the cholesterol content in intermediate-density lipoprotein cholesterol and very-low-density lipoprotein cholesterol under fasting conditions and the cholesterol content in chylomicrons under non-fasting conditions [28, 29]. Similar to LDL-C, these particles can enter the arterial endothelial layers and participate in the initiation and advancement of atherosclerosis [30]. These remaining particles contain around 40 times more cholesterol per particle compared to LDL-C, which might imply a greater atherogenic potential [31, 32, 33]. In contrast to LDL-C, these remnants do not necessitate oxidation before uptake by macrophages, which could cause foam cell formation and accelerate inflammation [34, 35]. Caused by an amplified reendothelialization response to the intimal impairment after stent implantation, inflammation is a key driver of ISR [36]. Future research is needed to clarify the mechanism by which the TRL activates the excessive hyperplasia response in the local lesion within the stent segment, thereby creating a microenvironment conducive to restenosis. Furthermore, the continuous integration of TRL into the arterial wall following DES implantation not only facilitates the transition from in-stent neointima to neo-atherosclerosis but also injures the stability of plaques, thereby lowering the treatment effect of re-PCI and influencing long-term prognosis [37]. Considering these mechanisms that make triglyceride-rich lipoproteins a potential risk factor, previous research has focused on the association between RC level and cardiovascular clinical outcomes. Cohort studies have shown that remnant lipoprotein levels could be a predictive factor for the risk of ASCVD [38]. For individuals with acute coronary syndrome, an elevated RC level was significantly associated with increased risks of ischemic events, cardiac, and all-cause mortality [39, 40, 41]. In a pooled analysis, Palmerini et al. [42] revealed that 25% of patients with ISR experienced MI. Furthermore, patients with ISR had an increased risk of recurrent ISR and revascularization [43, 44]. The findings of this study suggest that elevated RC levels may be a potential target related to the cardiac risk in individuals with ISR beyond traditional risk factors.
Characterized by neointimal tissue proliferation and plaque progression, the incidence and prognosis of ISR are associated with individual characteristics, including disease history and clinical symptoms [45, 46]. For example, diabetic individuals had an almost 9% rate of ISR, which was higher than that of individuals without diabetes [47]. Therefore, to verify the robustness of using RC as a prediction factor, its predictive value for clinical outcomes in subgroups was assessed. The results of this study showed that RC-related risk persisted among different subgroups (age, sex, diagnosis, hypertension, and diabetes). Previously, Yang et al. [48] discovered that prolonged exposure to elevated RC levels is also related to an increased likelihood of developing other diseases equivalent to ASCVD, such as diabetes and hypertension [49]. This interaction provides a new perspective for evaluating the role of RC in primary and secondary prevention. In the early stage of some chronic diseases, the concentration of TRL might be a potential triggering mechanism. In addition to the clinical disease background, ISR was also classified into different types based on plaque characteristics [37]. Considering the atherosclerotic potential of RC, the RC level may deserve earlier attention in individuals with vulnerable plaques but no ischemia symptoms. For those with relatively stable lesions, early interruption of exposure to high TRL may delay the need for revascularization [3]. For patients with ISR who have already suffered from compromised blood flow, a more stringent RC threshold standard based on lesion characteristics may further improve their prognosis.
Interestingly, the results of subgroup analysis showed that individuals with
satisfactory LDL-C control (
Considering the residual risk of LDL-C-lowering therapy, previous research has focused on the discordance between LDL-C and other atherogenic lipid profiles and their influence on clinical outcomes [57, 58]. As a potential lipid-lowering target, the current cutoff value of high RC has varied among studies and lacks a standard definition [59]. Utilizing several different definitions, the discordance analysis showed that individuals with concordantly high RC/low LDL-C, but not low RC/high LDL-C, had a higher follow-up TVF risk. Consistent with a previous study, this finding reaffirmed the predictive value of RC [57]. It is worth noting that a high RC level rather than a high LDL-C level appeared to be associated with an increased TVF risk. Several factors may have contributed to this result. Researchers have suggested that the biological mechanism of increased RC levels may involve increased secretion and lipolysis dysfunction of triglyceride-rich lipoproteins [60]. Increased RC is related to a higher frequency of insulin resistance and pro-inflammatory status, which further amplifies its effect on cardiovascular events [61, 62]. As a type of stent failure event, most patients may undergo routine LDL-C-lowering therapy after the first PCI [63]. However, statins, ezetimibe, and PCSK9 inhibitors do not significantly lower RC levels [49]. Thus, when LDL-C is adequately controlled, patients with high RC levels may have a residual lipid risk and poor prognosis.
Based on the findings of this study, we conclude that RC may be a risk-enhancing factor for patients with ISR. The predictive model for TVF events, which includes baseline RC level and its post-PCI trajectory, may improve cardiac risk assessment. Furthermore, although the effect of RC-lowering therapy requires validation, patients with an optimal LDL-C level are more likely to benefit from these therapies.
This study has several limitations. First, owing to its retrospective characteristic, causality could not be clearly established. Second, the direct measurement of RC is difficult to conduct in standard clinical practice; therefore, this study utilized the calculated RC method, which measured the cholesterol content of all lipoproteins that were not HDL or LDL. Thus, there may be a discordant residual risk between the calculated RC and measured RC regarding the effect of triglyceride levels. Third, during the extended follow-up period, the fluctuation of the RC level was not tracked. Considering that statin therapy could lower RC to some extent, the degree of reduction or increase in RC level should be considered in future analyses.
For patients diagnosed with ISR, RC levels were associated with increased TVF
risk after PCI. RC levels emerged as an independent risk factor for TVF among
individuals with ISR. This relation remained among individuals with optimal LDL-C
levels (
The datasets generated or analyzed during the current study are available from the corresponding author, subject to a reasonable request.
XHK, ZHL, and YFW conceived and designed the study. ZHL, YDS, XHK, YFW, and TX collected the relevant data, and ZHL and YDS prepared the figures and tables. YFW and ZHL drafted the manuscript. HBJ, FY, WY, PNM, XQW, and ZMW analyzed the data and critically reviewed the results. All authors contributed to the critical revision of the manuscript for important intellectual content. All authors read and approved the final manuscript. All authors have participated sufficiently in the work and agreed to be accountable for all aspects of the work.
In compliance with the Declaration of Helsinki, this study was approved by the Institutional Ethics Committee of Nanjing First Hospital (KY20241223-KS-02). All participants provided informed written consent.
Not applicable.
This research received no external funding.
The authors declare no conflict of interest.
Supplementary material associated with this article can be found, in the online version, at https://doi.org/10.31083/RCM43867.
References
Publisher’s Note: IMR Press stays neutral with regard to jurisdictional claims in published maps and institutional affiliations.