


 , Byung Kook Lee 1,2,†, Dong Hun Lee 1,2,*
 , Yong Hun Jung 1,2, Kyung Woon Jeung 1,2, Wan Young Heo 2
1 Department of Emergency Medicine, Chonnam National University Medical School, 61469 Gwangju, Republic of Korea
2 Department of Emergency Medicine, Chonnam National University Hospital, 61469 Gwangju, Republic of Korea
†These authors contributed equally.
Abstract
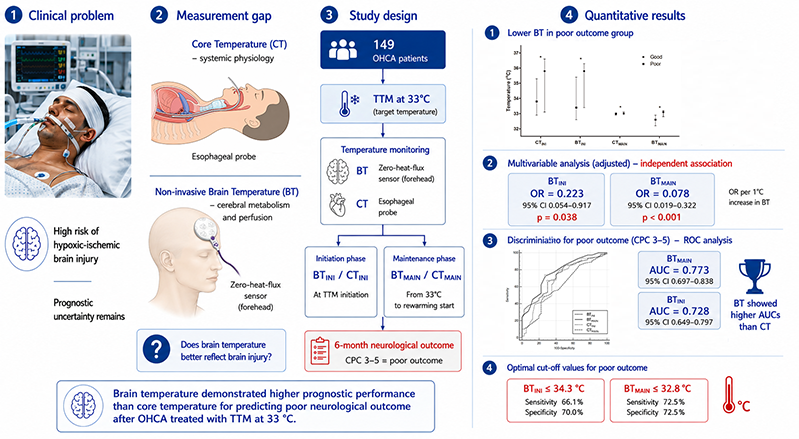
Despite the established concordance between core temperature and brain temperature (BT) in out-of-hospital cardiac arrest (OHCA) patients, the relationship between BT and neurological outcomes in those who received targeted temperature management (TTM) has yet to be elucidated. Thus, this study aimed to explore the relationship between BT and neurological outcome in OHCA patients who received TTM.
This observational study involved adult patients (≥18 years) with OHCA who received TTM at 33 °C between April 2021 and December 2023. We recorded BTs at the initiation of TTM (BTINI) and during the maintenance phase of TTM (BTMAIN). A neurological outcome at 6 months was the primary outcome. Poor outcome was considered as Cerebral Performance Categories 3, 4, and 5.
Of the 149 included patients with OHCA, 109 (73.2%) patients exhibited poor outcomes. Compared with the good outcome group, the BTINI (35.8 °C [interquartile range (IQR), 33.4–36.3 °C] vs. 33.4°C [IQR, 32.6–35.4 °C]) and BTMAIN (33.1 °C [IQR, 32.8–33.2 °C] vs. 32.6 °C [IQR, 32.2–32.9 °C]) were lower in the poor outcome group. Multivariate analysis after adjusting for confounders revealed that BTINI (odds ratio (OR), 0.223; 95% confidence interval (CI), 0.054–0.917; p = 0.038) and BTMAIN (OR, 0.078; 95% CI, 0.019–0.322; p < 0.001) were associated with poor outcomes.
BTs at the initiation of TTM and during the maintenance phase of TTM at 33 °C are associated with poor outcomes.
Keywords
- cardiac arrest
- neurological outcomes
- brain temperature
- targeted temperature management
Out-of-hospital cardiac arrest (OHCA) is a major contributor to global morbidity and mortality, and many survivors experience significant neurological deficits despite intensive resuscitation care following the return of spontaneous circulation (ROSC) [1, 2, 3]. Thus, accurate prediction of neurological outcomes in OHCA patients helps guide treatment and supports effective resource allocation [4, 5].
Among studies related to neurological outcomes after ROSC, studies conducted on core body temperature (CT) have shown that hypothermia on admission is associated with poor neurological outcomes [6, 7]. Post-rewarming fever after targeted temperature management (TTM) may also contribute to poor prognosis in OHCA patients after ROSC [8, 9]. However, CT primarily reflects systemic physiological states and may not accurately represent cerebral thermal dynamics or the extent of hypoxic-ischemic brain injury [10]. In contrast, brain temperature (BT) is directly influenced by cerebral metabolic activity and regional blood flow, making it a more direct indicator of brain status [11, 12]. Yablonskiy et al. [13] demonstrated a strong correlation between BT changes and oxidative metabolism using functional magnetic resonance imaging. Similarly, Wang et al. [10] reported that BT is fundamentally dependent on the balance between metabolic heat production and heat dissipation. In patients with subarachnoid hemorrhage, a BT higher than CT has been associated with preserved mitochondrial function and improved neurological outcomes [14]. However, previous studies on temperature in OHCA have mostly focused on CT as a predictor of neurological outcomes [6, 7, 8, 9]. There have been no clinical studies specifically investigating the relationship between BT and neurological outcomes in patients with OHCA.
Therefore, the purpose of this study was to evaluate the association between BT and neurological outcomes in adult OHCA survivors. We hypothesized that lower BT during TTM would be correlated with poorer neurological outcomes, potentially reflecting the severity of hypoxic-ischemic brain injury.
This prospective observational study utilized data from adult comatose OHCA survivors who were treated with TTM at Chonnam National University Hospital in Gwangju, Korea, between April 2021 and December 2023. The study was approved by the Institutional Review Board of Chonnam National University Hospital. Written informed consent was secured from all patients or their legal guardians before inclusion.
Adult (
Survivors of comatose cardiac arrest who received TTM according to the guidelines maintained a target body temperature of 33 °C for 24 hours using an Arctic Sun® feedback-controlled surface cooling device (Energy Transfer Pads™; Medivance Corp, Louisville, CO, USA). Following completion of the TTM maintenance phase, rewarming was performed at 0.25 °C/hour until 36.5 °C. CT was assessed using an esophageal temperature probe. BT was measured using a zero-heat-flux sensor system (3M™ Bair Hugger™370, Saint Paul, MN, USA) attached to the center of the forehead [15, 16]. We collected CT and BT every hour from the initiation to the end of TTM.
We obtained the following data from hospital records: sex, age, preexisting illness, bystander cardiopulmonary resuscitation (CPR), witnessed collapse, etiology of cardiac arrest, presence of initial shockable rhythm, interval from collapse to ROSC, serum glucose, lactate, partial pressure of oxygen, and partial pressure of carbon dioxide (PaCO2) levels after ROSC. We recorded CTs and BTs at the initiation of TTM (CTINI and BTINI) and during the maintenance phase of TTM (CTMAIN and BTMAIN).
We examined neurological outcomes at 6 months after ROSC via a phone interview using the Cerebral Performance Category (CPC) scale. The scoring was as follows: 1 = good performance, 2 = moderate disability, 3 = severe disability, 4 = vegetative state, and 5 = brain death or death [17]. The primary outcome was a poor neurological outcome, defined as CPC 3–5. Telephone interviews were conducted using a structured algorithm comprising six hierarchical questions designed to systematically determine CPC scores while simultaneously assessing the Modified Rankin Scale (mRS) (Supplementary Fig. 1). Trained research personnel documented all responses on standardized case report forms, which were retained as part of the study records to ensure reproducibility.
Categorical variables are reported as frequencies and proportions, while
continuous variables are presented as medians with interquartile ranges because
they did not pass the test for normality. Categorical variables between groups
were analyzed using chi-squared tests with continuity correction for 2
To assess the association between temperature variables and poor outcomes,
multivariable logistic regression analysis was performed. We performed
collinearity diagnostics with multivariable analysis. Variables exhibiting
p
All analyses were performed using PASW/SPSS™ software, version 26.0 (IBM Corp., Armonk, NY, USA) and MedCalc version 23.0 (MedCalc Software, bvba, Ostend, Belgium). Statistical significance was defined at a two-sided significance level of 0.05.
We treated a total of 197 OHCA patients who received TTM over the study period. Of the total, 149 patients satisfied the inclusion criteria, as depicted in Fig. 1. The median age of the patients was 62 (48.5–71.0) years. There were 109 (73.2%) patients with poor outcomes.
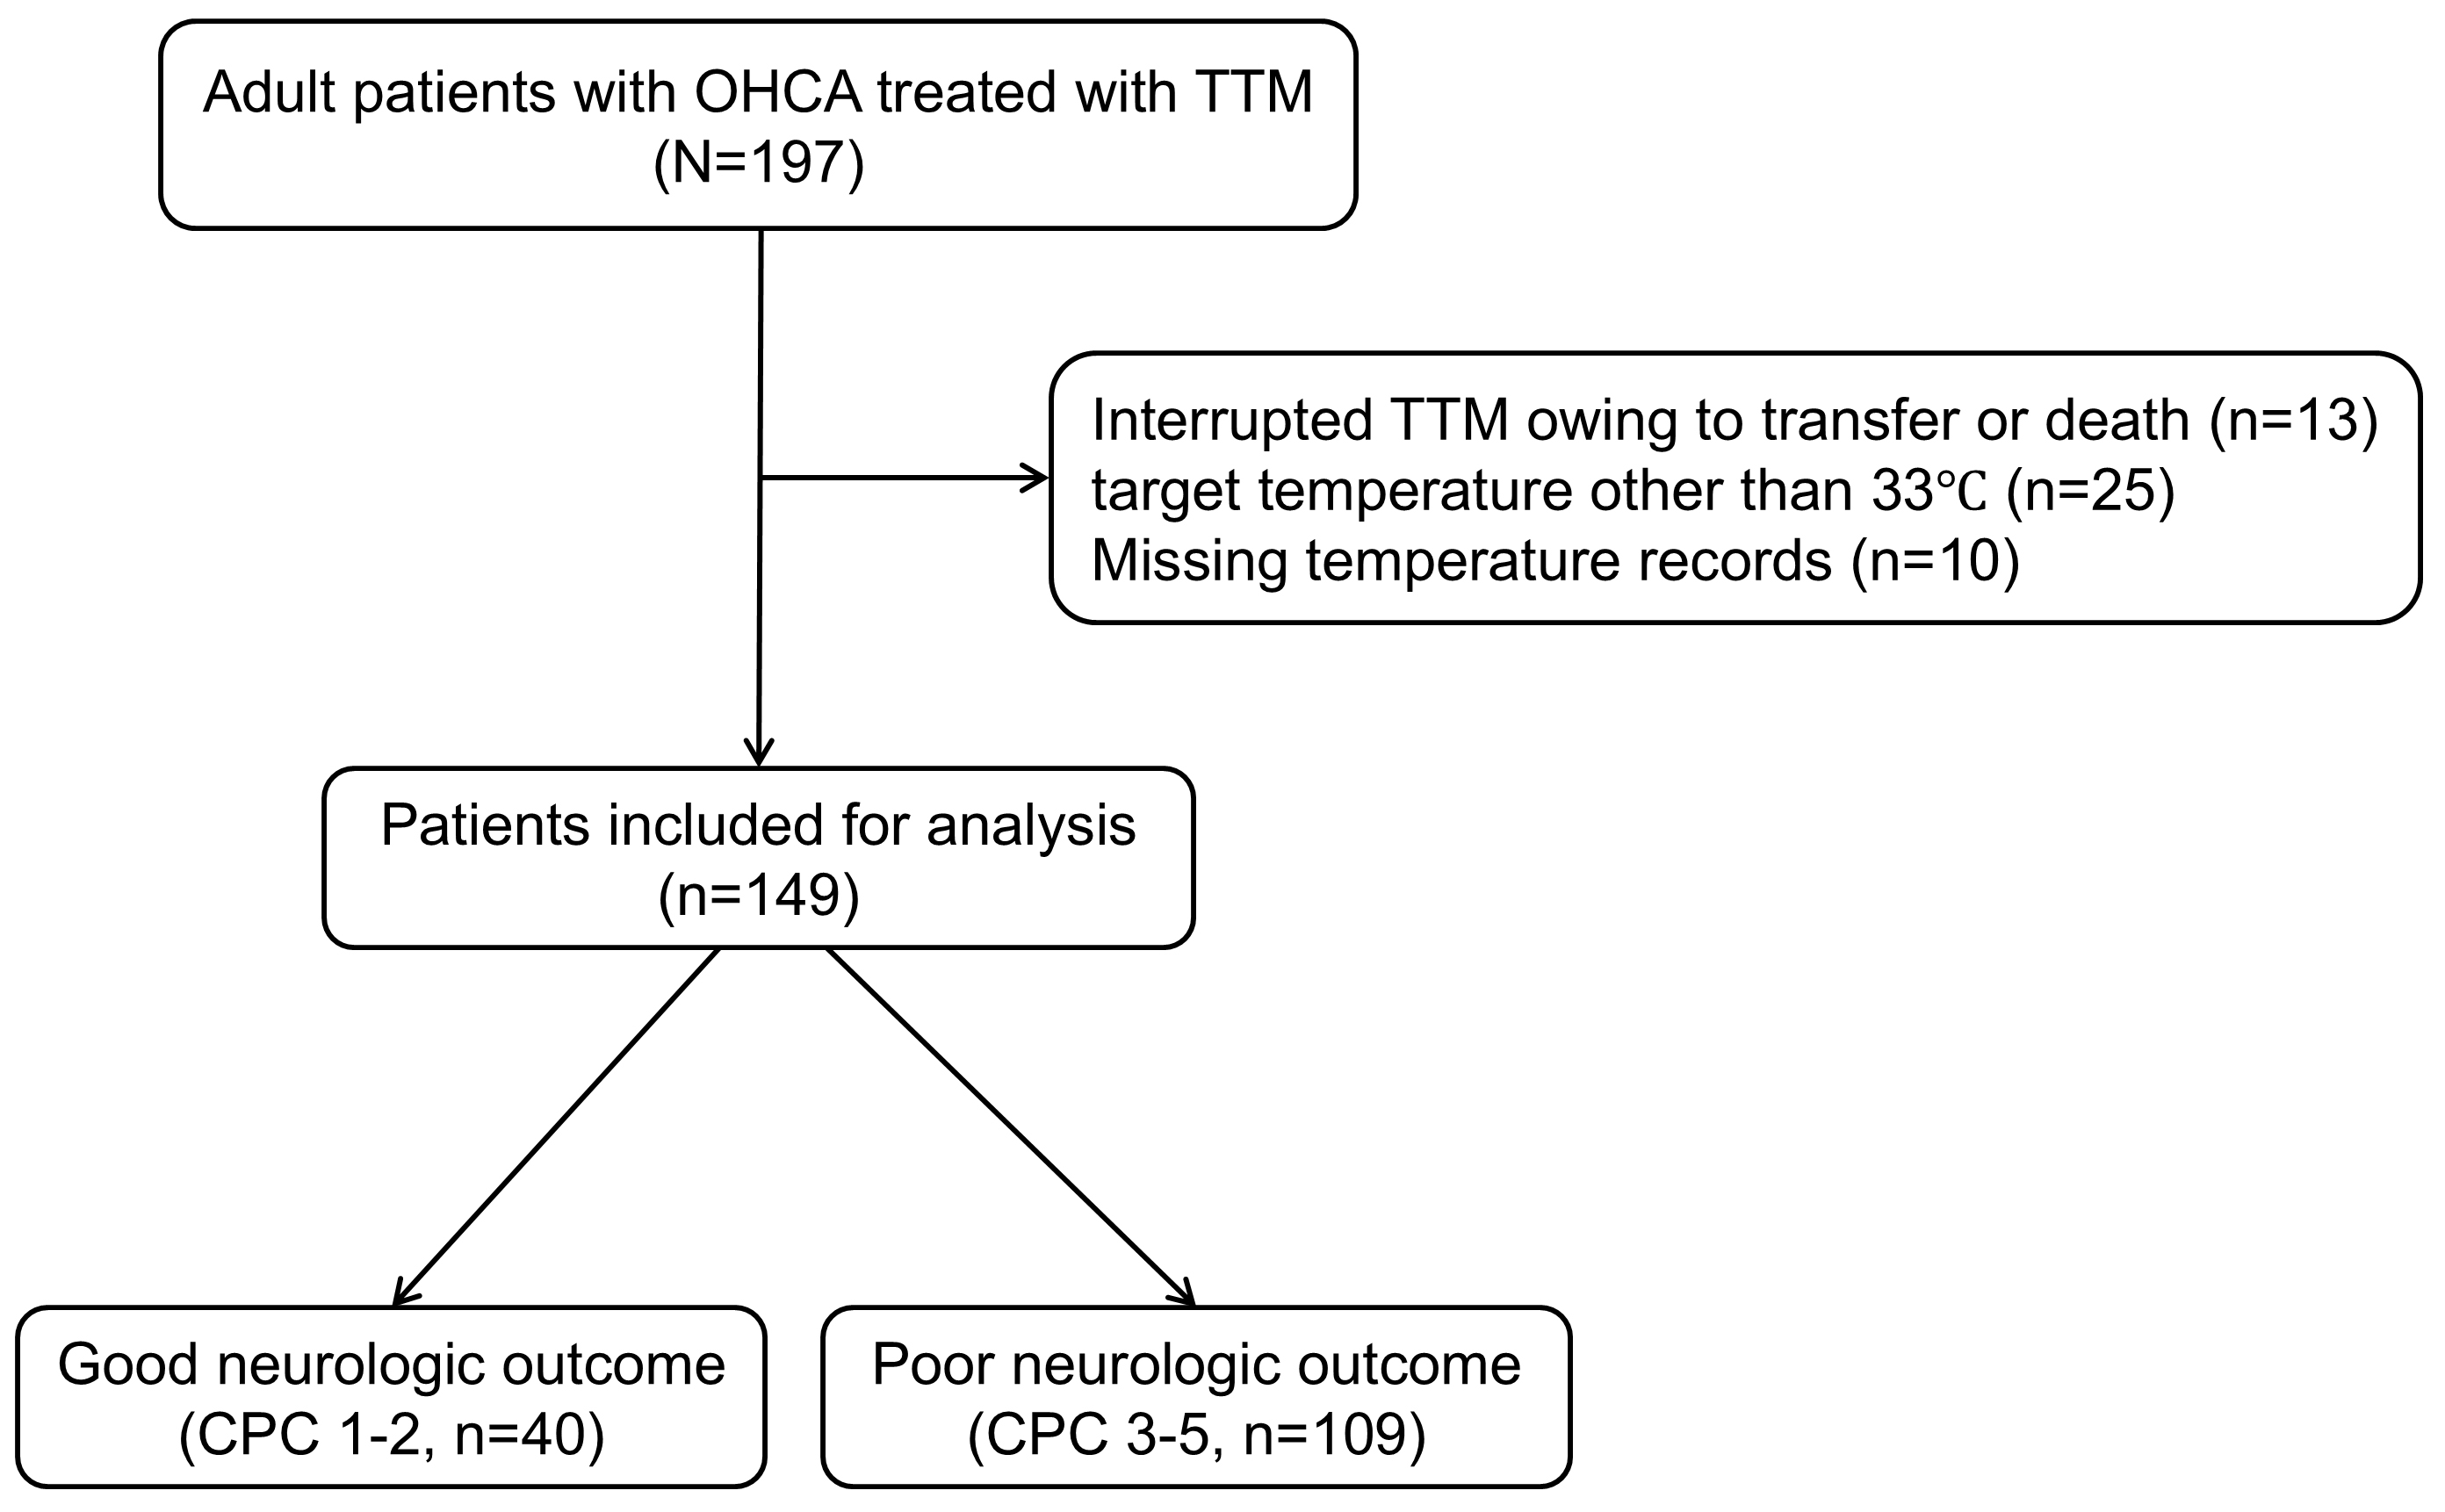 Fig. 1.
Schematic diagram illustrating the number of patients included in the study. OHCA, out-of-hospital cardiac arrest; TTM, targeted temperature management; CPC, Cerebral Performance Category.
Table 1 presents the baseline characteristics stratified by neurological
outcomes. In comparison with patients with good outcomes, those with poor
outcomes were older (62.0 vs. 57.5 years, p = 0.017) and had a higher
incidence of diabetes (42.2% vs. 15.0%, p = 0.004), a lower incidence
of shockable rhythm (25.7% vs. 85.0%, p
| Variables | Total (N = 149) | Good (N = 40) | Poor (N = 109) | p | |
| Demographics | |||||
| Age, years | 62.0 (48.5–71.0) | 57.5 (38.3–65.0) | 62.0 (50.5–72.0) | 0.017 | |
| Male, n (%) | 110 (73.8) | 30 (75.0) | 80 (73.4) | 1.000 | |
| Preexisting illness, n (%) | |||||
| Coronary artery disease | 20 (13.4) | 5 (12.5) | 15 (13.8) | 1.000 | |
| Hypertension | 79 (53.0) | 19 (47.5) | 60 (55.0) | 0.527 | |
| Diabetes | 52 (34.9) | 6 (15.0) | 46 (42.2) | 0.004 | |
| Renal impairment | 21 (14.1) | 3 (7.5) | 18 (16.5) | 0.193 | |
| Cardiac arrest characteristics | |||||
| Witnessed collapse, n (%) | 92 (61.7) | 29 (72.5) | 63 (57.8) | 0.148 | |
| Bystander CPR, n (%) | 85 (57.0) | 27 (67.5) | 58 (53.2) | 0.169 | |
| Shockable rhythm, n (%) | 62 (41.6) | 34 (85.0) | 28 (25.7) | ||
| Cardiac etiology, n (%) | 84 (56.4) | 34 (85.0) | 50 (45.9) | ||
| Time to ROSC, min | 32.0 (20.0–45.0) | 19.5 (14.3–26.8) | 36.0 (26.5–47.5) | ||
| Clinical characteristics after ROSC | |||||
| Lactate, mmol/L | 8.0 (5.0–11.9) | 5.3 (3.0–8.0) | 9.3 (5.9–13.3) | ||
| Glucose, mg/dL | 250 (179–319) | 219 (151–285) | 268 (188–335) | 0.011 | |
| PaO2, mmHg | 180.0 (103.1–268.5) | 204.5 (115.1–341.0) | 171.0 (100.0–247.0) | 0.094 | |
| PaCO2, mmHg | 45.0 (36.0–60.0) | 39.0 (31.5–41.8) | 51.0 (38.0–66.8) | ||
CPR, cardiopulmonary resuscitation; ROSC, return of spontaneous circulation; PaO2, partial pressure of oxygen; PaCO2, partial pressure of carbon dioxide.
Fig. 2 shows temperature variables stratified by neurological outcomes.
Significant differences were observed in CTINI (interquartile range (IQR),
35.8 °C [33.1–36.6 °C] vs. 33.8°C [IQR, 32.9–35.3
°C], p
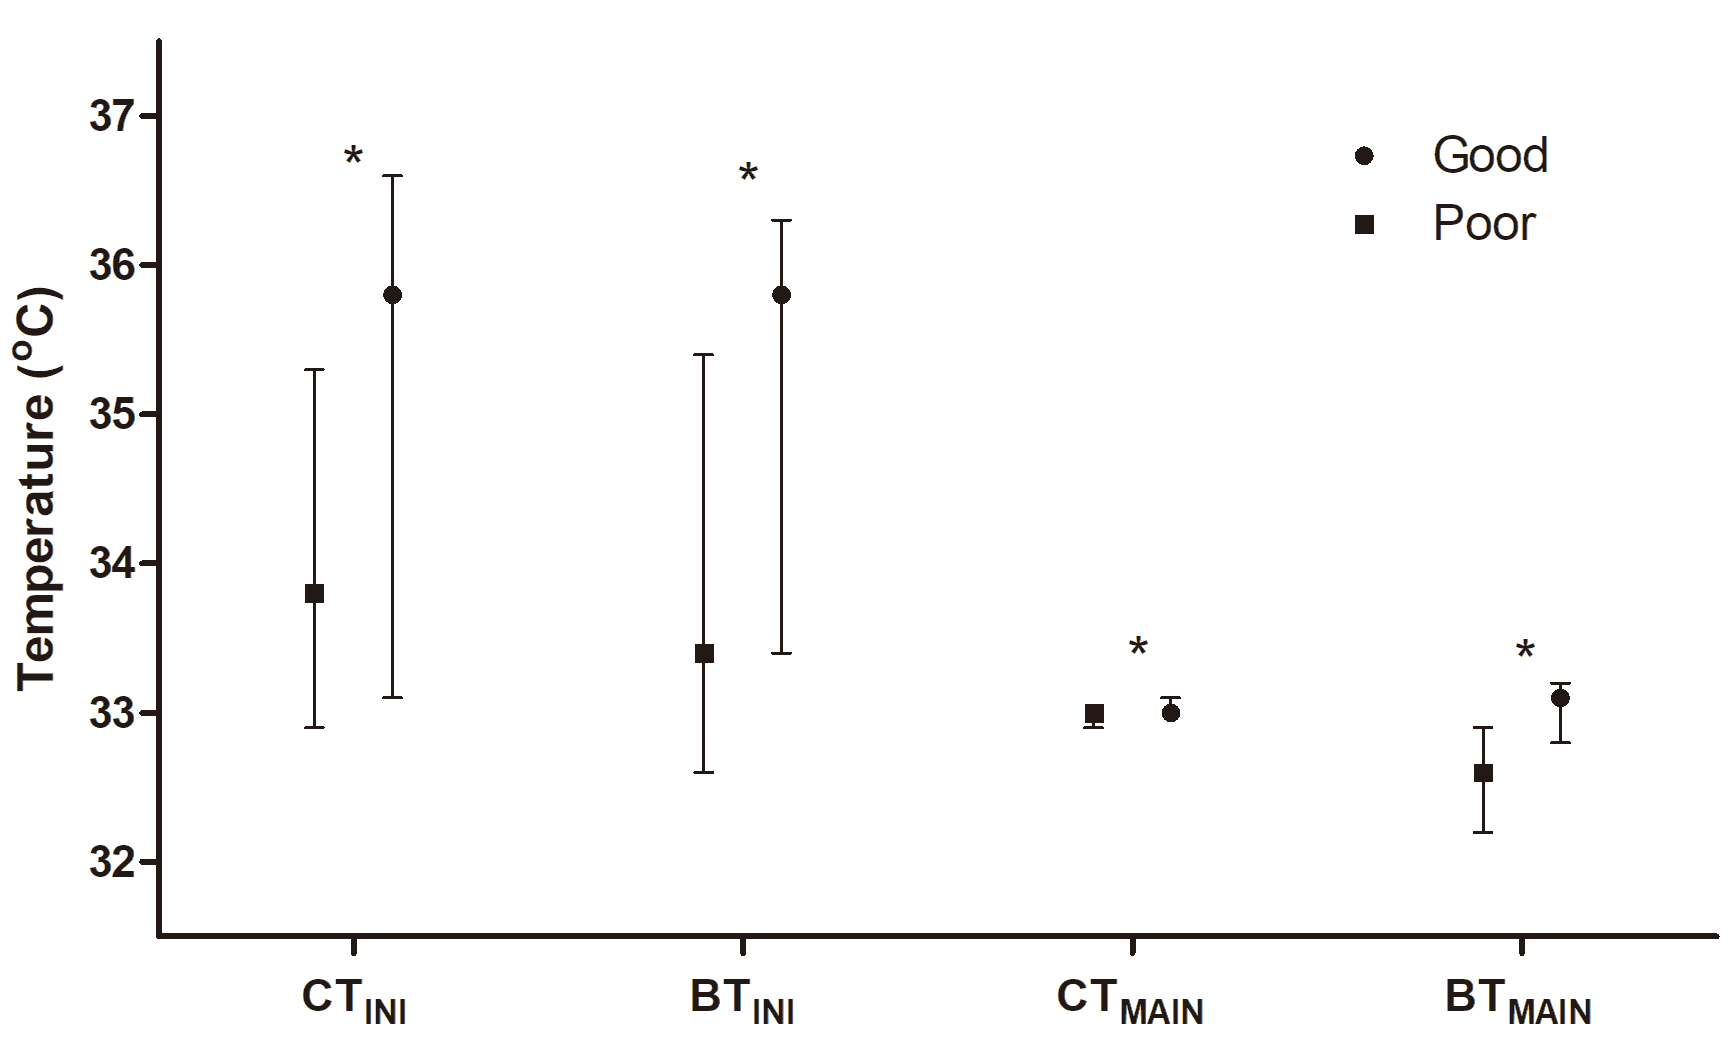 Fig. 2.
Comparison of core and brain temperatures at the initiation
(CT𝐈𝐍𝐈 and BT𝐈𝐍𝐈) and at the maintenance phase (CT𝐌𝐀𝐈𝐍 and
BT𝐌𝐀𝐈𝐍) of targeted temperature management according to neurological
outcomes. The asterisk (*) indicates p
After adjusting for potential confounders, BTINI (OR, 0.223; 95% CI,
0.054–0.917; p = 0.038) and BTMAIN (OR, 0.078; 95% CI,
0.019–0.322; p
| Variables | Adjusted OR (95% CI) | p |
| CTINI, °C | 3.193 (0.860–11.857) a | 0.083 |
| BTINI, °C | 0.223 (0.054–0.917) a | 0.038 |
| CTMAIN, °C | 0.239 (0.000–282.824) b | 0.692 |
| BTMAIN, °C | 0.078 (0.019–0.322) a |
TTM, targeted temperature management; OR, odds ratio; CI, confidence interval; CTINI, core temperature at initiation of TTM; BTINI, brain temperature at initiation of TTM; CTMAIN, core temperature at maintenance phase of TTM; BTMAIN, brain temperature at maintenance phase of TTM.
aAdjusted for age, shockable rhythm, interval from collapse to return of spontaneous circulation, lactate level, and glucose level.
bAdjusted for age, diabetes, shockable rhythm, interval from collapse to return of spontaneous circulation, lactate level, glucose level, PaCO2 level.
Table 3 and Fig. 3 show the results of AUROC analysis of temperature variables for predicting poor outcomes. The AUCs of CTINI and CTMAIN were 0.677 (95% CI, 0.596–0.751) and 0.615 (95% CI, 0.532–0.693), respectively. The AUCs of BTINI and BTMAIN were 0.728 (95% CI, 0.649–0.797) and 0.773 (95% CI, 0.697–0.838), respectively.
| Variable | AUC (95% CI) | p | Cut-off value | Sensitivity (95% CI) | Specificity (95% CI) | PPV (95% CI) | NPV (95% CI) |
| CTINI, °C | 0.677 (0.596–0.751) | 78.0 (69.0–85.4) | 57.5 (40.9–73.0) | 83.3 (77.5–87.9) | 48.9 (38.1–59.0) | ||
| BTINI, °C | 0.728 (0.649–0.797) | 66.1 (56.4–74.9) | 70.0 (53.5–83.4) | 85.7 (78.6–90.8) | 43.1 (35.2–51.3) | ||
| CTMAIN, °C | 0.615 (0.532–0.693) | 0.028 | 47.7 (38.1–57.5) | 75.0 (58.8–87.3) | 83.9 (74.6–90.2) | 34.5 (29.0–40.4) | |
| BTMAIN, °C | 0.773 (0.697–0.838) | 72.5 (63.1–80.6) | 72.5 (56.1–85.4) | 87.8 (81.1–92.3) | 49.2 (40.3–58.1) |
TTM, targeted temperature management; AUC, area under the curve; CI, confidence interval; PPV, positive predictive value; NPV, negative predictive value; CTINI, core temperature at initiation of TTM; BTINI, brain temperature at initiation of TTM; CTMAIN, core temperature at maintenance phase of TTM; BTMAIN, brain temperature at maintenance phase of TTM.
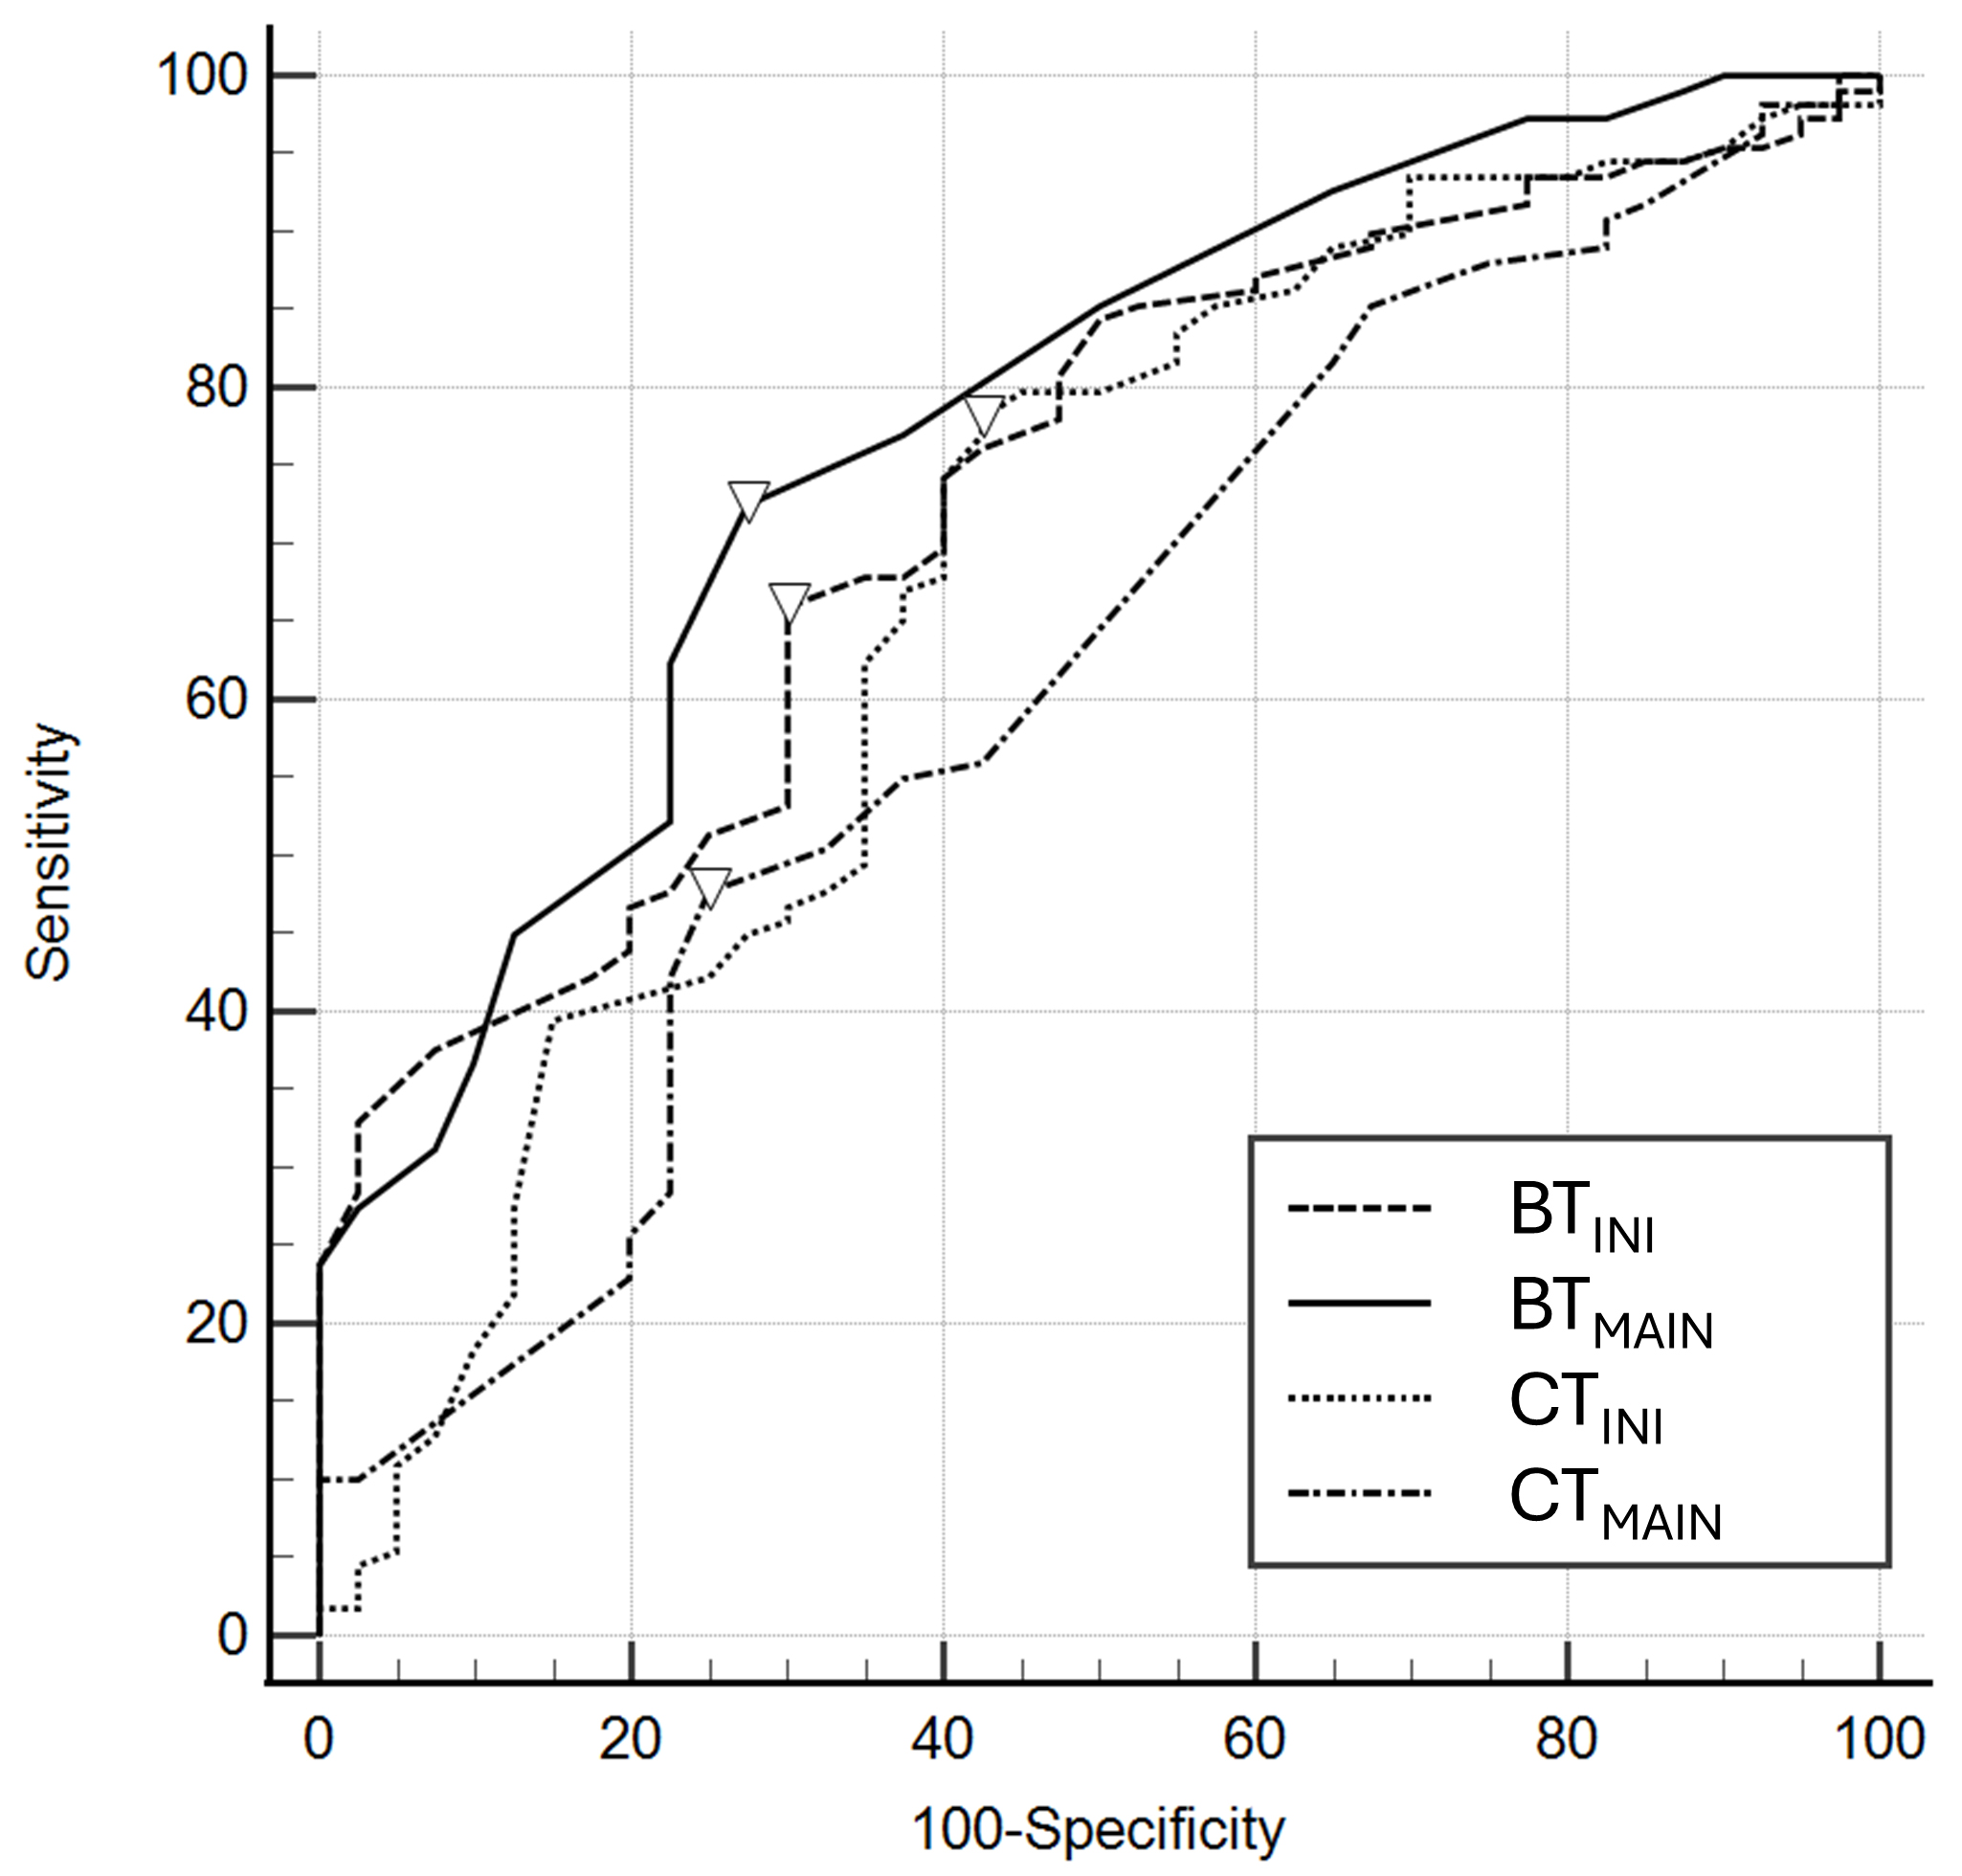 Fig. 3.
Receiver operating characteristics of core and brain temperatures at the initiation (CT𝐈𝐍𝐈 and BT𝐈𝐍𝐈) and at the maintenance phase (CT𝐌𝐀𝐈𝐍 and BT𝐌𝐀𝐈𝐍) for poor neurological outcomes. The inverted triangles on the curve are cutoff values by Youden’s index.
In this study, we examined the relationship between BT and neurological outcomes in OHCA survivors who underwent TTM. We found that both BTINI and BTMAIN were significantly lower in patients with poor outcomes. Multivariable logistic regression analysis demonstrated that both BTINI and BTMAIN were independently associated with poor outcomes, whereas CTINI and CTMAIN were not. The prognostic performance of BTINI and BTMAIN was considered fair.
There have been several attempts to identify the association between body
temperature and outcomes in cardiac arrest patients [6, 7, 8, 9, 20]. den Hartog
et al. [20] reported that spontaneous hypothermia (
Previous studies have demonstrated associations between low CT after ROSC and
poor neurological outcomes [6, 7, 20]. However, CT may be influenced more by
systemic physiological responses rather than directly reflecting hypoxic-ischemic
brain injury. Coppler et al. [21] reported that in comatose cardiac
arrest survivors, BT is on average 0.34 °C higher than CT and exceeds it
by
BT is primarily regulated by the balance between metabolic heat production and
heat removal via cerebral blood flow [22]. Cerebral blood flow not only delivers
oxygen and nutrients but also dissipates heat generated by neuronal activity,
thereby maintaining thermal homeostasis [11]. During cardiac arrest, cerebral
perfusion is abruptly interrupted, resulting in a rapid decline in brain
metabolic activity [23]. Because the brain has intrinsically high metabolic
demands, it depends heavily on a continuous oxygen supply to sustain adenosine
triphosphate (ATP) production through oxidative phosphorylation [12, 24]. When
oxygen delivery ceases, ATP synthesis is severely impaired. Since cerebral heat
production largely depends on oxygen-driven ATP synthesis, decreased metabolic
activity after cardiac arrest results in a lower BT [12]. Severe brain injury can
disrupt cerebral blood flow, which in turn affects BT regulation. Reduced
perfusion may metabolically limit heat production, potentially leading to
decreased BT. Zhu et al. [25] demonstrated that reduced cerebral blood
flow results in lower BT relative to CT, highlighting the dominant role of
perfusion in cerebral thermal regulation. In their rat model, different
anesthetics were used to modulate cerebral perfusion, and BT was consistently
lower than CT when blood flow was reduced [25]. The largest brain–core
temperature gradient has been reported under
We acknowledge that the use of a zero-heat-flux sensor (3M™ Bair Hugger™) on the forehead, though clinically practical and noninvasive, presents inherent limitations when compared with invasive intracranial temperature monitoring methods. Prior validation studies comparing invasive intracranial and noninvasive forehead temperature sensors reported generally good agreement under stable physiological conditions, with a mean difference of approximately 0.4 °C [15]. However, during periods of rapid temperature changes, such as induction (–1.1 °C difference) and rewarming (0.7 °C difference), discrepancies were observed to be more pronounced due to thermal inertia and delayed heat conduction through the skin and skull [15]. Therefore, clinicians should interpret readings from a zero-heat-flux sensor with caution, especially during unstable physiological states.
Several limitations should be acknowledged. First, it was a single-center observational study with a relatively small sample size (n = 149), which may limit the generalizability of the findings due to potential institution-specific practices in TTM, patient selection criteria, or regional demographic factors. Second, BT was measured noninvasively using a zero-heat-flux thermometer placed on the forehead, which might not precisely reflect deep intracranial temperatures. Third, although we proposed plausible physiological mechanisms linking lower BT to impaired cerebral metabolism and perfusion, our study did not include comparisons with established prognostic tools, such as neuroimaging, neurophysiological assessments, and serum biomarker measurements, which could have provided more comprehensive insights. Despite the fair prognostic performance of BT (AUC, 0.728–0.773), direct comparisons with these prognostic tools would better clarify its role within a multimodal prognostic framework for cardiac arrest survivors. Fourth, our analysis was limited to patients who received TTM with a target temperature of 33 °C. As a result, we could not determine whether BT serves as a reliable predictor of neurological outcomes across various target temperatures. This limitation is particularly relevant given recent guideline recommendations favoring more individualized TTM strategies (e.g., 33–36 °C). Although a subset of patients (n = 25) in our cohort were treated at temperatures other than 33 °C, the sample size was insufficient for analysis. Future studies involving larger and more heterogeneous patient populations treated with various TTM strategies are warranted to enhance the external validity of our findings. Fifth, we examined neurological outcomes at 6 months after ROSC via structured phone interviews using the CPC scale. Although this method is practical for long-term follow-up, it may be less precise than in-person assessments and susceptible to observer bias, particularly when differentiating between adjacent categories such as CPC 3 (severe disability) and CPC 4 (vegetative state). Finally, this study focused on representative BT values at the initiation of TTM and during the maintenance phase. However, we did not examine temporal trends or fluctuations in BT throughout the entire cooling period. Future studies incorporating continuous BT monitoring may provide additional prognostic insights beyond those offered by static temperature measurements.
In this study, comatose OHCA patients who received TTM at 33 °C had a lower BT measured at both the initiation and maintenance phases of TTM. These BTs were independently associated with poor neurological outcomes at 6 months after ROSC. BT measurements demonstrated better prognostic value than CT. Our findings suggest that BT could serve as a more precise marker of hypoxic brain injury following cardiac arrest. Further larger-scale, multicenter studies would help confirm these findings and determine the clinical implications of direct BT monitoring during TTM.
All data generated or analyzed during this study are included in this article and its supplementary material files. Further enquiries can be directed to the corresponding author.
SJR: Conceptualization, Data curation, Investigation, Writing-original draft, Writing-review & editing; BKL: Conceptualization, Data curation, Investigation, Writing-original draft, Writing-review & editing; DHL: Conceptualization, Formal analysis, Methodology, Project administration, Software, Writing-original draft, Writing-review & editing; YHJ: Conceptualization, Data curation, Investigation, Writing-review & editing; KWJ: Conceptualization, Data curation, Investigation, Writing-review & editing, Supervision; WYH: Data curation, Resources, Validation, Writing-review & editing. All authors read and approved the final manuscript. All authors have participated sufficiently in the work and agreed to be accountable for all aspects of the work.
The study was carried out in accordance with the guidelines of the Declaration of Helsinki and approved by the Ethics Committee of the Chonnam National University Hospital Institutional Review Board (Protocol No. CNUH-2021-017). Written informed consent was secured from all patients or their legal guardians before inclusion.
Not applicable.
This study was supported by a grant (HCRI23024) of Chonnam National University Hwasun Hospital Institute for Biomedical Science.
The authors declare no conflict of interest.
Supplementary material associated with this article can be found, in the online version, at https://doi.org/10.31083/RCM43855.
References
Publisher’s Note: IMR Press stays neutral with regard to jurisdictional claims in published maps and institutional affiliations.