


 , Yang Gao 1,2,†, Zhiwen Zhang 1,2, Zhuocheng Shi 1, Haosen Yu 1, Tong Zhang 1, Mingxing Lv 1, Donghui Chen 1, Zhenzhou Zhao 1, Yushuo Gu 1, Quan Guo 1,2, Cao Ma 1,*
 , Muwei Li 1,2,3,4,*
1 Department of Cardiology, Central China Fuwai Hospital of Zhengzhou University, Fuwai Central China Cardiovascular Hospital, 450000 Zhengzhou, Henan, China
2 Department of Cardiology, Zhengzhou University People's Hospital, Henan Provincial People's Hospital, 450000 Zhengzhou, Henan, China
3 Central China Subcenter of National Center for Cardiovascular Diseases, Henan Cardiovascular Disease Center, 450000 Zhengzhou, Henan, China
4 Henan Provincial Clinical Research Center for Cardiovascular Disease, 450000 Zhengzhou, Henan, China
†These authors contributed equally.
Abstract
Previous studies have shown a strong link between sleep and cardiovascular disease. However, the association of sleep duration and quality with coronary atherosclerotic plaque vulnerability remains unclear. This study aimed to investigate the correlation between sleep duration, sleep quality, and coronary plaque vulnerability using optical coherence tomography (OCT).
A total of 260 patients with stable angina who completed an OCT examination were included. Patients were divided into a thin-cap fibroatheroma (TCFA) group and a non-TCFA group according to the presence of TCFA on OCT. The sleep duration of the patients was recorded by questionnaire, and the sleep quality was evaluated using the Pittsburgh Sleep Quality Index (PSQI).
The TCFA group had significantly shorter sleep duration and higher PSQI values (p < 0.05). A multivariable logistic regression analysis revealed that sleep duration and PSQI were independent predictors of TCFA (p < 0.05). A receiver operating characteristic (ROC) study demonstrated that the area under the curve values for sleep duration and PSQI were 0.698 and 0.721, respectively, in predicting the presence of TCFA. Patients with a sleep duration ≤5.5 hours or a PSQI value >9 had a thinner fibrous cap thickness, a larger maximal lipid pool arc, and a higher incidence of TCFA and macrophage deposition (p < 0.05). Sleep duration was positively correlated with the thinnest fibrous cap thickness (r = 0.451; p < 0.001), and negatively correlated with the radian of the maximum lipid pool (r = –0.470; p < 0.001). The PSQI was negatively correlated with the thinnest fibrous cap thickness (r = –0.477; p < 0.001), and positively correlated with the radian of maximum lipid pool (r = 0.340; p < 0.001).
Both sleep duration and sleep quality were significantly associated with coronary plaque vulnerability. Patients with either insufficient sleep duration or poor sleep quality exhibited significantly greater plaque vulnerability.
Keywords
- sleep duration
- sleep quality
- thin-cap fibroatheroma
- plaque vulnerability
- optical coherence tomography
While significant progress has been made in cardiovascular disease management, ischemic heart disease persists as the predominant global mortality factor and continues to pose substantial public health challenges [1]. The rupture of vulnerable plaques and the subsequent acute thrombosis are considered the main mechanisms underlying most acute coronary syndromes and adverse cardiovascular events [2, 3, 4]. A study has shown that vulnerable plaque characteristics have higher predictive value for major adverse cardiovascular events (MACE) than the degree of arterial stenosis alone [5]. Therefore, early identification of vulnerable coronary plaques and proactive management of risk factors are extremely important in mitigating MACE. Vulnerable plaques typically exhibit a large lipid core, a thin fibrous cap, and infiltration by macrophages. Thin-cap fibroatheroma (TCFA) is the prototypical vulnerable plaque lesion and is widely recognized as a precursor to plaque rupture [6]. Intravascular optical coherence tomography (OCT), characterized by its high resolution and speed, can accurately identify vulnerable plaque features such as TCFA. It is currently the best intravascular imaging technique and is widely used in studies related to vulnerable plaques [7, 8].
Sleep disorders, including insufficient sleep or poor sleep quality, are increasingly recognized yet often overlooked determinants of health [9]. Sleep disorders can affect the functions of multiple systems, including the cardiovascular, respiratory, digestive, and nervous systems, through neural, humoral, and immune pathways and are direct causes or triggers of many fatal diseases [10]. Numerous studies have demonstrated that insufficient sleep and poor sleep quality are strongly associated with an increased prevalence of coronary heart disease (CHD) and MACE [11, 12, 13, 14, 15]. A healthy sleep pattern can significantly reduce the risk of CHD, cardiovascular disease, and stroke [16, 17]. In 2022, the American Heart Association updated its list of the top eight lifestyle habits that affect cardiovascular health. Sleep was included for the first time, with the statement that adequate sleep and good sleep quality are particularly important for maintaining cardiovascular health [18]. While extensive research has investigated the relationship between sleep duration, sleep quality, and cardiovascular diseases, no studies to date have explored their potential association with coronary artery plaque vulnerability.
We hypothesize that insufficient sleep or poor sleep quality may increase the risk of MACE by increasing the vulnerability of plaques. Therefore, this study aims to investigate the correlation between sleep duration, sleep quality, and vulnerability of coronary artery plaques in patients with stable angina.
A total of 260 patients with stable angina who underwent OCT in the Central China Fuwai Hospital of Zhengzhou University from September 2020 to September 2023 were included in this study. Patients who met the inclusion and exclusion criteria were asked to complete a questionnaire the day after the OCT examination. An experienced researcher provided detailed explanations of the questionnaire to the patients before they answered. The sleep duration of the patients was recorded according to the results of the questionnaire survey, and the sleep quality of the patients was evaluated by Pittsburgh sleep quality index (PSQI).
Inclusion criteria: (1) meet the American College of Cardiology/American Heart
Association diagnostic criteria for stable angina [19]; (2) complete the coronary
angiography (CAG) and OCT examination; (3) voluntarily sign informed consent and
cooperate to complete the questionnaire; (4) age
Exclusion criteria: (1) patients with chronic occlusion, extreme tortuosity or severe calcification of vessels that cannot be examined by OCT; (2) patients with allergy to contrast media or contraindications to aspirin or ticagrelor who cannot undergo CAG; (3) patients with a history of coronary artery bypass grafting or coronary stent implantation; (4) patients with severe heart failure, endstage renal disease or severe liver dysfunction; (5) patients with other inflammation-related diseases such as cancer, infection and autoimmune diseases; (6) patients with severe mental illness or cognitive impairment who cannot cooperate to complete the questionnaire; (7) patients with poor OCT image quality that cannot be analyzed; (8) patients with missing clinical data.
Patients were divided into a TCFA group (86 cases) and a non-TCFA group (174
cases) according to whether there was at least one TCFA in the coronary artery on
OCT examination. According to the optimal cut-off value of sleep duration in the
receiver operating characteristic (ROC) curve analysis to predict the presence of
TCFA, the patients were divided into a sleep duration
The clinical data of the patients were collected through the medical record
system of the Central China Fuwai Hospital of Zhengzhou University. Data
included: (1) General information: age, gender, body mass index, family history
of CHD, history of diabetes, history of hypertension, history of hyperlipidemia,
smoking history, and drinking history; (2) Laboratory examination indicators: red
blood cell count, hemoglobin concentration, white blood cell count, platelet
count, alanine transaminase, aspartate aminotransferase, total cholesterol (TC),
triglyceride, low-density lipoprotein cholesterol (LDL-C), high-density
lipoprotein cholesterol, glycosylated hemoglobin, albumin, globulin, urea,
creatinine, uric acid, estimated glomerular filtration rate, fasting blood
glucose, and C-reactive protein (CRP); (3) Results of ultrasound: left
ventricular ejection fraction; (4) Medication history (regularly taken for more
than one month): aspirin, statins,
All patients completed a questionnaire the day after undergoing OCT. Before administering the questionnaire, the contents of the questionnaire were explained in detail to the patients by trained research staff. The sleep duration survey was in the form of a self-report, with patients self-assessing the mean nighttime sleep duration, which was recorded by the investigator. PSQI was used to evaluate the sleep quality of patients in the past month, including 19 selfrating items and 5 evaluation items [20]. The PSQI consists of seven components: (1) subjective sleep quality, (2) sleep latency, (3) sleep persistence, (4) habitual sleep efficiency, (5) sleep disturbances, (6) daytime dysfunction, and (7) use of sleep medications. Each component was scored on a 0–3 scale, with a higher total PSQI indicating worse sleep quality.
All OCT images were obtained with Dragonfly OPTIS imaging catheter and intravascular catheter System (OPTIS™ MOBILE System; Abbott Vascular, Shanghai, China). Two experienced interventionalists completed the OCT examination of the target vessels by the non-balloon occlusion technique. The OCT imaging catheter was advanced to the distal vessel segment along the guidewire. Following contrast injection, automated pullback was initiated. Upon completion of image acquisition, the catheter was withdrawn. All OCT procedures were performed after coronary arteriography was completed, and intracoronary nitroglycerin was administered before the OCT examination.
OCT images of all patients were analyzed at an independent laboratory (Henan
Provincial Key Laboratory of Coronary Imaging Medicine, Zhengzhou, China) by two
independent and experienced interventional technicians who were unaware of the
patient’s clinical information. In case of inconsistent observations, concordant
results were obtained from a third interventional technician. OCT images were
analyzed according to consensus criteria [7]. The following parameters were
analyzed: plaque length, proximal reference area, proximal reference diameter,
distal reference area, distal reference diameter, minimum lumen area, thinnest
fibrous cap thickness, maximal lipid pool arc, TCFA, macrophage deposits,
cholesterol crystals, microchannels, calcified nodules, plaque erosion, and other
relevant data. Three measurements were taken at the thinnest part of the fibrous
cap, and the mean of the three measurements was calculated and recorded as the
thinnest fibrous cap thickness. The lipid pool arc was measured at 1-mm intervals
throughout the plaque, with the maximum value recorded as the maximal lipid pool
arc. TCFA was defined as a lipid rich plaque exhibiting both: (1) maximal lipid
pool arc
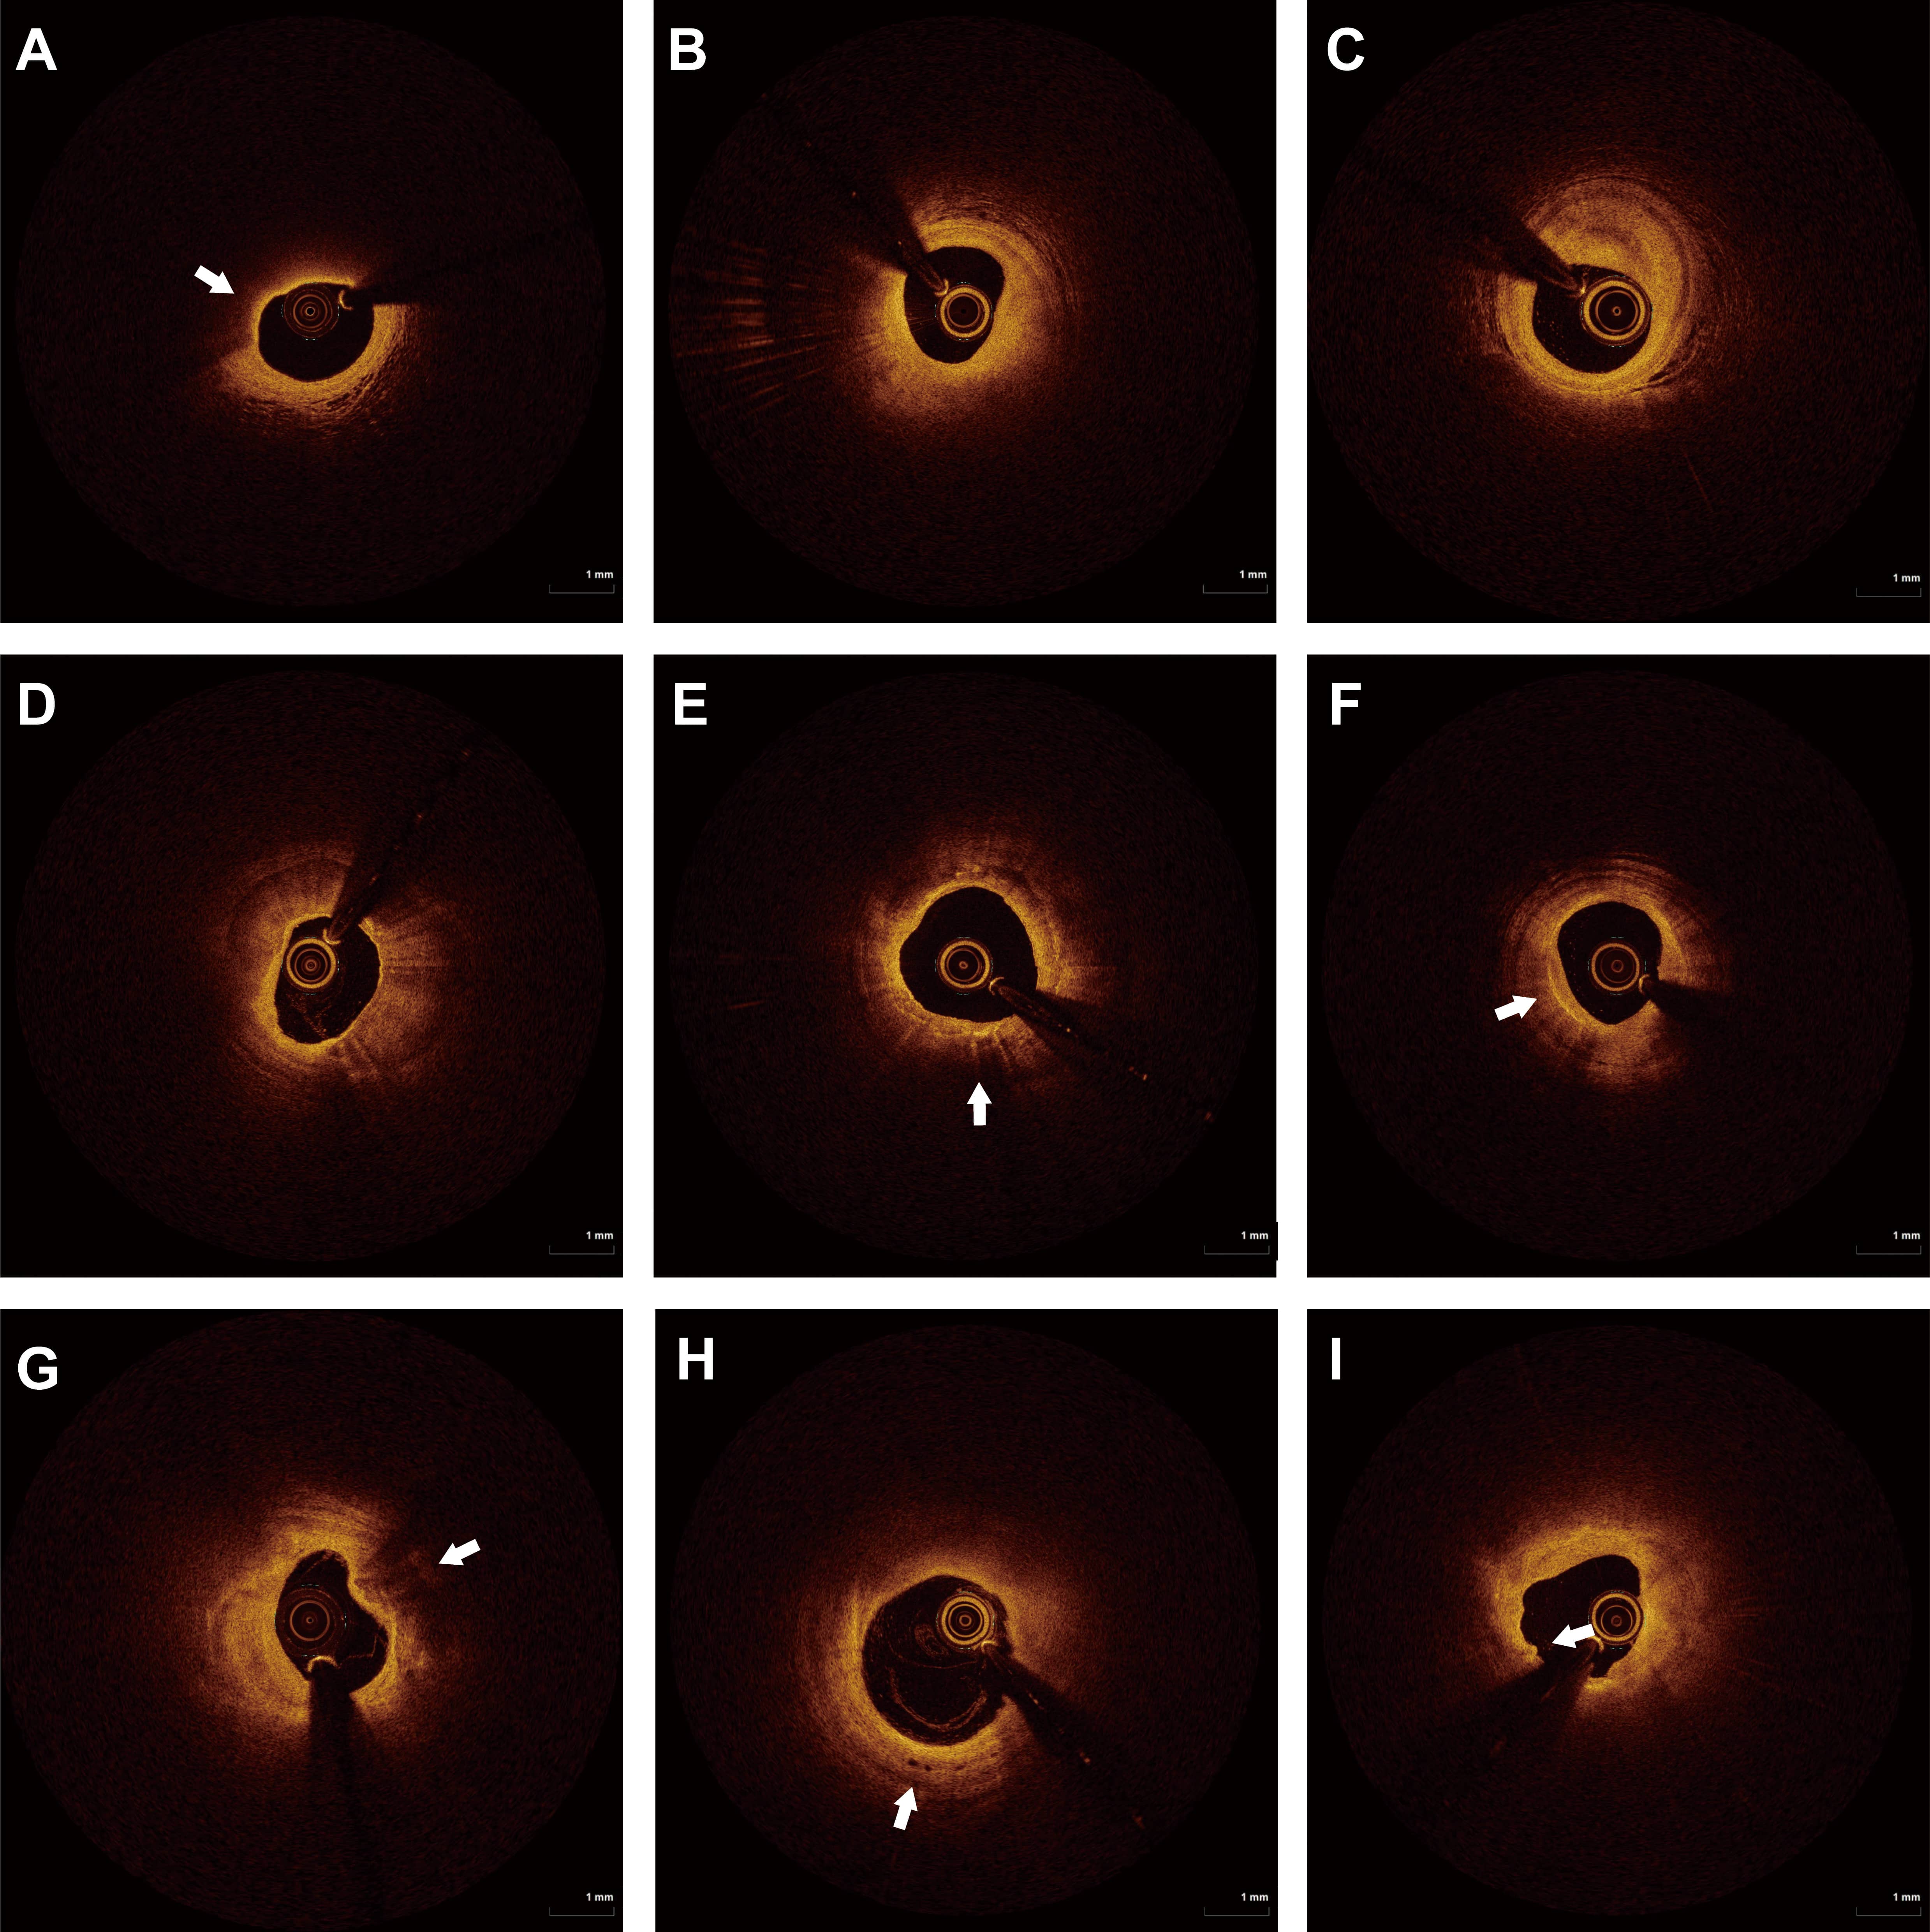 Fig. 1.
OCT images of typical plaque features. (A) TCFA. (B) Thick fiber cap lipid plaque. (C) Fibrous patches. (D) Calcified plaques. (E) Macrophage deposits. (F) Cholesterol crystals. (G) Calcified nodules. (H) Microchannel. (I) Plaque erosion. The white arrows point to typical plaque features on OCT images. OCT, optical coherence tomography; TCFA, Thin-cap fibroatheroma.
Data analysis was conducted with SPSS 25.0 (IBM Corp., Armonk, NY, USA).
Normally distributed continuous variables were reported as mean
A total of 260 patients with stable angina who underwent OCT examination in the
Central China Fuwai Hospital of Zhengzhou University from September 2020 to
September 2023 were included. Patients were divided into a non-TCFA group (n =
174) and a TCFA (n = 86) group based on the presence of TCFA. Table 1 compares
the clinical data of the two groups. The results of the univariate analysis
showed that the sleep duration in the TCFA group was significantly shorter (5.51
| Variable | TCFA (n = 86) | non-TCFA (n = 174) | Test values | p-value | |
| Age, years | 58.26 |
57.03 |
0.770 | 0.443 | |
| Male, n (%) | 68 (79.07) | 138 (79.31) | 0.002 | 0.964 | |
| BMI, kg/m2 | 26.08 |
25.80 |
0.687 | 0.493 | |
| Family history, n (%) | 10 (11.63) | 17 (9.77) | 0.213 | 0.644 | |
| Diabetes, n (%) | 31 (36.05) | 42 (24.14) | 4.042 | 0.044 | |
| Hypertension, n (%) | 47 (54.65) | 95 (54.60) | 0.001 | 0.994 | |
| Hyperlipidemia, n (%) | 19 (22.09) | 33 (18.97) | 0.352 | 0.553 | |
| Smoking history, n (%) | 42 (48.84) | 85 (48.85) | 0.001 | 0.998 | |
| Drinking history, n (%) | 21 (24.42) | 60 (34.48) | 2.718 | 0.099 | |
| RBC, 109/L | 4.41 |
4.42 |
–0.206 | 0.837 | |
| Hb, g/L | 137.11 |
137.43 |
–0.173 | 0.863 | |
| WBC,109/L | 6.64 |
6.56 |
0.430 | 0.668 | |
| PLT, 106/L | 219.72 |
217.50 |
0.312 | 0.756 | |
| ALT, U/L | 26.41 |
27.42 |
–0.692 | 0.489 | |
| AST, U/L | 20.20 (16.00–25.85) | 20.10 (15.60–25.78) | –0.202 | 0.840 | |
| TC, mmol/L | 3.70 |
3.39 |
2.607 | 0.010 | |
| TG, mmol/L | 1.48 (1.09–2.02) | 1.32 (0.95–1.82) | –1.431 | 0.152 | |
| LDL-C, mmol/L | 2.45 |
2.08 |
3.563 | 0.001 | |
| HDL-C, mmol/L | 1.01 |
1.02 |
–0.252 | 0.802 | |
| HbA1c, % | 5.84 (5.47–6.15) | 5.75 (5.42–6.23) | –0.594 | 0.552 | |
| Albumin, g/L | 41.39 |
41.89 |
–1.052 | 0.294 | |
| Globulin, g/L | 22.03 |
21.88 |
0.380 | 0.704 | |
| BUN, mmol/L | 5.28 |
5.52 |
–1.290 | 0.198 | |
| CR, µmol/L | 72.08 |
71.82 |
0.141 | 0.888 | |
| UA, µmol/L | 312.62 |
317.71 |
0.185 | 0.853 | |
| eGFR, mL/min/1.73 m2 | 91.06 |
90.09 |
0.516 | 0.606 | |
| Glucose, mmol/L | 5.21 (4.61–6.23) | 5.01 (4.54–5.92) | –0.212 | 0.832 | |
| CRP, mg/L | 2.95 |
2.56 |
3.449 | 0.001 | |
| LVEF, % | 57.87 |
57.20 |
0.901 | 0.368 | |
| Sleep duration, h | 5.51 |
6.69 |
–5.623 | ||
| PSQI | 9.94 |
7.28 |
6.573 | ||
| Medication | |||||
| Aspirin, n (%) | 48 (57.14) | 118 (67.82) | 3.592 | 0.058 | |
| Statin, n (%) | 50 (59.52) | 120 (68.97) | 2.980 | 0.084 | |
| Beta blocker, n (%) | 31 (36.05) | 65 (37.36) | 0.042 | 0.837 | |
| ACEI/ARB, n (%) | 25 (29.07) | 39 (22.41) | 1.374 | 0.241 | |
| Alprazolam/Estazolam, n (%) | 14 (16.28) | 19 (10.92) | 1.492 | 0.222 | |
BMI, body mass index; RBC, red blood cells; Hb, hemoglobin; WBC, white blood cells; PLT, platelets; ALT, alanine transaminase; AST, aspartate aminotransferase; TC, total cholesterol; TG, triglycerides; LDL-C, low-density lipoprotein cholesterol; HDL-C, high-density lipoprotein cholesterol; HbA1c, glycated hemoglobin; BUN, blood urea nitrogen; CR, creatinine; UA, uric acid; eGFR, estimated glomerular filtration rate; CRP, C-reactive protein; LVEF, left ventricular ejection fraction; PSQI, Pittsburgh Sleep Quality Index; ACEI, angiotensin-converting enzyme inhibitor; ARB, angiotensin receptor blocker; TCFA, thin-cap fibroatheroma.
TCFA presence (non-TCFA group assigned a value of 0, TCFA group assigned a value of 1) served as the dependent variable. All variables demonstrating statistical significance in univariate analysis were entered into a multivariate logistic regression model to identify independent predictors of TCFA among stable angina patients. The results are detailed in Table 2. Sleep duration, PSQI, history of diabetes, LDL-C, and CRP were identified as independent predictors of TCFA in patients with stable angina [Sleep duration: OR = 0.764, 95% CI (0.625–0.932); PSQI: OR = 1.233, 95% CI (1.108–1.372); diabetes: OR = 2.081, 95% CI (1.078–4.015); LDL-C: OR = 2.222, 95% CI (1.109–4.453); CRP: OR = 1.543, 95% CI (1.097–2.172)].
| Variable | Wald | OR | 95% CI | p-value | |
| Diabetes, n (%) | –0.733 | 4.773 | 2.081 | 1.078–4.015 | 0.029 |
| TC, mmol/L | –0.135 | 0.221 | 0.874 | 0.498–1.534 | 0.638 |
| LDL-C, mmol/L | 0.798 | 5.065 | 2.222 | 1.109–4.453 | 0.024 |
| CRP, mg/L | 0.434 | 6.206 | 1.543 | 1.097–2.172 | 0.013 |
| Sleep duration, h | –0.270 | 7.031 | 0.764 | 0.625–0.932 | 0.008 |
| PSQI | 0.209 | 14.743 | 1.233 | 1.108–1.372 | |
| Constant | –3.586 | 8.443 | 0.028 | - | 0.004 |
TC, total cholesterol; LDL-C, low-density lipoprotein cholesterol; CRP,
C-reactive protein; PSQI, Pittsburgh Sleep Quality Index;
The ROC curve analysis further validated the predictive value of sleep duration and PSQI for the presence of TCFA in patients with stable angina. The results are shown in Fig. 2.
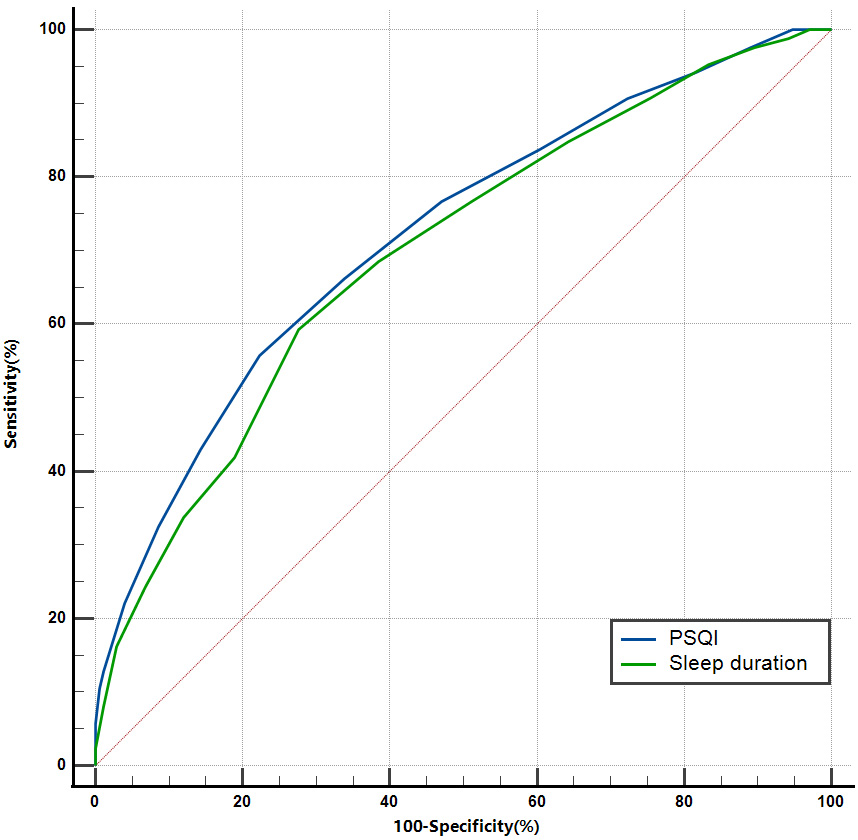 Fig. 2.
ROC curve of sleep duration and PSQI for predicting the presence of TCFA in patients with stable angina. PSQI, Pittsburgh Sleep Quality Index; TCFA, thin-cap fibroatheroma; ROC, receiver operating characteristic.
The AUC for sleep duration predicting TCFA was 0.698 (95% CI: 0.639–0.754;
p
The AUC for PSQI predicting TCFA was 0.721 (95% CI: 0.663–0.775; p
Although the area under the curve of PSQI predicting TCFA was larger than that of sleep duration, there was no statistical difference (p = 0.573).
Patients were divided into two groups according to the optimal cut-off value of
sleep time: sleep duration
| Variable | Sleep duration |
Sleep duration |
Test values | p-value | |
| Age, years | 57.60 |
57.36 |
0.154 | 0.878 | |
| Male, n (%) | 80 (80.81) | 126 (78.26) | 0.242 | 0.623 | |
| BMI, kg/m2 | 25.80 (23.60–27.70) | 25.40 (24.20–27.35) | –0.053 | 0.958 | |
| Family history, n (%) | 11 (11.11) | 16 (9.94) | 0.091 | 0.763 | |
| Diabetes, n (%) | 28 (28.28) | 45 (27.95) | 0.003 | 0.954 | |
| Hypertension, n (%) | 60 (60.61) | 82 (50.93) | 2.315 | 0.128 | |
| Hyperlipidemia, n (%) | 25 (25.25) | 27 (16.77) | 2.757 | 0.097 | |
| Smoking history, n (%) | 50 (50.51) | 77 (47.83) | 0.176 | 0.675 | |
| Drinking history, n (%) | 26 (26.26) | 54 (33.54) | 1.524 | 0.217 | |
| TC, mmol/L | 3.586 |
3.431 |
1.336 | 0.183 | |
| TG, mmol/L | 1.37 (1.04–1.83) | 1.32 (0.95–1.91) | –0.034 | 0.973 | |
| LDL-C, mmol/L | 2.25 (1.83–2.79) | 2.03 (1.69–2.50) | –2.377 | 0.017 | |
| HDL-C, mmol/L | 0.98 (0.86–1.12) | 1.01 (0.85–1.20) | –1.198 | 0.231 | |
| HbA1c, % | 5.73 (5.46–6.14) | 5.85 (5.41–6.23) | –0.468 | 0.640 | |
| Glucose, mmol/L | 4.98 (4.44–5.86) | 5.15 (4.57–6.16) | –1.351 | 0.177 | |
| CRP, mg/L | 2.946 |
2.527 |
3.754 | ||
| Target vessels, n (%) | 3.225 | 0.199 | |||
| LAD | 64 (64.65) | 120 (74.53) | |||
| LCX | 15 (15.15) | 15 (9.32) | |||
| RCA | 20 (20.20) | 26 (16.15) | |||
| Plaque length, mm | 22.71 |
21.75 |
0.966 | 0.335 | |
| Proximal reference area, mm2 | 9.57 |
10.04 |
–1.176 | 0.241 | |
| Proximal reference diameter, mm | 3.47 |
3.52 |
–0.669 | 0.485 | |
| Distal reference area, mm2 | 7.64 |
8.10 |
–1.469 | 0.143 | |
| Distal reference diameter, mm | 3.07 |
3.15 |
–1.240 | 0.216 | |
| Minimum lumen area, mm2 | 2.36 |
2.65 |
–2.752 | 0.006 | |
| Thinnest fibrous cap thickness, µm | 65.00 (44.00–136.00) | 99.00 (72.50–199.00) | –4.546 | ||
| Maximal lipid pool arc, deg | 220.00 (180.00–300.00) | 180.00 (150.00–230.00) | –4.230 | ||
| TCFA, n (%) | 51 (51.52) | 35 (21.74) | 24.554 | ||
| Macrophage, n (%) | 26 (26.26) | 22 (13.66) | 6.463 | 0.011 | |
| Cholesterol crystal, n (%) | 53 (53.54) | 82 (50.93) | 0.166 | 0.683 | |
| Microchannel, n (%) | 21 (21.21) | 50 (31.06) | 2.993 | 0.084 | |
| Calcified nodule, n (%) | 6 (6.06) | 12 (7.45) | 0.185 | 0.667 | |
| Plaque erosion, n (%) | 21 (21.21) | 20 (12.42) | 3.566 | 0.059 | |
BMI, body mass index; TC, total cholesterol; TG, triglycerides; LDL-C, low-density lipoprotein cholesterol; HDL-C, high-density lipoprotein cholesterol; HbA1c, glycated hemoglobin; CRP, C-reactive protein; LAD, left anterior descending artery; LCX, left circumflex artery; RCA, right coronary artery; TCFA, thin-cap fibroatheroma; OCT, optical coherence tomography.
Patients were divided into two groups according to the optimal cut-off value of
PSQI: PSQI
| Variable | PSQI |
PSQI |
Test values | p-value | |
| Age, years | 56.79 |
58.77 |
1.260 | 0.209 | |
| Male, n (%) | 143 (82.66) | 63 (72.41) | 3.692 | 0.055 | |
| BMI, kg/m2 | 25.40 (24.25–27.45) | 25.50 (23.80–27.80) | –0.213 | 0.831 | |
| Family history, n (%) | 21 (12.14) | 6 (6.90) | 1.709 | 0.191 | |
| Diabetes, n (%) | 47 (27.17) | 26 (29.89) | 0.212 | 0.645 | |
| Hypertension, n (%) | 93 (53.76) | 49 (56.32) | 0.154 | 0.695 | |
| Hyperlipidemia, n (%) | 31 (17.92) | 21 (24.14) | 1.399 | 0.237 | |
| Smoking history, n (%) | 88 (50.87) | 39 (44.83) | 0.845 | 0.358 | |
| Drinking history, n (%) | 60 (34.68) | 20 (22.99) | 3.716 | 0.054 | |
| TC, mmol/L | 3.38 (2.81–3.93) | 3.45 (2.84–4.21) | –0.548 | 0.584 | |
| TG, mmol/L | 1.38 (0.95–1.88) | 1.27 (1.08–1.85) | –0.54 | 0.957 | |
| LDL-C, mmol/L | 2.08 (1.70–2.52) | 2.21 (1.78–2.62) | –1.228 | 0.220 | |
| HDL-C, mmol/L | 0.99 (0.84–1.17) | 1.01 (0.88–1.16) | –0.843 | 0.399 | |
| HbA1c, % | 5.79 (5.43–6.21) | 5.75 (5.43–6.18) | –0.032 | 0.974 | |
| Glucose, mmol/L | 5.08 (4.59–5.98) | 4.98 (4.43–5.92) | –1.018 | 0.309 | |
| CRP, mg/L | 2.60 |
2.86 |
2.178 | 0.030 | |
| Target vessels, n (%) | 0.313 | 0.855 | |||
| LAD | 124 (71.68) | 60 (68.97) | |||
| LCX | 20 (11.56) | 10 (11.49) | |||
| RCA | 26 (15.03) | 17 (19.54) | |||
| Plaque length, mm | 21.93 |
22.50 |
0.553 | 0.581 | |
| Proximal reference area, mm2 | 9.62 |
10.22 |
1.510 | 0.132 | |
| Proximal reference diameter, mm | 3.44 |
3.58 |
1.923 | 0.056 | |
| Distal reference area, mm2 | 7.95 |
7.87 |
–0.236 | 0.813 | |
| Distal reference diameter, mm | 3.13 |
3.12 |
–0.136 | 0.892 | |
| Minimum lumen area, mm2 | 2.61 |
2.39 |
–2.178 | 0.030 | |
| Thinnest fibrous cap thickness, µm | 99.00 (72.00–201.50) | 62.00 (41.00–135.00) | –5.011 | ||
| Maximal lipid pool arc, deg | 180.00 (150.00–220.00) | 240.00 (180.00–300.00) | –5.134 | ||
| TCFA, n (%) | 38 (21.96) | 48 (55.17) | 28.837 | ||
| Macrophage, n (%) | 26 (15.03) | 22 (25.29) | 4.047 | 0.044 | |
| Cholesterol crystal, n (%) | 86 (49.71) | 49 (56.32) | 1.013 | 0.314 | |
| Microchannel, n (%) | 52 (30.06) | 19 (21.84) | 1.970 | 0.160 | |
| Calcified nodule, n (%) | 12 (6.94) | 6 (6.90) | 0.001 | 0.990 | |
| Plaque erosion, n (%) | 19 (10.98) | 22 (25.29) | 8.918 | 0.003 | |
BMI, body mass index; TC, total cholesterol; TG, triglycerides; LDL-C, low-density lipoprotein cholesterol; HDL-C, high-density lipoprotein cholesterol; HbA1c, glycated hemoglobin; CRP, C-reactive protein; LAD, left anterior descending artery; LCX, left circumflex artery; RCA, right coronary artery; TCFA, thin-cap fibroatheroma; PSQI, Pittsburgh Sleep Quality Index; OCT, optical coherence tomography.
Spearman correlation analysis was used to evaluate the correlation of sleep
duration and PSQI with the thinnest fibrous cap thickness and the maximum radian
of lipid pool. The results are shown in Fig. 3. Sleep duration was positively
correlated with the thinnest cap thickness (r = 0.451; p
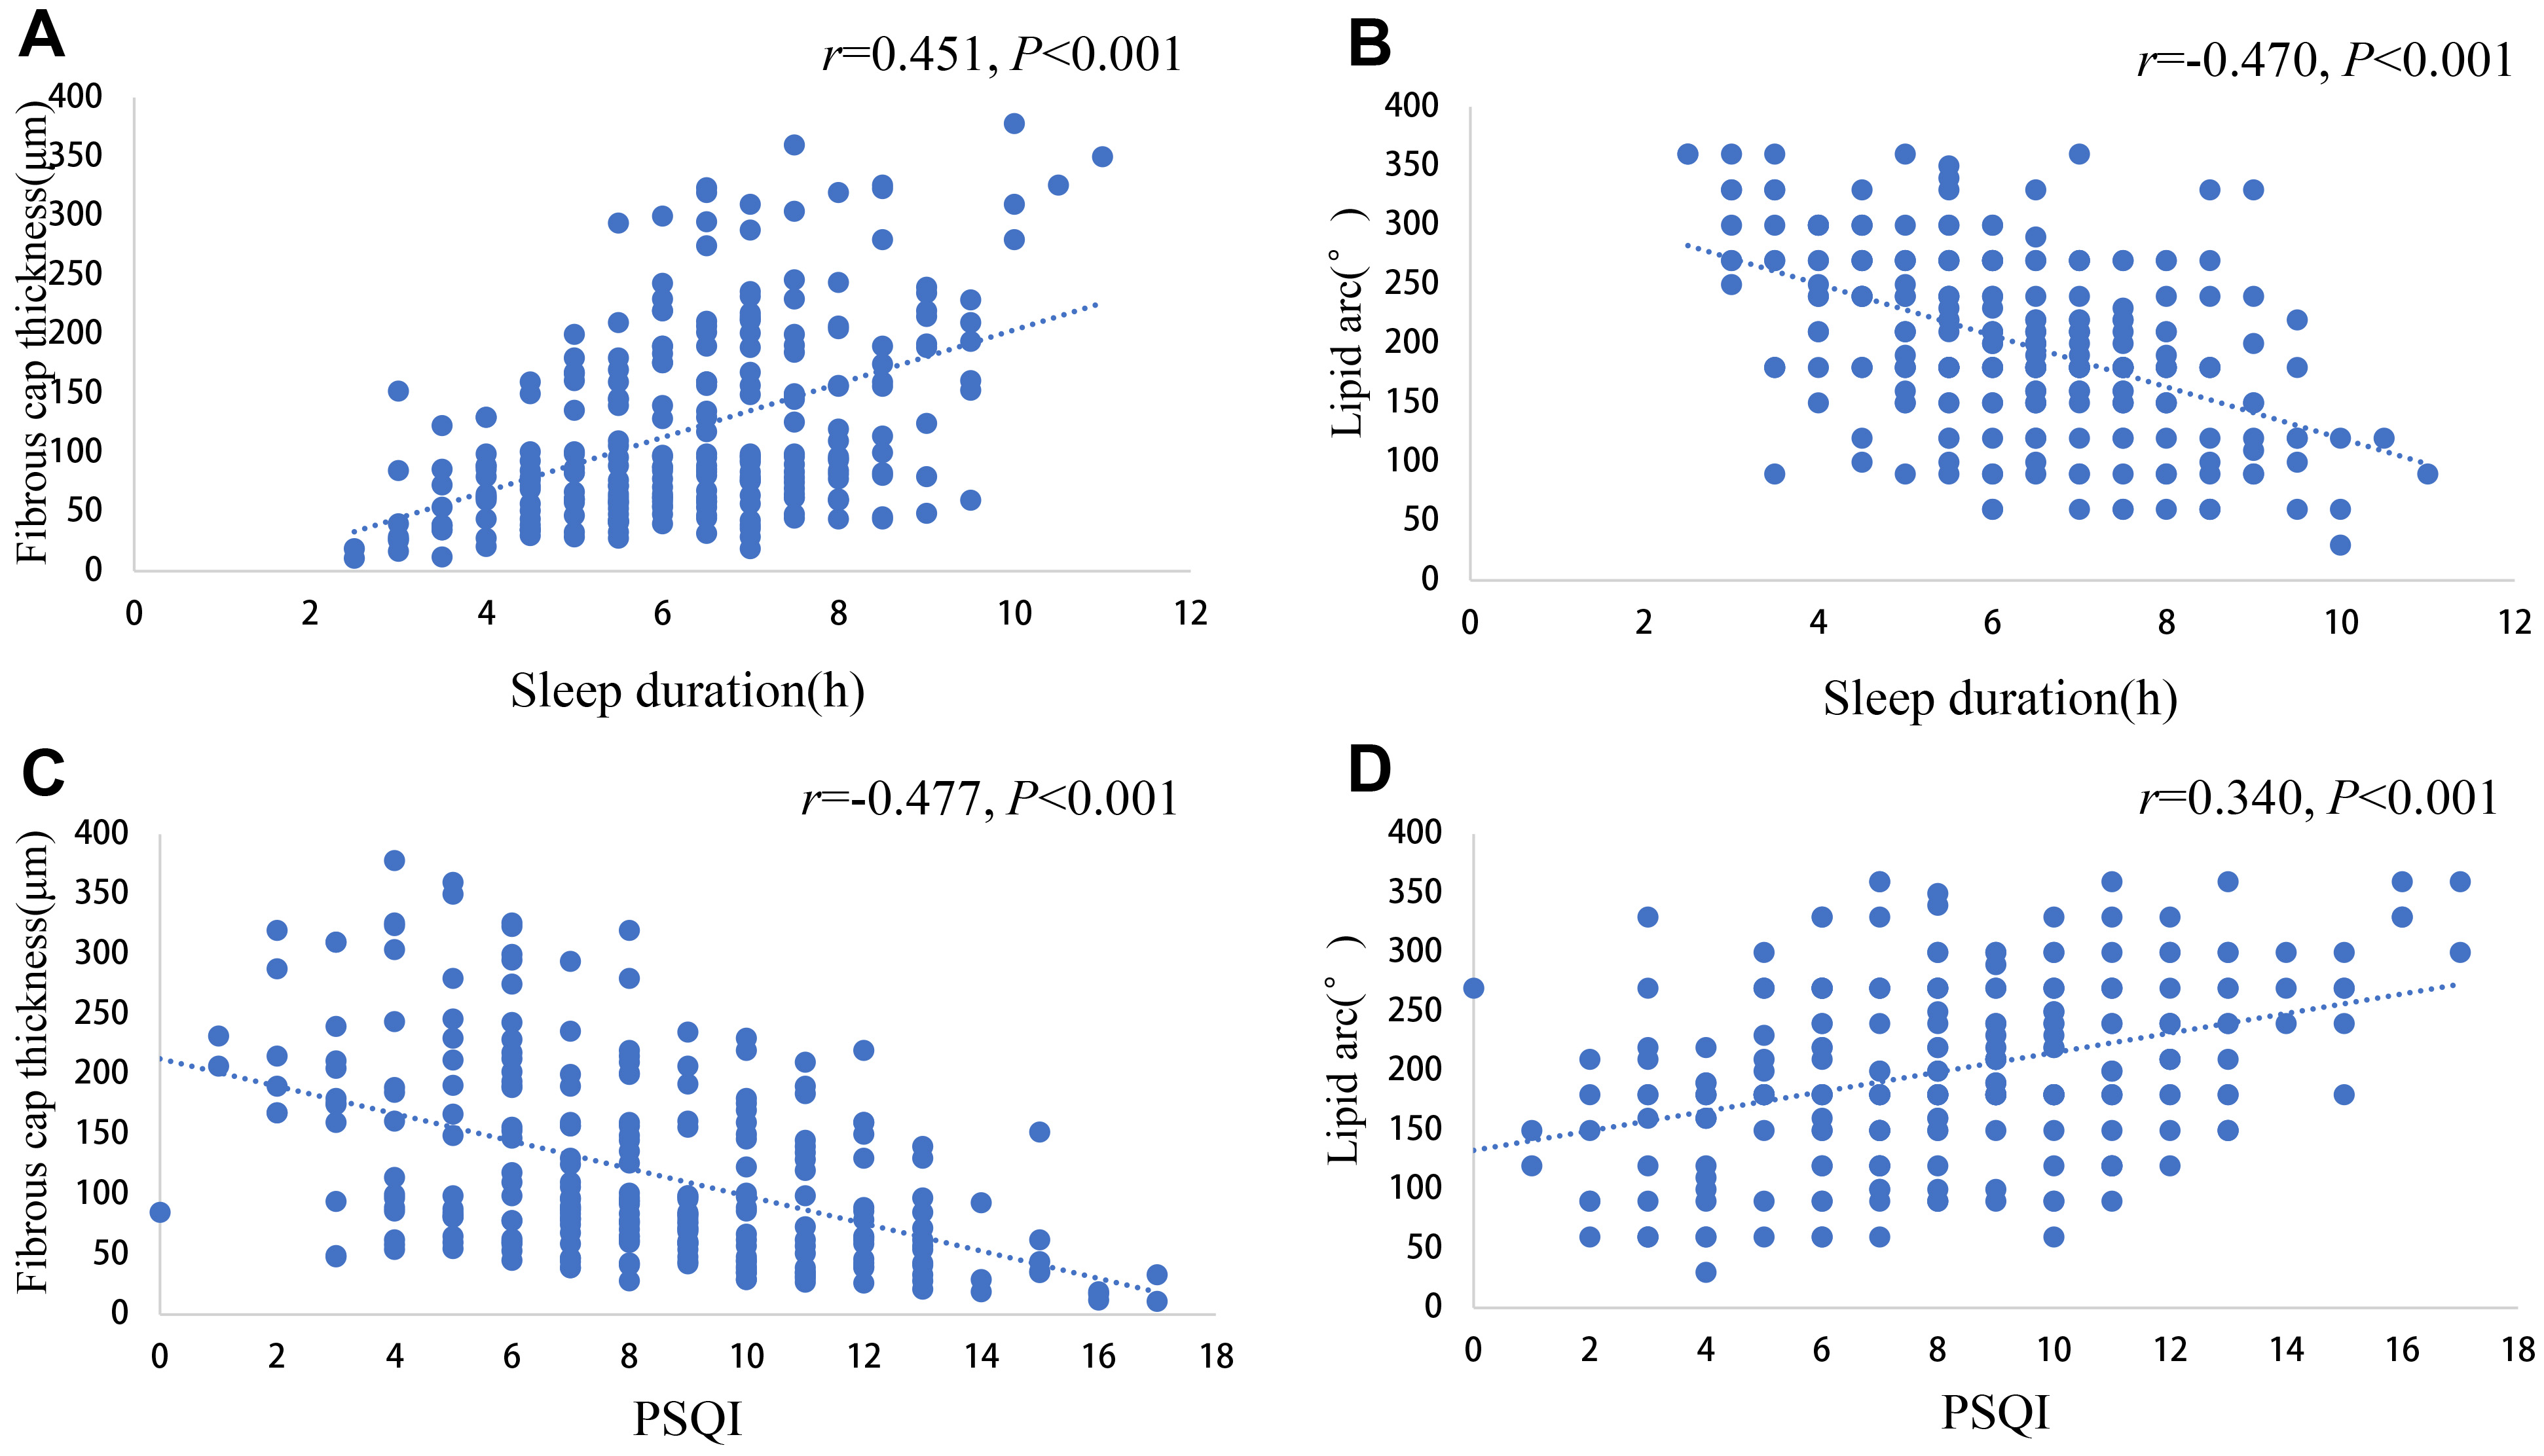 Fig. 3.
Scatter plot of correlations of sleep duration and PSQI with thinnest fibrous cap thickness and maximal radian of lipid pool. (A) Scatter plot showing the correlation between sleep duration and the thinnest cap thickness. (B) Scatter plot showing the correlation between sleep duration and the radian of maximum lipid pool. (C) Scatter plot showing the correlation between PSQI and the thinnest fiber cap thickness. (D) Scatter plot showing the correlation between PSQI and the radian of maximum lipid pool. PSQI, Pittsburgh Sleep Quality Index.
This study explored the association of sleep duration and quality with coronary
atherosclerotic plaque vulnerability. The analysis demonstrated that sleep
duration and quality were closely related to the presence of TCFA in patients
with stable angina. Patients in the TCFA group had shorter sleep duration and
worse sleep quality. Both sleep duration and quality are independent predictors
of TCFA in patients with stable angina. Stable angina patients with sleep
duration
The formation and development of coronary atherosclerotic plaques is a dynamic and evolving process. Vulnerable plaques, which are prone to rupture and thrombosis, play a significant role in the rapid progression of the disease. These plaques typically have a thinner fibrous cap, a larger lipid necrotic core, and exhibit features of vulnerability such as macrophage infiltration, calcified nodules, plaque erosion, cholesterol crystals and microchannels [22]. The rupture of vulnerable plaques and subsequent acute thrombosis are major causes of the acute coronary syndrome and the occurrence of MACE [23, 24]. Research has shown that TCFA are independent predictors of cardiac death, non-culprit lesion-related myocardial infarction (MI), and composite endpoints involving coronary revascularization during follow-up after MI [25]. Further evidence confirms that TCFA serves as the most potent independent predictor of composite endpoints, encompassing cardiac death, target vessel MI, target lesion revascularization, and unstable angina hospitalization in patients with stable angina [26]. TCFA represents the hallmark morphological feature of vulnerable plaques, demonstrating a robust association with MACE [27].
OCT enables the quantitative analysis of fibrous cap thickness and lipid pool curvature, making it the most accurate technique for evaluating TCFA [7, 8]. In this study, OCT revealed that approximately one-third of patients with stable angina exhibited TCFA, suggesting that nearly one-third of stable angina patients are at risk of rapidly progressing to the acute coronary syndrome. The study by Nasu further showed that in untreated patients with stable angina, the incidence of TCFA was as high as 53% [28]. Therefore, timely detection and active treatment of TCFA in stable angina patients to reduce the risk of plaque rupture and acute thrombosis is crucial for preventing MACE and improving clinical outcomes. Notably, more than half of the stable angina patients in this study had received lipid-lowering therapy for over a month, which may explain the relatively low incidence of TCFA.
The analysis further revealed a significantly higher diabetes prevalence among TCFA group patients compared to non-TCFA group patients. Meanwhile, the TCFA group had significantly higher levels of TC, LDL-C, and CRP. This is consistent with previous studies showing that diabetes, LDL-C, and CRP are independent predictors of the presence of TCFA in CHD patients [22, 28, 29, 30]. Blood glucose levels, lipid profiles, and inflammatory status are key factors affecting vulnerable plaques and the formation of TCFA. OCT results showed that coronary atherosclerotic plaques in patients with diabetes or prediabetes were more diffusely distributed and exhibited higher vulnerability [30]. Multivariate analysis revealed that altered glucose metabolism was an independent predictor of TCFA and plaque erosion. Research by Nasu demonstrated that LDL-C, CRP, and the ratio of campesterol to cholesterol were positively correlated with fibrous cap thickness and negatively correlated with the volume of the lipid necrotic core, and all were independent predictors of TCFA [28]. Additionally, Kini also found that lipid-lowering therapy significantly increased fibrous cap thickness and reduced the incidence of TCFA [31]. In this study, the proportion of patients on statin therapy was lower in the TCFA group, although this difference was not statistically significant.
Increasing evidence suggests that sleep is an important factor influencing cardiovascular diseases. Poor sleep quality and insufficient sleep are both associated with an increased incidence of CHD [32]. Less than 5 hours of sleep is closely related to the occurrence of unstable angina pectoris and MI [33]. A meta analysis revealed that compared to 7 hours of sleep per day, each hour of reduced sleep duration was associated with a 6%, 6%, 7%, and 5% increase in all cause mortality, total cardiovascular disease risk, CHD risk, and stroke risk [12]. In addition, an 8-year follow-up study of 9570 patients showed that after adjusting for conventional CHD risk factors and sleep time, individuals with poor sleep quality had a significantly increased relative risk of developing CHD [34]. Yang et al. [35] demonstrated that impaired sleep quality independently predicts complex coronary lesions and elevates the risk of MACE. Nevertheless, the relationship between sleep duration, sleep quality and the vulnerability of atherosclerotic plaques remains unclear.
The results showed that all patients in this study had an average sleep duration of less than 7 hours, and an average PSQI greater than 7, indicating that patients with stable angina generally have poor sleep. Furthermore, the sleep duration in the TCFA group was shorter and the sleep quality was worse. Multivariate logistic regression analysis demonstrated that sleep duration and quality were independent predictors of TCFA. This suggests that patients with severe sleep deprivation and poor sleep quality have more vulnerable plaques. These findings provide theoretical support for the increased incidence of MACE in patients with insufficient sleep and poor sleep quality [15, 33, 36]. Additionally, ROC curve analysis further indicated that sleep duration and quality have predictive value for the presence of TCFA in stable angina patients. Some studies have suggested that sleep quality may exert a more pronounced influence on CHD than sleep duration [37, 38]. The PSQI evaluates sleep quality across seven distinct domains, providing a comprehensive assessment of overall sleep status [39]. However, although PSQI-assessed sleep quality yielded a larger AUC for TCFA prediction compared to sleep duration, no statistically significant difference was observed between the two predictors. This lack of significance may be attributable to the relatively small sample size in the present study.
Further analysis demonstrated that patients with sleep duration
The exact etiology and mechanisms behind the formation of vulnerable plaques remain unclear. Previous studies have shown that chronic inflammation, oxidative stress, endothelial cell damage, dysregulation of glucose and lipid metabolism, and hemodynamic changes are closely associated with the development of vulnerable plaques [22, 29].
Studies have shown that insufficient sleep and poor sleep quality can increase the levels of inflammatory cells and inflammatory factors, and trigger a chronic inflammatory state [43, 44, 45]. These inflammatory responses can activate monocyte-derived macrophages, which secrete matrix metalloproteinases (MMPs), capable of degrading collagen in the fibrous cap, thereby increasing the vulnerability of plaques [46, 47]. The results of this study found that the CRP level in the TCFA group was significantly higher. CRP, as a marker of chronic inflammation, is closely related to the vulnerability of plaques. The study also found that the CRP level in patients with poor sleep quality or insufficient sleep was significantly higher. These findings suggest that inflammatory pathways likely mediate the observed association between poor sleep and enhanced plaque vulnerability.
There are also studies showing that poor sleep can lead to the accumulation of reactive oxygen species and an increase in the levels of oxidative stress [48, 49, 50]. Additionally, short-term sleep restriction is associated with an increase in the level of myeloperoxidase (MPO) [51]. MPO can increase the content of oxidized LDL-C and promote the expression of MMPs, thereby promoting the accumulation of lipid in plaques and increasing the vulnerability of plaques [52, 53]. Therefore, the oxidative stress level may also be one of the potential mechanisms by which insufficient sleep and poor sleep quality increase the vulnerability of plaques, but this needs to be further verified.
Sleep is closely related to various risk factors for cardiovascular diseases. Insufficient sleep, poor sleep quality, and sleep-related diseases increase the risks of hypertension, diabetes, hyperlipidemia, smoking, and mental disorders (such as anxiety and depression) [54, 55, 56, 57, 58]. Studies have shown that most risk factors for cardiovascular diseases are closely related to the vulnerability of plaques, and some are even independent risk factors for vulnerable plaques [59, 60, 61]. This study found that more patients in the TCFA group had abnormal blood sugar and lipid levels. Patients with insufficient sleep had significantly higher levels of LDL. Although patients with insufficient sleep and poor sleep quality had a higher prevalence of hypertension, diabetes, and hyperlipidemia, there was no statistical difference. This discrepancy likely reflects the limited sample size. Therefore, although these risk factors can partially explain the association between insufficient sleep, poor sleep quality, and the vulnerability of plaques, the specific mechanism still needs to be defined.
Several limitations should be acknowledged in this study. First, as a single-center study with a limited sample size, our research may not have adequately controlled for all potential confounding variables. Future multi-center studies with larger cohorts are warranted to validate these findings. Second, this study used a questionnaire to assess sleep status, which is highly subjective and affects the accuracy of the results. Third, the limited sample size of long duration sleepers in our cohort precluded conclusive assessment of its association with plaque vulnerability. Finally, although we demonstrated that insufficient sleep and poor sleep quality could induce the formation of coronary vulnerable plaques, the precise pathophysiological mechanisms underlying these observations require clarification through additional mechanistic studies.
Our study demonstrates that both sleep duration and sleep quality are independently associated with plaque vulnerability in patients with stable angina. Patients with either short sleep duration or poor sleep quality showed significantly higher plaque vulnerability. These sleep parameters exhibit predictive value for assessing plaque vulnerability. These findings provide novel clinical insights regarding the relationship between sleep patterns and MACE.
OCT, optical coherence tomography; TCFA, thin-cap fibroatheroma; MACE, major adverse cardiovascular events; CHD, coronary heart disease; MI, myocardial infarction; CAG, coronary angiography; PSQI, Pittsburgh sleep quality index; TC, total cholesterol; LDL-C, low-density lipoprotein cholesterol; CRP, C-reactive protein; MMPs, matrix metalloproteinases.
The datasets utilized or analyzed during the current study are available from the corresponding author upon reasonable request.
QBS, YG, ZWZ, MWL and CM completed the design of the research and the writing of the manuscript. QG, HSY, TZ, MXL, DHC, ZCS, YSG and ZZZ completed the data collection, data organization, and data analysis. All authors contributed to editorial changes in the manuscript. All authors read and approved the final manuscript. All authors have participated sufficiently in the work and agreed to be accountable for all aspects of the work.
The study was conducted in accordance with the Declaration of Helsinki. The research protocol was approved by the Medical Ethics Committee of Central China Fuwai Hospital of Zhengzhou University (Ethics Approval Number: 2020(29)), and all of the participants provided signed informed consent.
We would like to express our sincerest thanks to all patients who participated in this study.
This research was funded by National Key Research and Development Program of China (grant no. 2022YFC3602400, 2022YFC3602404), National Natural Science Foundation of China (grant no. 82270474) and Henan Cardiovascular Disease Center (Central China Subcenter of National Center for Cardiovascular Diseases) (grant no. 2023-FZX18).
The authors declare no conflict of interest.
References
Publisher’s Note: IMR Press stays neutral with regard to jurisdictional claims in published maps and institutional affiliations.