


1 Department of Cardiology, The Affiliated Hospital of Xuzhou Medical University, 221000 Xuzhou, Jiangsu, China
2 Institute of Cardiovascular Disease Research, Xuzhou Medical University, 221000 Xuzhou, Jiangsu, China
3 Department of Electrocardiography, The Affiliated Tumor Hospital of Nantong University, Nantong Tumor Hospital, 226000 Nantong, Jiangsu, China
†These authors contributed equally.
Abstract
Background: To investigate the correlation between inflammasomes and coronary artery calcification (CAC), and develop and validating a nomogram for predicting the risk of CAC in patients with coronary artery disease (CAD). Methods: A total of 626 patients with CAD at the Affiliated Hospital of Xuzhou Medical University were enrolled in this study. The patients were divided into the calcification group and the non-calcification group based on the assessment of coronary calcification. We constructed a training set and a validation set through random assignment. The least absolute shrinkage and selection operator (LASSO) regression and multivariate analysis were performed to identify independent risk factors of CAC in patients with CAD. Based on these independent predictors, we developed a web-based dynamic nomogram prediction model. The area under the receiver operating characteristic curve (AUC-ROC), calibration curves, and decision curve analysis (DCA) were used to evaluate this nomogram. Results: Age, smoking, diabetes mellitus (DM), hyperlipidemia, the serum level of nucleotide-binding oligomerization domain (NOD)-like receptor protein 1 (NLRP1), alkaline phosphatase (ALP) and triglycerides (TG) were identified as independent risk factors of CAC. The AUC-ROC of the nomogram is 0.881 (95% confidence interval (CI): 0.850–0.912) in the training set and 0.825 (95% CI: 0.760–0.876) in the validation set, implying high discriminative ability. Satisfactory performance of this model was confirmed using calibration curves and DCA. Conclusions: The serum NLRP1 level is an independent predictor of CAC. We established a web-based dynamic nomogram, providing a more accurate estimation and comprehensive perspective for predicting the risk of CAC in patients with CAD.
Keywords
- coronary artery calcification
- coronary artery disease
- NLRP1
- prediction model
- nomogram
Coronary artery disease (CAD) is a cardiovascular disease (CVD), manifested by stable angina, unstable angina, myocardial infarction, or sudden cardiac death, and is one of the primary causes of death worldwide [1]. Despite advances in diagnostic and treatment technologies in recent years, the prevalence of CAD continues to increase annually, and represents a serious threat to public health [2]. Vascular calcification, especially coronary artery calcification (CAC), is prevalent, harmful, and progresses rapidly in patients with CAD. Previous studies have shown that the presence of CAC increases the risk of coronary heart disease events by threefold [3]. Pathological studies have demonstrated a strong correlation in the initiation and progression between CAC and CAD [4]. CAC is often located in areas of atherosclerotic lesions [5]. The severity of CAC and the degree of coronary stenosis directly impact the management and treatment of CAD. In addition, it is difficult to perform treatments to eradicate CAC. Thus, early anticipation of the high risk of CAC and timely intervention are pivotal for the treatment and prognosis of patients with CAD.
The conventional risk factors, such as race, advanced age, male gender, smoking, diabetes mellitus (DM), hypertension, hyperlipidemia, and chronic kidney disease (CKD), associated with the presence and development of CAC have been widely recognized in the general population [3, 6, 7, 8]. In previous views, the formation of CAC was believed to be caused by the ectopic deposition of calcium salts in the walls of coronary vessels, which was considered as a passive and degenerative pathological phenomenon. However, recent studies support a concept that CAC is an active and regulated process in atherosclerosis progression, reflecting a broader systemic inflammatory response [5, 6]. A study demonstrated that as atherosclerosis progresses, inflammation aids in the initiation and progression of calcification as macrophages secrete inflammatory cytokines and promote osteogenic differentiation of vascular cells [9]. Inflammasomes derived from macrophages, can be activated by various cardiovascular risk factors and drive downstream signaling events. Studies have shown that the inflammasomes nucleotide-binding oligomerization domain (NOD)-like receptor protein 1 (NLRP1) and NLRP3 are closely associated with CVD [10, 11]. Therefore, the inflammasomes NLRP1 and NLRP3 may be able to potentially detect high-risk populations and improving the ability to predict the occurrence of CAC.
The aim of this study was to determine whether the inflammasomes NLRP1 and NLRP3 could serve as a “risk integrator” for CAC, adding predictive information beyond conventional cardiovascular risk factors. Since there is a paucity of research in this area, we conducted a clinical data analysis to assess the relationship between NLRP1, NLRP3 and CAC. We developed a simple and cost-effective nomogram-illustrated model aiming to predict the occurrence of CAC in patients with CAD and to improve therapeutic decisions leading to the primary prevention of CAC.
The study cohort comprised 744 patients with suspected CAD who underwent coronary angiography (CAG) in the Cardiology Department of Xuzhou Medical University Affiliated Hospital from January 2021 to March 2023. The research was approved by the Ethics Committee of the Affiliated Hospital of Xuzhou Medical University (No: XYFYLW2017-002), and all participants provided written informed consent.
The criteria for inclusion were: patients with myocardial ischemic symptoms,
clinically suspected diagnosis of CAD, agreement to undergo CAG. Based on the
results of CAG, CAD was diagnosed as coronary stenosis (
 Fig. 1.
Flow chart of the inclusion and exclusion process of all patients enrolled in this study. Abbreviation: CAD, coronary artery disease; LASSO, least absolute shrinkage and selection operator.
Patient clinical data were collected by reviewing electronic medical records, including demographic data (age, gender, body mass index (BMI)), past medical history (hypertension, DM, hyperlipidemia), laboratory indicators (white blood cell (WBC), neutrophil (NE), lymphocyte (LY), platelet (PLT), high-sensitivity C-reactive protein (hsCRP), aspartate aminotransferase (AST), alanine transaminase (ALT), alkaline phosphatase (ALP)) and medications (statin, Ezetimibe, aspirin, clopidogrel angiotensin-converting enzyme inhibitor (ACEI), oral hypoglycemic drugs, insulin). All biochemical tests were completed 24 hours after admission.
The serum levels of NLRP1 and NLRP3 were detected with ELISA kits purchased from CUSABIO BIOTECH Co., Ltd (Wuhan, Hubei, China). All blood samples were collected and tested within 24 hours after admission.
The presence of CAC was assessed during CAG procedures by accredited interventional cardiologists. Since the accuracy of CAG to identify CAC is suboptimal, the majority of individuals also underwent intravascular ultrasound (IVUS) during the procedure to identify CAC [6].
We used SPSS (version 22.0, IBM Corp., Armonk, NY, USA) and R software (version
3.6.4, R Foundation for Statistical Computing, Vienna, Austria) for statistical
analysis. Categorical variables were expressed as counts and percentages (%) and
compared using the
Among the total of 626 patients included in this study, 338 had coronary calcification. The differences in characteristics between the non-calcification group and the calcification group are shown in Table 1. Compared with the non-calcification group, patients in the calcification group tended to be older, obese, smokers and were more likely to suffer from hypertension, DM, and hyperlipidemia. The calcification group also had higher NLRP1, hsCRP, ALP, fasting blood glucose (FBG), triglyceride (TG), small dense LDL-cholesterol (sdLDL), N-terminal-pro brain natriuretic peptide (NT-proBNP), glycated hemoglobin A (HbA1c) and lower ALT, apolipoprotein A (APOA1), and eGFR levels. Ticagrelor and beta-blockers were used more frequently in the calcification group.
| Variables | Non-calcification group | Calcification group | p-Value | |
| (n = 288) | (n = 338) | |||
| Age | 54.60 |
69.81 |
||
| Gender (n, %) | 0.074 | |||
| Male 1 | 173 (60.1%) | 179 (53.0%) | ||
| Female 2 | 115 (39.9%) | 159 (47.0%) | ||
| BMI, kg/m |
25.71 (23.33, 28.03) | 24.97 (22.60, 27.13) | 0.007 | |
| Smoking (n, %) | 0.027 | |||
| No | 208 (72.2%) | 216 (63.9%) | ||
| Yes | 80 (27.8%) | 122 (36.1%) | ||
| Drinking (n, %) | 0.115 | |||
| No | 202 (70.1%) | 256 (75.7%) | ||
| Yes | 86 (29.9%) | 82 (24.3%) | ||
| Past medical history (n, %) | ||||
| Hypertension | 142 (49.3%) | 200 (59.2%) | 0.013 | |
| DM | 72 (25%) | 137 (40.5%) | ||
| Hyperlipidemia | 80 (27.8%) | 126 (37.3%) | 0.012 | |
| Hematological indicators | ||||
| NLRP1, pg/mL | 42.61 (25.57, 61.54) | 55.86 (32.35, 74.67) | ||
| NLRP3, pg/mL | 42.31 (20.20, 71.99) | 41.78 (19.59, 70.82) | 0.993 | |
| WBC, 10 |
5.90 (4.90, 7.10) | 5.70 (4.80, 7.20) | 0.898 | |
| NE, 10 |
3.51 (2.78, 4.53) | 3.52 (2.80, 4.46) | 0.960 | |
| LY, 10 |
1.70 (1.30, 2.10) | 1.60 (1.30, 2.00) | 0.158 | |
| PLT, 10 |
212.00 (184.50, 251.75) | 212.00 (169.00, 244.00) | 0.117 | |
| hsCRP, mg/L | 1.60 (0.80, 2.70) | 1.65 (0.50, 6.50) | 0.038 | |
| AST, U/L | 18.00 (16.00, 24.75) | 18.00 (15.00, 24.00) | 0.549 | |
| ALT, U/L | 18.00 (13.00, 28.75) | 16.00 (11.00, 25.00) | 0.005 | |
| ALP, U/L | 68.00 (58.00, 85.00) | 77.00 (63.00, 99.25) | ||
| Urea, mmol/L | 5.16 (4.25, 6.12) | 5.10 (4.28, 6.34) | 0.393 | |
| Scr, umo/L | 62.00 (53.00, 70.00) | 62.00 (54.00, 74.00) | 0.144 | |
| UA, umo/L | 301.00 (255.25, 368.00) | 299.00 (239.00, 365.25) | 0.403 | |
| eGFR, mL/min | 107.82 (95.91, 119.18) | 102.61 (88.16, 116.13) | ||
| FBG, mmol/L | 5.61 (5.15, 6.40) | 5.80 (5.25, 7.41) | 0.003 | |
| TC, mmol/L | 4.11 (3.24, 5.11) | 4.09 (3.48, 4.90) | 0.794 | |
| TG, mmol/L | 1.47 (1.02, 2.04) | 1.68 (1.34, 2.22) | ||
| LDL-C, mmol/L | 2.51 (1.84, 3.08) | 2.62 (1.75, 3.29) | 0.553 | |
| HDL-C, mmol/L | 1.10 (0.94, 1.28) | 1.06 (0.92, 1.24) | 0.146 | |
| APOA1, g/L | 1.28 (1.11, 1.52) | 1.21 (1.07, 1.44) | 0.017 | |
| APOB, g/L | 0.87 (0.77, 1.04) | 0.93 (0.76, 1.11) | 0.309 | |
| Lp (a), mg/L | 216.00 (150.25, 339.50) | 259.50 (163.75, 358.75) | 0.267 | |
| sdLDL, mmol/L | 0.59 (0.43, 0.90) | 0.71 (0.48, 1.01) | 0.005 | |
| NT-proBNP, pg/mL | 121.41 (99.00, 284.51) | 192.61 (99.00, 725.03) | ||
| HbA1c, % | 5.90 (5.60, 6.68) | 6.10 (5.70, 6.73) | 0.003 | |
| LVEF, % | 60.00 (55.61, 62.99) | 59.48 (56.24, 63.09) | 0.510 | |
| Inotropic drugs (n, %) | ||||
| Statin | 266 (92.4%) | 312 (92.3%) | 0.980 | |
| Ezetimibe | 51 (17.7%) | 62 (18.3%) | 0.837 | |
| Apolizumab | 41 (14.2%) | 51 (15.1%) | 0.764 | |
| Aspirin | 279 (96.9%) | 328 (97.0%) | 0.904 | |
| Clopidogrel | 86 (29.9%) | 113 (33.4%) | 0.339 | |
| Ticagrelor | 157 (54.5%) | 217 (64.2%) | 0.014 | |
| ACEI/ARB | 81 (28.1%) | 107 (31.7%) | 0.337 | |
| ARNI | 53 (18.4%) | 66 (19.5%) | 0.721 | |
| Beta-blockers | 157 (54.5%) | 217 (64.2%) | 0.014 | |
| CCB | 51 (17.7%) | 60 (17.8%) | 0.989 | |
| Oral hypoglycemic drugs | 85 (29.5%) | 108 (32.0%) | 0.510 | |
| Insulin | 17 (5.9%) | 21 (6.2%) | 0.871 | |
Abbreviations: BMI, body mass index; DM, diabetes mellitus; NLRP1, nucleotide-binding oligomerization domain like receptor protein 1; NLRP3, nucleotide-binding oligomerization domain like receptor protein 3; WBC, white blood cell; NE, neutrophil; LY, lymphocyte; PLT, platelet; hsCRP, high-sensitivity C-reactive protein; AST, aspartate aminotransferase; ALT, alanine transaminase; ALP, alkaline phosphatase; Scr, serum creatinine; UA, uric acid; eGFR, estimated glomerular filtration rate; FBG, fast blood glucose; TC, total cholesterol; TG, triglyceride; LDL-C, low-density lipoprotein cholesterol; HDL-C, high-density lipoprotein cholesterol; APOA1, apolipoprotein A; APOB, apolipoprotein B; Lp (a), lipoprotein (a); sdLDL, small dense low density lipoprotein; NT-proBNP, N-terminal-pro brain natriuretic peptide; HbA1c, glycated hemoglobin A; LVEF, left ventricular ejection fraction; ACEI, angiotensin-converting enzyme inhibitor; ARB, angiotensin receptor blockers; ARNI, angiotensin receptor neprilysin inhibitor; CCB, calcium channel blocker; n, the number of patients per group.
As shown in Fig. 2, by selecting the optimal lambda value, the LASSO regression assisted us in determining 7 candidate variables from an initial set of 46. After adding the variables into the multivariate logistic analysis, the results indicated that age, BMI, smoking, DM, hyperlipidemia, NLRP1 and ALP were independent risk factors for CAC in patients with CAD (Table 2).
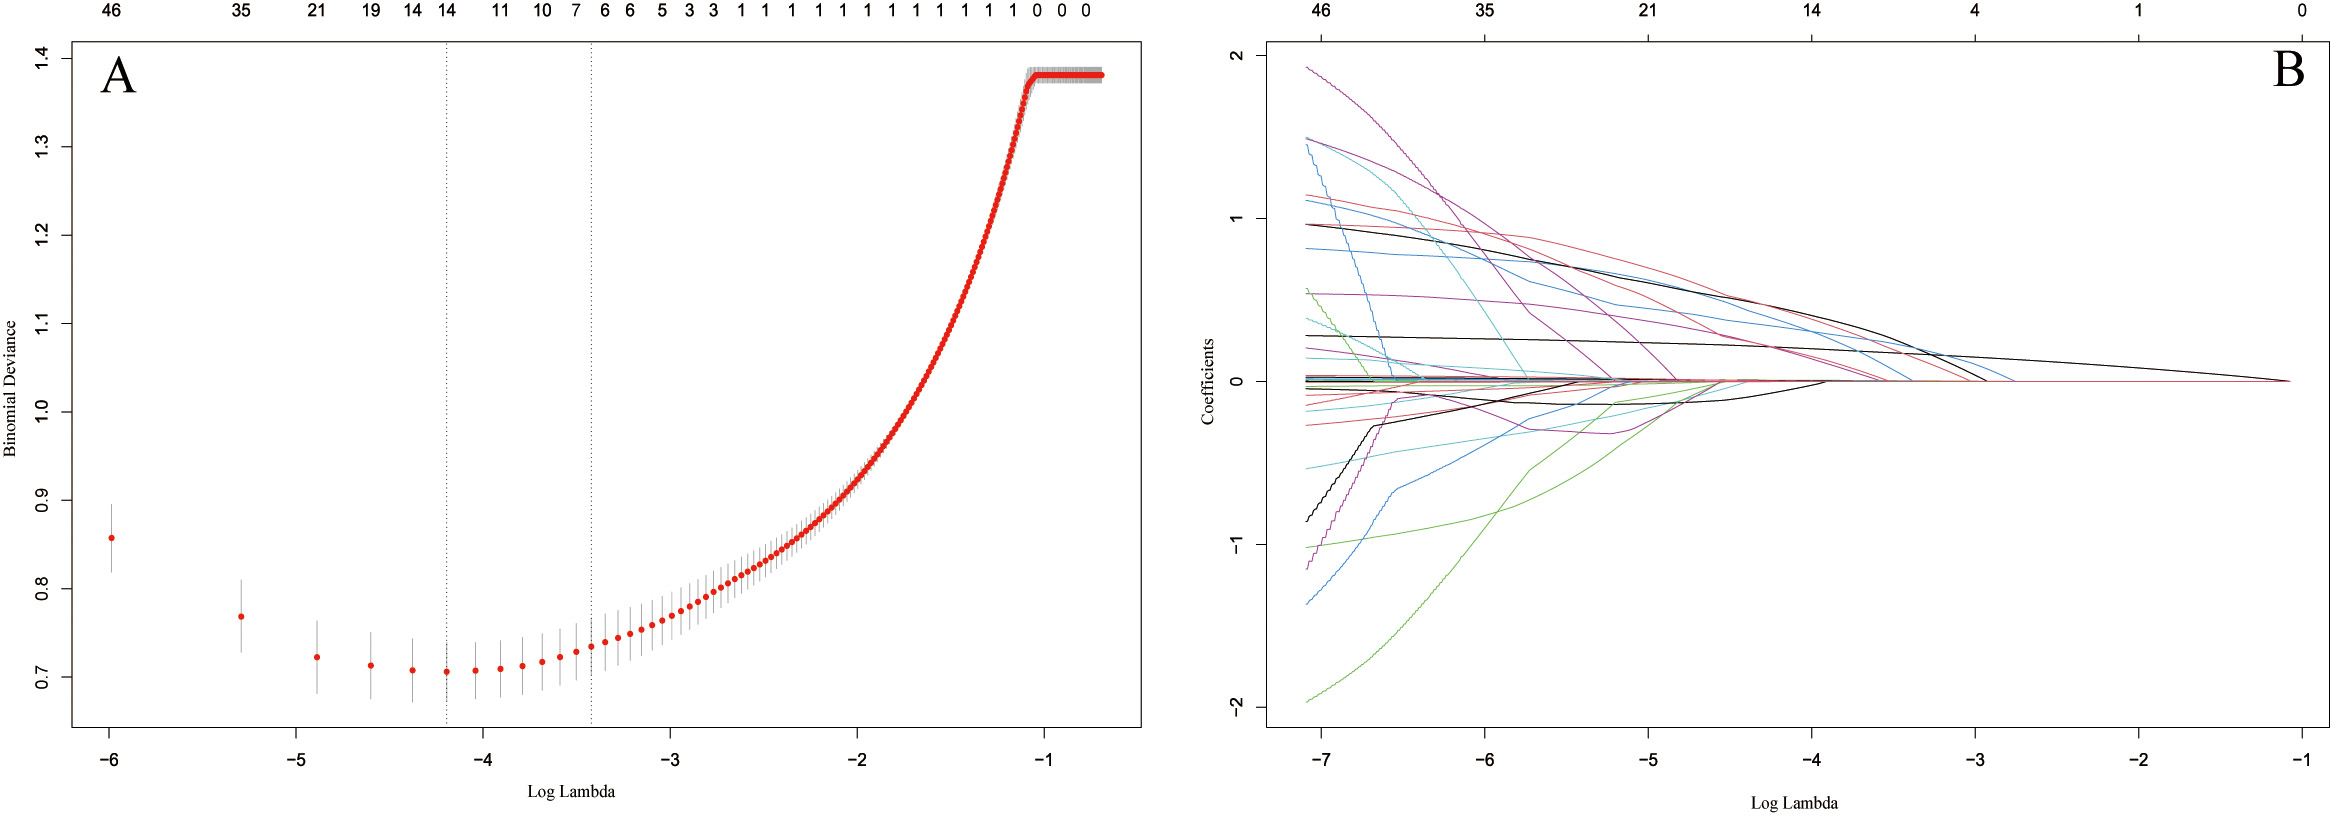 Fig. 2.
Identification of the predictors by LASSO regression. (A) The
cross-validation plot. 7 variables were identified by selecting optimal value
(
| Variables | s |
Wald |
OR (95% CI) | p-Value | ||
| Age | 0.267 | 0.026 | 102.097 | 1.307 (1.241, 1.376) | ||
| Smoking | 0.905 | 0.349 | 6.716 | 2.471 (1.247, 4.898) | 0.01 | |
| Past medical history | ||||||
| Diabetes | 0.84 | 0.332 | 6.413 | 2.172 (1.062, 4.442) | 0.011 | |
| Hyperlipidemia | 0.775 | 0.365 | 4.51 | 2.172 (1.062, 4.442) | 0.034 | |
| Hematological indicators | ||||||
| NLRP1 | 0.013 | 0.004 | 9.173 | 1.013 (1.005, 1.022) | 0.002 | |
| ALP | 0.013 | 0.006 | 3.883 | 1.013 (1.000, 1.026) | 0.049 | |
| TG | 0.507 | 0.178 | 8.08 | 1.661 (1.171, 2.356) | 0.004 | |
Abbreviations: NLRP1, nucleotide-binding oligomerization domain like receptor protein 1; ALP, alkaline phosphatase; TG, triglyceride; CAC, coronary artery calcification.
We divided the patients into a training cohort and a validation cohort in the ratio of 7:3 at random, to avoid overfitting of the model during analysis. Except for gender and total cholesterol (TC), no difference was found between the training set and the validation set, indicating comparability and rationality of division of our dataset (Table 3).
| Variables | Training set (n = 436) | Validation set (n = 190) | p-Value | |
| Age | 63.26 |
61.78 |
0.140 | |
| Gender (n, %) | 0.038 | |||
| Male 1 | 257 (58.9%) | 95 (50.0%) | ||
| Female 2 | 179 (41.1%) | 95 (50.0%) | ||
| BMI, kg/m |
0.563 | |||
| Smoking (n, %) | 0.122 | |||
| No | 287 (65.8%) | 137 (72.1%) | ||
| Yes | 149 (34.2%) | 53 (27.9%) | ||
| Drinking (n, %) | 0.998 | |||
| No | 319 (73.2%) | 139 (73.2%) | ||
| Yes | 117 (26.8%) | 51 (26.8%) | ||
| Past medical history (n, %) | ||||
| Hypertension | 243 (55.7%) | 99 (52.1%) | 0.402 | |
| Diabetes mellitus | 151 (34.6%) | 58 (30.5%) | 0.316 | |
| Hyperlipidemia | 135 (31.0%) | 71 (37.4%) | 0.117 | |
| Hematological indicators | ||||
| NLRP1, pg/mL | 48.09 (30.04, 68.34) | 44.70 (28.03, 66.51) | 0.295 | |
| NLRP3, pg/mL | 41.66 (19.50, 72.10) | 44.04 (20.64, 68.76) | 0.997 | |
| WBC, 10 |
5.90 (4.90, 7.20) | 5.60 (4.80, 7.10) | 0.282 | |
| NE, 10 |
3.55 (2.79, 4.55) | 3.40 (2.79, 4.36) | 0.408 | |
| LY, 10 |
1.60 (1.30, 2.00) | 1.60 (1.20, 2.00) | 0.112 | |
| PLT, 10 |
212.00 (179.00, 252.00) | 207.50 (171.75, 237.25) | 0.058 | |
| hsCRP, mg/L | 1.60 (0.50, 4.00) | 1.70 (0.68, 5.40) | 0.239 | |
| AST, U/L | 18.50 (15.00, 24.00) | 18.00 (15.00, 24.25) | 0.740 | |
| ALT, U/L | 17.00 (12.00, 27.00) | 16.00 (12.00, 26.00) | 0.443 | |
| ALP, U/L | 73.00 (60.00, 92.00) | 70.00 (60.00, 89.00) | 0.390 | |
| Urea, mmol/L | 5.18 (4.29, 6.38) | 5.01 (4.17, 6.06) | 0.182 | |
| Scr, umo/L | 62.00 (54.00, 72.00) | 61.50 (53.00, 71.00) | 0.434 | |
| UA, umo/L | 303.82 (247.05, 375.00) | 289.00 (241.75, 352.25) | 0.096 | |
| eGFR, mL/min | 105.12 (93.56, 117.76) | 104.74 (89.25, 115.65) | 0.264 | |
| FBG, mmol/L | 5.69 (5.21, 6.92) | 5.68 (5.14, 6.77) | 0.389 | |
| TC, mmol/L | 4.14 (3.52, 5.08) | 3.93 (3.04, 5.00) | 0.025 | |
| TG, mmol/L | 1.62 (1.17, 2.19) | 1.55 (1.19, 2.10) | 0.478 | |
| LDL-C, mmol/L | 2.59 (1.82, 3.30) | 2.36 (1.83, 3.05) | 0.063 | |
| HDL-C, mmol/L | 1.09 (0.93, 1.27) | 1.05 (0.93, 1.27) | 0.692 | |
| APOA1, g/L | 1.23 (1.09, 1.50) | 1.24 (1.07, 1.44) | 0.317 | |
| APOB, g/L | 0.89 (0.76, 1.08) | 0.93 (0.80, 1.09) | 0.204 | |
| Lp (a), mg/L | 232.00 (163.25, 339.75) | 248.00 (148.75, 372.00) | 0.871 | |
| sdLDL, mmol/L | 0.63 (0.45, 0.95) | 0.70 (0.47, 0.98) | 0.288 | |
| NT-proBNP, pg/mL | 160.39 (99.00, 440.43) | 137.76 (99.00, 458.86) | 0.457 | |
| HbA1c, % | 6.00 (5.60, 6.80) | 5.90 (5.60, 6.50) | 0.166 | |
| LVEF, % | 59.90 (56.00, 63.00) | 59.44 (56.11, 63.23) | 0.974 | |
| Inotropic drugs (n, %) | ||||
| Statin | 405 (92.9%) | 173 (91.1%) | 0.427 | |
| Ezetimibe | 78 (17.9%) | 35 (18.4%) | 0.874 | |
| Apolizumab | 62 (14.2%) | 30 (15.8%) | 0.610 | |
| Aspirin | 424 (97.2%) | 183 (96.3%) | 0.532 | |
| Clopidogrel | 142 (32.6%) | 57 (30.0%) | 0.526 | |
| Ticagrelor | 263 (60.3%) | 111 (58.4%) | 0.656 | |
| ACEI/ARB | 133 (30.5%) | 55 (28.9%) | 0.696 | |
| ARNI | 82 (18.8%) | 37 (19.5%) | 0.845 | |
| Beta-blockers | 263 (60.3%) | 111 (58.4%) | 0.656 | |
| Calcium channel blockers | 76 (17.4%) | 35 (18.4%) | 0.766 | |
| Oral hypoglycemic drugs | 138 (31.7%) | 55 (28.9%) | 0.501 | |
| Insulin | 25 (5.7%) | 13 (6.8%) | 0.593 | |
Abbreviations: BMI, body mass index; NLRP1, nucleotide-binding oligomerization domain like receptor protein 1; NLRP3, nucleotide-binding oligomerization domain like receptor protein 3; WBC, white blood cell; NE, neutrophil; LY, lymphocyte; PLT, platelet; hs-CRP, high-sensitivity C-reactive protein; AST, aspartate aminotransferase; ALT, alanine transaminase; ALP, alkaline phosphatase; Scr, serum creatinine; UA, uric acid; eGFR, estimated glomerular filtration rate; FBG, fast blood glucose; TC, total cholesterol; TG, triglyceride; LDL-C, low-density lipoprotein cholesterol; HDL-C, high-density lipoprotein cholesterol; APOA1, apolipoprotein A; APOB, apolipoprotein B; Lp (a), lipoprotein (a); sdLDL, small dense low density lipoprotein; NT-proBNP, N-terminal-pro brain natriuretic peptide; HbA1c, glycated hemoglobin A; LVEF, left ventricular ejection fraction; ACEI, angiotensin-converting enzyme inhibitor; ARB, angiotensin receptor blockers; ARNI, angiotensin receptor neprilysin inhibitor; n, the number of patients per group.
A web-based dynamic nomogram (https://jingfengpeng.shinyapps.io/DynNomapp/) for predicting CAC occurrence was constructed by stepwise selection using the LASSO regression and multivariate logistic analysis (Fig. 3). We then applied the ROC curve to validate the model’s discriminative ability (Fig. 4). The AUC in both datasets were 0.881 (95% CI: 0.850–0.912) and 0.825 (95% CI: 0.760–0.876), respectively. This suggested that this nomogram had a favorable discriminative performance. In addition, we conducted the internal verification of the model using the Bootstrap method. The calibration curves indicated a favorable agreement between the predicted probability of this model and the actual probability, demonstrating a suitable calibration of the model (Fig. 5). As shown in Fig. 6, the DCA curves showed that the nomogram could achieve greater net benefit in both datasets than the two extreme cases, indicating the model has good clinical utility.
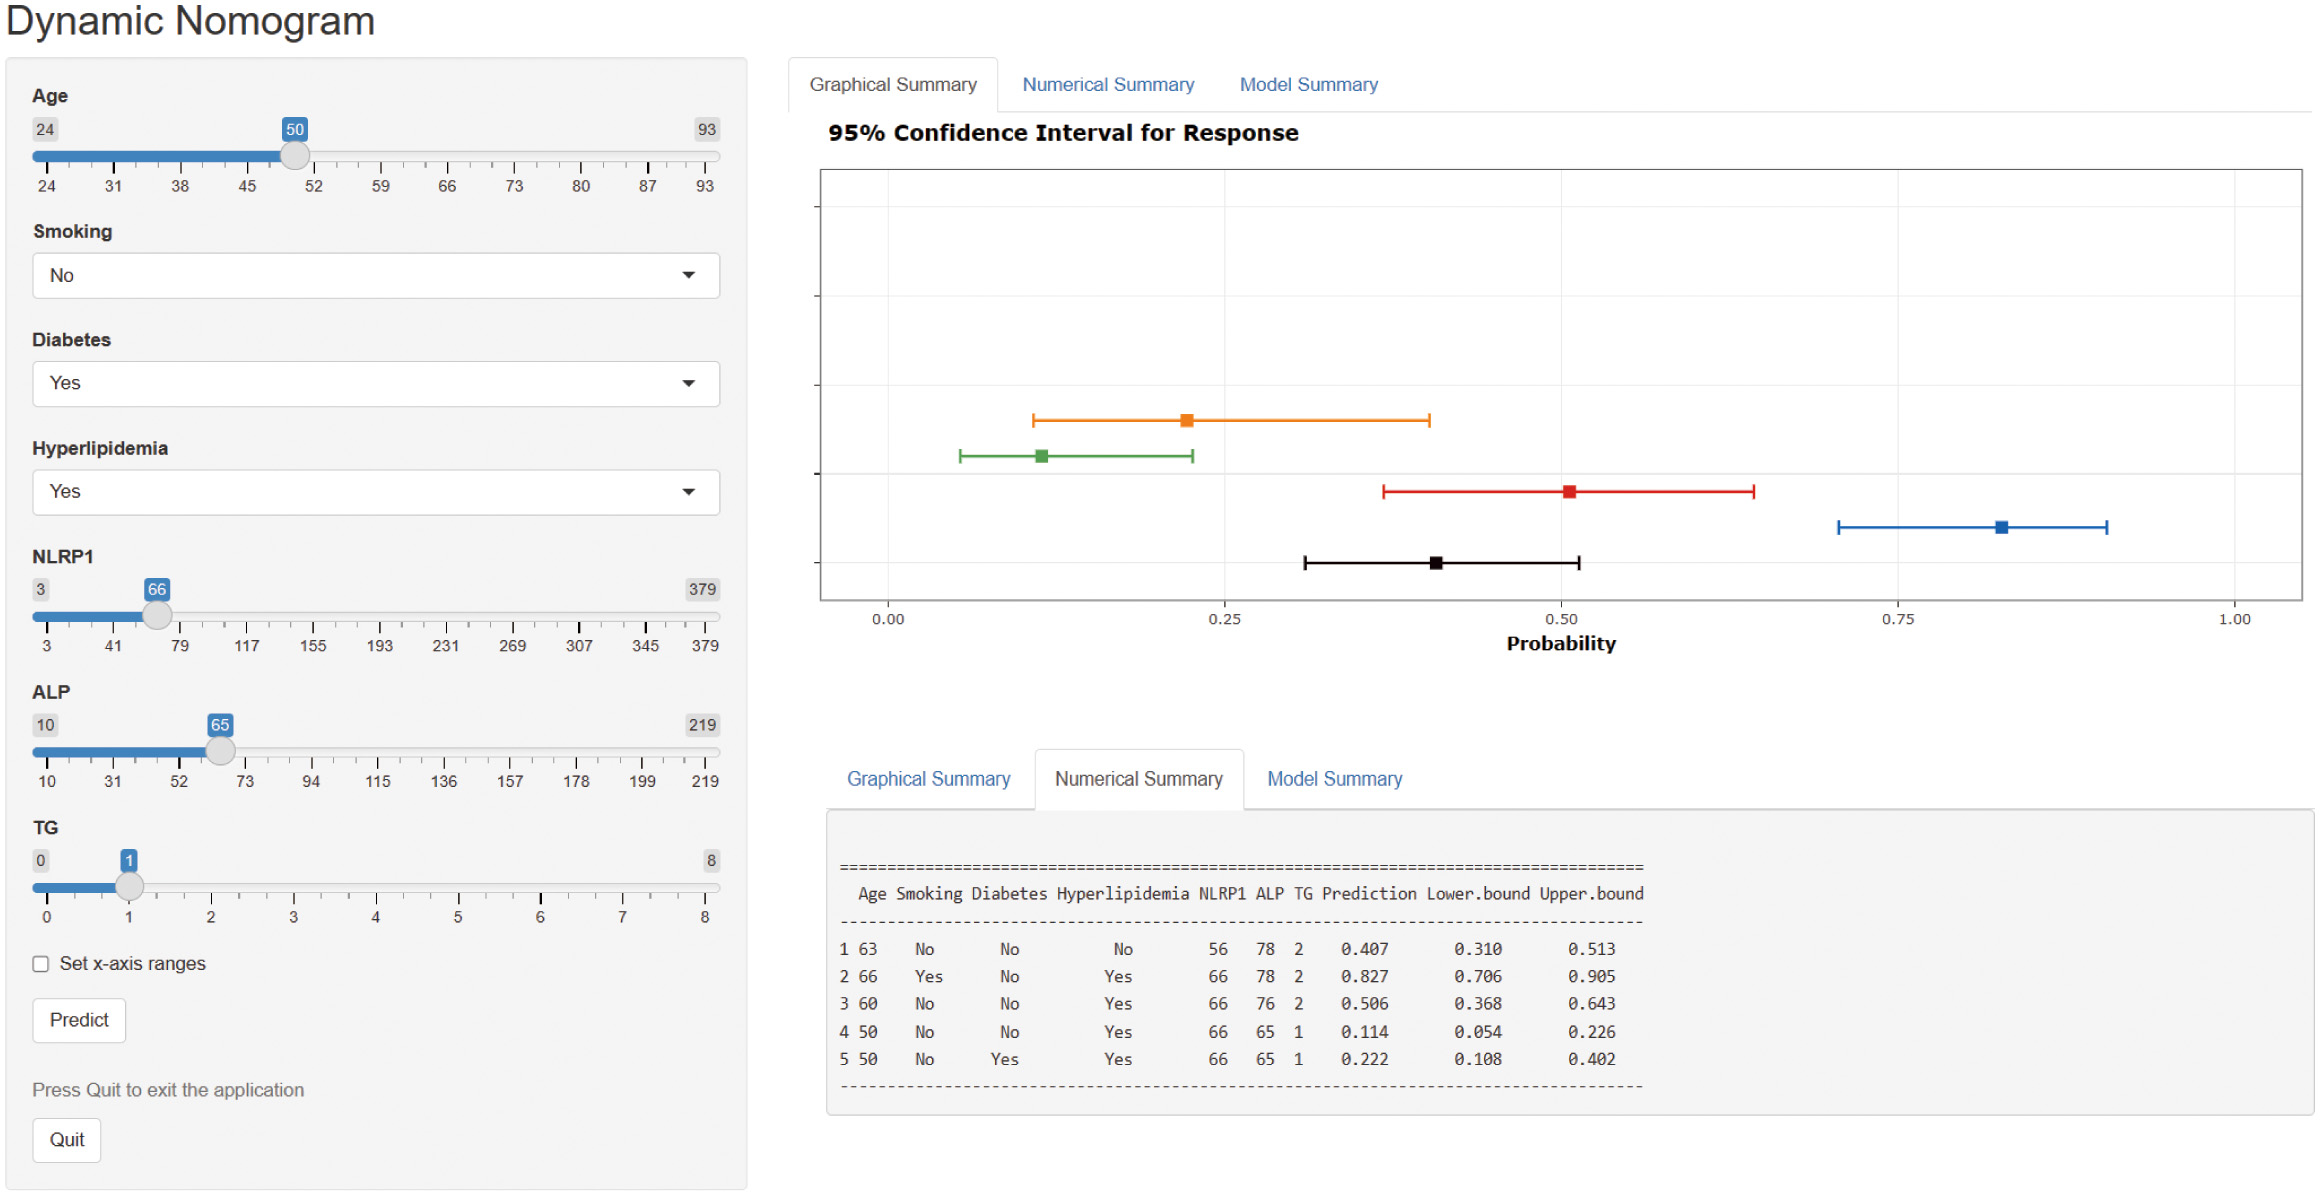 Fig. 3.
Dynamic nomogram to predict the risk of CAC occurrence in patients with CAD. Click on this link (https://jingfengpeng.shinyapps.io/DynNomapp/) to access the prediction model. Abbreviations: NLRP1, nucleotide-binding oligomerization domain (NOD)-like receptor protein 1; ALP, alkaline phosphatase; TG, triglyceride; CAC, coronary artery calcification; CAD, coronary artery disease.
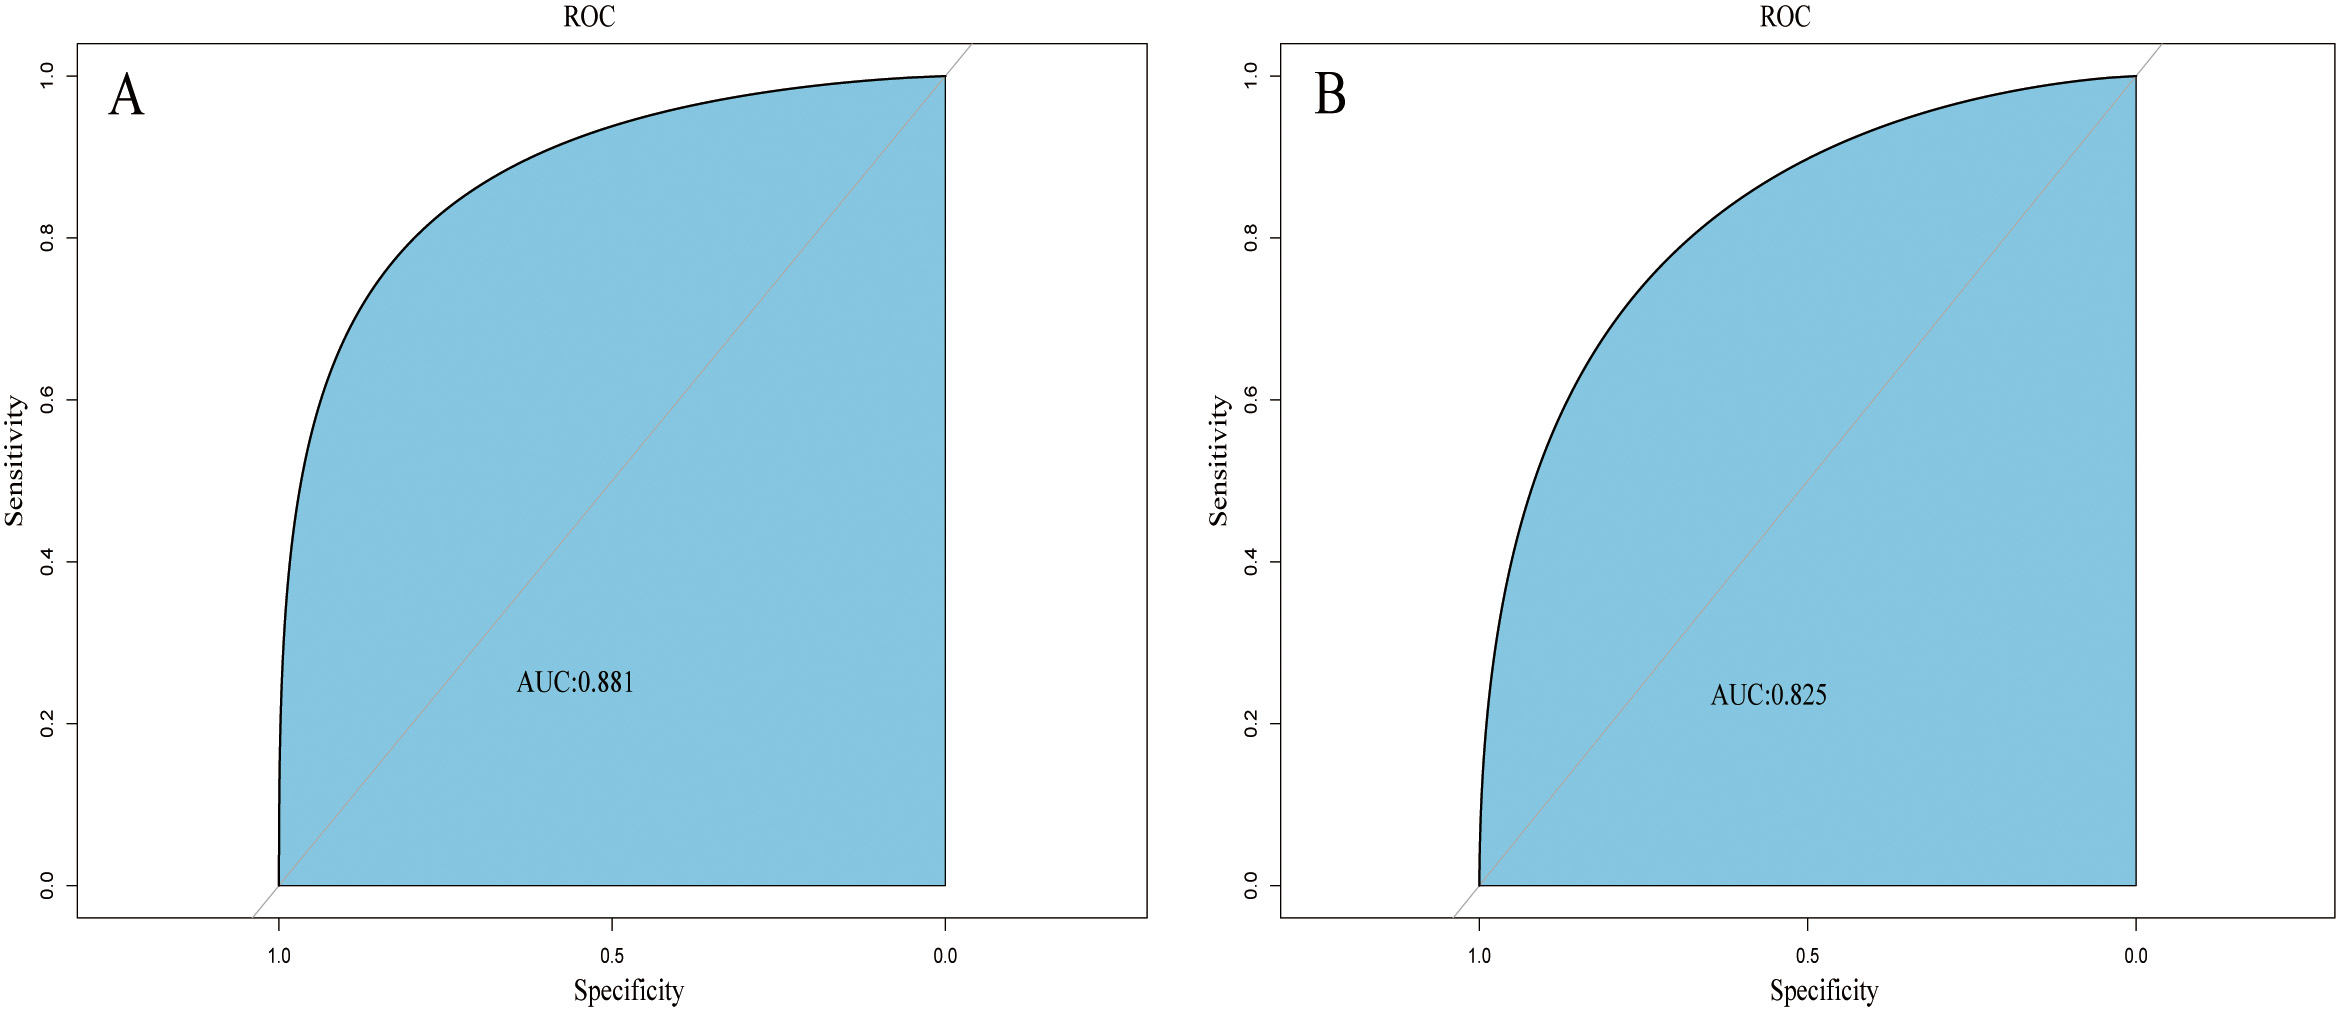 Fig. 4.
ROC curves of the nomogram based on the training set (A) and validation set (B). The AUC was utilized to judge the discriminative ability of model. Abbreviation: AUC, area under the ROC; ROC, receiver operating characteristic.
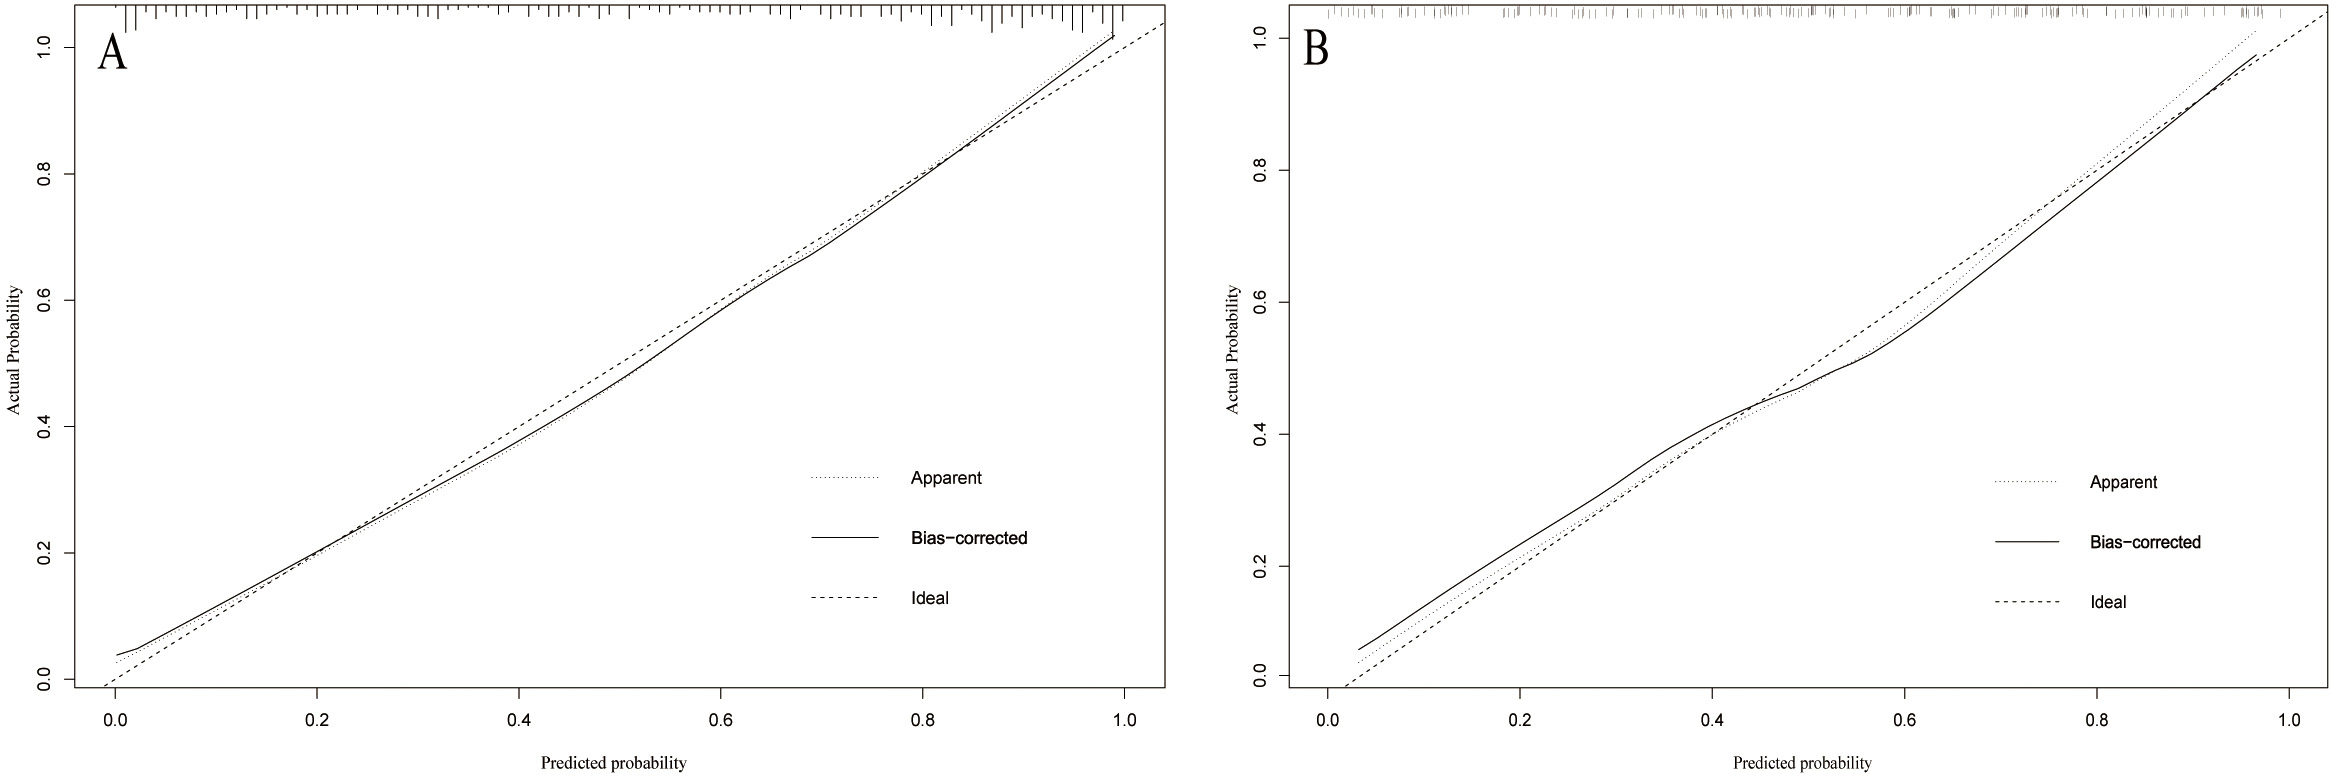 Fig. 5.
Calibration curve of the model on the data of the training set (A) and validation set (B). The diagonal 45-degree line indicates perfect prediction. Model calibration is represented by the degree of fitting of the curve and the diagonal line.
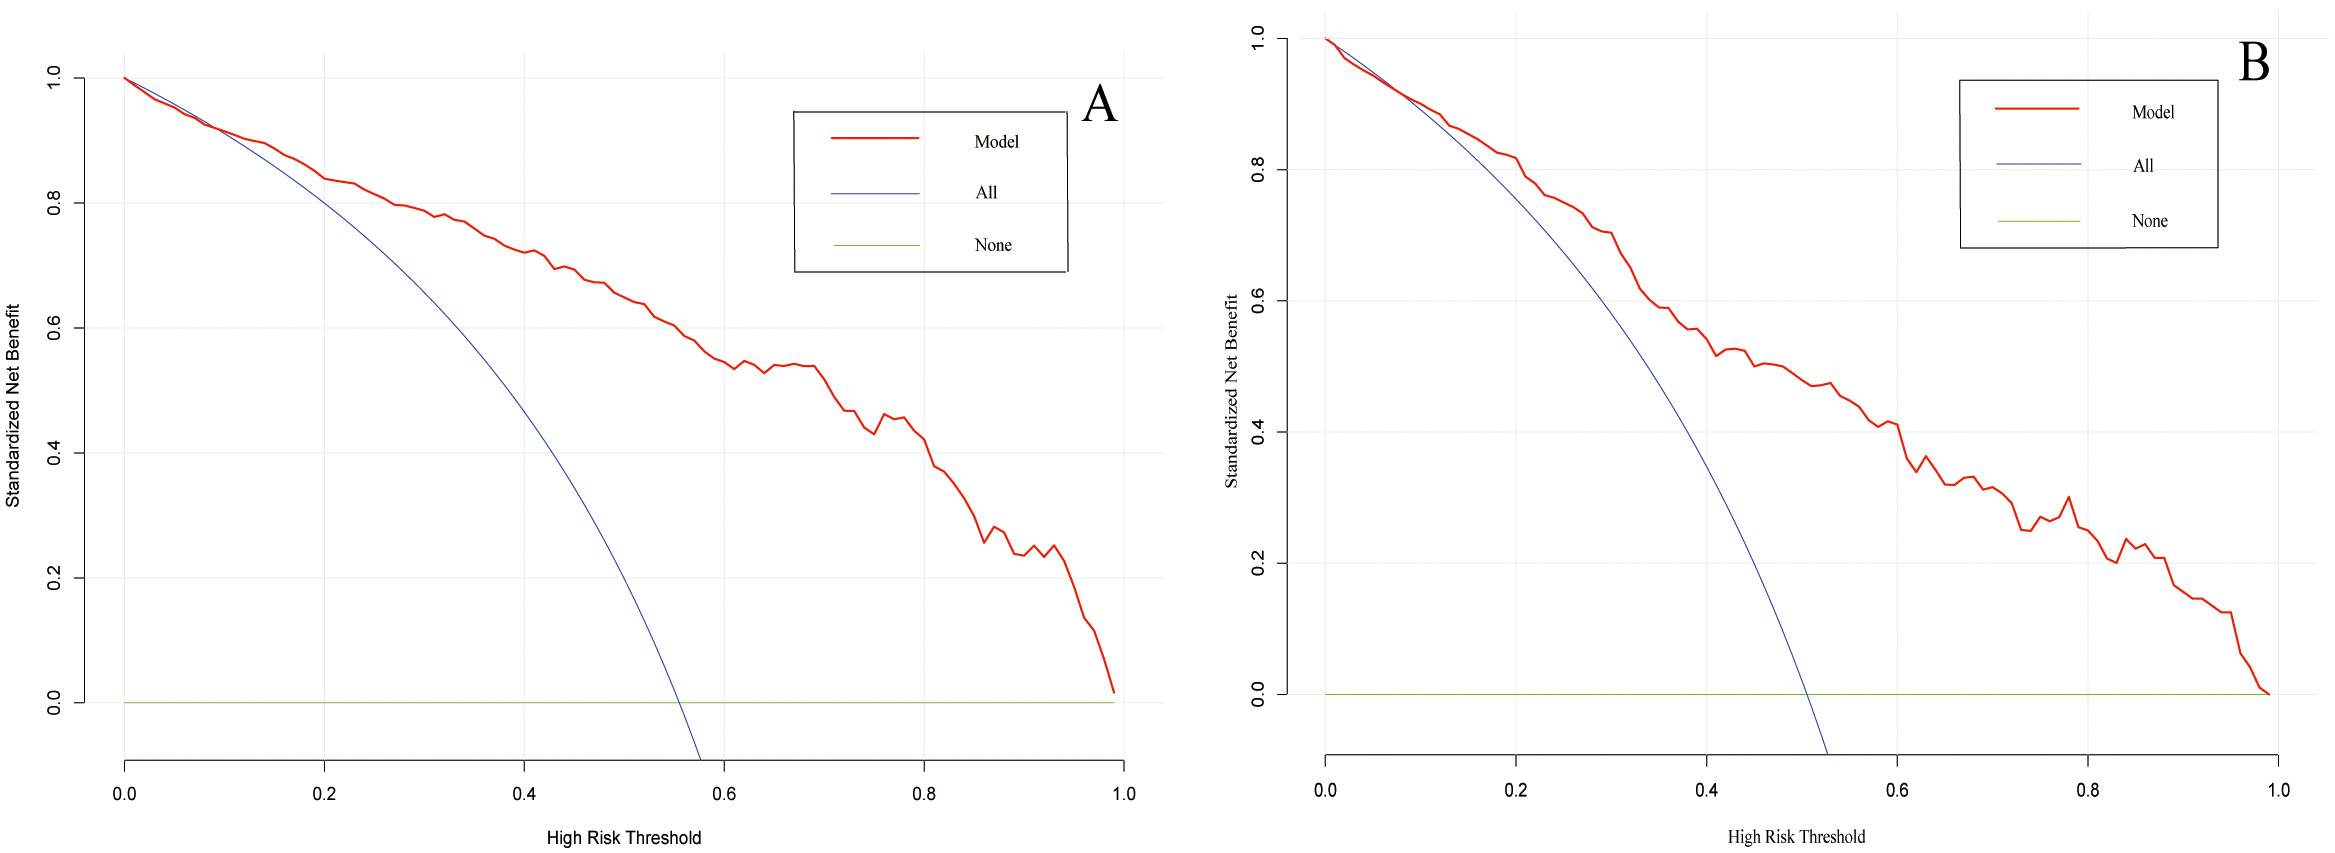 Fig. 6.
Decision curve analysis of the prediction model on the data of the training set (A) and validation set (B). The horizontal line and the oblique line respectively represent two extreme situations where all samples are negative, treated none and all samples are positive, treated all. The red curve represents the net benefit at each risk threshold.
Two key findings were identified in this study. First, the NLRP1 inflammasome was found to be an independent predictor of CAC. Second, we proposed and validated a valuable prediction model, embracing an extensive set of clinical risk factors that are easily accessible, such as age, smoking, DM, hyperlipidemia, ALP and TG, and incorporating the serum NLRP1 level. This web-based dynamic nomogram model (https://jingfengpeng.shinyapps.io/DynNomapp/) can soon be obtained for free online. The results generated from this model could serve as a guide for preventing or even slowing down the progression of CAC.
CAC plays an important role in CAD. The majority of mortality and major adverse events in cardiovascular disease are related to CAD, in which CAC plays a significant role. A significant correlation was found between the presence and extent of CAC and the overall magnitude of coronary atherosclerotic plaque burden, as well as the development of subsequent coronary events [3, 9]. Coronary calcification may deteriorate vascular compliance. Calcified plaques demonstrating a spotty pattern in coronary arteries are considered to increase the risk of plaque rupture [12, 13]. The progression of CAC, not only contributes to the risk of cardiovascular mortality, but also increases the difficulty for intervention therapy. CAC has always been a significant challenge for interventional cardiologists. Efforts to control CAC with medical therapy have not been successful. While advances in percutaneous techniques have modestly improved the outcomes of percutaneous coronary intervention (PCI), the risks and adverse events associated with the treatment of recalcitrant calcified lesions remains high. In addition, the treatment of CAC increases medical costs [6]. Therefore, it is necessary to expand therapies beyond mechanical revascularization to encompass predictive diagnosis and preventive interventions to treat CAC.
In patents with CAC, inflammation has been underestimated in previous prediction
models. In recent years, emerging research suggest that the initiation and
progression of CAC are collaboratively driven by long-term dyslipidemia and
vascular inflammation, which are the basis of atherosclerosis [5, 9]. A study
found that the greater extent of CAC among patients with severe rheumatoid
arthritis was due to the effect of inflammatory mediators, which confirmed the
strong impact of inflammation in the pathogenesis of CAC [14]. A major
participant in the inflammatory response of CAC are macrophages, which further
promote disease progression in a positive-feedback amplification loop of
calcification and inflammation [9]. Proinflammatory stimuli induced by CVD
promote the majority of inflammasome specks to accumulate in granulocytes and
macrophages during the progression stage of inflammation [15, 16, 17]. We developed a
strong interest in inflammasomes from earlier studies reports about inflammasomes
and their derivation from macrophages [18, 19]. Several studies have found that
there were numerous pattern-recognition receptors (PRRs) capable of assembling
the inflammasome complex, but the well-established inflammasomes were still
NLRP1, NLRP3, nucleotide-binding domain (NOD)-like receptor family caspase-associated
recruitment domain-containing protein 4 (NLRC4) and absent in melanoma 2 (AIM2), among which NLRP1 and NLRP3 were the most widely
studied in CVD [20]. Accumulating evidence supports that inflammasomes, capable
of triggering and modulating inflammation-related signaling pathways, play the
crucial role in the progression of various CVD [10, 21, 22, 23]. Studies have
reported that the protein expressions of NLRP3 and caspase-1 in circulating
monocytes among patients with acute coronary syndrome were increased [22].
Similarly, the NLRP1 inflammasome were found to increase in patients with primary
atherosclerotic lesions and inflammasome complex was activated by interaction
with NLRP1 and NLRC4 receptors [24]. In the progression of atherosclerotic
lesions, cholesterol crystals were found to directly activate the NLRP3
inflammasome [25]. Elevated levels of triglycerides and very-low-density
lipoprotein cholesterol stimulated activation of the NLRP1 inflammasome by
nuclear factor kappa-B (NF-
Advanced age is a well-established risk and prognostic factor for CAC. Our
logistic analysis revealed that patients with advanced age had a significantly
increased risk of CAC, consistent with previous studies [3, 7]. Cigarette
smoking, a significant health, remains highly prevalent worldwide and contributes
to cardiovascular morbidity and mortality. Our findings, consistent with prior
studies, showed that cigarette smoking was a critical factor of the presence and
extent of CAC [29, 30]. Nicotine in cigarettes increases secretion of
inflammatory cytokines and elevates lipid content within atherosclerotic lesions,
subsequently causing osteogenic differentiation of vascular smooth muscle cells
(VSMCs) [31]. CAC has also been found to be more severe in patients with DM [3, 8]. Our findings parallel prior studies on the relationship of DM and CAC. The
mechanism of CAC induced by DM can be attributed to multiple factors. The main
metabolites of diabetic individuals, advanced glycosylation end products (AGEs)
can contribute to oxidative stress and the inflammatory response. Long-term
exposure of VSMCs to a high glucose environment can activate relevant signaling
pathways such as Wnt, extracellular signal-regulated kinases 1 and 2 (ERK1/2) and NF-
There are several limitations in this study. First, patients with certain diseases such as severe CKD, were more likely to prioritize receiving treatment from other departments, rather than undergoing CAG directly because of concern for increased complications. Lack of the data from these patients might affect the robustness of the model. Second, to prevent bias of insufficient data, some previously reported risk factors of CAC, such as the serum levels of parathyroid hormone (PTH), vitamin D, calcium and phosphorus, were not included. Third, this is a single-center study focused on the Chinese population. More information, such as ethnic background, diet and physical activity, awaits clarification in future studies to make the model more compatible and generalizable. In addition, to ensure the credibility and robustness of our model, more external data are warranted for validation in future studies.
This study found that the serum NLRP1 level was an independent risk factor of CAC in patients with CAD. We developed a web-based dynamic nomogram model consisting of 7 clinical characteristics, which may serve as a simple-to-use screening tool to personalize the risk of developing CAC and improve the therapeutic options for patients with CAD.
All data that support the findings in this study are not publicly available due to patient privacy, but are available from the corresponding author upon reasonable request.
JFP, BHZ, WHL, WHQ, JZ and FFL made substantial contributions to conception and design of the work, analysis and interpretation of data, took part in drafting, revising and critically reviewing the manuscript; TX, XBH, YHZ, YXW and SYP contributed in acquisition of data, analysis and interpretation of data, been involved in revising and critically reviewing the manuscript. All authors read and approved the final manuscript. All authors have participated sufficiently in the work and agreed to be accountable for all aspects of the work.
The study protocol was approved by the Ethics Committee of the Affiliated Hospital of Xuzhou Medical University (No: XYFYLW2017-002). All patients understood the study procedure and voluntarily signed an informed consent form.
Not applicable.
This research was supported by the National Natural Science Foundation of China (Grant No.81900216) and the Science and Technology Program of Xuzhou (KC21067).
The authors declare no conflict of interest.
References
Publisher’s Note: IMR Press stays neutral with regard to jurisdictional claims in published maps and institutional affiliations.