


 , Jianfang Luo 2,*
1 Department of Cardiology, Guangdong Provincial People’s Hospital (Guangdong Academy of Medical Sciences), Southern Medical University, 510515 Guangzhou, Guangdong, China
2 Department of Cardiology, Guangdong Cardiovascular Institute, Guangdong Provincial People's Hospital (Guangdong Academy of Medical Sciences), Southern Medical University, 510515 Guangzhou, Guangdong, China
3 School of Medicine, South China University of Technology, 510641 Guangzhou, Guangdong, China
4 Department of Emergency and Critical Care Medicine, Guangdong Provincial People's Hospital, Guangdong Academy of Medical Sciences, 510080 Guangzhou, Guangdong, China
†These authors contributed equally.
Abstract
Background: Malnutrition is a poor prognostic factor in a wide range of
diseases. Nevertheless, there is a lack of data investigating the association
between malnutrition and outcomes of patients with type B aortic dissection
(TBAD) undergoing thoracic endovascular aortic repair (TEVAR). Therefore, the aim
of the present study was to report the prevalence and clinical impact of
malnutrition assessed by the controlling nutritional status (CONUT) score in TBAD
patients undergoing TEVAR. Methods: The retrospective study indicated
that a total of 881 patients diagnosed with TBAD and treated with TEVAR from
January 2010 to December 2017 were categorized into subgroups based on their
CONUT score (low
Keywords
- malnutrition
- controlling nutritional status score
- type B aortic dissection
- thoracic endovascular aortic repair
- outcomes
Type B aortic dissection (TBAD) is a life-threating vascular event with an elevated risk of serious complications and morbidity [1]. Thoracic endovascular aortic repair (TEVAR) is successful therapy for patients with TBAD, enhances both short- and long-term survival. However, the post-operative death rate remains elevated, especially during long-term follow-up [2, 3]. Therefore, it is essential to promptly recognize risk factors for post-operative morbidity and mortality, and then address reversible risk factors to improve patient outcomes and decrease subsequent costs.
Despite being frequently overlooked, malnutrition is prevalent among patients with aortic diseases and is associated with an unfavorable prognosis [4, 5, 6]. Aortic dissection may trigger inflammation, decrease in appetite, and a catabolic condition, leading to malnutrition [7, 8]. Malnutrition may also accelerate disease progression due to the vicious cycle associated with muscle wasting, reduction in physiological reserves, and degeneration of the aorta medial wall [7, 9]. Malnutrition, as a modifiable risk factor, offers the advantage of allowing timely intervention when compared to other clinical variables.
Scoring systems could be useful to evaluate one’s nutritional status. Numerous screening tools for malnutrition have been developed, but a consensus on the optimal evaluation method has not been reached. One of these assessment tools, controlling nutritional status (CONUT) score, has been widely reported as a simple and efficient method to evaluate nutritional status. It has also been shown to be linked to negative outcomes in various diseases [5, 6, 10, 11]. Despite the significance of nutritional assessment for vascular surgery diseases, there is limited data on the relationship between the nutritional state and the outlook of patients who undergo TEVAR.
This single-center, retrospective observational study included 992 consecutive patients with TBAD undergoing TEVAR from January 2010 to December 2017. The diagnosis of TBAD was validated through enhanced computed tomography angiography (CTA). The inclusion criteria were the patients of TBAD undergoing TEVAR. Exclusion of patients occurred due to the following factors: (1) blunt traumatic aortic injury, (2) malignant tumor, (3) disorders of connective tissue, (4) prior surgical intervention on the aorta, (5) insufficient data for nutritional assessment (Supplementary Fig. 1). The final analysis included the remaining 881 participants. The ethics committee of Guangdong Provincial People’s Hospital (#201807) gave approval for this study and waived the requirement for informed consent.
Blood samples were harvested at admission and blood routine examination, lipid profile test, and other laboratory indicators analysis were performed in the central laboratory of the hospital. The CONUT score was created and confirmed as a tool for evaluating the nutritional status of patients admitted to the hospital. It is calculated by adding up the scores of total lymphocytes, albumin level, and total cholesterol levels (Supplementary Table 1) [10]. Scores on a scale of 0 to 12, with higher scores indicating a more unfavorable condition. To detect sarcopenia, the skeletal muscle mass index (SMI) was determined using the following formulas: for males, 0.220 multiplied by the body mass index (BMI) and then added to 2.991; for females, 0.141 multiplied by the BMI and then added to 3.377 [12]. Complex TBAD was defined as TBAD accompanied by persistent pain, unresponsive hypertension despite maximum medication, rapid aortic enlargement, malperfusion syndromes, and signs of rupture (such as hemothorax, increasing periaortic and mediastinal hematoma) [1].
All patients received with standardized medications and TEVAR treatment
following the current guideline and consensus [1, 13]. Patients who had
uncomplicated TBAD were subjected to TEVAR if the aortic diameter exceeded 40 mm,
primary entry tear diameter
All in-hospital survival patients received clinical and the image of CTA follow-up at 3, 6, 12 months, and subsequently on an annual basis. The assessment of the patient’s state was carried out either by visiting the outpatient clinic or by conducting a telephone interview. The primary outcome were thirty-day death and follow-up mortality. The secondary results included early outcomes that happened during the hospital stay or within 30 days after the procedure. These outcomes encompassed mortality, extended stay in the intensive care unit (ICU), confusion, stroke caused by lack of blood supply to the brain, reduced blood flow to limbs or organs, reduced blood flow to the spinal cord, acute kidney damage, the need for further intervention, and subsequent intervention or stroke during follow-up.
Mean
The primary predictor was pre-operative CONUT score modeled as a continuous
variable. The CONUT score (
The Kaplan-Meier method was used to present survival data and the log-rank test was employed to compare differences in survival. To evaluate the impact of preoperative nutritional condition on subsequent overall mortality, Cox proportional-hazards regression models were employed. Formal tests were conducted to examine the assumption of proportional hazard, utilizing the techniques outlined by Grambsch and Therneau [17]. There was no indication of any breaches of this assumption. An initial multivariable Cox regression model included demographic characteristics, comorbidities, laboratory tests, and imaging findings. Variables that had a p value less than 0.1 in the univariable analysis were included in the multivariable models using a forward stepwise technique. Additionally, to reduce bias and mimic randomization, two propensity-score methods were used to account for potential confounding by characteristics influencing outcomes. A multivariate logistic regression model with covariates was used to estimate individual tendencies for each subject.
The primary analysis used inverse probability of treatment weighting (IPTW) [18]. The stabilized IPTW weight was calculated using the predicted probabilities derived from the propensity-score model in the IPTW analysis. Cox regression models that used the IPTW weights were reported. In the same Cox regression model, we conducted a secondary analysis incorporating the propensity score as an extra covariate.
To further analyze the data, the CONUT score threshold was modified,
categorizing it into different levels: normal (0–1), mild malnutrition (2–4),
moderate malnutrition (5–8), and severe malnutrition (
Of the 881 patients enrolled, the average age was 54.2
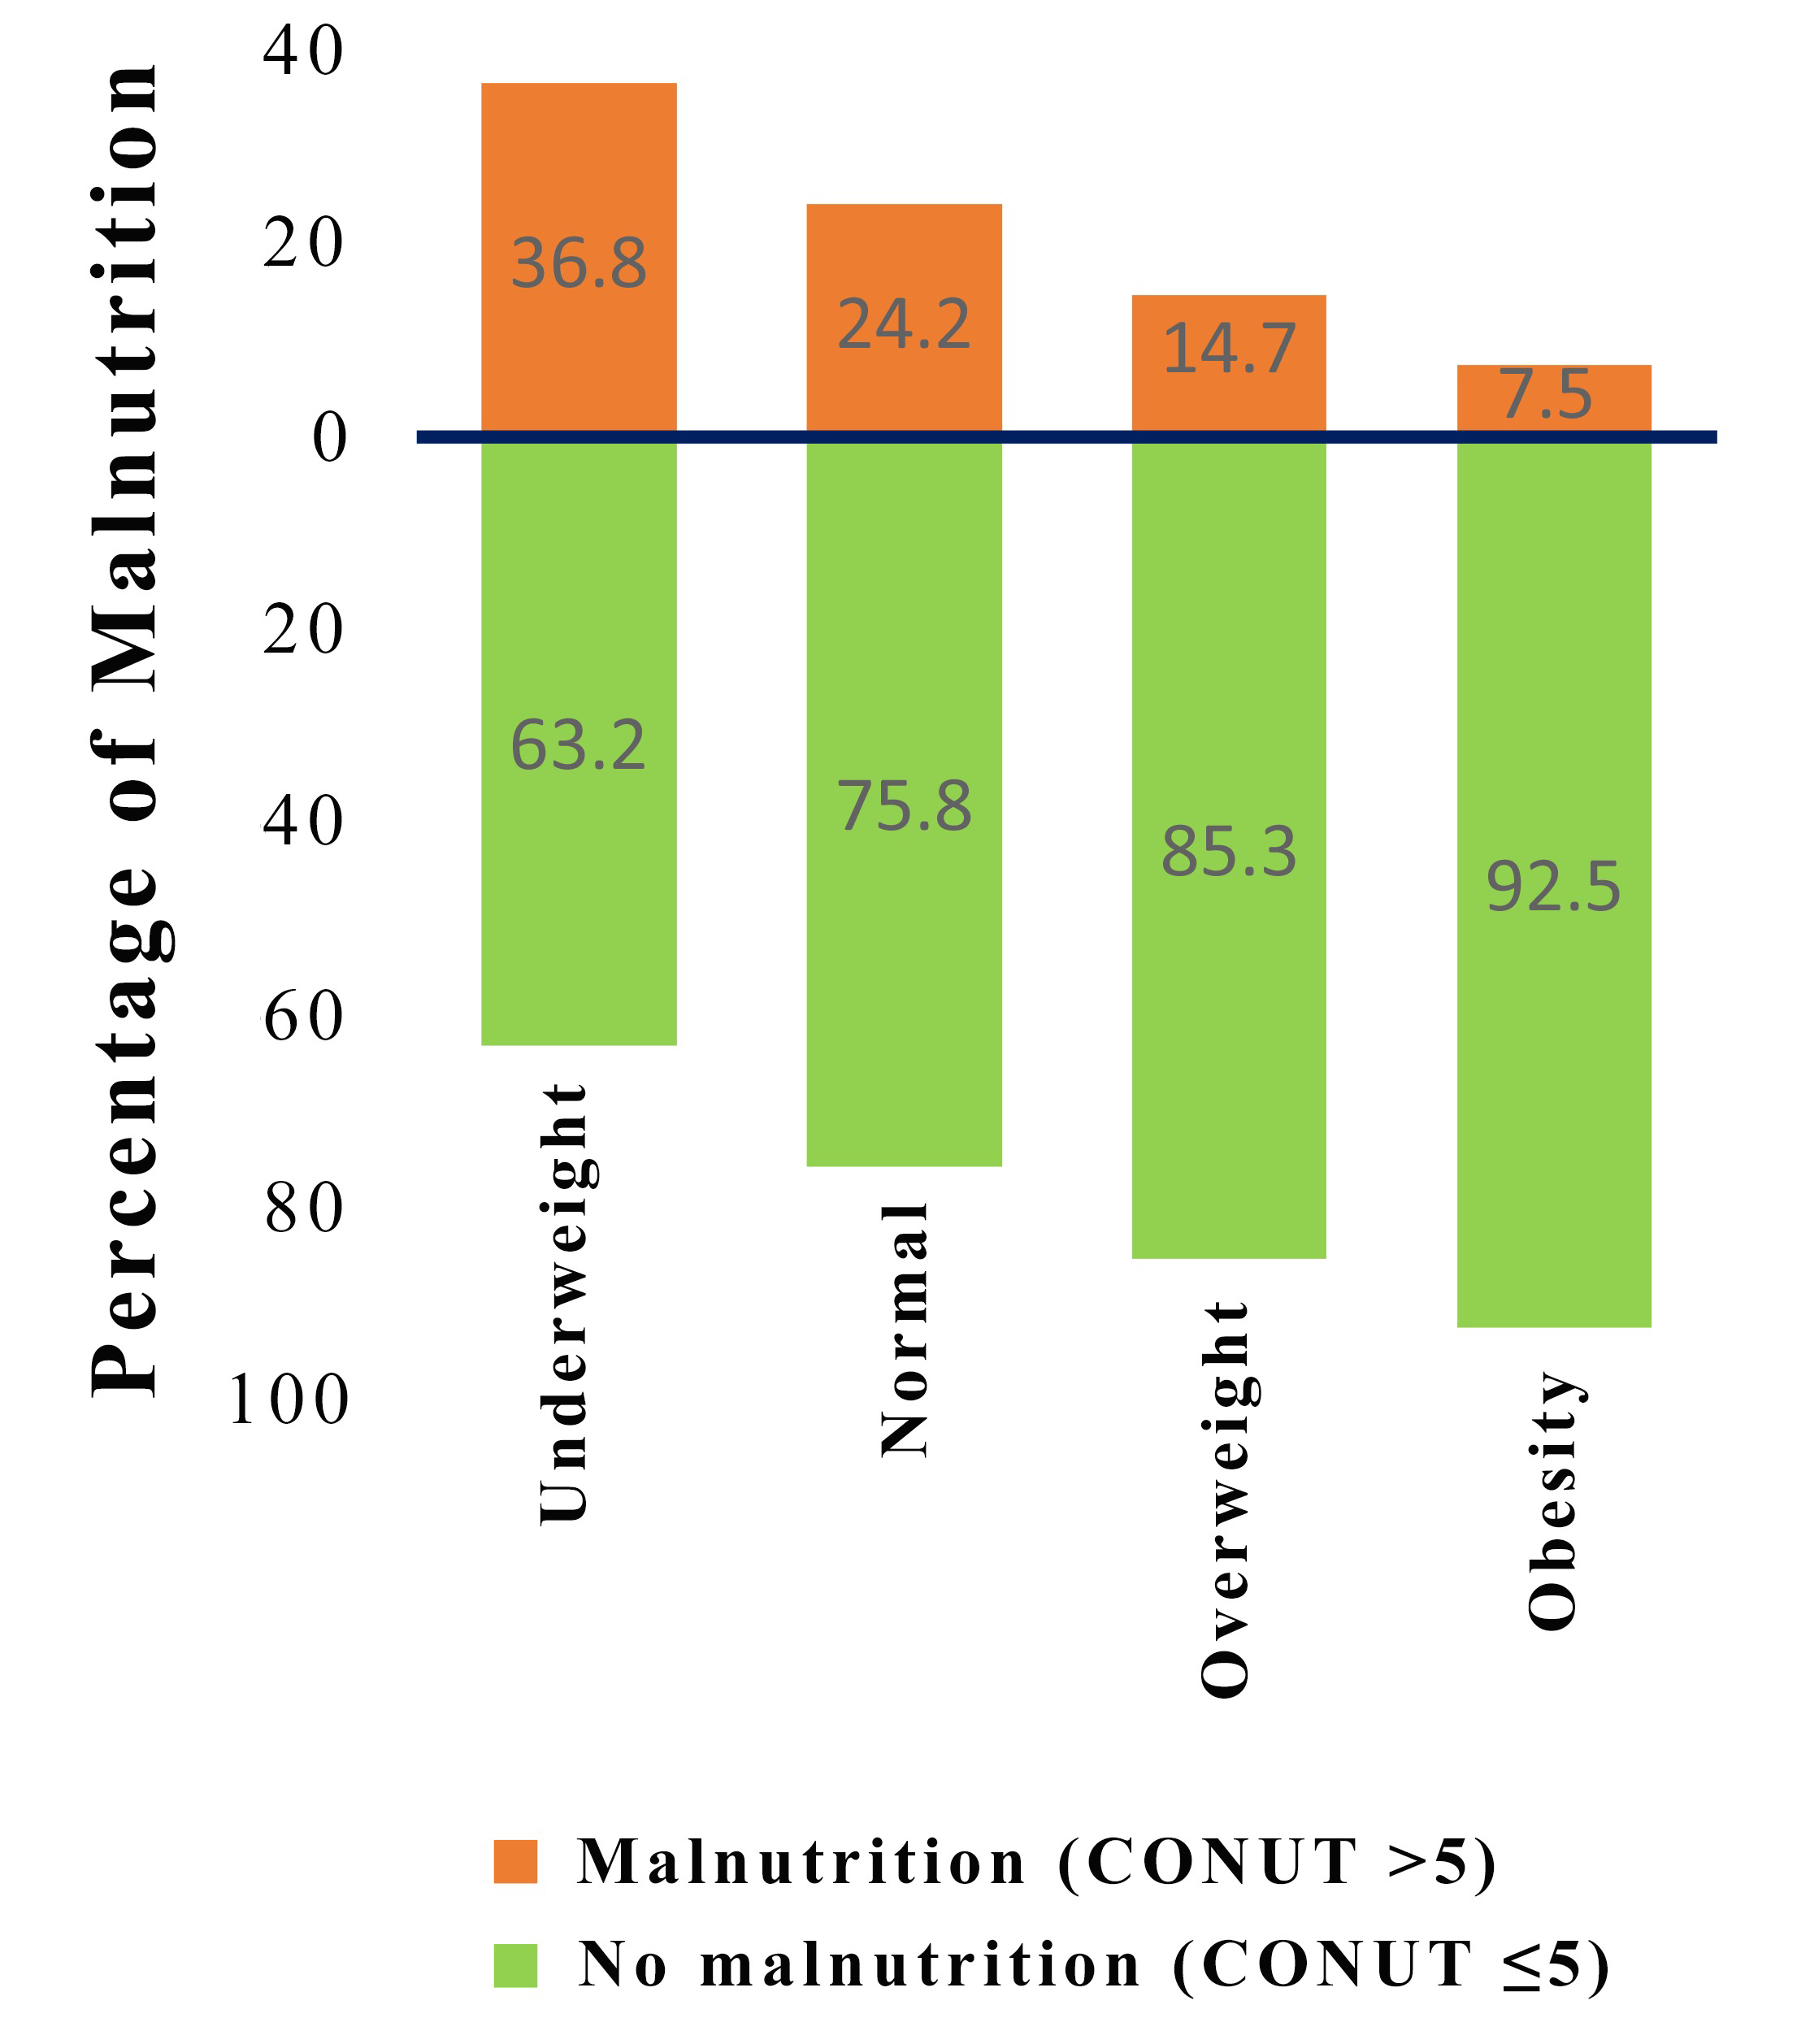
 Fig. 1.
Distribution of malnutrition by subgroups of patients according to body mass index. CONUT, controlling nutritional status.
| Variables | Low CONUT | High CONUT | p | |
| ( |
( | |||
| Age, years | 53.6 (10.8) | 56.4 (11.2) | 0.003 | |
| Age |
103 (14.7) | 40 (22.3) | 0.018 | |
| Sex, male | 612 (87.2) | 151 (84.4) | 0.386 | |
| BMI, kg/m |
24.5 (22.5, 26.9) | 23.0 (20.4, 25.1) | ||
| SMI, kg/m |
8.3 (7.7, 8.8) | 7.9 (7.4, 8.4) | ||
| Complicated TBAD | 430 (61.3) | 104 (58.1) | 0.493 | |
| Phases of artic dissection | 0.004 | |||
| Acute | 529 (75.4) | 131 (73.2) | 0.550 | |
| Subacute | 109 (15.5) | 42 (23.5) | 0.012 | |
| Chronic | 64 (9.1) | 6 (3.4) | 0.011 | |
| Co-morbidities | ||||
| Hypertension | 600 (85.5) | 147 (82.1) | 0.319 | |
| Coronary artery disease | 98 (14.0) | 35 (19.6) | 0.080 | |
| Diabetes mellitus | 45 (6.4) | 13 (7.3) | 0.809 | |
| Anemia | 283 (40.3) | 137 (76.5) | ||
| Hyperlipoidemia | 93 (13.2) | 17 (9.5) | 0.219 | |
| Stroke | 24 (3.4) | 6 (3.4) | ||
| Abdominal aortic aneurysm | 20 (2.8) | 8 (4.5) | 0.387 | |
| Imaging findings | ||||
| MAD, mm | 37.9 (34.0, 43.0) | 38.0 (34.9, 44.0) | 0.496 | |
| MAD |
244 (34.8) | 66 (36.9) | 0.659 | |
| Extent of the dissection | 0.279 | |||
| Confined in thoracic aorta | 133 (18.9) | 41 (22.9) | ||
| Extended to abdominal aorta | 569 (81.1) | 138 (77.1) | ||
| False lumen patency | 0.259 | |||
| Patent false lumen | 462 (65.8) | 116 (64.8) | ||
| Partial thrombosis | 212 (30.2) | 60 (33.5) | ||
| Complete thrombosis | 28 (4.0) | 3 (1.7) | ||
| The involvement of visceral arteries | 254 (36.2) | 46 (25.7) | 0.011 | |
| The involvement of renal arteries | 315 (44.9) | 63 (35.2) | 0.024 | |
| Pericardial effusion | 18 (2.6) | 17 (9.5) | ||
| Pleural effusion | 274 (39.0) | 91 (50.8) | 0.005 | |
| Liver cyst | 96 (13.7) | 15 (8.4) | 0.075 | |
| Renal cyst | 151 (21.5) | 37 (20.7) | 0.887 | |
| Laboratory tests | ||||
| White blood cell, 10 |
10.5 (8.3–12.7) | 9.7 (7.9–13.1) | 0.521 | |
| Hemoglobin, g/L | 133.4 (122.1–142.0) | 119.0 (107.3–129.0) | ||
| Lymphocyte, 10 |
1.7 (1.3, 2.1) | 1.2 (1.0, 1.5) | ||
| Albumin, g/dL | 34.5 (31.8, 37.0) | 27.6 (25.2, 29.2) | ||
| Total cholesterol, mg/dL | 4.5 (3.9, 5.1) | 3.5 (3.1, 4.1) | ||
| Triglyceride, mmol/L | 1.3 (1.0, 1.7) | 1.1 (0.8, 1.5) | ||
| LDL-c, mmol/L | 2.7 (2.2, 3.2) | 2.1 (1.7, 2.6) | ||
| D-dimer, µg/mL | 2.2 (0.7, 3.9) | 2.1 (0.9, 3.8) | 0.584 | |
| Creatinine, mg/dL | 1.0 (0.8, 1.3) | 1.1 (0.9, 1.7) | ||
| Creatinine |
50 (7.1) | 37 (20.7) | ||
| eGFR, mL/min/1.73 m |
83. 6 (62.3, 97.4) | 69.0 (43.3, 91.8) | ||
| eGFR |
161 (22.9) | 73 (40.8) | ||
| Operative procedure | ||||
| Hybrid | 171 (24.4) | 40 (22.3) | 0.642 | |
| Chimney | 142 (20.2) | 28 (15.6) | 0.200 | |
| Insertion of |
62 (8.8) | 25 (14.0) | 0.055 | |
| Medications at admission | ||||
| Antiplatelet drugs | 129 (18.4) | 23 (12.8) | 0.102 | |
| ACEI | 137 (19.5) | 38 (21.2) | 0.683 | |
| ARB | 335 (47.7) | 71 (39.7) | 0.065 | |
| Beta-blockers | 654 (93.2) | 168 (93.9) | 0.870 | |
| Calcium channel blockers | 541 (77.1) | 134 (74.9) | 0.601 | |
Values are given as mean
BMI, body mass index; SMI, skeletal muscle mass index; TBAD, type B aortic dissection; MAD, maximum aortic diameter; LDL-c, low-density lipoprotein cholesterol; eGFR, estimated glomerular filtration rate; ACEI, angiotensin-converting enzyme inhibitor; ARB, angiotensin receptor blocker; SD, standard deviation.
Individuals belonging to the high CONUT category exhibited a greater tendency
towards advanced age, elevated occurrences of subacute individuals, anemia, the
engagement of visceral arteries, the engagement of renal arteries, pericardial
effusion, pleural effusion, creatinine levels surpassing 2 mg/dL, and an
estimated glomerular filtration rate (eGFR)
The CONUT score was significantly associated with age, BMI, SMI, hemoglobin,
albumin, lymphocyte, TC, triglyceride, LDL-c, creatinine, and eGFR (p
| Variables | Correlation | p |
| Coefficient | ||
| Age | 0.174 | |
| Gender | 0.049 | 0.146 |
| Systolic blood pressure | 0.008 | 0.801 |
| Diastolic blood pressure | –0.016 | 0.639 |
| Body mass index | –0.232 | |
| Skeletal muscle mass index | –0.228 | |
| White blood cell count | 0.033 | 0.321 |
| Hemoglobin | –0.411 | |
| Albumin | –0.779 | |
| Lymphocyte count | –0.429 | |
| Total cholesterol | –0.383 | |
| Triglyceride | –0.192 | |
| Low-density lipoprotein cholesterol | –0.464 | |
| D-dimer | 0.039 | 0.250 |
| Creatinine | 0.234 | |
| Estimated glomerular filtration rate | –0.261 |
CONUT, controlling nutritional status.
Patients classified in the high CONUT group had significantly higher rates of
30-day prolonged ICU stay, mortality, and post- surgical confusion (p
| Low CONUT | High CONUT | p | ||
| ( |
( | |||
| Early outcomes | ||||
| Hospital stays, days | 13.0 (9.0–18.0) | 14.0 (10.0–19.0) | 0.157 | |
| Prolonged ICU stay * | 192 (27.4) | 67 (37.4) | 0.008 | |
| Death | 12 (1.7) | 8 (4.5) | 0.043 | |
| Cerebral infarction | 19 (2.7) | 5 (2.8) | ||
| Delirium | 59 (8.4) | 26 (14.5) | 0.013 | |
| Limb ischemia | 14 (2.0) | 4 (2.2) | 0.771 | |
| Visceral ischemia | 2 (0.3) | 2 (1.1) | 0.185 | |
| Spinal cord ischemia | 9 (1.3) | 3 (1.7) | 0.717 | |
| Acute kidney injury | 172 (24.5) | 55 (30.7) | 0.089 | |
| Re-intervention | 8 (1.1) | 3 (1.7) | 0.474 | |
| Follow-up outcomes | ||||
| All-cause Mortality | 63 (9.0) | 39 (21.8) | ||
| Re-intervention | 37 (5.3) | 9 (5.0) | 0.896 | |
| Stroke | 21 (3.0) | 7 (3.9) | 0.531 | |
Values are given as number (percentage) or median (quartiles 1 through 3).
CONUT, controlling nutritional status; ICU, intensive care unit. *Prolonged ICU stay was defined as intensive care unit stay greater than 72 hours.
Multivariable logistic analyses indicated that the CONUT score, which assessed
pre-operative nutritional status, was a significant independent predictor of
prolonged ICU stay (OR, 1.09; 95% CI, 1.02–1.17; p = 0.015), 30-day
death (OR, 1.43; 95% CI, 1.19–1.72; p
| Variable | CONUT score |
CONUT |
Severe malnutrition ( | ||||
| OR (95% CI) | p | OR (95% CI) | p | OR (95% CI) | p | ||
| Early outcomes | |||||||
| Prolonged ICU stay * | 1.09 (1.02–1.17) | 0.015 | 1.69 (1.15–2.50) | 0.008 | 2.03 (0.68–6.10) | 0.206 | |
| Thirty-day Death | 1.43 (1.19–1.72) | 2.41 (0.89–6.56) | 0.084 | 31.12 (2.82–343.09) | 0.005 | ||
| Cerebral infarction | 0.99 (0.79–1.23) | 0.915 | 0.97 (0.30–3.12) | 0.963 | 6.00 (0.54–66.42) | 0.144 | |
| Delirium | 1.11 (1.01–1.23) | 0.035 | 1.67 (0.98–2.85) | 0.058 | 4.31 (1.29–14.39) | 0.017 | |
| Limb ischemia | 0.93 (0.72–1.19) | 0.929 | 0.76 (0.20–2.88) | 0.685 | 3.15 (0.19–51.81) | 0.421 | |
| Spinal cord ischemia | 0.96 (0.69–1.34) | 0.810 | 0.71 (0.14–3.65) | 0.685 | - | 0.998 | |
| Acute kidney injury | 1.09 (1.01–1.16) | 0.027 | 1.39 (0.91–2.11) | 0.124 | 3.06 (1.16–8.06) | 0.024 | |
| Re-intervention | 0.86 (0.61–1.23) | 0.414 | 1.22 (0.21–6.93) | 0.825 | - | 0.998 | |
| Follow-up outcome | |||||||
| Mortality | 1.13 (1.05–1.23) | 0.002 | 1.68 (1.11–2.53) | 0.014 | 4.20 (1.46–12.14) | 0.008 | |
| Stroke | 1.11 (0.91–1.36) | 0.290 | 2.07 (0.75–5.72) | 0.162 | - | 0.952 | |
| Re-intervention | 0.90 (0.77–1.06) | 0.193 | 1.08 (0.48–2.43) | 0.862 | - | 0.985 | |
OR, odds ratio; CI, confidence interval; ICU, intensive care unit; CONUT, controlling nutritional status.
*Prolonged ICU stay was defined as intensive care unit stay greater than 72 hours.
Over a period of 70.8 months (with an interquartile range of 46.1–90.8 months),
102 (11.8%) patients died after the procedures, with 39 (21.8%) and 63 (9.0%)
patients in the high and low CONUT group, respectively (p
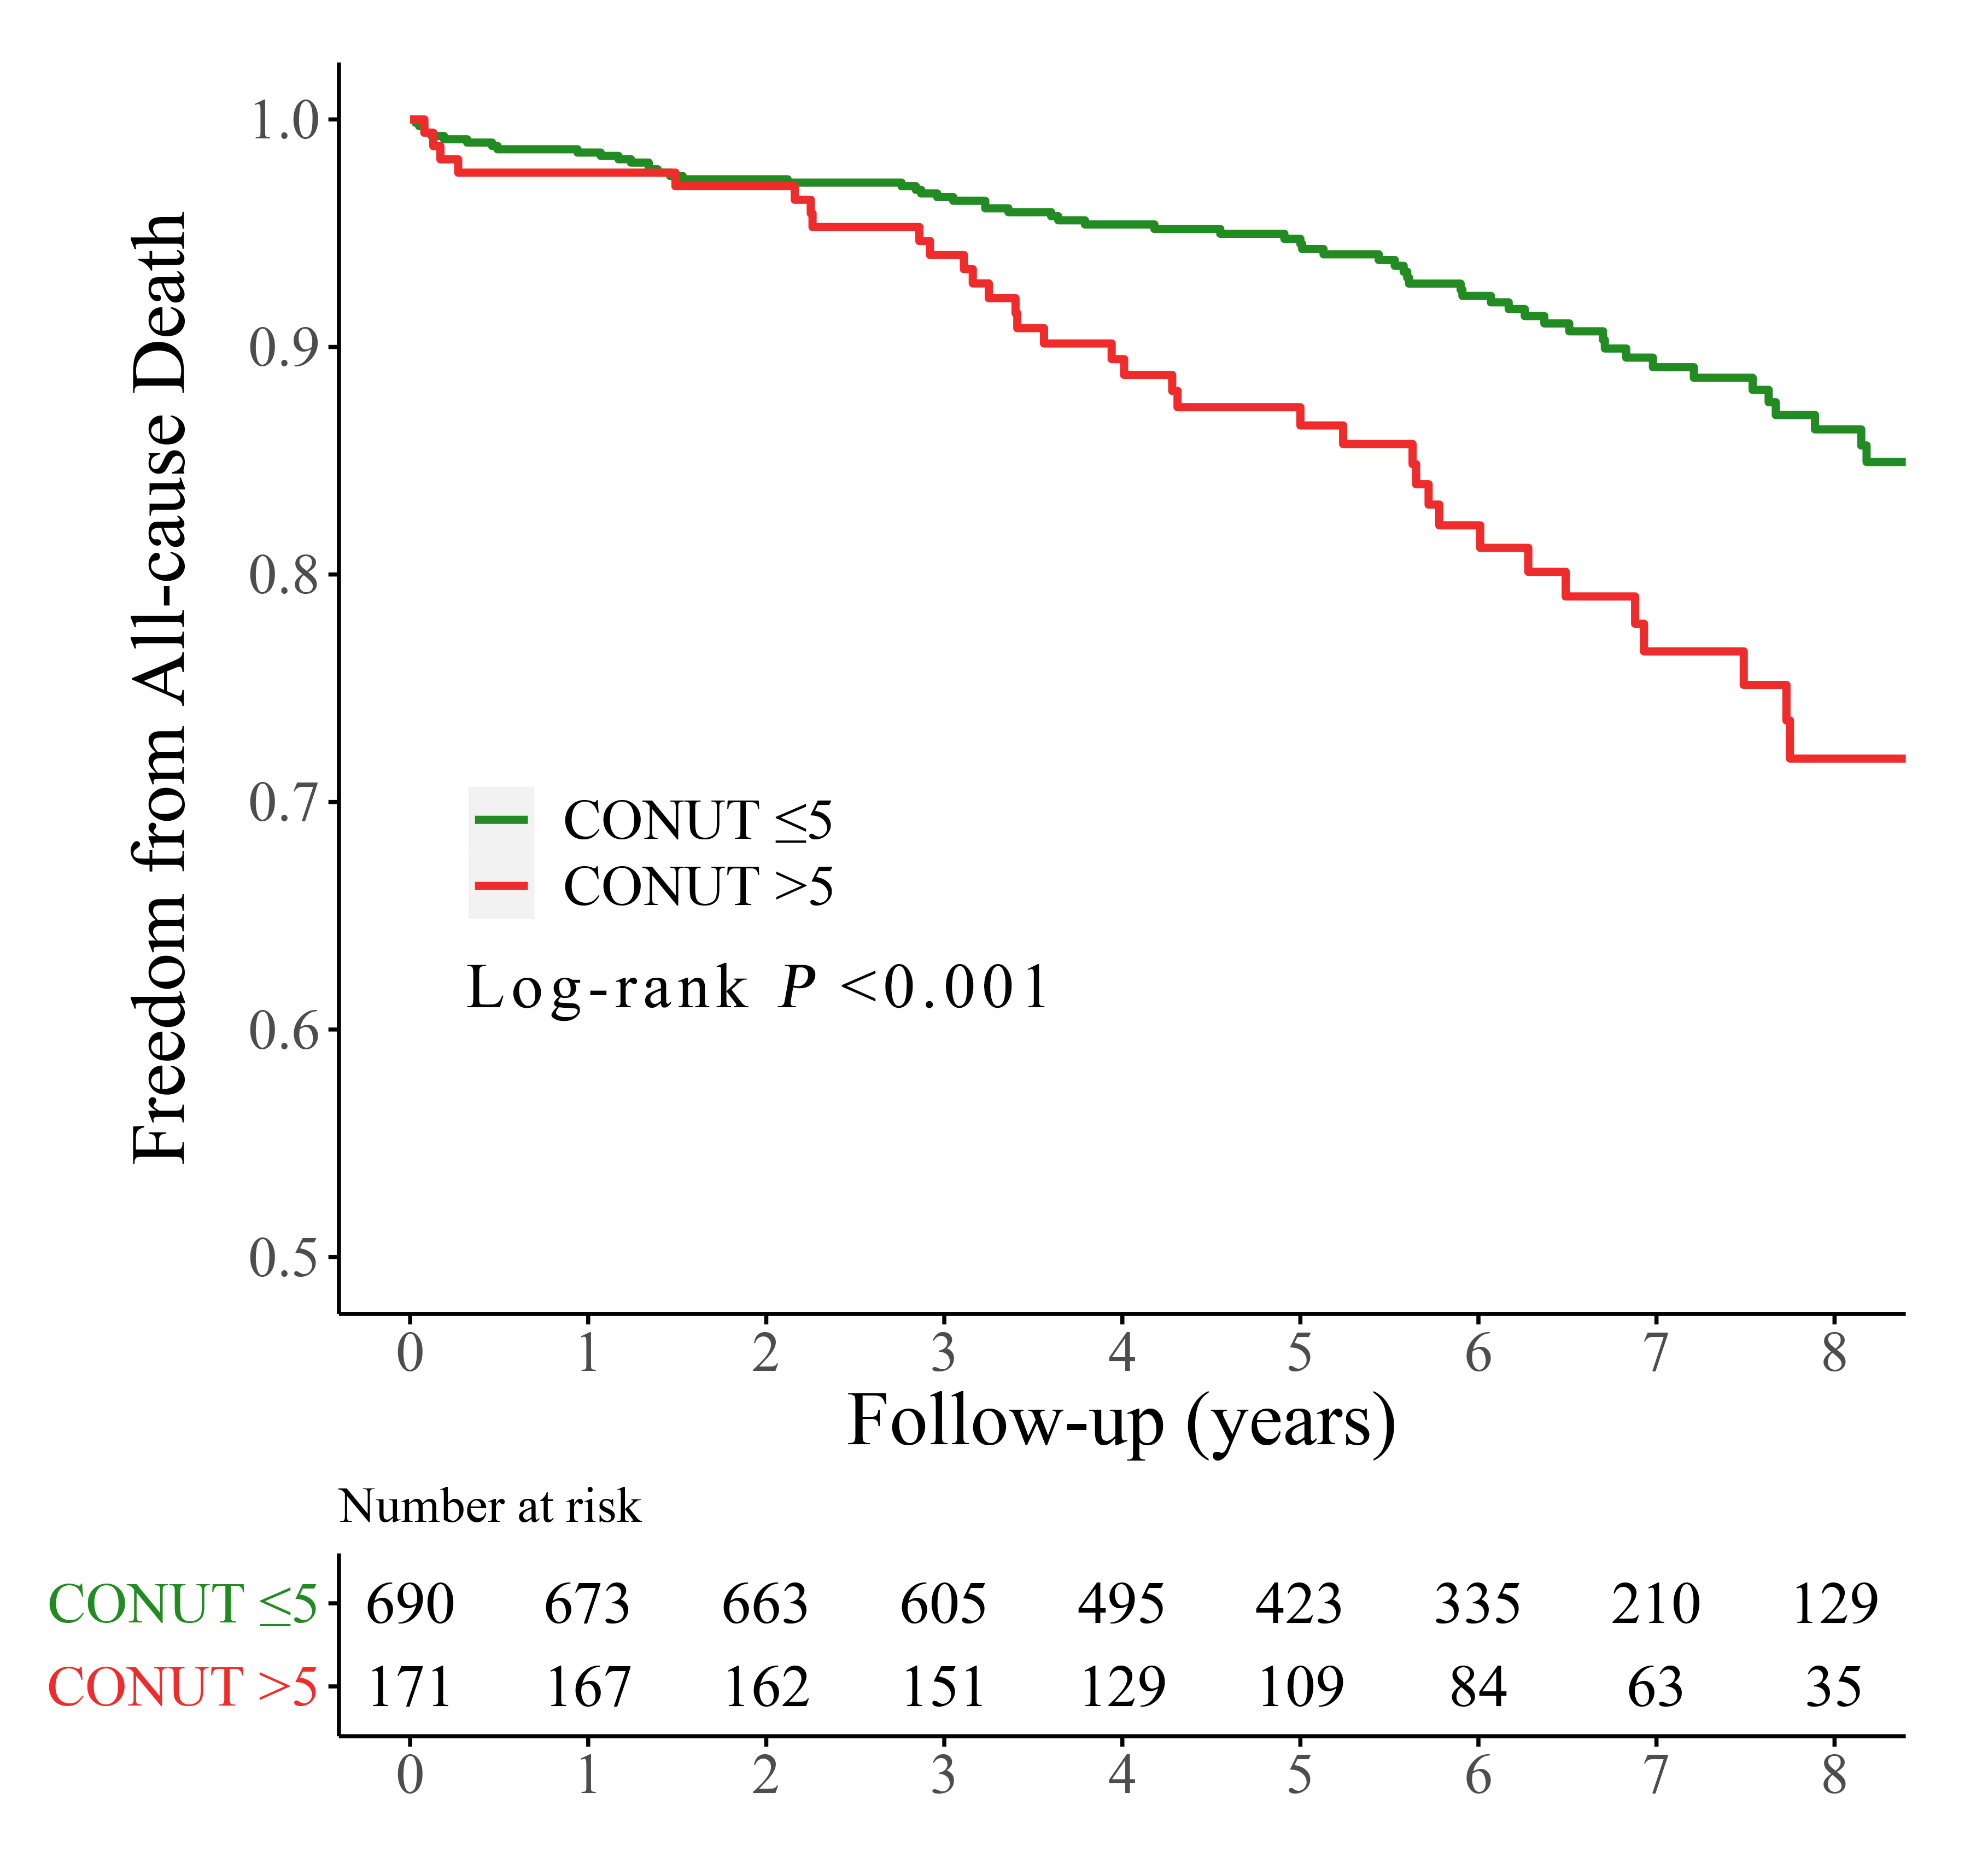 Fig. 2.
Kaplan-Meier curves for all-cause mortality by the CONUT score. CONUT, controlling nutritional status.
After adjusting for confounding factors (Table 4), Cox multivariate analysis
showed that the hazard ratios (HR) for follow-up mortality were 1.13 (95% CI,
1.05–1.23; p = 0.002) for CONUT score as a continuous variable.
Additional significant factors included BMI (HR, 0.88; 95% CI, 0.83–0.94;
p
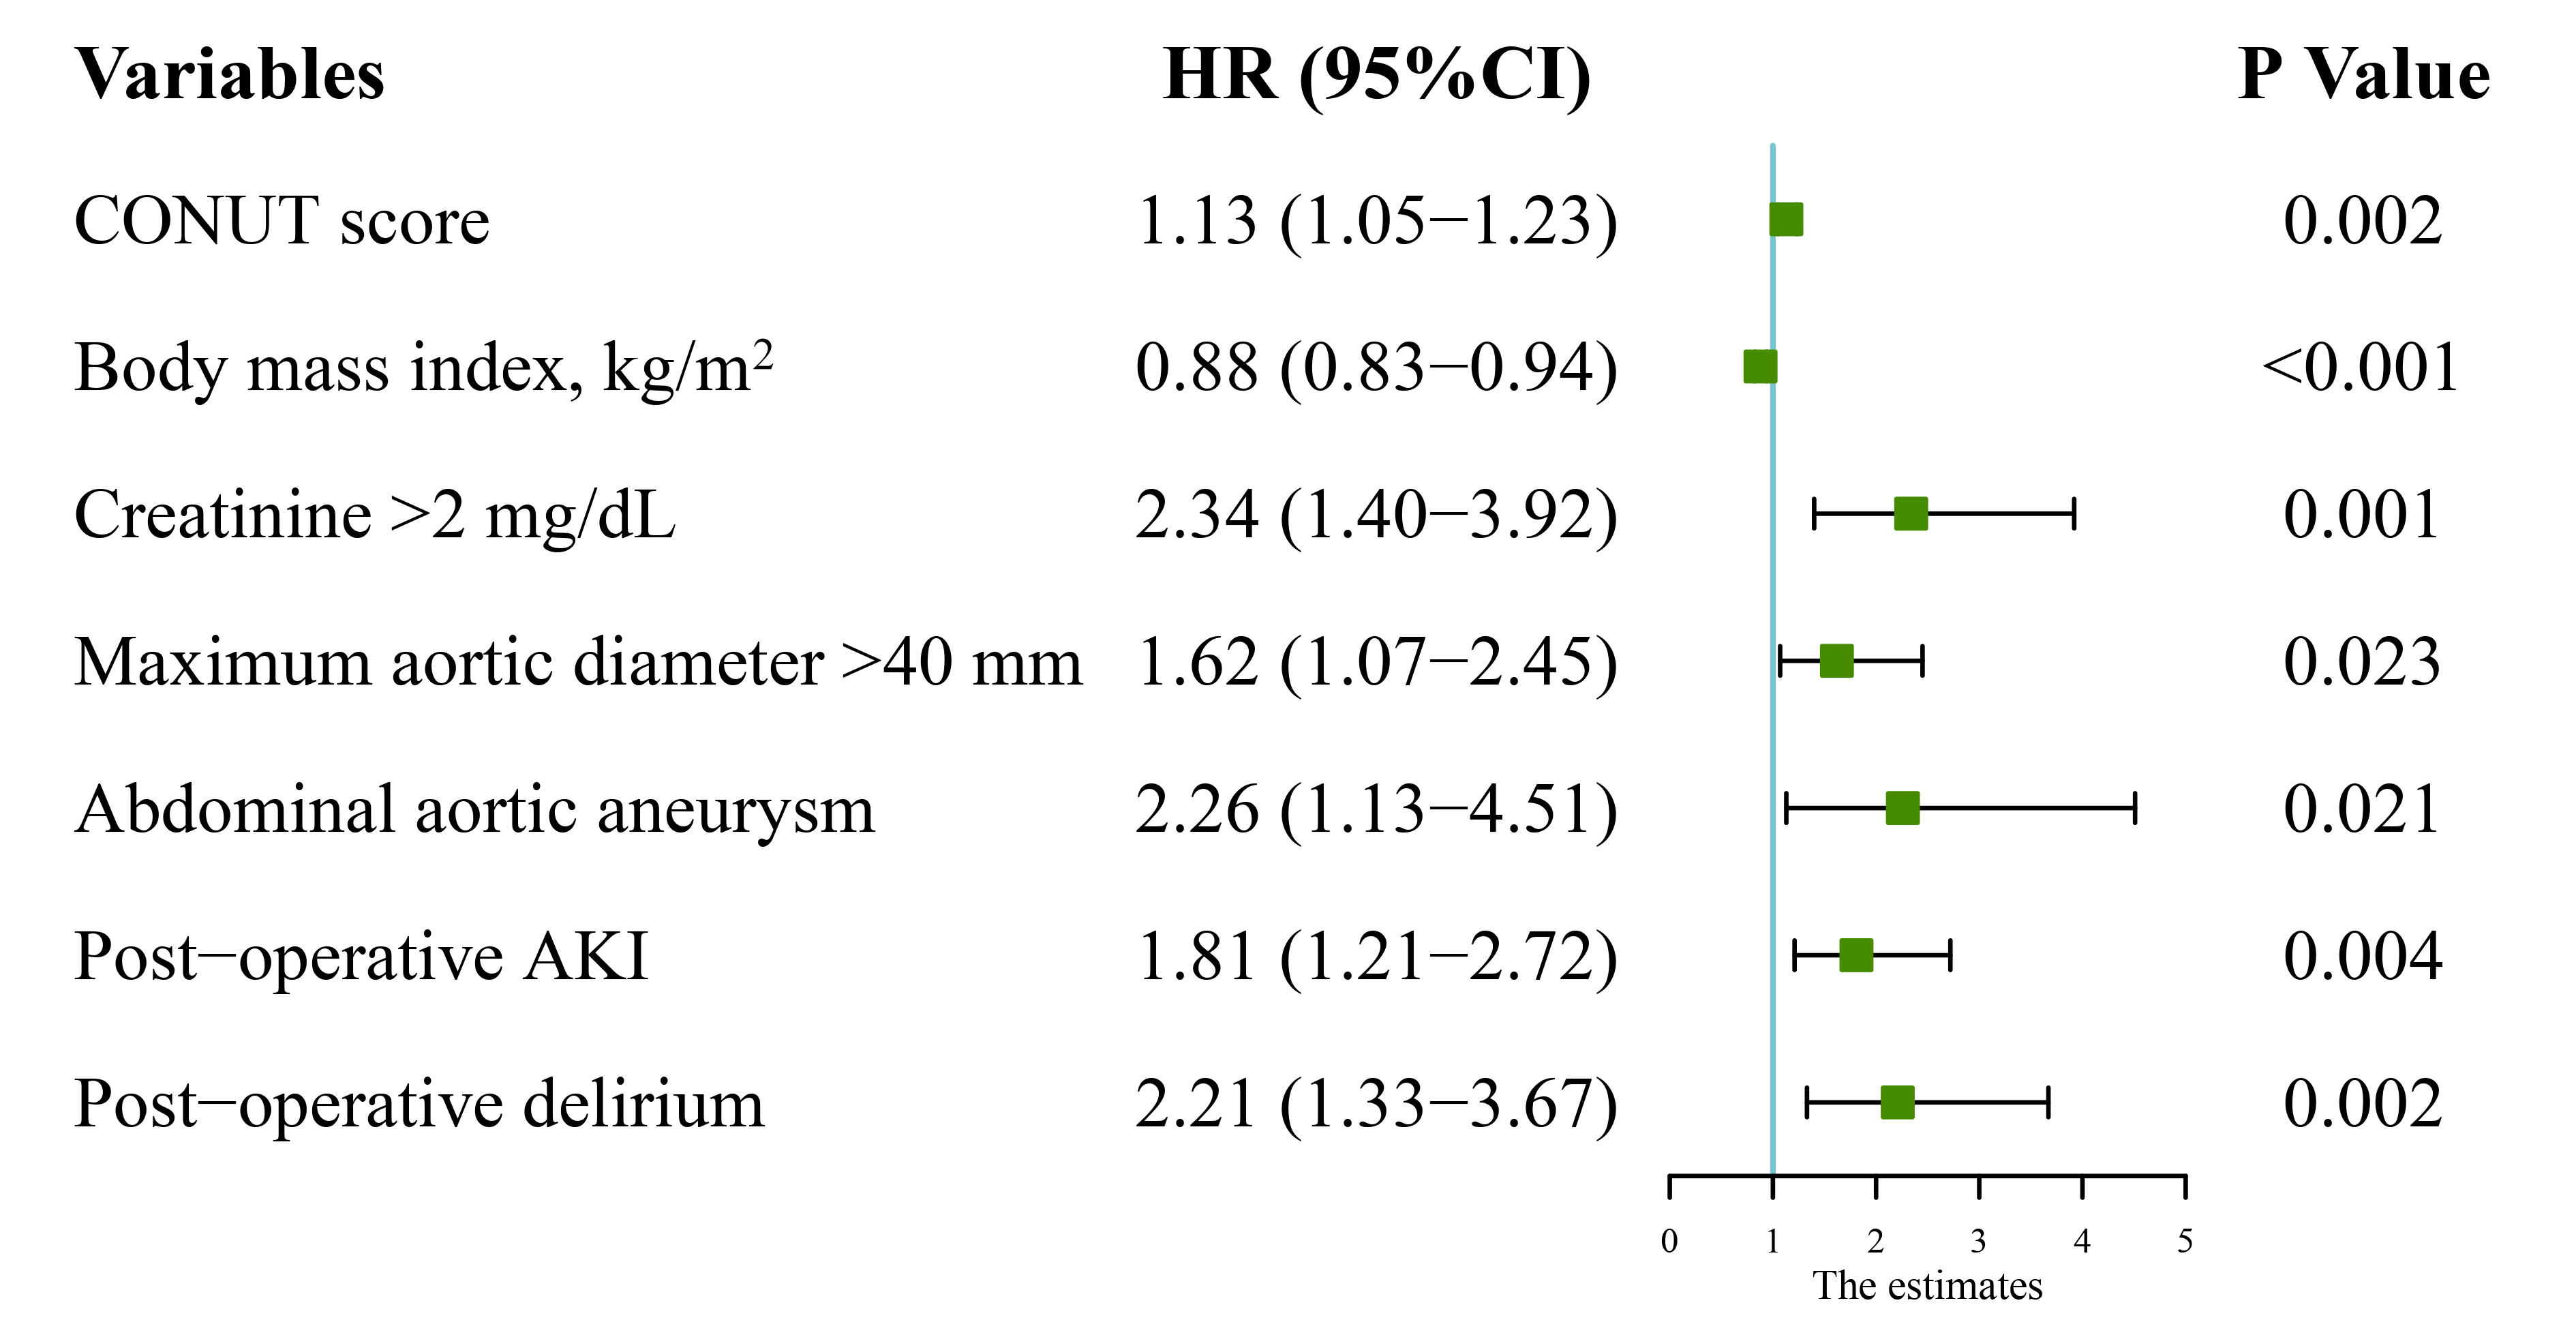 Fig. 3.
Multivariate analysis results of follow-up mortality. HR, hazard ratio; CI, confidence interval; CONUT, controlling nutritional status; AKI, acute kidney injury.
In the multivariable analysis using IPTW based on the propensity score, the
CONUT score
| Analysis | Follow-up mortality | p | |
| No. of events/no. of patients at risk (%) | |||
| CONUT score |
63/702 (9.0) | - | |
| CONUT score |
39/179 (21.8) | - | |
| Crude analysis - HR (95% CI) | 2.33 (1.56–3.48) | ||
| Multivariable analysis - HR (95% CI) * | 1.68 (1.11–2.53) | 0.014 | |
| Propensity-score analyses - HR (95% CI) | |||
| With inverse probability weighting |
1.76 (1.10–2.81) | 0.018 | |
| Adjusted for propensity score |
1.68 (1.11–2.53) | 0.014 | |
* Shown is the hazard ratio from the multivariable Cox proportional-hazards
model adjusting for age
CONUT, controlling nutritional status; HR, hazard ratio; CI, confidence interval; eGFR, estimated glomerular filtration rate.
Moreover, the threshold for the CONUT score was modified, and malnutrition was
categorized as follows: a CONUT score of 0 to 1 was classified as normal, while
scores of 2 to 4, 5 to 8, and 9 to 12 were designated as mild, moderate, and
severe malnutrition, respectively [10]. Pre-operative significant
undernourishment persisted as a separate forecaster for death within 30 days,
delirium after surgery, acute kidney injury after surgery, and mortality during
follow-up (p
In this study, we discovered that patients with higher CONUT scores faced a heightened likelihood of experiencing an extended stay in the ICU, mortality within 30 days, post-operative delirium and AKI, as well as mortality during the follow-up period. The independent correlation between malnutrition and follow-up mortality remained after modifying the threshold for malnutrition. Propensity-score methods further validated these findings, indicating that CONUT serves as an autonomous and dependable predictor of the initial and prolonged outcomes in TBAD patients who undergo TEVAR.
In our study, the CONUT score classified over 20% of TBAD patients as
malnourished, with the greatest percentage found among patients who were
underweight (36.8%). Notably, 10.3% of patients with BMI
The outcome of our study revealed a correlation between malnourishment and reduced long-term survival, as previously documented in patients who underwent percutaneous coronary intervention [10, 11, 19], coronary artery bypass graft surgery (CABG) [20], and transcatheter aortic valve replacement [21]. Malnutrition is a complicated condition that involves depleted protein stores, a decline in calories, and weakened immune system [22]. The occurrence of adverse events may be induced by a decrease in the ability of underlying fibrinolysis, platelet inhibition, and antioxidant power, along with an increase in blood viscosity [19]. The CONUT score, which is determined by measuring serum albumin, total cholesterol level, and total lymphocyte count, has been confirmed as an effective screening method for malnutrition and is linked to decreased survival rates in conditions such as coronary artery disease [10], peripheral artery disease [5], valvular disease [21] and so on. In addition to reflecting the nutritional status, albumin could also be an indicator of inflammatory responses. The decrease in albumin levels could potentially indicate ongoing damage to the arteries and the advancement of dissection [19, 23]. The number of lymphocytes indicates the immune system of the individual and has been linked to their nutritional condition. The lymphocyte counts decrease, leading to impaired immune defenses [19]. Hypoproteinemia and lymphocytopenia have been demonstrated to be independent risk factors for adverse clinical outcomes of patients with aortic dissection [23, 24]. Additionally, the phenomenon known as the ‘lipid paradox’ or ‘obesity paradox’ has been documented in relation to cardiovascular illness, indicating that individuals with lower lipid levels or BMI may experience unfavorable outcomes [4]. Besides, our study reveals that malnourished patients tend to be older and have a greater burden of diseases, thus confirming a clear association between malnutrition and unfavorable prognosis in TBAD patients.
Multiple research studies have documented a notable association between malnourishment and the emergence of delirium in individuals suffering from acute cardiovascular conditions [25]. Individuals undergoing CABG also showed a comparable correlation [20]. The connection between malnutrition and delirium is still unknown. One possible explanation was that the energy supply to the brain was limited in patients with malnourished, predisposing these subjects to a greater risk of post-operative delirium [25]. Furthermore, the CONUT score can also indicate the level of inflammation, which is considered a significant contributing factor to delirium [26]. In line with these investigations [20, 25], our analysis revealed that the CONUT score independently predicts post-operative delirium in TBAD patients who undergo TEVAR.
Moreover, malnutrition was demonstrated to increase the risk of the occurrence
of AKI in hospitalized patients [27]. The current research discovered that CONUT,
whether used as a continuous predictor or as a categorical predictor (severe
malnutrition [CONUT score
Interestingly, current guidelines and consensus for aortic disease did not emphasize the management of patient’s nutritional status. Nevertheless, our study revealed that malnourishment was a prevalent and significant concern among TBAD patients who underwent TEVAR. Identifying malnutrition in individuals with TBAD could help identify patients who are at a heightened risk of negative clinical outcomes. These patients may benefit from personalized prevention strategies involving nutritional supplements, which can enhance their prognosis. It was anticipated that the diverse approaches, such as the use of oral nutritional supplements, enrichment of food/fluid, counseling on dietary habits, and educational interventions, would be able to alleviate the patients’ malnutrition [29]. Nevertheless, clinicians were supposed to balance the risk of delay in intervention to provide a period of pre-operative nutritional supplement to reduce risk associated with immediate surgery especially in complicated and malnourished TBAD subjects. Careful nutritional assessment and effective management were indispensable for patients with uncomplicated TBAD patients. Furthermore, it is important to maintain nutritional interventions even after being released from the hospital in order to ensure the restoration of a healthy nutritional condition.
This study is subject to several potential constraints. First, it is a retrospective, observational study in a single-center, and therefore subject to selection bias. Patients were consecutively recruited, and propensity score techniques were utilized to alleviate these biases. Second, the examination of the influence of nutritional status dynamics on unfavorable clinical occurrences throughout the monitoring period was not conducted. Third, the potential advantages of nutritional supplements on the clinical results of individuals with TBAD were not investigated. Future studies were expected to confirm our conclusion and establish detailed management strategies of malnutrition for TBAD patients.
In this study, the prevalence of malnutrition, assessed by CONUT score, is high in TBAD patients undergoing TEVAR and could have a significant impact on their early and follow-up results. Pre-operative nutritional assessment followed by prompt intervention and ongoing multidisciplinary care, may enhance the prognosis of patients.
TBAD, type B aortic dissection; TEVAR, thoracic endovascular aortic repair; CONUT, controlling nutritional status; SMI, skeletal muscle mass index; BMI, body mass index; LSA, left subclavian artery; LCCA, left common carotid artery; IPTW, inverse probability of treatment weighting.
The datasets used and/or analyzed during the current study are de-identified and available from the corresponding author on reasonable request.
TZ, SL, and WL designed the paper; YS, JL, JW, and FY performed the literature search; YL, WH, JLi, and JLuo collected the data; TZ, SL, and WL wrote the paper; YS, JL, JW, FY, YL, WH, JLi, and JLuo assisted in the revision of the manuscript. All authors read and approved the final manuscript. All authors have participated sufficiently in the work and agreed to be accountable for all aspects of the work.
This study was performed in accordance with the Declaration of Helsinki and approved by the ethics committee of the Guangdong Provincial People’s Hospital (#201807) and the need for informed consent was waived because of the retrospective nature of the analysis.
The authors thank Dr. Dong Yuan for technique help and language polishing.
Financial backing for the research, writing, and publication of this article was recognized by the authors, including the National Natural Science Foundation of China (82200519); Natural Science Foundation of Guangdong Province, China (2022A1515010897) and Medical Scientific Research Foundation of Guangdong Province, China (A2021348). The investigation’s structure, data gathering, analysis, and the interpretation of results were not influenced by the funding entities.
The authors declare no conflict of interest.
References
Publisher’s Note: IMR Press stays neutral with regard to jurisdictional claims in published maps and institutional affiliations.