


1 Department of Surgery, Hualien Tzu Chi Hospital, Buddhist Tzu Chi Medical Foundation, 97004 Hualien, Taiwan
2 School of Medicine, Tzu Chi University, 97004 Hualien, Taiwan
3 Division of Nephrology, Hualien Tzu Chi Hospital, Buddhist Tzu Chi Medical Foundation, 97004 Hualien, Taiwan
Abstract
Background: High soluble urokinase plasminogen activator receptor
(suPAR) levels are correlated with cardiovascular (CV) disease. Arterial
stiffness is associated with aging-related vascular diseases and is an
independent risk factor for CV morbidity and mortality. It can be measured by the
cardio-ankle vascular index (CAVI). We evaluated the association between serum
suPAR levels and arterial stiffness according to the CAVI in kidney
transplantation (KT) recipients. Methods: In this study, 82 patients
undergoing KT were enrolled. Serum suPAR levels were analyzed using an enzyme
immunoassay. The CAVI was measured using a plethysmograph waveform device, and
patients with a CAVI of
Keywords
- cardio-ankle vascular index
- kidney transplantation
- peripheral arterial stiffness
- soluble urokinase plasminogen activator receptor
Cardiovascular disease (CVD) remains one of the significant causes of mortality in kidney transplantation (KT) recipients with a functioning allograft. The preexisting risk factors for CVD in KT recipients are aggravated by post-transplantation immunosuppressive agents, obesity, diabetes mellitus, hypertension, and dyslipidemia [1]. Determining the estimated risk of CVD to identify KT recipients at risk of cardiovascular events is important to improve survival, and graft outcomes [2]. Arterial stiffness is a significant predictor of cardiovascular events, and several indices have been proposed to measure arterial stiffness, including the carotid-femoral pulse-wave velocity (PWV), brachial-ankle PWV, and cardio-ankle vascular index (CAVI) [3]. Among them, the CAVI is obtained automatically by wrapping pressure cuffs around the upper arms and lower legs, making it a noninvasive indicator of peripheral arterial stiffness (PAS) from the origin of the ascending aorta to the ankle [4]. The CAVI is clinically helpful in stratifying patients with atherosclerotic risk factors, and a higher risk of cardiovascular events was reported in patients with a higher CAVI [5, 6].
The soluble urokinase plasminogen activator receptor (suPAR), a key player in inflammation and fibrinolysis, has emerged as a predictive marker for CVD and atherosclerosis development [7, 8, 9]. Previous studies have established a link between suPAR levels and chronic kidney disease (CKD), with high suPAR levels robustly predicting all-cause and cardiovascular mortality in a large hemodialysis population in Italy [10, 11]. In a prospective study of KT recipients, suPAR levels significantly dropped after resolving the end-stage renal disease status. They were an early marker for allograft dysfunction during the follow-up period, highlighting its causal and prognostic role in CKD. Recently, the influence of suPAR on predicting cardiovascular events and mortality was investigated for the first time in KT recipients [12]. The study highlighted cardiovascular death as the leading cause of mortality, with patients exhibiting high suPAR levels having a quadrupled risk. Our research aims to elucidate the relationship between serum suPAR levels and PAS measured by the CAVI in KT recipients. This could establish suPAR as an innovative risk stratification biomarker and guide targeted interventions to prevent or mitigate the progression of arterial stiffness and CVD in post-KT care.
This cross-sectional study was conducted at a medical center in Hualien, Taiwan, recruiting 82 KT recipients between December 1, 2021 and June 30, 2022. Before participating, participants were briefed on the study’s purpose, were older than 18 years old, had a life expectancy of more than 6 months, had KT vintage of more than 6 months since KT, and obtained informed consent. The initial demographics, medication regimen, and relevant medical history were analyzed. Information on immunosuppressive agents, such as tacrolimus, cyclosporine, mycophenolate mofetil, rapamycin, and steroids, was collected through the patients’ medical records. The use of antihypertensive medications defined hypertension, while diabetes mellitus was recognized either through medical history or through the prescription of antidiabetic medications. Exclusion criteria specified individuals with a dialysis fistula or grafts, those with acute infections, acute rejection, malignancy, congestive heart failure (defined by the Framingham Diagnostic Criteria for Heart Failure) [13], and those who declined to consent to the research. The ethical oversight for this investigation was provided by the Hualien Tzu Chi Hospital Research Ethics Committee under the Buddhist Tzu Chi Medical Foundation (IRB108-219-A), ensuring compliance with the ethical guidelines outlined in the Declaration of Helsinki.
To calculate the body mass index (BMI), the formula used was the individual’s
weight in kilograms (kg) divided by their height in meters squared (m
After blood sampling, the patients were instructed to rest in the supine
position for 10 minutes within a calm environment where the temperature was
regulated. Blood pressure measurements were obtained using an automatic
oscillometric blood pressure monitor, recording systolic and diastolic pressures
three times at the right brachial artery. The CAVI value was assessed using a
previously outlined technique using the VaSera VS-1000 device (Fukuda Denshi Co.
Ltd., Tokyo, Japan) [16]. During the CAVI measurement, the participant remained
supine with the head aligned to the center, and cuffs were secured around both
the upper arms and ankles. Phonocardiography microphones and electrocardiography
electrodes were also used. VaSera VS-1000 was used to measure blood pressure and
pulse wave velocity, and the CAVI value was automatically calculated. Patients
with a CAVI value of
The distribution of the data was evaluated for normalcy using the
Kolmogorov-Smirnov test. Data following a normal distribution are depicted as
means
Table 1 shows the clinical characteristics of the 82 KT recipients included in
this study. Among them, 28 patients had diabetes mellitus, and 34 patients had
hypertension. Twenty patients (24.4%) were classified into the PAS group based
on the CAVI results. Significantly more patients in the PAS group were older
(p = 0.042). Furthermore, they exhibited higher serum triglyceride
(p = 0.023) and suPAR (p
| Characteristic | All participants (n = 82) | Normal CAVI group (n = 62) | High CAVI group (n = 20) | p-value |
| Age (years) | 56.00 (47.75–62.00) | 55.00 (42.75–62.00) | 61.00 (54.00–62.00) | 0.042* |
| KT vintage (months) | 89.90 |
91.43 |
98.07 |
0.592 |
| Height (cm) | 160.83 |
159.89 |
163.75 |
0.165 |
| Body weight (kg) | 66.65 |
67.45 |
64.15 |
0.413 |
| Body mass index (kg/m |
25.23 |
25.75 |
23.64 |
0.087 |
| Left CAVI | 7.30 |
6.24 |
10.62 |
|
| Right CAVI | 7.35 |
6.24 |
10.81 |
|
| Systolic blood pressure (mmHg) | 141.99 |
140.73 |
145.90 |
0.258 |
| Diastolic blood pressure (mmHg) | 83.17 |
83.55 |
82.00 |
0.599 |
| Total cholesterol (mg/dL) | 182.16 |
179.27 |
191.10 |
0.268 |
| Triglyceride (mg/dL) | 134.00 (98.75–196.00) | 122.00 (89.00–175.75) | 176.50 (120.25–228.25) | 0.023* |
| HDL-C (mg/dL) | 52.01 |
52.85 |
49.40 |
0.401 |
| LDL-C (mg/dL) | 101.20 |
98.48 |
109.60 |
0.131 |
| Fasting glucose (mg/dL) | 94.00 (87.75–109.25) | 94.00 (88.00–109.00) | 93.50 (87.00–126.50) | 0.983 |
| Blood urea nitrogen (mg/dL) | 25.50 (16.00–35.00) | 25.00 (16.00–33.25) | 26.50 (18.25–44.75) | 0.280 |
| Creatinine (mg/dL) | 1.36 (1.08–1.96) | 1.29 (1.02–1.72) | 1.68 (1.12–2.25) | 0.142 |
| eGFR (mL/min) | 53.17 |
55.31 |
46.55 |
0.180 |
| Total calcium (mg/dL) | 9.39 |
9.31 |
9.42 |
0.566 |
| Phosphorus (mg/dL) | 3.32 |
3.29 |
3.38 |
0.584 |
| iPTH (pg/mL) | 81.70 (50.40–150.60) | 85.75 (51.93–156.35) | 76.80 (33.85–122.38) | 0.578 |
| suPAR (pg/mL) | 58.50 (53.06–74.31) | 55.89 (51.39–65.75) | 89.46 (61.15–177.32) | |
| Female, n (%) | 40 (48.8) | 31 (50.0) | 9 (45.0) | 0.697 |
| Diabetes, n (%) | 28 (34.1) | 30 (32.3) | 8 (40.0) | 0.526 |
| Hypertension, n (%) | 34 (41.5) | 24 (38.7) | 10 (50.0) | 0.513 |
| Living donor, n (%) | 25 (30.5) | 19 (30.6) | 6 (30.0) | 0.957 |
| Steroid use, n (%) | 73 (89.0) | 55 (88.7) | 18 (90.0) | 0.872 |
| Cyclosporine use, n (%) | 8 (9.8) | 7 (11.3) | 1 (5.0) | 0.410 |
| Tacrolimus use, n (%) | 71 (86.6) | 52 (83.9) | 19 (95.0) | 0.204 |
| Mycophenolate mofetil use, n (%) | 67 (81.7) | 52 (83.9) | 15 (75.0) | 0.372 |
| Statin use, n (%) | 34 (41.5) | 28 (45.2) | 6 (30.0) | 0.231 |
| Fibrate use, n (%) | 19 (23.2) | 13 (21.0) | 6 (30.0) | 0.405 |
Values for continuous variables are shown as mean
After adjusting for factors that showed an association with PAS (i.e., age,
triglyceride, BMI, LDL-C, eGFR, and suPAR from Table 1; p
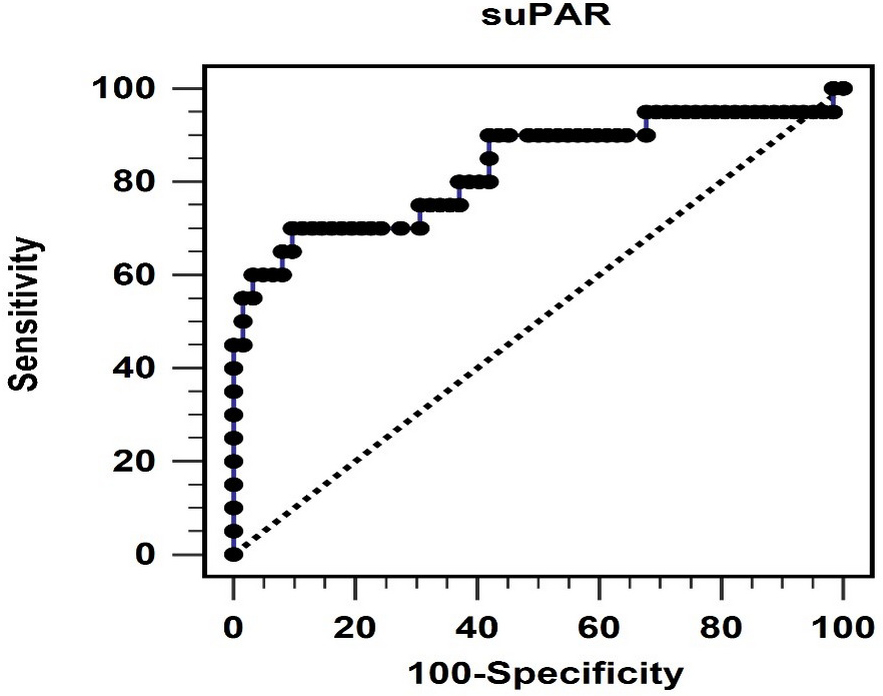 Fig. 1.
The area under the receiver operating characteristic curve indicates the diagnostic power of soluble urokinase-type plasminogen activator receptor levels for predicting peripheral arterial stiffness. suPAR, soluble urokinase-type plasminogen activator receptor.
| Variables | Odds ratio | 95% confidence interval | p-value |
| suPAR, 1 pg/mL | 1.072 | 1.023–1.123 | 0.004* |
| Age, 1 year | 1.098 | 0.996–1.209 | 0.060 |
| Triglyceride, 1 mg/dL | 1.009 | 0.997–1.020 | 0.130 |
| Body mass index, 1 kg/m |
0.801 | 0.635–1.010 | 0.060 |
| LDL-C, 1 mg/dL | 1.016 | 0.990–1.042 | 0.243 |
| eGFR, 1 mL/min | 1.000 | 0.972–1.028 | 0.977 |
Data was analyzed using the multivariate logistic regression analysis (adopted
factors: age, triglyceride, body mass index, LDL-C, eGFR, and suPAR). LDL-C,
low-density lipoprotein cholesterol; eGFR, estimated glomerular filtration rate;
suPAR, soluble urokinase-type plasminogen activator receptor. * p
Furthermore, we explored the correlation between log-suPAR, left CAVI, right
CAVI, and other variables using Spearman’s rank order correlation coefficient, as
shown in Table 3. Both the left and right CAVI values were positively associated
with log-suPAR (all p
| Variables | Left CAVI | Right CAVI | Log-suPAR (pg/mL) | |||
| Spearman’s coefficient of correlation | p-value | Spearman’s coefficient of correlation | p-value | Spearman’s coefficient of correlation | p-value | |
| Left CAVI | — | — | 0.898 | 0.659 | ||
| Right CAVI | 0.898 | — | — | 0.687 | ||
| Log-suPAR (pg/mL) | 0.659 | 0.687 | — | — | ||
| Log-Age (years) | 0.271 | 0.014* | 0.294 | 0.007* | 0.088 | 0.433 |
| KT vintage (months) | –0.016 | 0.888 | 0.002 | 0.988 | –0.211 | 0.058 |
| SBP (mmHg) | 0.150 | 0.180 | 0.153 | 0.170 | 0.217 | 0.050 |
| DBP (mmHg) | –0.027 | 0.807 | –0.015 | 0.894 | 0.123 | 0.270 |
| Total cholesterol (mg/dL) | 0.121 | 0.279 | 0.156 | 0.162 | 0.080 | 0.473 |
| Log-Triglyceride (mg/dL) | 0.228 | 0.040* | 0.236 | 0.033* | –0.235 | 0.033* |
| HDL-C (mg/dL) | –0.079 | 0.480 | –0.042 | 0.709 | –0.107 | 0.338 |
| LDL-C (mg/dL) | 0.181 | 0.104 | 0.130 | 0.245 | 0.039 | 0.731 |
| Log-Glucose (mg/dL) | 0.110 | 0.326 | 0.157 | 0.159 | 0.126 | 0.258 |
| eGFR (mL/min) | –0.150 | 0.179 | –0.084 | 0.451 | –0.129 | 0.433 |
| Total calcium (mg/dL) | 0.021 | 0.848 | 0.012 | 0.914 | –0.005 | 0.965 |
| Phosphorus (mg/dL) | –0.050 | 0.653 | –0.097 | 0.388 | –0.080 | 0.477 |
| Log-iPTH (pg/mL) | 0.018 | 0.870 | –0.009 | 0.933 | 0.066 | 0.558 |
Data on suPAR, age, triglyceride, glucose, and iPTH levels showed a skewed
distribution and were log-transformed before analysis. Data analysis was
performed using Spearman correlation analysis. KT, kidney transplantation; CAVI,
cardio-ankle vascular index; SBP, systolic blood pressure; DBP, diastolic blood
pressure; HDL-C, high-density lipoprotein cholesterol; LDL-C, low-density
lipoprotein cholesterol; eGFR, estimated glomerular filtration rate; suPAR,
soluble urokinase-type plasminogen activator receptor; iPTH, intact parathyroid
hormone. * p
Our study found that 24.4% of KT recipients exhibited PAS, as indicated by the CAVI results. These PAS recipients were significantly older and had higher serum TG and suPAR levels than the control group. Furthermore, we found that suPAR levels independently predicted PAS. Additionally, significant correlations were observed between log-suPAR, CAVI values, age, and TG levels, indicating their association with arterial stiffness.
Arterial stiffness reflects structural changes in the arterial wall associated with loss of elasticity and estimates the extent of atherosclerosis. It is considered a strong predictor of cardiovascular events and mortality and can be measured using the CAVI, which has demonstrated clinical efficacy [4, 5, 6]. For patients who have undergone KT, cardiovascular events significantly affect survival and graft outcomes [2]. Therefore, an available biomarker is required to detect and prevent atherosclerosis and CVD.
Age is associated with arterial stiffness in various groups of patients,
including those with hypertension, diabetes mellitus, and metabolic syndrome
[19]. Aging leads to changes in the elastin and collagen of the arteries and
rearrangements of the extracellular matrix architecture, contributing to altered
endothelial function and atherogenesis [20]. Yue et al. [21] found a
linear increase in CAVI values with age in both sexes among patients with
metabolic syndrome (p for trend
Dyslipidemia is a well-established risk factor for the development and progression of CVD [22]. Although whether lipid parameters act as pathogenic mediators or markers of atherosclerosis remains unclear, we found that KT patients with PAS had significantly higher TG levels. Studies have shown contradictory results on the association between high TG levels and arterial stiffness. Yue et al. [21] reported no association between high TG levels and PAS measured using the CAVI in the general Chinese population. However, a random population-based study demonstrated a significant and positive correlation between TG and the CAVI, independent of known confounding factors, such as age, sex, metabolic syndrome components, LDL-C, statin use, and smoking status [23]. Another retrospective cross-sectional study involving 23,537 healthy Japanese residents revealed a cutoff value of 93 mg/dL for TG to predict high CAVI values (AUC = 0.735) [24]. Several studies conducted in China also reported a positive correlation between TG and brachial-ankle PWV, another measurement of arterial stiffness [25, 26]. Our analysis also demonstrated a positive correlation between the CAVI and log-TG levels, indicating that higher log-TG levels were associated with PAS. Furthermore, we did not find a significant correlation between other lipid profiles (e.g., total cholesterol, HDL-C, and LDL-C) and PAS.
suPAR is a plasma glycoprotein implicated as an independent risk marker for CVD, playing a direct role in atherogenesis and neointimal lesion formation [27]. The South African study regarding the role of Sex, Age and Ethnicity on Insulin sensitivity and Cardiovascular function (SAfrEIC) study first investigated the role of suPAR in measuring arterial stiffness among different ethnicities [28]. Further studies have found a positive correlation between suPAR and aortic PWV in patients with chronic obstructive pulmonary disease and type I diabetes mellitus [29, 30]. These conditions are systemic inflammatory diseases associated with an increased risk of CVD. Furthermore, a strong association was observed between suPAR levels and carotid-femoral PWV in a multivariate linear regression analysis involving hemodialysis patients [15]. In our study, suPAR was the only significant predictor of PAS in KT patients after multivariate logistic regression analysis. This underscores the potential of suPAR as a critical biomarker in predicting vascular complications post-transplantation. We also observed a positive correlation between the CAVI and log-suPAR levels. Additionally, log-TG levels were negatively correlated with log-suPAR levels. Recent research by Haupt et al. [31] further explores this relationship, demonstrating a strong positive correlation between TG and suPAR levels across a general population. However, this correlation dissipated upon conducting multiple linear regression analysis, indicating that other underlying factors might influence the relationship between TG levels and suPAR [31].
suPAR is an innate immune activator in acute kidney injury (AKI) and chronic
kidney disease [32]. It interacts with integrins on podocytes, mediating the
renal filtration barrier function and providing a molecular foundation for
certain glomerular kidney diseases [7]. Hayek et al. [33] discovered
that elevated suPAR levels were linked to AKI and mortality within 90 days among
patients exposed to intra-arterial contrast for coronary angiography, those who
underwent cardiac surgery, and those admitted to intensive care unit (ICU) for critical illness. The
underlying mechanism involves suPAR sensitizing the kidney’s proximal tubules to
injury by modulating cellular bioenergetics and increasing oxidative stress,
leading to AKI [33]. In a broad, unselected hemodialysis cohort, a high suPAR
level was a predictor of all-cause mortality (hazard ratio [HR] = 1.91, 95% CI =
1.47–2.48, p
This study has several limitations. This was a single-center cross-sectional study with a small sample size. Enrolling more participants and conducting longitudinal studies with an extended follow-up period may help strengthen the causal relationship between serum suPAR levels and PAS during the evolution of CVD. Furthermore, the clinical application of suPAR levels and the appearance of CVD in KT recipients require further investigation. Such studies may improve our understanding of the potential implications for clinical practice and guide the development of preventive and therapeutic strategies.
In conclusion, KT patients with PAS were significantly older and exhibited higher serum suPAR and TG levels. Serum suPAR levels are positively associated with left or right CAVI values and are independently associated with PAS in KT recipients. These insights pave the way for improved risk stratification and management strategies for KT recipients at risk of PAS, aiming to prevent cardiovascular events.
The data presented in this study are available on request from the corresponding author.
HHY, YCC, CCH, and BGH conceived and designed the experiments. YCC, CCH, and BGH performed the experiments. HHY, YCC, and BGH contributed reagents and analyzed the data. HHY wrote the original draft preparation. YCC, CCH, and BGH reviewed and edited the manuscript. All authors read and approved the final manuscript. All authors have participated sufficiently in the work and agreed to be accountable for all aspects of the work.
The research protocol was approved by the human research ethics committee of the Hualien Tzu Chi Hospital, Buddhist Tzu Chi Medical Foundation (approval ID: IRB108-219-A). Informed consent was obtained from the patient’s guardian(s). The study was performed in accordance with the Declaration of Helsinki.
We are grateful to all participating patients for their cooperation and willingness.
This research was funded by Hualien Tzu Chi Hospital, Buddhist Tzu Chi Medical Foundation, Hualien, Taiwan, grant number TCRD111-070 and TCMF-A 111-02.
The authors declare no conflict of interest. Bang-Gee Hsu is serving as Guest Editor of this journal. We declare that Bang-Gee Hsu had no involvement in the peer review of this article and has no access to information regarding its peer review. Full responsibility for the editorial process for this article was delegated to Dimitris Tousoulis.
References
Publisher’s Note: IMR Press stays neutral with regard to jurisdictional claims in published maps and institutional affiliations.