


 , Niansang Luo 2,*
1 Department of Cardiology, The Eighth Affiliated Hospital of Sun Yat-sen University, 518000 Shenzhen, Guangdong, China
2 Department of Cardiology, Sun Yat-sen Memorial Hospital, 510000 Guangzhou, Guangdong, China
3 Department of Cardiology, The Seventh Affiliated Hospital of Sun Yat-Sen University, 518107 Shenzhen, Guangdong, China
†These authors contributed equally.
Abstract
Peripheral arterial calcification is a prevalent condition in patients with type 2 diabetes mellitus (T2DM), resulting in lower-limb amputation and reduced life quality. Non-alcoholic fatty liver disease (NAFLD), which can be simply evaluated using the fatty liver index (FLI), is closely associated with T2DM development. In this study, we aimed to explore the relationship between FLI and lower limb arterial calcification (LLAC) in T2DM patients and to reveal the value of T2DM patients with NAFLD in predicting the occurrence of LLAC.
A total of 77 T2DM patients with LLAC who underwent comprehensive physical and health examinations, serological examinations, as well as lower limb computed tomography imaging at Sun Yat-sen Memorial Hospital of Sun Yat-sen University between January 2018 and January 2019 were enrolled in this study. The FLI was calculated using body mass index, waist circumference, triglycerides, and γ-glutamyl transferase. Additionally, LLAC was evaluated using computed tomography with the Agatston scoring algorithm. The patients were divided into three groups based on their FLI values: Non-liver disease group (FLI <30, n = 29), borderline-liver disease group (30 ≤ FLI < 60, n = 32), and NAFLD group (FLI ≥60, n = 16). Univariate and multivariate binary logistic regression analyses were employed to investigate the association between FLI and LLAC in T2DM patients. Furthermore, differences in LLAC among groups were analyzed using post-hoc multiple comparisons and ordinal logistic regression model analysis.
Univariate and multivariate analyses showed that age and FLI influenced LLAC severity in T2DM patients. Moreover, T2DM patients in the NAFLD group had significantly lower LLAC scores than those in the Non-liver disease group. The correlation analysis showed that FLI was negatively associated with LLAC scores (R = –0.31, p = 0.006), while age was positively associated (R = 0.361, p = 0.001).
Our study revealed an inverse relationship between FLI and the degree of LLAC. This indicates that, based on evidence in the current research, NAFLD may not be reliable as a predictor of LLAC in T2DM patients.
Keywords
- type 2 diabetes mellitus
- fatty liver index
- lower limb arterial calcification
- non-alcoholic fatty liver disease
- peripheral arterial disease
Type 2 diabetes mellitus (T2DM) is a complex metabolic disorder defined by dysregulated glucose and lipid metabolism [1]. Peripheral artery disease (PAD) is a manifestation of systemic atherosclerosis, particularly prevalent in patients with T2DM. Studies have shown that PAD is an important influencing factor for the increased morbidity and mortality of cardiovascular disease in this patient population [2, 3]. Lower limb arterial calcification (LLAC) is common in patients with PAD, whereby it is associated with the severity of PAD symptoms and independently associated with increased amputation rates and mortality, which greatly affects the quality of life of this population [4, 5]. Therefore, it is imperative to identify and intervene in the associated risk factors of arterial calcification to enhance the prognosis of patients with T2DM [6].
Epidemiological studies have demonstrated a significant overlap in common risk factors between non-alcoholic fatty liver disease (NAFLD) and diabetes mellitus, with NAFLD being identified as a prevalent complication of T2DM [7, 8, 9]. Existing studies have shown that NAFLD is significantly associated with an increased risk of cardiovascular events in patients with T2DM. Specifically, it is an independent risk factor for other cardiovascular and metabolic indicators such as atherosclerosis and insulin resistance [10, 11]. Furthermore, the histological severity of NAFLD is widely recognized as a surrogate marker of subclinical atherosclerosis. Studies have shown a significant association between the severity of NAFLD and arterial stiffness and endothelial dysfunction [12, 13].
However, the existing literature does not definitively establish the association between NAFLD and LLAC in individuals with T2DM. Consequently, there is a gap in the current research addressing the potential correlation between NAFLD and LLAC in this patient population. To bridge this gap and improve clinical diagnosis and treatment, utilizing the fatty liver index (FLI) as a reliable marker for identifying NAFLD in patients with T2DM is critical. By calculating the patient’s FLI, healthcare providers can effectively and efficiently diagnose the presence of NAFLD, streamlining the diagnostic process for better patient care [14, 15]. In this study, we investigated the correlation between FLI and LLAC in T2DM patients to reveal the predictive value of NAFLD for the occurrence and development of LLAC in T2DM.
This was a retrospective, observational, single-center study between January
2018 and January 2019. T2DM patients with suspiciously symptomatic lower limb PAD
were enrolled in this study. These patients underwent comprehensive physical and
health examinations, including age, gender, height, body weight, waist circumference (WC), smoking
status, history of hypertension, coronary heart disease (CHD), stroke,
diabetes-related foot disease, duration of T2DM, and anti-diabetic drugs at the
time of admission. Body mass index (BMI) = body weight (kg)/height2 (m2). Hypertension
was defined as three documented office systolic blood pressure (SBP) readings
Blood samples were collected after a minimum 8 h overnight fast. Serum fasting
plasma glucose (FPG), hemoglobin A1c (HbA1c), total cholesterol (TC), triglycerides (TG),
high-density lipoprotein cholesterol (HDL-C), low-density lipoprotein cholesterol
(LDL-C), albumin, uric acid (UA), phosphorus, calcium, alanine aminotransferase
(ALT), aspartate aminotransferase (AST),
Using standard clinical protocols, patients underwent lower limb computed tomography (CT) imaging on a 64-slice CT scanner (Siemens Somatom Definition AS, Munich, Germany). Image analysis was performed on an Apple Macintosh computer (Apple Inc, Cupertino, CA, USA) using the open-source DICOM viewer (v4, OsiriX Imaging Software, Pixeo SARL, Bern, Switzerland). Using the freely available ‘Calcium Scoring’ plug-in, vascular calcification (based on an attenuation threshold of 130 Hounsfield Units in 3 contiguous voxels, after the method of Agatston) was analyzed on consecutive transaxial slices along the length of the arterial segment, as previously described [20, 21].
For this study, the lower limb arterial tree was defined as from the infrarenal aorta to the ankle in both legs, divided into three anatomical segments: The aortoiliac segment (lowermost renal artery to the distal aspect of the iliac artery), the femoropopliteal segment (common femoral artery to the below knee popliteal artery), and the crural segment (the tibiofibular artery trunk and individual crural vessels down to the ankle joint). The total LLAC score for each patient consisted of the sum of the LLAC score of both legs. Individual leg LLAC scores comprised the sum of the aortoiliac, femoropopliteal, and crural segmental LLAC scores [20].
Continuous variables with a normal distribution were reported as the mean
Demographic characteristics, history of the disease, and biochemical and
medication data of the enrolled T2DM patients are shown in Table 1. The mean age
was 68.7
| Variable | Patients (n = 77) | |
| Demographic characteristics | ||
| Age (y) | 68.7 | |
| Male/Female | 57/20 | |
| BMI (kg/m2) | 23.3 | |
| WC (cm) | 90.2 | |
| SBP (mmHg) | 143.2 | |
| DBP (mmHg) | 75.7 | |
| Hypertension (n, %) | 54 (70.1%) | |
| CHD (n, %) | 19 (24.7%) | |
| Stroke (n, %) | 15 (19.5%) | |
| Diabetes-related foot disease (n, %) | 47 (61.0%) | |
| Smoking (n, %) | 37 (48.1%) | |
| Duration of T2DM (year) | 10.0 (6.0–14.5) | |
| LLAC score | 997.0 (146.5–6530.0) | |
| Biochemical characteristics | ||
| Calcium (mmol/L) | 2.23 | |
| Phosphorus (mmol/L) | 1.14 | |
| Creatinine (µmol/L) | 109.81 | |
| eGFR (mL/min·1.73 m2) | 61.35 | |
| BUN (mmol/L) | 6.64 | |
| UA (µmol/L) | 388.22 | |
| FPG (mmol/L) | 7.00 | |
| HbA1c (%) | 8.51 | |
| Albumin (g/L) | 36.35 | |
| HDL-C (mmol/L) | 1.01 | |
| LDL-C (mmol/L) | 2.76 | |
| TG (mmol/L) | 1.39 (0.96–2.01) | |
| TC (mmol/L) | 4.50 | |
| AST (U/L) | 18.00 (14.50–22.50) | |
| ALT (U/L) | 17.00 (11.00–23.50) | |
| GGT (U/L) | 32.00 (19.50–52.50) | |
| hs-CRP (mg/L) | 10.49 (2.71–38.57) | |
| SOD (U/mL) | 110.60 | |
| TyG index | 8.89 | |
| FLI | 35.59 (23.15–49.86) | |
| Medications | ||
| Metformin (n, %) | 43 (55.8%) | |
| Sulfonylureas (n, %) | 38 (49.4%) | |
| Acarbose (n, %) | 22 (28.6%) | |
| Insulin (n, %) | 52 (67.5%) | |
Values are presented as the mean
Based on the FLI values, we divided the T2DM patients into three groups:
Non-liver disease group (FLI
| Variable | Non-liver disease group (n = 29) | Borderline-liver disease group (n = 32) | NAFLD group (n = 16) | p-value | |
| Demographic characteristics | |||||
| Age (year) | 71.9 |
68.9 |
62.5 |
0.006 | |
| Male/Female | 19/10 | 26/6 | 12/4 | 0.382 | |
| BMI (kg/m2) | 21.6 |
23.1 |
26.6 |
||
| WC (cm) | 87.9 |
92.5 |
89.6 |
0.018 | |
| SBP (mmHg) | 145.4 |
140.4 |
145.0 |
0.694 | |
| DBP (mmHg) | 73.5 |
73.2 |
84.9 |
0.001 | |
| Smoking (n, %) | 13 (44.8%) | 16 (50.0%) | 8 (50.0%) | 0.911 | |
| Hypertension (n, %) | 21 (72.4%) | 20 (62.5%) | 13 (81.3%) | 0.391 | |
| CHD (n, %) | 10 (34.5%) | 6 (18.8%) | 3 (18.8%) | 0.311 | |
| Stroke (n, %) | 4 (13.8%) | 6 (18.8%) | 5 (31.3%) | 0.372 | |
| Diabetes-related foot disease (n, %) | 23 (79.3%) | 19 (59.4%) | 5 (31.3%) | 0.007 | |
| Duration of DM (year) | 11.0 (9.0–15.5) | 10.0 (3.3–15) | 10.0 (5–11.8) | 0.331 | |
| LLAC score | 2024.0 (481.5–7317.5) | 989.0 (189.3–8168.0) | 270.0 (3.3–1020.3)* | 0.022 | |
| Biochemical characteristics | |||||
| Calcium (mmol/L) | 2.21 |
2.22 |
2.27 |
0.368 | |
| Phosphorus (mmol/L) | 1.15 |
1.13 |
1.13 |
0.847 | |
| Creatinine (µmol/L) | 97.00 (80.50–139.00) | 107.00 (87.00–124.25) | 104.50 (90.75–151.00) | 0.492 | |
| eGFR (mL/min·1.73 m2) | 59.88 |
63.60 |
59.59 |
0.651 | |
| BUN (mmol/L) | 7.06 |
6.06 |
7.02 |
0.313 | |
| UA (µmol/L) | 403.41 |
385.22 |
366.69 |
0.540 | |
| FPG (mmol/L) | 5.30 (4.20–8.45) | 6.15 (4.98–7.57) | 7.00 (5.53–8.65) | 0.090 | |
| HbA1c (%) | 8.06 |
8.80 |
8.76 |
0.317 | |
| Albumin (g/L) | 35.73 |
35.63 |
38.91 |
0.058 | |
| HDL-C (mmol/L) | 1.06 |
1.00 |
0.98 |
0.486 | |
| LDL-C (mmol/L) | 2.64 |
2.69 |
3.12 |
0.141 | |
| TG (mmol/L) | 0.97 (0.81–1.17) | 1.54 (1.12–1.86)* | 2.78 (1.92–4.95)*# | ||
| TC (mmol/L) | 4.17 |
4.37 |
5.36 |
0.003 | |
| AST (U/L) | 17.00 (13.50–22.00) | 18.50 (14.00–24.25) | 20.50 (16.00–23.00) | 0.559 | |
| ALT (U/L) | 12.00 (9.50–24.00) | 16.00 (10.00–21.00) | 21.00 (190.0–26.75)* | 0.038 | |
| GGT (U/L) | 26.00 (16.50–32.00) | 37.00 (21.25–58.50)* | 46.50 (33.25–87.25)* | 0.001 | |
| hs-CRP (mg/L) | 16.43 (3.99–91.60) | 14.98 (2.32–65.25) | 5.85 (2.85–15.97) | 0.288 | |
| SOD (U/mL) | 102.41 |
109.91 |
126.81 |
0.003 | |
| TyG index | 8.34 |
8.86 |
9.89 |
||
| FLI | 19.01 |
40.48 |
71.09 |
||
| Medications | |||||
| Metformin (n, %) | 16 (55.2%) | 18 (56.3%) | 9 (56.3%) | 0.996 | |
| Sulfonylureas (n, %) | 17 (53.1%) | 12 (41.4%) | 9 (56.3%) | 0.577 | |
| Acarbose (n, %) | 7 (24.1%) | 9 (28.1%) | 6 (37.5%) | 0.351 | |
| Insulin (n, %) | 20 (69.0%) | 21 (65.6%) | 11 (68.8%) | 0.955 | |
Values are presented as the mean
To explore the potential risk factors of LLAC. We divided the T2DM patients into
two groups based on the median LLAC of all the patients: slight calcification
(LLAC
| Variable | Slight calcification group (n = 38) | Severe calcification group (n = 39) | p-value | |
| Population characteristics | ||||
| Age | 65.4 |
72.0 |
0.002 | |
| Male/Female | 30/8 | 27/12 | 0.275 | |
| BMI (kg/m2) | 23.7 |
22.8 |
0.266 | |
| WC (cm) | 90.8 |
89.5 |
0.398 | |
| SBP (mmHg) | 139.5 |
146.9 |
0.185 | |
| DBP (mmHg) | 76.0 |
75.4 |
0.841 | |
| History | ||||
| Hypertension (n, %) | 25 (65.8%) | 29 (74.4%) | 0.752 | |
| CHD (n, %) | 5 (13.2%) | 14 (35.9%) | 0.015 | |
| Stroke (n, %) | 8 (21.1%) | 7 (17.9%) | 0.421 | |
| Diabetes-related foot disease (n, %) | 20 (52.6%) | 27 (69.2%) | 0.192 | |
| Smoking (n, %) | 19 (50.0%) | 18 (46.2%) | 0.734 | |
| Duration of DM (year) | 10.0 (3.0–12.5) | 10.0 (6.0–17.0) | 0.121 | |
| Biochemical characteristics | ||||
| Calcium (mmol/L) | 2.23 |
2.22 |
0.891 | |
| Phosphorus (mmol/L) | 1.14 |
1.13 |
0.841 | |
| Creatinine (µmol/L) | 116.45 |
103.33 |
0.090 | |
| eGFR (mL/min·1.73 m2) | 59.44 |
63.21 |
0.366 | |
| BUN (mmol/L) | 6.85 |
6.43 |
0.508 | |
| UA (µmol/L) | 387.18 |
389.23 |
0.934 | |
| FPG (mmol/L) | 5.95 (5.12–7.60) | 5. 5 (5.12–7.60) | 0.614 | |
| HbA1c (%) | 8.80 |
8.23 |
0.220 | |
| Albumin (g/L) | 35.52 |
37.16 |
0.141 | |
| HDL-C (mmol/L) | 0.95 |
1.09 |
0.010 | |
| LDL-C (mmol/L) | 2.70 |
2.82 |
0.532 | |
| TG (mmol/L) | 1.73 (1.18–2.13) | 1.08 (0.80–1.62) | 0.002 | |
| TC (mmol/L) | 4.47 |
4.54 |
0.804 | |
| AST (U/L) | 20.00 (14.00–23.75) | 18.00 (15.00–22.00) | 0.544 | |
| ALT (U/L) | 20.00 (12.50–25.50) | 12.00 (10.00–22.00) | 0.047 | |
| GGT (U/L) | 34.50 (23.25–52.50) | 29.00 (17.00–53.00) | 0.527 | |
| hs-CRP (mg/L) | 23.72 (2.44–51.66) | 9.44 (2.89–35.77) | 0.333 | |
| SOD (U/mL) | 108.29 |
112.85 |
0.406 | |
| TyG index | 9.03 |
8.74 |
0.122 | |
| FLI | 44.00 |
33.65 |
0.027 | |
| Medications | ||||
| Metformin (n, %) | 23 (60.5%) | 28 (71.8%) | 0.341 | |
| Insulin (n, %) | 24 (63.1%) | 28 (71.8%) | 0.472 | |
Values are presented as the mean
As shown in Fig. 1, the LLAC scores of T2DM patients in the NAFLD group were
significantly lower than those in the non-liver disease group (270.0 (3.3,
1020.3) vs. 2024.0 (481.5–7317.5); p = 0.018). We further defined the
variables (age, BMI, smoking, SBP, HbA1c, ALT, TG, TyG index, and FLI) and
grouped the patients into two groups: Age (
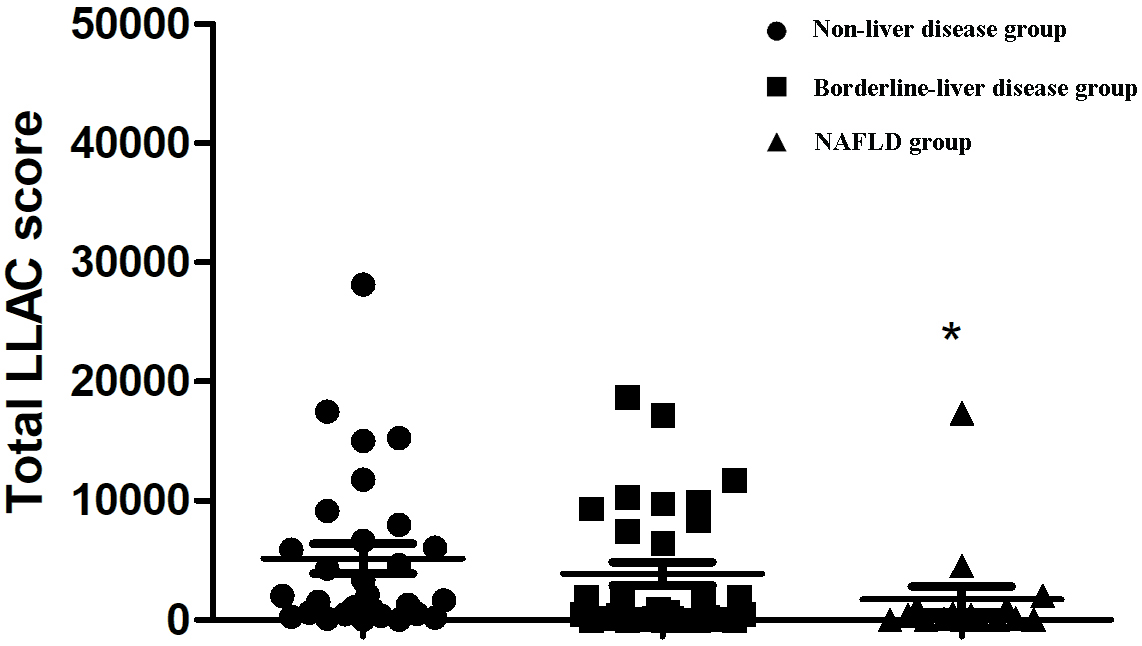 Fig. 1.
Comparison of LLAC scores among different groups defined by
FLI. FLI, fatty liver index; LLAC, lower limb arterial calcification; NAFLD,
non-alcoholic fatty liver disease. *p
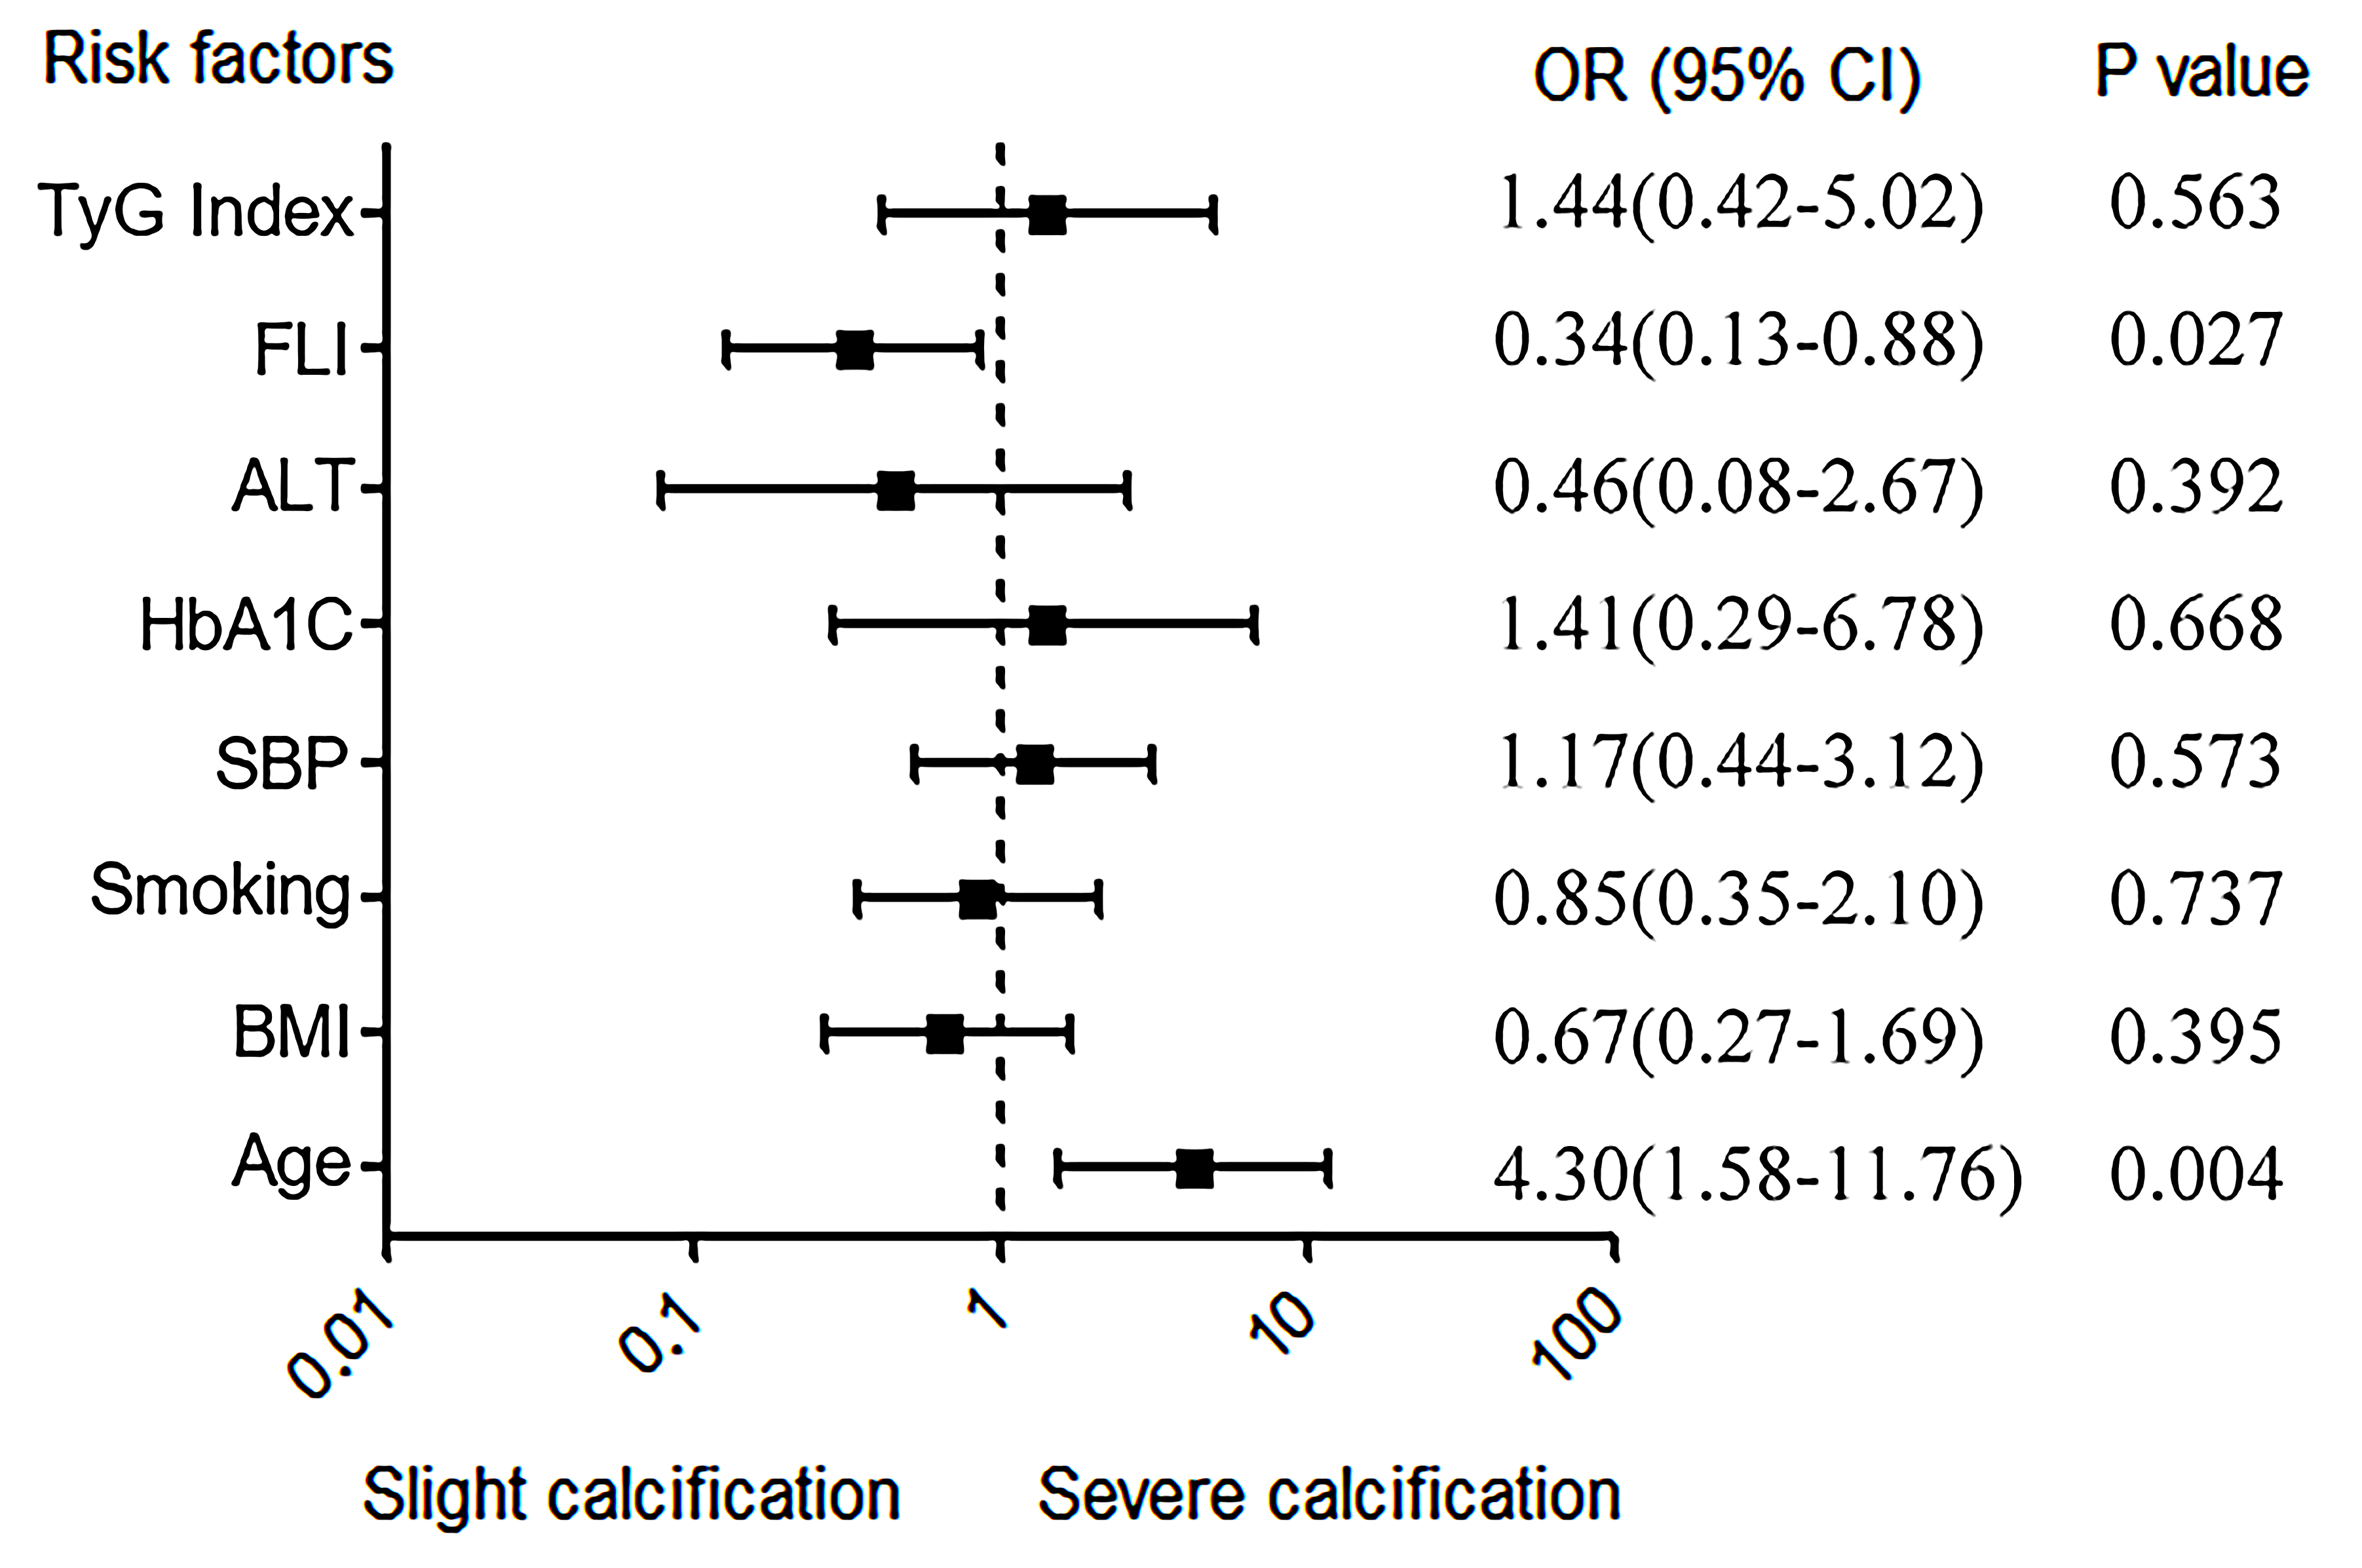 Fig. 2.
Independent risk factors for LLAC. ALT, alanine aminotransferase; BMI, body mass index; HbA1c, hemoglobin A1c; FLI, fatty liver index; LLAC, lower limb arterial calcification; SBP, systolic blood pressure; TyG index, triglyceride and glucose index; OR, odds ratio.
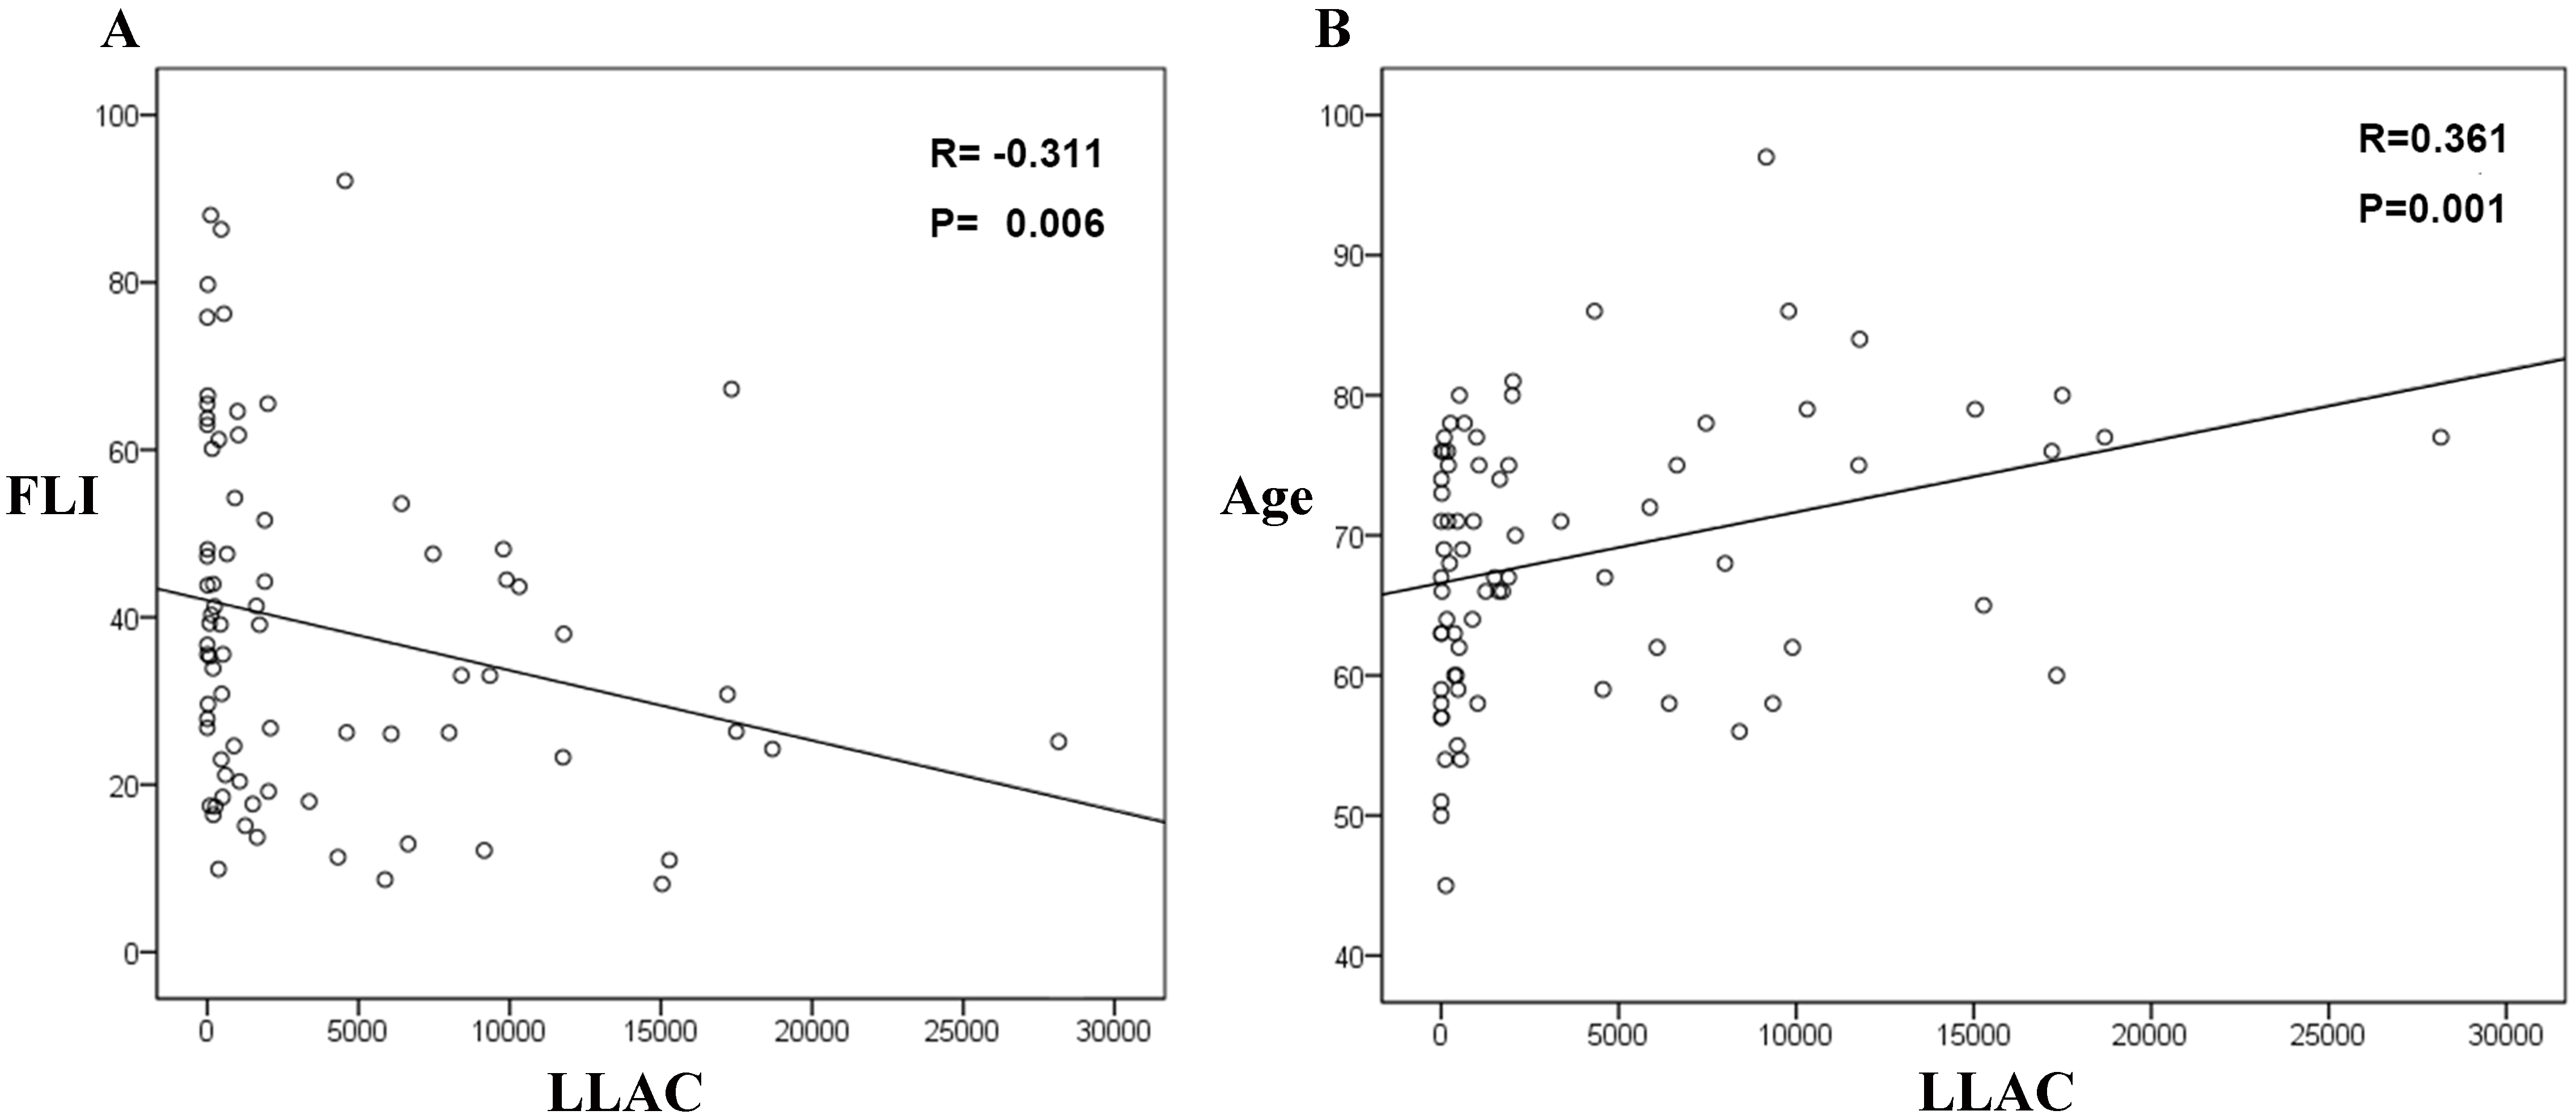 Fig. 3.
The associations between LLAC and FLI (A) and age (B). FLI, fatty liver index; LLAC, lower limb arterial calcification.
NAFLD is recognized as a well-established risk factor for cardiovascular events and can be easily and accurately diagnosed by calculating FLI. This study delved into the relationship between FLI and LLAC in T2DM patients, and the findings indicated a negative correlation between FLI levels and LLAC. Moreover, even after controlling for demographic characteristics, previous disease history, blood biochemical indicators, metformin, and insulin history, FLI remained an independent influence factor for the progression of LLAC. Nevertheless, the existing evidence does not yet support that NAFLD predicts the occurrence and progression of LLAC in T2DM patients.
Owing to the shifts in the dietary habits and lifestyles of individuals, NAFLD
has emerged as a prevalent global chronic liver condition [22]. Previous studies
have confirmed that NAFLD is strongly related to T2DM and metabolic syndrome and
is associated with future cardiovascular disease in T2DM patients [7, 8, 9, 23, 24, 25]. A
study by Ciardullo et al. [26] showed that all-cause mortality and
cardiovascular mortality were significantly elevated among patients with PAD,
irrespective of whether they were comorbid with T2DM. However, the relationship
between NAFLD and PAD remains a topic of debate among experts in the field. Zou
et al. [27] demonstrated that individuals with both T2DM and NAFLD
exhibited a higher prevalence of PAD, characterized by an ankle–brachial index
(ABI)
Insulin resistance is a major characteristic of T2DM [35]. Recent research has highlighted the TyG index as a dependable indicator of insulin resistance, with its elevated levels being linked independently to coronary calcification [36]. Our study did not find any association between the TyG index and LLAC. However, we demonstrated that in T2DM patients with high FLI was significantly associated with an increased TyG index. It suggested that NAFLD was significantly associated with insulin resistance in T2DM, consistent with previous data [37, 38]. Moreover, oxidative stress [39] and inflammation [40] are possible mechanisms for LLAC. However, in our study, the levels of hs-CRP were not significantly different among the FLI groups. Regarding the SOD levels, we found high levels of SOD in the high-risk FLI group, although this is contradictory for the patients in this group that have less LLAC. It may attribute to the age factor, whereby the younger individuals in the high FLI group counteract the bad effect of SOD on the vessels. Additionally, we found that T2DM patients with potential NAFLD tended to be younger, which seems to be counterintuitive. However, Forlani et al. [41] presented the same conclusion in a cross-sectional study with a much larger sample size. A plausible explanation is that younger people tend to have more unhealthy living habits than older people, such as staying up all night and having a casual approach to diet [42].
This study has certain limitations. Firstly, it is important to note that this research is a single-center cross-sectional study, which may only partially capture the long-term changes and dynamic processes of the population under study. Secondly, since T2DM patients seldom completed the lower limb CT for renal dysfunction or economic reasons (most of them underwent ultrasonography measurement to evaluate lower limb artery), the number of patients we enrolled in this study was relatively small. Thirdly, we used the FLI score to define NAFLD, a diagnostic method lacking liver histological or imagological evidence. Lastly, the LLAC score, which specifically quantifies the calcified portion of atherosclerotic plaques, fails to capture the full extent of the plaque burden due to its exclusion of soft plaques.
Our study revealed an inverse relationship between FLI and the degree of LLAC. This implies that NAFLD may not be reliable as a predictor of LLAC in T2DM patients. The potential relationship demonstrated in this study warrants further corroboration through multi-center trials and prospective studies with larger sample sizes.
The data underlying this article will be shared upon reasonable request to the corresponding author.
PBM: Writing - original draft, Writing - review & editing, Conceptualization, Formal analysis, Investigation; QLL: Writing - original draft, Writing - review & editing, Data curation, Formal analysis, Methodology, Resources; SJL: Writing - review & editing, Investigation, Methodology, Validation, Visualization, Software; CHW: Writing - original draft, Formal analysis, Methodology, Resources; SWX: Writing - original draft, Data curation, Formal analysis, Investigation, Validation; KZ: Conceptualization, Funding acquisition, Project administration, Writing - review & editing; NSL: Conceptualization, Project administration, Resources, Supervision, Visualization, Writing - review & editing. All authors contributed to editorial changes in the manuscript. All authors read and approved the final manuscript. All authors have participated sufficiently in the work and agreed to be accountable for all aspects of the work.
This study was approved by the Ethics Committee of Sun Yat-sen Memorial Hospital (ethics approval number: SYSKY-2024-778-01). All patients or their families/legal guardians gave their written informed consent before they participated in the study.
We would like to acknowledge Dr. Huanji Zhang for his expertise and help in editing the manuscript. Also, we would like to thank the Connecting Researchers for their input.
This work was supported in part by National Natural Science Foundation of China (NSFC) [81600351] to Kun Zhang.
The authors declare no conflict of interest.
References
Publisher’s Note: IMR Press stays neutral with regard to jurisdictional claims in published maps and institutional affiliations.