


1 Cardiac Arrhythmia Center, State Key Laboratory of Cardiovascular Disease, Fuwai Hospital, National Center for Cardiovascular Diseases, Chinese Academy of Medical Sciences & Peking Union Medical College, 100037 Beijing, China
Abstract
Background: Previous studies have failed to implement risk
stratification in patients with heart failure (HF) who are eligible for secondary
implantable cardioverter-defibrillator (ICD) implantation. We aimed to evaluate
whether machine learning-based phenomapping using routinely available clinical
data can identify subgroups that differ in characteristics and prognoses.
Methods: A total of 389 patients with chronic HF implanted with an ICD
were included, and forty-four baseline variables were collected. Phenomapping was
performed using hierarchical k-means clustering based on factor analysis of mixed
data (FAMD). The utility of phenomapping was validated by comparing the baseline
features and outcomes of the first appropriate shock and all-cause death among
the phenogroups. Results: During a median follow-up of 2.7 years for
device interrogation and 5.1 years for survival status, 142 (36.5%) first
appropriate shocks and 113 (29.0%) all-cause deaths occurred. The first 12
principal components extracted using the FAMD, explaining 60.5% of the total
variability, were left for phenomapping. Three mutually exclusive phenogroups
were identified. Phenogroup 1 comprised the oldest patients with ischemic
cardiomyopathy; had the highest proportion of diabetes mellitus, hypertension,
and hyperlipidemia; and had the most favorable cardiac structure and function
among the phenogroups. Phenogroup 2 included the youngest patients, mostly those
with non-ischemic cardiomyopathy, who had intermediate heart dimensions and
function, and the fewest comorbidities. Phenogroup 3 had the worst HF
progression. Kaplan–Meier curves revealed significant differences in the first
appropriate shock (p = 0.002) and all-cause death (p
Keywords
- heart failure
- implantable cardioverter-defibrillator
- secondary prevention
- machine learning-based phenomapping
- the first appropriate shock
- all-cause death
Evidence-based clinical guidelines recommend implantable cardioverter-defibrillator (ICD) for primary and secondary prevention of ventricular arrhythmias (VA) and sudden cardiac death (SCD) [1, 2]. In fact, most primary prevention ICD recipients derive no benefit in the subsequent follow-up [3, 4, 5]. Therefore, previous studies have focused on identifying risk factors, constructing risk assessment tools, and finding new parameters and modalities to facilitate risk stratification in these patients [4, 6, 7, 8]. In contrast, the benefit of ICD therapy in secondary prevention is more certain due to the established substrate for VA [9]. Consequently, little attention has been paid to secondary prophylactic ICD implantations. Risk stratification in these patients is imperative to understand the heterogeneity of disease development, progression, and prognosis [10].
Despite efforts being made, previous studies could not predict VA recurrence in patients undergoing secondary prevention [11, 12]. The individual risk of VA recurrence is high, irrespective of other factors [13]. Thus, in this circumstance, instead of identifying underlying risk factors, segregating patients into different subgroups based on their similarities, called phenomapping, might provide a more feasible solution [14]. In theory, patients within a phenogroup share similar baseline features and long-term prognoses, whereas patients within different phenogroups differ in these aspects. Through phenomapping, personalized treatment and management, including programming settings, medication optimization, and VA ablation, can be refined.
This study aimed to first classify patients into different phenogroups using unsupervised machine learning clustering based on principal component analysis and then validate the clinical utility of phenogroups by comparing the baseline characteristics and outcomes (including all-cause death and the first appropriate shock) among the established phenogroups.
We retrospectively included all patients with heart failure (HF) who underwent secondary prophylactic single- or dual-chamber ICD implantation at our center between January 2010 and December 2020 (n = 756). The exclusion criteria were as follows: patients with cardiac channelopathies, hypertrophic cardiomyopathy, and congenital heart disease (n = 132); patients with heart failure with preserved ejection fraction (n = 172); and patients without visit after ICD implantation (n = 63). The study was performed in accordance with the Declaration of Helsinki and approved by the Fuwai Hospital. In addition, written informed consent was obtained from all the patients.
All-cause of death and first appropriate ICD shock on a VA event were primary outcomes. Patient survival status was obtained from medical records, death certificates, or phone contact with their family members. Additionally, ICD discharge information was extracted using device interrogation. The patients were required to have planned interrogation at least yearly and unplanned interrogation after sensible device therapy. The ICD programming settings were at the discretion of the treating physicians. No standard protocols were requested; nonetheless, shock therapies were generally set to be delivered after ATP could not terminate the VA events. Patients were censored at the time of their successful VA ablation, and patient survival was further ascertained after their last device interrogations.
Forty-four baseline variables, including demographics, physical examination,
cardiovascular risk factors, laboratory tests, electrocardiogram,
echocardiographic parameters, comorbidities, and medications, were collected. All
the variables had a missing rate of
To determine the natural intrinsic connection within ICD recipients, all baseline characteristics, excluding the medications (thirty-four variables in total), were used for phenomapping. Hierarchical k-means clustering was chosen for phenotypic clustering [15, 16], which includes the two most widely used unsupervised machine learning algorithms: hierarchical clustering and k-means clustering. Hierarchical clustering was first computed to determine the optimal number of clusters and their respective centroids. Subsequently, k-means clustering was performed using these centroids as the initial cluster centers. Both steps combined to make the clustering results more reliable and robust. Therefore, this is also called k-means-consolidated hierarchical clustering. It has been successfully applied in clustering patients with dilated cardiomyopathy [17].
Specifically, in this study, as it is not directly applicable to mixed data
types (continuous and categorical), the factor analysis of mixed data (FAMD) was
a preliminary step to clustering [15, 16]. To obliterate redundant information
contained in the raw variables, only principal components extracted using the
FAMD with eigenvalues
The representative variables in each cluster were analyzed using the v test based on the hypergeometric distribution. Briefly, a positive v-test statistic indicates the overrepresentation of a variable, whereas a negative statistic indicates the underrepresentation of a variable. The baseline characteristics and clinical outcomes of the phenogroups were compared to validate the clinical utility of phenomapping.
Continuous data were expressed as mean
A total of 389 patients with HF with reduced or mildly reduced ejection fraction
were identified. Table 1 summarizes the baseline characteristics of the study
population during the ICD implantation. The mean age was 60.5
| Characteristics | All patients (n = 389) | Phenogroup 1 (n = 163) | Phenogroup 2 (n = 148) | Phenogroup 3 (n = 78) | p for overall | |
|---|---|---|---|---|---|---|
| Demographics | ||||||
| Age (years) | 60.5 |
65.2 |
54.3 |
62.6 |
||
| Male sex | 325 (83.5%) | 144 (88.3%) | 112 (75.7%) | 69 (88.5%) | 0.005 | |
| Body mass index (kg/m |
24.8 |
25.2 |
24.9 |
23.9 |
0.039 | |
| Ischemic cardiomyopathy etiology | 204 (52.4%) | 155 (95.1%) | 20 (13.5%) | 29 (37.2%) | ||
| Family history of sudden death | 9 (2.3%) | 3 (1.8%) | 6 (4.1%) | 0 (0.0%) | 0.141 | |
| Clinical characteristics | ||||||
| Smoking | 200 (51.4%) | 105 (64.4%) | 62 (41.9%) | 33 (42.3%) | ||
| Dual-chamber ICD | 134 (34.4%) | 73 (44.8%) | 43 (29.1%) | 18 (23.1%) | 0.001 | |
| Systolic BP (mmHg) | 118.5 |
124.0 |
114.8 |
114.0 |
||
| Diastolic BP (mmHg) | 73.6 |
74.9 |
73.6 |
70.9 |
0.019 | |
| NYHA class III/IV | 180 (46.3%) | 51 (31.3%) | 64 (43.2%) | 65 (83.3%) | ||
| Echocardiogram | ||||||
| LVEDD (mm) | 64.6 |
62.0 |
65.5 |
68.3 |
||
| LVEF (%) | 35.5 |
38.3 |
34.2 |
32.1 |
||
| LAD (mm) | 44.1 |
42.0 |
43.3 |
50.1 |
||
| RVD (mm) | 22.9 |
21.9 |
22.3 |
26.1 |
||
| IVS (mm) | 9.3 |
9.0 |
9.3 |
9.6 |
0.054 | |
| Tricuspid valve regurgitation | 26 (6.7%) | 1 (0.6%) | 5 (3.4%) | 20 (25.6%) | ||
| Mitral valve regurgitation | 86 (22.1%) | 21 (12.9%) | 22 (14.9%) | 43 (55.1%) | ||
| Electrocardiogram findings | ||||||
| Heart rate (beats per minute) | 70.0 |
68.6 |
69.5 |
73.8 |
0.013 | |
| CLBBB | 27 (6.9%) | 2 (1.2%) | 20 (13.5%) | 5 (6.4%) | ||
| CRBBB | 27 (6.9%) | 14 (8.6%) | 7 (4.7%) | 6 (7.7%) | 0.392 | |
| Frequent PVCs | 166 (42.7%) | 52 (31.9%) | 81 (54.7%) | 33 (42.3%) | ||
| Pacing indication | 18 (4.6%) | 3 (1.8%) | 7 (4.7%) | 8 (10.3%) | 0.016 | |
| Comorbidities | ||||||
| Myocardial infarction | 176 (45.2%) | 151 (92.6%) | 7 (4.7%) | 18 (23.1%) | ||
| Atrial fibrillation | 121 (31.1%) | 30 (18.4%) | 35 (23.6%) | 56 (71.8%) | ||
| Hypertension | 164 (42.2%) | 88 (54.0%) | 36 (24.3%) | 40 (51.3%) | ||
| Diabetes | 82 (21.1%) | 48 (29.4%) | 16 (10.8%) | 18 (23.1%) | ||
| Hyperlipidemia | 193 (49.6%) | 115 (70.6%) | 43 (29.1%) | 35 (44.9%) | ||
| Stroke | 31 (8.0%) | 12 (7.4%) | 7 (4.7%) | 12 (15.4%) | 0.018 | |
| Hyperuricemia | 45 (11.6%) | 17 (10.4%) | 7 (4.7%) | 21 (26.9%) | ||
| Laboratory tests | ||||||
| NT-proBNP (pg/mL) | 1036.0 (534.2–2065.1) | 805.0 (329.0–1787.0) | 919.0 (542.5–1562.8) | 3404.9 (1857.5–5766.4) | ||
| Hemoglobin (g/L) | 141.1 |
136.8 |
146.9 |
138.9 |
||
| Creatinine ( |
93.6 (81.0–111.0) | 96.5 (83.0–113.8) | 85.2 (75.8–95.0) | 109.7 (96.6–135.2) | ||
| BUN (mmol/L) | 7.2 (5.7–9.3) | 7.2 (5.7–9.0) | 6.6 (5.4–8.0) | 9.5 (7.3–13.3) | ||
| hs-CRP (mg/L) | 2.4 (0.9–5.6) | 2.3 (0.8–4.7) | 1.6 (0.8–4.2) | 5.2 (2.0–11.1) | ||
| Medications | ||||||
| ACEI/ARB/ARNI | 303 (77.9%) | 126 (77.3%) | 122 (82.4%) | 55 (70.5%) | 0.118 | |
| Amiodarone | 276 (71.0%) | 130 (79.8%) | 94 (63.5%) | 52 (66.7%) | 0.005 | |
| Beta-blockers | 339 (87.1%) | 152 (93.3%) | 126 (85.1%) | 61 (78.2%) | 0.003 | |
| Calcium channel blockers | 36 (9.3%) | 15 (9.2%) | 15 (10.1%) | 6 (7.7%) | 0.834 | |
| Diuretics | 304 (78.1%) | 120 (73.6%) | 114 (77.0%) | 70 (89.7%) | 0.017 | |
| MRA | 285 (73.3%) | 116 (71.2%) | 116 (78.4%) | 53 (67.9%) | 0.177 | |
| Digitalis | 94 (24.2%) | 22 (13.5%) | 36 (24.3%) | 36 (46.2%) | ||
| Statin | 207 (53.2%) | 133 (81.6%) | 44 (29.7%) | 30 (38.5%) | ||
| Antiplatelet | 152 (39.1%) | 110 (67.5%) | 26 (17.6%) | 16 (20.5%) | ||
| Anticoagulants | 75 (19.3%) | 21 (12.9%) | 24 (16.2%) | 30 (38.5%) | ||
Values are presented as the mean
ACEI/ARB/ARNI, angiotensin-converting enzyme inhibitor/angiotensin receptor blocker/angiotensin receptor-neprilysin inhibitor; BP, blood pressure; BUN, blood urea nitrogen; CLBBB, complete left bundle branch block; CRBBB, complete right bundle branch block; hs-CRP, high-sensitivity C-reactive protein; ICD, implantable cardioverter-defibrillator; IVS, interventricular septum thickness; LAD, left atrial diameter; LVEDD, left ventricular end-diastolic diameter; LVEF, left ventricular ejection fraction; MRA, mineralocorticoid receptor antagonist; NT-proBNP, N-terminal pro-brain natriuretic peptide; NYHA, New York Heart Association; PVC, premature ventricular contractions; RVD, right ventricular diameter.
The scree plot obtained using FAMD analysis is illustrated in
Supplementary Fig. 1. The first 12 principal components with eigenvalues
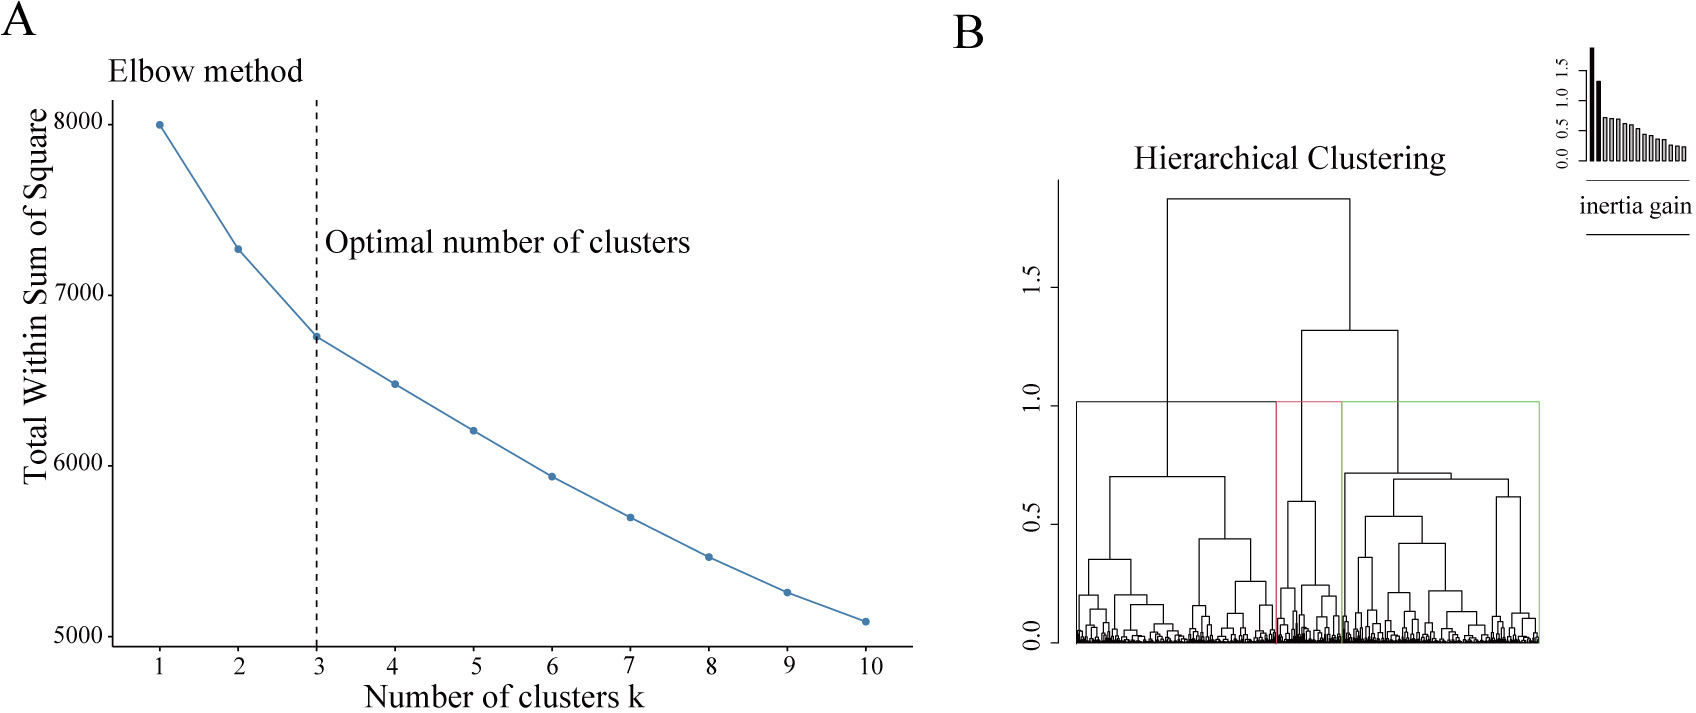 Fig. 1.
Building the hierarchical clustering. (A) The Elbow method to identify the ideal number of clusters. The optimal number of clusters was three, as illustrated. (B) The dendrogram construction.
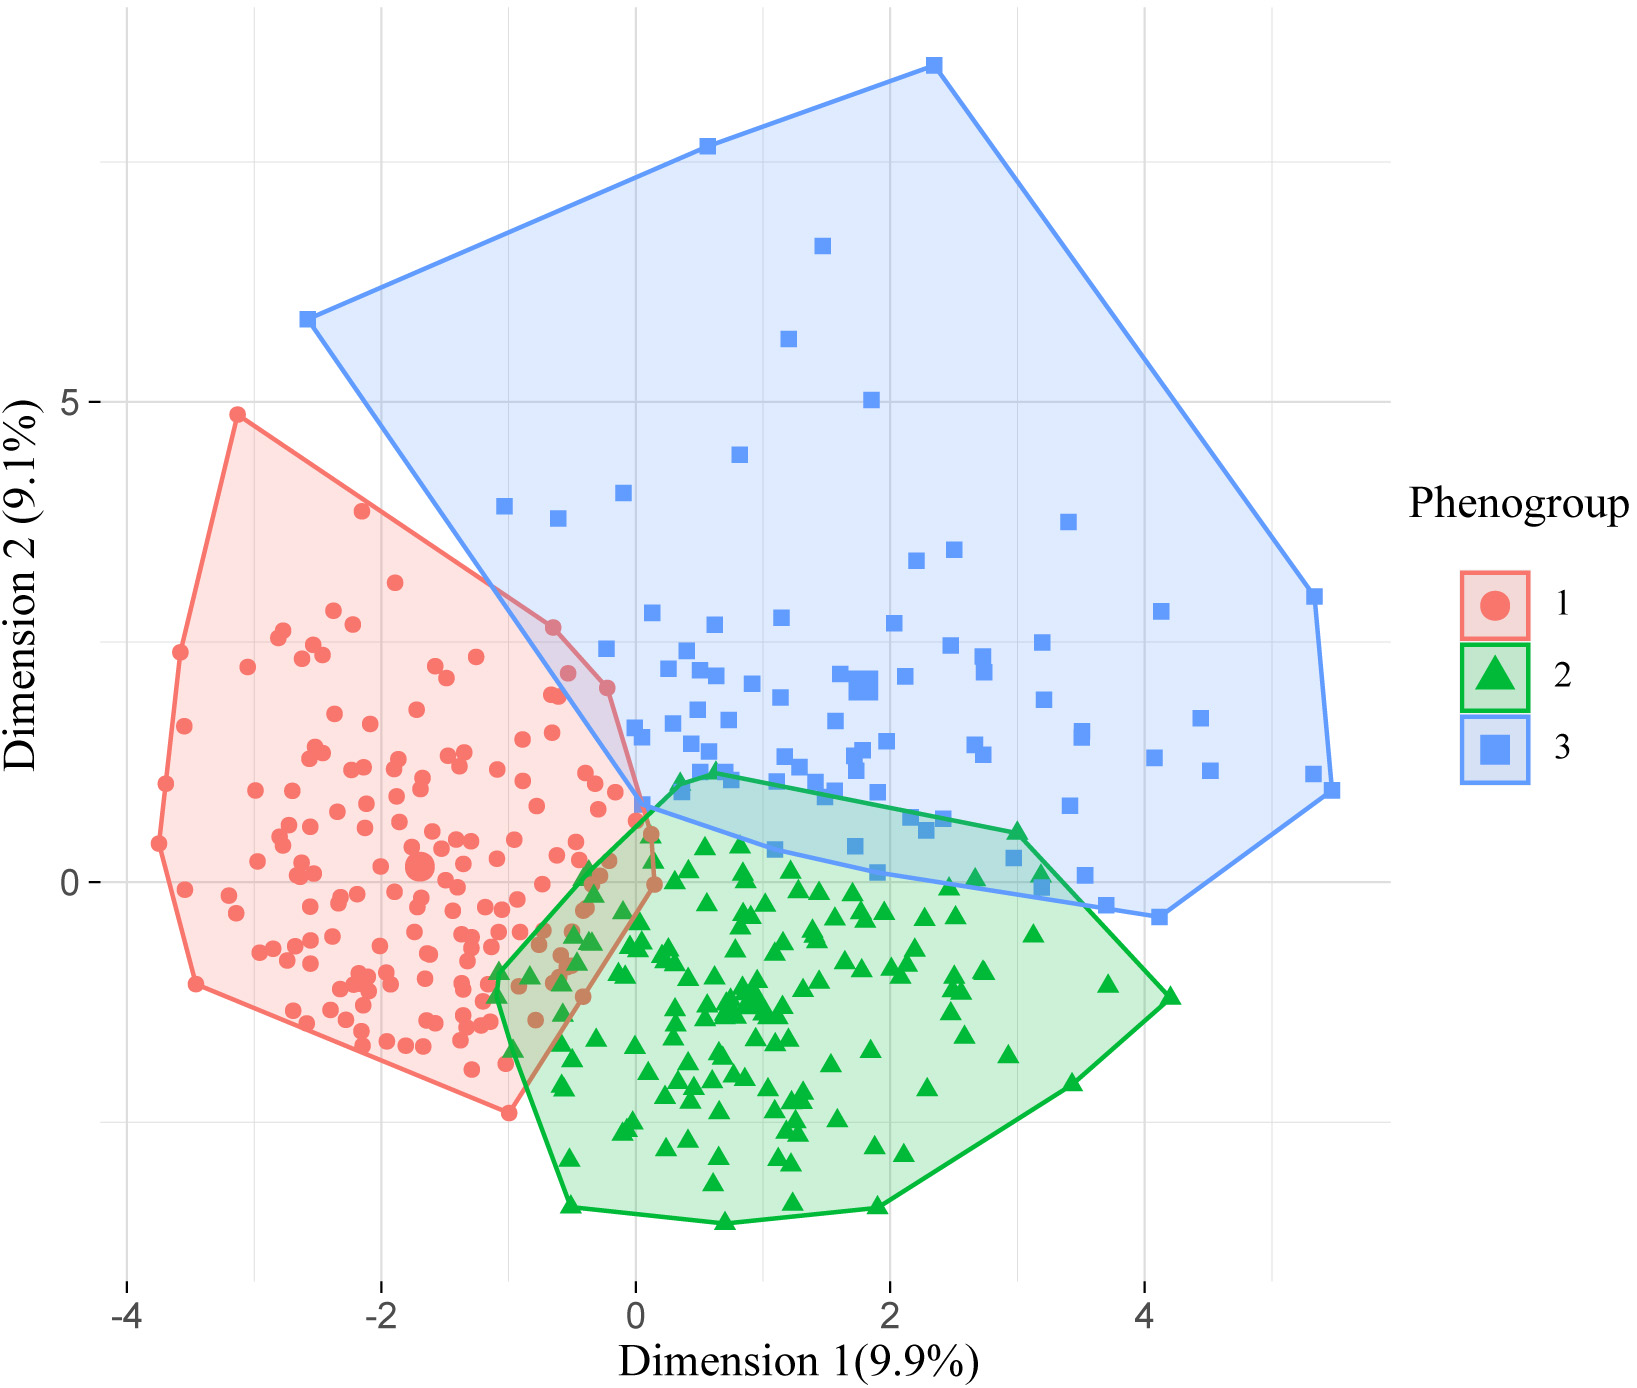 Fig. 2.
Visualization of the phenomapping after k-means consolidation. The X and Y axes represent the first and second extracted principal components, respectively.
The most representative features of each phenogroup are illustrated in Fig. 3.
By adding the group differences presented in Table 1, these three clinical
phenogroups were well defined. Phenogroup 1 was the oldest (65.2
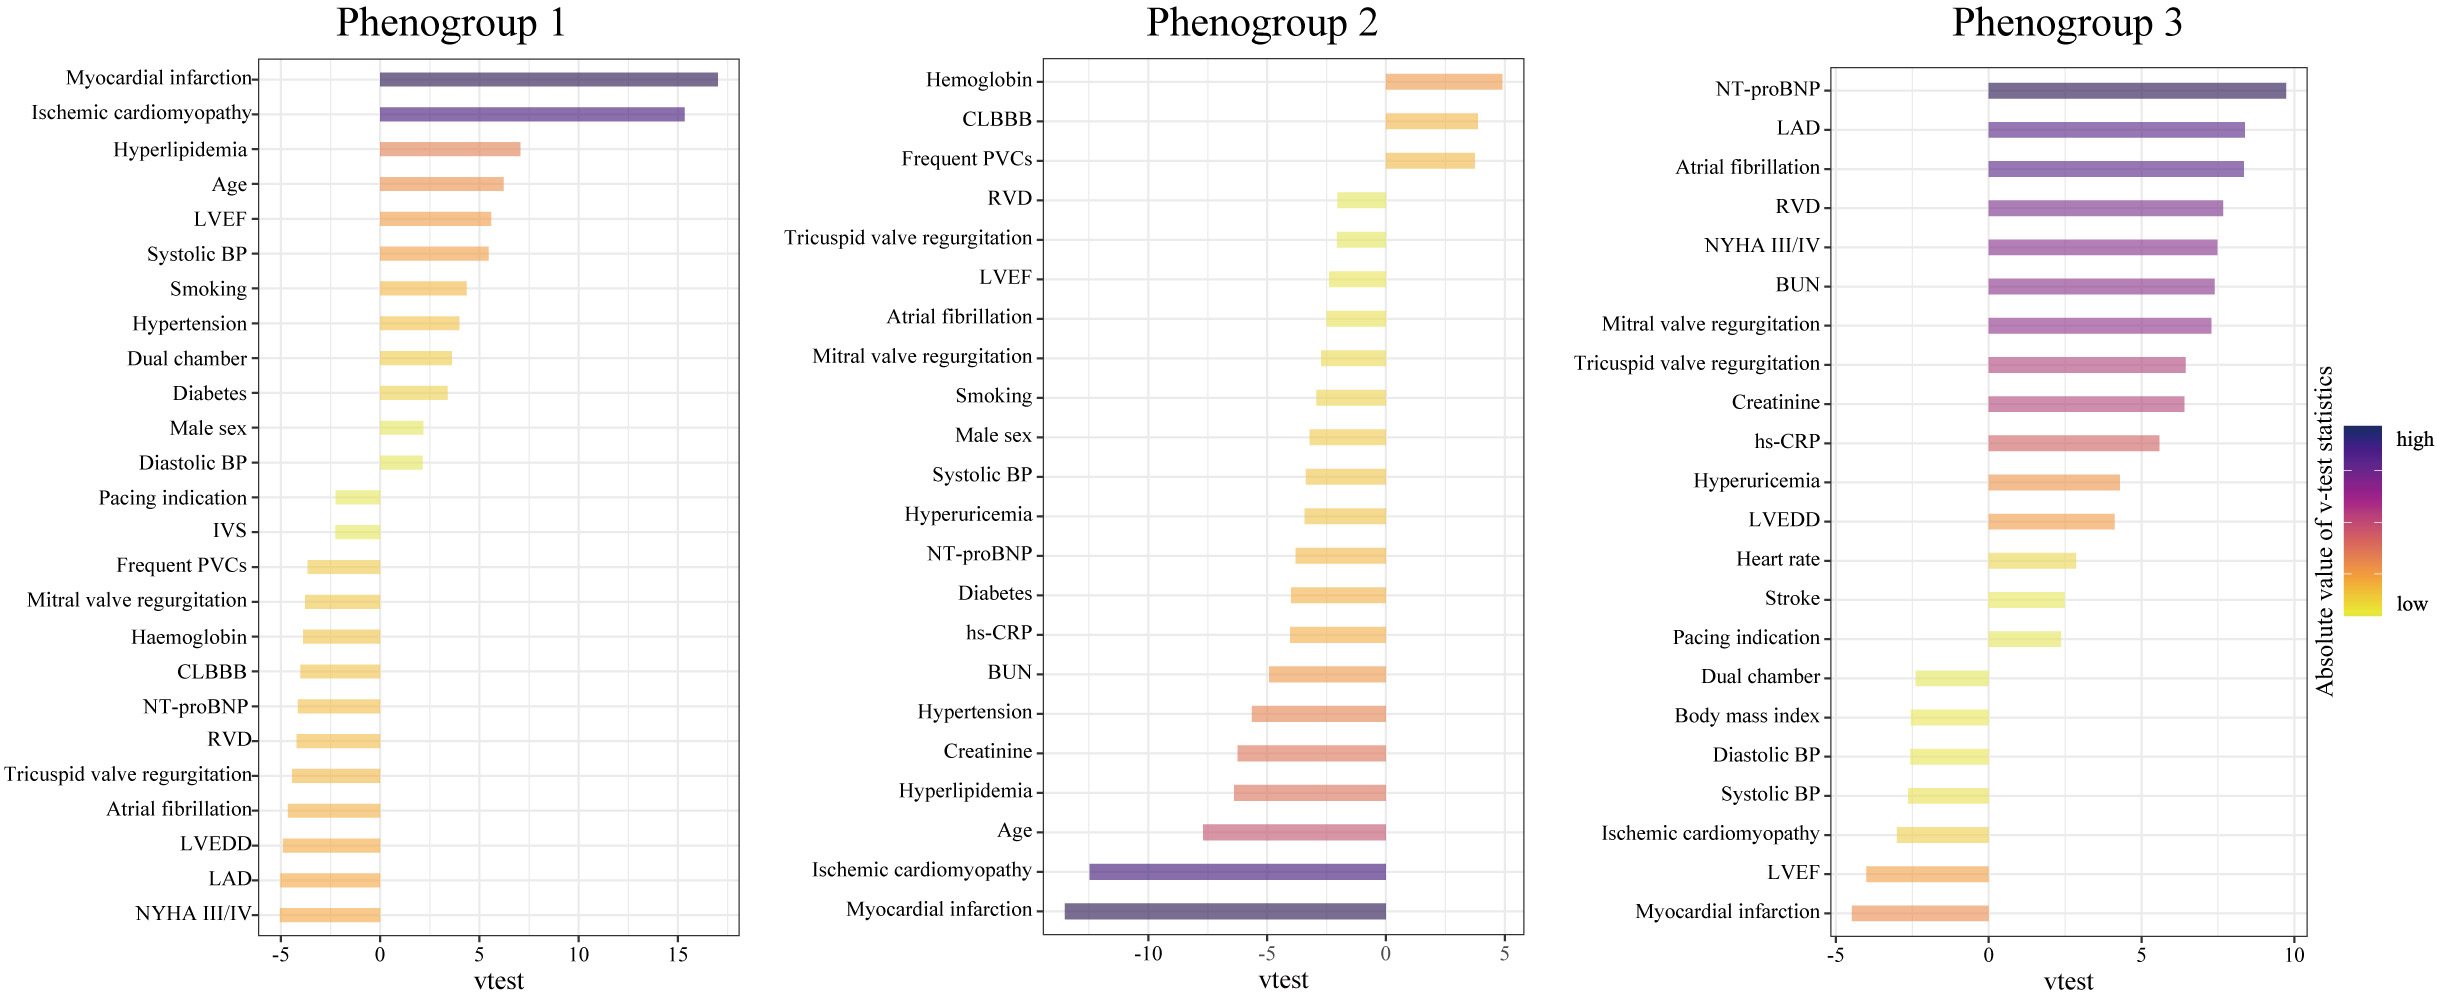 Fig. 3.
Characteristics of the three phenogroups by their major representative features. A higher v-test statistic means a more remarkable representation of a feature compared to the overall population. Positive and negative values represent overrepresentation and underrepresentation, respectively. Abbreviations as in Table 1.
During a median follow-up of 2.7 years for device interrogation and 5.1 years
for survival status, 142 (36.5%) first appropriate shocks and 113 (29.0%)
all-cause deaths occurred. As illustrated in Fig. 4, long-term outcomes differed
significantly among the phenogroups. Phenogroup 1 had a 5-year cumulative
incidence of appropriate shock and all-cause mortality of 45.0% and 24.6%,
respectively. Subsequently, they were assigned as the reference group. Table 2
summarizes the unadjusted and adjusted differences between phenogroups. After
adjusting for medications in multivariable Cox regression, phenogroups 2 and 3
had a graded increase in the risk of appropriate shock (HR 1.54, 95% CI
1.03–2.28, p = 0.033; HR 2.21, 95% CI 1.42–3.43, p
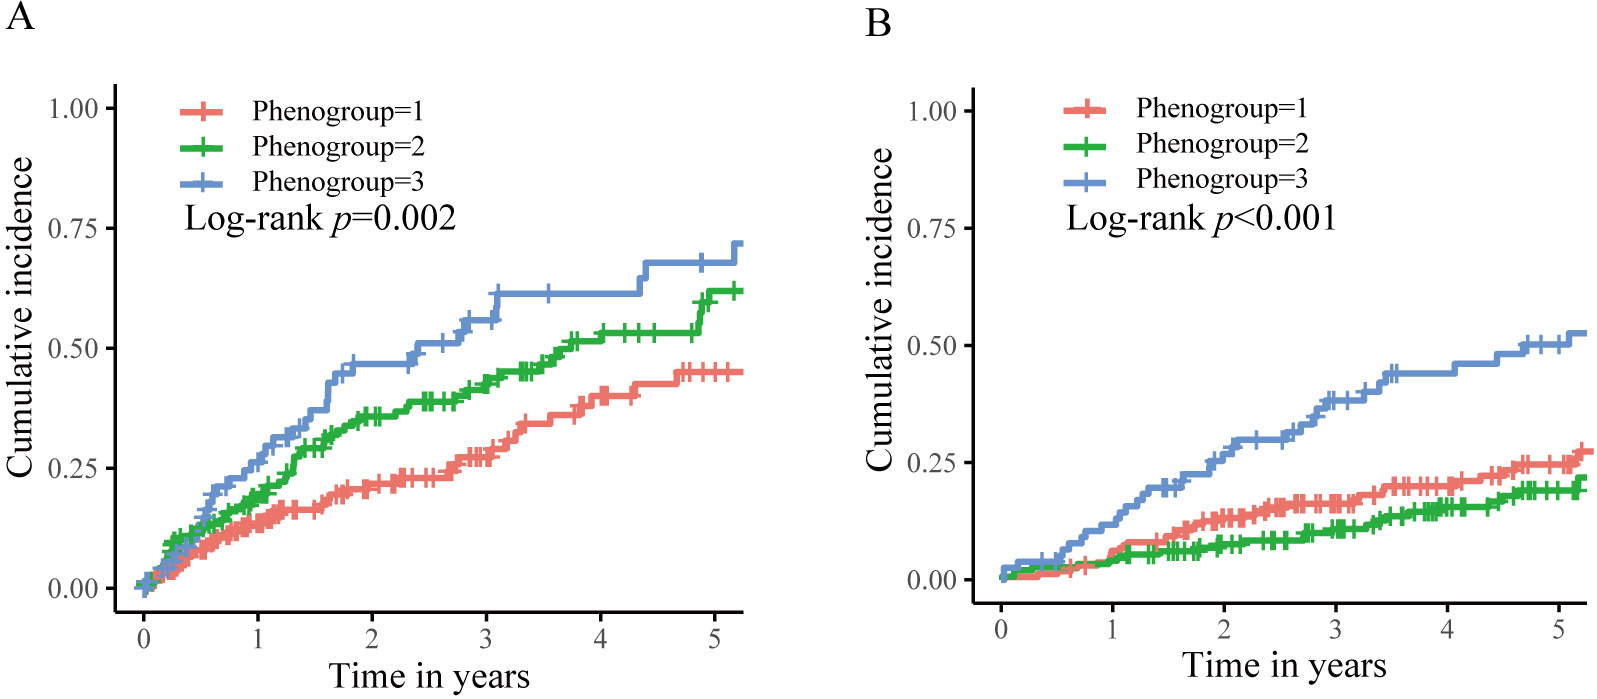 Fig. 4.
Kaplan–Meier curves for the clinical outcomes stratified by phenogroups. (A) The first appropriate shock. (B) The all-cause death.
| Phenogroup 1 (n = 163) | Phenogroup 2 (n = 148) | Phenogroup 3 (n = 78) | p for trend | ||||||
|---|---|---|---|---|---|---|---|---|---|
| Events | HR |
Events | HR (95% CI) | p-value | Events | HR (95% CI) | p-value | ||
| Unadjusted | |||||||||
| The first appropriate shock | 41 (25.2%) | 1 | 63 (42.6%) | 1.59 (1.07–2.35) | 0.021 | 38 (48.7%) | 2.16 (1.39–3.36) | ||
| All-cause mortality | 43 (26.4%) | 1 | 32 (21.6%) | 0.68 (0.43–1.09) | 0.109 | 38 (48.7%) | 2.24 (1.44–3.47) | - | |
| Adjusted | |||||||||
| The first appropriate shock | - | 1 | - | 1.54 (1.03–2.28) | 0.033 | - | 2.21 (1.42–3.43) | ||
| All-cause mortality | - | 1 | - | 0.70 (0.44–1.11) | 0.124 | - | 2.25 (1.45–3.49) | - | |
The adjusted analysis included the following medication prescriptions: ACEI/ARB/ARNI, amiodarone, beta-blockers, calcium channel blockers, diuretics, MRA, digoxin, statin, antiplatelet, and anticoagulants.
HR, hazard ratio; CI, confidence interval. The other abbreviations are listed in Table 1.
In this follow-up study of secondary ICD recipients with HF, we identified three phenotypically and prognostically distinct phenogroups using principal component analysis and unsupervised phenomapping. Phenogroup 1 comprised the oldest patients with ischemic cardiomyopathy and had the highest diabetes, hypertension, and hyperlipidemia burden. Phenogroup 2 was characterized by the youngest age, non-ischemic cardiomyopathy, and lowest burden of comorbidities. Phenogroup 3 had the worst HF progression. In addition, in phenogroups 1–3, heart structure and function deteriorated. In accordance with these findings, the risk of appropriate shock doubled from phenogroups 1 to 3. Not surprisingly, no VA recurrence-free group was observed. The death risk also doubled in phenogroup 3 compared to that in phenogroup 1. These results offer a novel perspective on predicting the long-term outcomes of different HF subgroups that received secondary ICD implantation and might serve as a triage for these patients.
Prior studies using traditional statistical analysis failed to construct risk assessment tools for secondary ICD recipients [11, 12]. This may be largely explained by the complex pathophysiological interactions underlying VA [13, 18]. Therefore, instead of finding a specific mode between baseline features and prognosis, unsupervised machine learning phenomapping by classifying patients into several clusters based on their similarities may represent a promising alternative [14]. Patients within a cluster, also called a phenogroup, share similar characteristics and prognostic outcomes, whereas patients from different clusters differ [19, 20, 21]. Phenomapping has been utilized extensively in cardiovascular medicine, including the categorization of HF comorbidities [22], classification of patients with HF with preserved ejection fraction [20, 21], dilated cardiomyopathy [17], and identification of cardiac resynchronization therapy responders [19, 23]. To date, there is no gold standard for selecting an optimal algorithm for phenomapping. However, in this study, k-means consolidated hierarchical clustering based on principal components was chosen because of its reliability and effectiveness [15, 16, 17]. Notably, FAMD was used first to extract principal components from mixed data, which also contributed to reducing the redundancy of the raw variables. These factors led to robust clustering, as demonstrated by the unique clinical features and prognoses observed across these phenogroups.
Assessing the risk of VA recurrence and ICD shock is essential to optimize the management of patients with ICD [10, 13]. On the one hand, although life-saving, the ICD shock is related to a higher risk of death, decreased quality of life, and psychiatric disorders, such as anxiety and depression [1, 2]. On the other hand, intensified therapies should not be encouraged indiscriminately, as antiarrhythmic medications have adverse side effects and may increase mortality [24], while VA ablation in ICD recipients has been inconsistent with VA recurrence and mortality [25, 26]. Therefore, it is strongly advised to identify high-risk individuals and take more aggressive actions in these patients, including personalized device programming to reduce appropriate yet unnecessary ICD shocks, innovative drugs (such as sodiumc-glucose cotransporter-2 inhibitors [27]), and catheter ablation to reduce VA recurrence. Aging, male sex [12], VT as a presenting arrhythmia [11, 12, 28], incomplete revascularization [29, 30], and cardiac remodeling [11, 29, 31] are risk factors for VA occurrence in secondary prevention; however, no risk models have been developed. In contrast, we identified three phenogroups with a gradient increase in shock risk parallel with progressive cardiac remodeling and function, which might aid in real-world risk stratification. This finding is also consistent with previous findings that deteriorated left ventricular dimension and function contribute to the increased risk of VA [11, 29, 31, 32].
In addition to identifying the risk of appropriate shock, this phenomapping can also classify the risk of all-cause death. Phenogroup 3 had a higher mortality risk than phenogroup 1, which is consistent with HF worsening. Conversely, phenogroup 2 had a lower risk of death than phenogroup 1, although the difference was not significant. At first glance, this is obscure. However, individuals in phenogroup 2 were much younger (11 years younger) and had a better overall health status, except for heart conditions. Thus, the rate of non-cardiac death might be lower in phenogroup 2 than that of patients in phenogroup 1, which ultimately contributes to a lower risk of all-cause mortality. Notably, ICD is merely designed to terminate the VA. Nevertheless, it can neither reverse pump failure nor prevent non-cardiac deaths. Furthermore, data have revealed that patients with comorbid hypertension [33], renal dysfunction [34], and diabetes [35, 36] derive less or no benefit from ICD implantation. Therefore, it is imperative to minimize non-cardiac deaths among ICD recipients to achieve a mortality benefit. Specifically, for patients in phenogroup 1, optimized control of diabetes, hypertension, hyperlipidemia, and renal function protection should be implemented.
The risk of cardiac death, including pump failure death and SCD, increases as HF worsens [32, 37]. Therefore, it is reasonable to identify individuals with a higher likelihood of SCD than pump failure to maximize ICD implantation benefits [38, 39, 40]. However, defining the extent of HF progression that meets this condition is challenging. Therefore, phenomapping patients with varying degrees of comorbidities and HF is a feasible alternative strategy. For instance, phenogroup 2 had a lower risk of death but a higher risk of appropriate shock than phenogroup 1. In this case, phenogroup 2 may derive greater benefits from ICD therapy. Notably, as our patients exclusively comprised secondary prevention indications, no subgroup of patients could be deemed as having no need for ICD implantation. Except for identifying those most likely or unlikely to benefit from ICD, phenomapping is also paramount in the historical period when subcutaneous ICD (S-ICD) is gaining momentum. The S-ICD is designed to overcome some transvenous ICD-related complications, such as vascular injury, lead failure, and systemic infections; however, it is not free from device-related complications and inappropriate shocks [41]. Moreover, there remains a need for a certain population implanted with S-ICD to upgrade to a transvenous ICD due to the need for anti-bradycardia pacing, anti-tachycardia pacing, or cardiac resynchronization therapy [42]. Phenomapping techniques can identify patients suitable for S-ICD implantation.
Our study has some limitations. It was conducted exclusively in a tertiary hospital; therefore, the conclusions drawn not be directly applicable to external datasets. Therefore, validation of phenomapping is required. Nonetheless, as these phenogroups are well characterized and resemble real-world situations, phenomapping can be inferred to be robust. Second, no standard protocol for device programming was used, and parameter tuning might have occurred during the follow-up. Nevertheless, shock therapies were generally triggered after ATP failed to terminate the VA. Therefore, an appropriate shock could be considered a reliable surrogate for lethal VA. Third, due to the difficulties of adjudication, we did not distinguish between deaths caused by HF progression, SCD, or non-cardiac causes. However, determining the cause of death would undoubtedly provide a more comprehensive perspective for interpreting this phenomapping. Fourth, the patients were undertreated with guideline-directed medical therapy for HF at baseline. Nevertheless, given that phenomapping is solely based on baseline features, except for medications, and computed by similarities between individual patients, outcome differences between phenogroups were unlikely to change significantly even after modifying medications. Finally, only the routine clinical variables were included. Genetic testing, inflammatory markers, computed tomography, and cardiac magnetic resonance parameters were unavailable. This hinders the possibility of diving into a deeper understanding of the phenomapping.
As a proof-of-concept study, we have demonstrated that unsupervised machine learning phenomapping based on principal components is a promising way to identify subgroups of patients with HF implanted with ICD, among whom clinical characteristics and prognosis substantially differed. This novel approach has the potential to facilitate risk stratification and guide the individualized management of patients with ICD.
FAMD, factor analysis of mixed data; HF, heart failure; ICD, implantable cardioverter-defibrillator; LVEF, left ventricular ejection fraction; NT-proBNP, N-terminal pro-brain natriuretic peptide; NYHA, New York Heart Association; SCD, sudden cardiac death; VA, ventricular arrhythmias.
The datasets generated and/or analyzed during the current study are not publicly available due to the regulation of Fuwai Hospital.
WH designed the research study. YD performed the research. SC and HN provided help and advice on writing. YD analyzed the data. YD, SC, HH, XL, YY, MG, CC, XC, and HN collected data. YD wrote the manuscript. WH revised the manuscript. All authors contributed to editorial changes in the manuscript. All authors read and approved the final manuscript.
The study was approved by the Ethics Committee of Fuwai Cardiovascular Hospital (protocol code: 2010-272, 2 June 2010). All patients gave written informed consent.
Not applicable.
This research received no external funding.
The authors declare no conflict of interest.
References
Publisher’s Note: IMR Press stays neutral with regard to jurisdictional claims in published maps and institutional affiliations.