


1 PoliToBIOMed Lab, Department of Mechanical and Aerospace Engineering, Politecnico di Torino, 10129 Torino, Italy
2 Department of Cardiology, Zurich University Hospital, 8091 Zurich, Switzerland
3 Department of Medical Sciences, Division of Cardiology, AOU Città Della Salute e Della Scienza, University of Turin, 10124 Turin, Italy
Academic Editor: Jerome L. Fleg
Abstract
Hemodynamics interacts with the cellular components of human vessels, influencing function and healthy status. Locally acting hemodynamic forces have been associated—by a steadily increasing amount of scientific evidence—with nucleation and evolution of atherosclerotic plaques in several vascular regions, resulting in the formulation of the ‘hemodynamic risk hypothesis’ of the atherogenesis. At the level of coronary arteries, however, the complexity of both anatomy and physiology made the study of this vascular region particularly difficult for researchers. Developments in computational fluid dynamics (CFD) have recently allowed an accurate modelling of the intracoronary hemodynamics, thus offering physicians a unique tool for the investigation of this crucial human system by means of advanced mathematical simulations. The present review of CFD applications in coronary artery disease was set to concisely offer the medical reader the theoretical foundations of quantitative intravascular hemodynamics—reasoned schematically in the text in its basic (i.e., pressure and velocity) and derived quantities (e.g., fractional flow reserve, wall shear stress and helicity)—along with its current implications in clinical research. Moreover, attention was paid in classifying computational modelling derived from invasive and non-invasive imaging modalities with unbiased remarks on the advantages and limitations of each procedure. Finally, an extensive description—aided by explanatory figures and cross references to recent clinical findings—was presented on the role of near-wall hemodynamics, in terms of shear stress, and of intravascular flow complexity, in terms of helical flow.
Keywords
- coronary artery disease
- atherosclerosis
- computer model
- computer simulation
- computational hemodynamics
- virtual FFR
- wall shear stress
- helicity
Following nucleation, coronary atherosclerotic plaques differentiate into several clinical phenotypes. Whilst most of the plaques will remain uneventful lifelong, a proportion of them will progress into flow-limiting lesions or become unstable, rupture and provoke acute coronary syndromes [1, 2]. For its epidemiological impact, the understanding of the mechanisms underlying coronary atherosclerotic plaque onset, progression and rupture is of clinical significance.
Although extensive scientific efforts, prediction of plaque formation, evolution and vulnerability remains equivocal. Firstly, despite the arguably systemic distribution of vascular inflammation and the systemic effect of cardiovascular risk factors, plaque nucleation appears to be a local phenomenon. In fact, atherosclerotic plaques cluster in preferential anatomic regions (e.g., coronary, carotid or lower-limb arteries) and at preferential vascular sites (e.g., inner curvatures, bifurcations and T-junctions) [3, 4]. Secondly, several studies linked plaque composition and inflammatory plaque infiltration footprints with a vulnerable phenotype (see e.g., [2, 5, 6]). However, the registered elevated senescence rate of those lesions identified as vulnerable have failed so far to justify pre-emptive therapeutic interventions aiming at stabilizing the plaque with an improvement of patient long term outcome [6]. Thirdly, increased transcoronary pressure gradients were associated not only with myocardial flow impairment [7] but also with plaque destabilization [8], thus suggesting a harmful role of trans-stenotic forces acting across flow-impairing plaques [3]. Lastly, coronary intervention targeting myocardial perfusion deficits failed to reduce occurrence of major adverse cardiac events compared to optimal medical treatment [9], indicating the prevention of acute coronary events rather than the sole treatment of myocardial ischemia as more relevant target therapy to impact patient outcome.
Coronary atherosclerotic plaques experience complex biomechanical forces during each cardiac cycle as the result of the interaction between the pulsatile blood flow with the moving artery geometry [3]. The role of local blood flow-vessel interaction has gained scientific momentum becoming subject to extensive investigation, especially in relation with vessel remodeling and atherosclerotic plaque evolution in the coronary vascular bed. Given the impossibility of a direct in vivo measurement of those flow-related quantities acting as local biomechanical stimuli at the blood-endothelium interface, increasingly refined and personalized computer models able to realistically capture cardiovascular flows have been developed [10] and applied to study intracoronary hemodynamics [11]. Consequently, hemodynamic factors influencing vascular homeostasis as well as atherosclerotic lesion development have been proposed, hence providing evidence to the so-called ‘hemodynamic risk hypothesis’ of atherosclerosis [3, 12]. According to this hypothesis, local onset and progression of atherosclerosis can be promoted by local blood flow disturbances.
However, the integration of computer model-based intracoronary hemodynamic data within the clinical practice is mainly hampered by a demanding computational cost to run simulations, especially when compared to current diagnostic imaging acquisitions. This has prevented the use of computational hemodynamics in large clinical studies, which in turn would be required to prove the utility of computer based hemodynamic modelling, setting up a vicious cycle. Moreover, computer based hemodynamic modelling is perceived by cardiologists as a technology for which most of them have never been trained and this represent a barrier to its adoption.
The present review of the literature aims to broaden the understanding of computer based hemodynamic modelling and to highlight the opportunities opened by its clinical application in cardiology. More specifically, it offers the non-technical, medical reader (i) a simplified but rigorous explanation of coronary artery hemodynamics, (ii) a broad overview on the applications of computational fluid dynamics (CFD) based modelling to coronary artery hemodynamics, and (iii) the current level of scientific evidence and of implementation of CFD in the clinical practice.
After a brief overview on the complexity of coronary artery hemodynamics in Section 3, the principles of CFD application to the human coronary system and the generation of flow simulations are presented in a step-by-step fashion in Section 4. From here, a detailed description of CFD applications concerning the assessment of intracoronary pressure is presented in Section 5, with distinction between methods based on invasive and non-invasive imaging modalities. In this part of the manuscript, ample space is dedicated to the discussion of various existing CFD based tools and their clinical role. Near-wall and intravascular flow patterns will be the main focus of Section 6, where preclinical and early clinical applications will be presented. Finally, limitations of the CFD-based current methodology and future perspectives (including artificial intelligence) will be discussed in Section 7.
Coronary artery hemodynamics can be seen as a system characterized by a
remarkable level of complexity. A main source of complexity is the anatomy of the
coronary tree, which presents a pronounced tapering (especially in the left
coronary vasculature) and follows an asymmetrical fractal dichotomizing pattern
[13], where flow distribution at bifurcations is not equal among the two daughter
ramifications, namely distal main vessel and side branch [14]. Acting as a flow
divider, the presence of the coronary bifurcation carina literally splits the
incoming flow rate into two asymmetric flows with velocity profiles modelled by
the local geometry [15]. In this region, the sudden changes in velocity direction
and magnitude of the flowing blood lead to complex patterns usually characterized
by flow separation and reattachment, with direct effect on endothelial cell
distribution, shape and function [16] as well as on circulating cell prolonging
their adhesion time to the endothelium [17]. In addition, variability in the
distribution of diagonal and marginal branches is commonly observed. Tortuous and
ectatic vascular segments are frequently encountered [18]. Another source of
complexity is represented by the dynamic vasomotion autoregulation characterizing
both epicardial coronary arteries and smaller arteriolae (i.e., with a
cross-sectional diameter
Hence, capturing the complexity of coronary artery physiology into a virtual environment for blood flow simulation represents for sure a singular challenge.
Initially developed in the middle of the last century to solve complex engineering problems through the execution of numerical simulations, CFD solves numerically in space and time the physics equations governing fluid motion, thus allowing to mathematically describe and analyze flow fields also in complex geometries [21]. To be clearer, the nature of the governing equations describing the time-varying motion of fluids, namely the Navier-Stokes equations (expressing the conservation laws of fluid dynamics), prevents their analytical resolution in case of complex 3D fluid domains. Thus, numerical schemes, typically based on the finite volume or finite element method, are adopted to solve the equations in their discretized form [21]. Applied with high spatial and temporal resolution to the simulation of blood flow patterns, the combination of CFD with clinical imaging represents for cardiologists a powerful technology to quantitatively assess hemodynamic forces acting locally on the endothelium.
To obtain robust results, CFD tools require several steps to be appropriately executed, including vascular geometry reconstruction, boundary conditions (BCs) definition, and material properties setting; all these steps concur to determine the reliability of the simulation results [22, 23]. Fig. 1 summarizes the main steps of patient-specific CFD simulations for the analysis of the coronary artery hemodynamics.
 Fig. 1.
Workflow of patient-specific computational fluid dynamics
simulations for an explanatory case of diseased right coronary artery. The
artery model belongs to a patient recruited during the clinical trial RELATE
(ClinicalTrials.gov Identifier: NCT04048005). ICA, invasive coronary angiography;
CTCA, computed tomography coronary angiography; IVUS, intravascular ultrasound;
OCT, optical coherence tomography;
Firstly, the patient-specific 3D coronary artery geometry is reconstructed from conventional invasive coronary angiography (ICA), computed tomography coronary angiography (CTCA), or from the fusion of one of the previous imaging modalities with intravascular imaging techniques (i.e., intravascular ultrasound – IVUS or optical coherence tomography – OCT). Clinical imaging is used to obtain information about the vascular segments of interest with resolutions close to 1 mm or even lower, which is of considerable importance for the accurate characterization of local coronary hemodynamics [23]. This information will be used to create the CFD model, defining the fluid domain of interest (Fig. 1).
Secondly, the so-obtained 3D fluid domain of interest is subdivided into smaller sub-domains called ‘elements’ (i.e., outputs of the discretization process, also known as meshing process), where the equations of fluid motion are solved in their discrete form. The discretization of the Navier-Stokes equations is necessary since their resolution in complex 3D fluid domains cannot be analytically obtained. By that, a system of non-linear partial differential equations is transformed into a system of algebraic equations that can be solved numerically. Finer grid spacing (i.e., smaller element size) is usually required for complex vascular regions, where larger variation in velocity and/or pressure profiles are expected. On the contrary, larger element size might be used in vascular regions where low spatial variability of the hemodynamic quantities is expected. High spatial resolutions imply computationally expensive simulations, usually requiring the adoption of high-performance computing technology.
Thirdly, the CFD simulation is set up by defining a priori the physical
model, the blood material properties (in terms of blood density and
viscosity), the initial conditions and BCs contextualizing as much as
possible the physical phenomenon, and the solver numerical settings. CFD
simulations can be carried out under constant (steady-state) or pulsatile
(unsteady-state) flow conditions, depending on the quantities we are interested
in (e.g., pressure rather than shear stress profiles). Blood is assumed as
homogeneous, incompressible fluid with constant density. In most cases, blood
viscosity is described through non-Newtonian rheological models able to replicate
its shear-tinning behavior (e.g., Carreau or Quemada models) [24]. The use of the
Newtonian model is also accepted, since it proved to be likely appropriate for
hemodynamics simulation in arterial domains characterized by high shear rates
(
 Fig. 2.
Explanatory strategies of computational fluid dynamics (CFD) boundary conditions (BCs) that can be prescribed to a diseased right coronary artery model. (A) In/out flow direction panel: the dark blue arrows display the direction of blood flow at each inlet/outlet boundary cross-section of the vessel model. (B) Measured flow rates panel: blood flow rate waveforms extracted from imaging or in vivo measurement techniques are prescribed at each model inlet/outlet cross-section of the vessel model. The measured blood flow rates applied as BCs are shown. (C) Measured inflow + lumped models panel: BCs are defined by coupling measured clinical data, available at the inflow section, with lumped parameter circuit models describing the peripheral vascular resistance and compliance. The diseased right coronary artery belongs to a patient recruited during the RELATE clinical trial (ClinicalTrials.gov Identifier: NCT04048005).
Fourthly, once properly set, the CFD simulation is run. The discretized governing equations of fluid motion are iteratively solved to reach a solution for which residual errors in velocity and pressure fall below a certain threshold (pre-selected by the user based on the accuracy that is considered adequate for numerically solving the equations).
At last, simulation results are post-processed to extract the hemodynamic quantities and indexes of interest. Both intracoronary pressures and flows can be quantified, describing their behavior within the streaming medium and along the blood-vessel interface (i.e., near-wall hemodynamic quantities). Accordingly, in the following sections clinical applications of CFD will be addressed separately for computational simulation of coronary pressure (Section 5) and coronary flow patterns (Section 6). Additionally, the main limitations of CFD application in coronary arteries will be discussed in Section 7.
Plaque infiltration and the resulting inward vascular remodeling (according to Glagov’s hypothesis [36]) impact vessel conductance and generate intravascular pressure gradients [3, 37]. In turn, increased vascular resistance impairs coronary flow downstream of the stenosis. This can be quantitatively assessed through invasive measurement in terms of fractional flow reserve (FFR) as ratio between hyperemic distal coronary and aortic pressures: a flow impairment higher than 20% during hyperemia—which translated in a FFR value lower than 0.80—was associated with myocardial ischemia and with adverse clinical outcomes, thus justifying coronary interventions aiming at resolving flow-impairing coronary lesions [8, 38]. The (assumed) linear relationship between coronary flow and pressure under hyperemia condition was empirically verified by the evidence of constant microvascular resistance during maximal pharmacological hyperemia, thus allowing the measurement of epicardial pressure gradients without the interference of variations in microvascular pressure [39, 40]. More recently, non-hyperemic pressure ratio (NHPR) indices have been developed and successfully validated against FFR [41]. Similarly to FFR, NHPRs measure the status of epicardial vessel conductance, but without the need of administration of hyperemic agents. This is possible given the phasic behavior of microvascular resistances along the cardiac cycle and their stabilization in specific phases of the diastole [42, 43].
Both FFR and NHPRs represent valid solutions to assess coronary perfusion in
relationship to the status of epicardial impedance and are highly recommended
from international guidelines for the functional assessment of intermediate-grade
coronary lesions (typically around 40–90% stenosis) [44]. However, given their
invasiveness and the perceived additional procedural time and costs, clinical
uptake of intracoronary pressure measurement remains low (
3D vessel reconstructions based on two or more orthogonal coronary angiograms
were implemented to compute the so-called ‘virtual’ FFR (vFFR) [47]. Pioneering
the field, Morris and colleagues developed and validated an effective CFD
solution for angiography-based vFFR called VIRTUheart
 Fig. 3.
Explanatory case showing the typical output obtained through the
VIRTUheart
Differently from the time-consuming CFD approach, several methods rely on a simplification of the governing equations of fluid motion to describe the hemodynamic features within the coronary artery. The analytical solution of those simpler equations (e.g., Bernoulli’s and Poiseuille’s equations) may provide the needed hemodynamic quantities for fast vFFR computation. Three software solutions based on these methods are currently commercially available in Europe, namely the Cardiovascular Angiographic Analysis System for Vessel CAAS-vFFR (Pie Medical, Maastricht, The Netherlands), the quantitative flow reserve QFR (Medis Medical Imaging, Leiden, The Netherlands and Pulse Medical Technology Inc., Shanghai, China) and the FFRangio (CathWorks Ltd., Kfar-saba, Israel) [52, 53, 54]. In addition to the CE mark, QFR has also received the approval by the US Food and Drug Administration (FDA). Table 1 (Ref. [52, 53, 54, 55, 56, 57, 58, 59, 60, 61, 62, 63, 64, 65, 66]) summaries available clinical evidence for the software mentioned above.
| CFD Solver | Model domain and mathematical solution | Study | Type of Study | Year | Sample size and population studied | Primary endpoint |
| CAAS-vFFR, Pie Medical | Angiography-based 3D-QCA. Analytical equation accounting for viscous and flow separation pressure losses, with empirically determined coefficients. The inlet coronary velocity, derived from patient-specific aortic rest pressure and 3D vessel geometry, is assumed to be preserved along the vessel segment. | FAST I Study [53] | Retrospective, two-centre | 2020 | 100 vessels with intermediate lesions (30–70%DS) from 100 patients with CCS or NSTE-ACS | Agreement against invasive FFR (FFR cut-off |
| r = 0.89, p | ||||||
| BA mean difference: 0.01 | ||||||
| AUC 0.93 [95% CI: 0.88–0.97], p | ||||||
| FAST Extend [55] | Retrospective, two-centre | 2021 | same as FAST I, N = 912 | r = 0.89 | ||
| AUC 0.94 [95% CI: 0.92–0.97] | ||||||
| FAST II Study [56] | Prospective, multicentric | 2021 | same as FAST I, N = 334 | r = 0.74, p | ||
| BA mean difference: 0.003 | ||||||
| AUC 0.93 [95% CI: 0.90–0.96], p | ||||||
| FAST III Study (NCT04931771)/on-going | Non-inferiority RCT (35 European sites) | 2021–2024 | 2228 vessels with intermediate lesions (30–80%DS) in pts with CCS randomized 1:1 towards FFR or vFFR-guided revascularization | Composite of all-cause death, any myocardial infarction, or any revascularization at 1 year post-randomization. | ||
| LIPSIA-STRATEGY (NCT03497637)/on-going | Non-inferiority RCT (7 German sites) | 2020–2021 | 1926 vessels with intermediate lesions (40–80%DS) in pts with stable angina or ACS randomized 1:1 towards FFR or vFFR-guided revascularization | Composite of cardiac death, non-fatal myocardial infarction, or any unplanned revascularization at 1 year post-randomization. | ||
| QFR, Medis Medical Imaging Pulse Medical Imaging | Angiography-based 3D-QCA. Analytical equations based on a quadratic relationship between pressure drop and hyperaemic flow velocity. Similar coronary flow velocity at inlet and outlet BCs. Absence of pressure losses along normal coronary segments. Empiric hyperaemic flow velocity of 0.35 m/s (fQFR). TIMI frame counting-derived contrast velocity at baseline (cQFR) and under hyperaemia (aQFR). | FAVOR Pilot Study [57] | Prospective, multicentric | 2016 | 84 vessels with intermediate lesions (30–80%DS) from 73 patients with CCS | Agreement cQFR against invasive FFR (FFR cut-off |
| r = 0.77, p | ||||||
| BA mean difference: 0.001 | ||||||
| AUC 0.92 [95% CI: 0.85–0.97] | ||||||
| Stähli et al. [58] | Retrospective, single-centre | 2018 | 516 vessels with intermediate lesions (40–70%DS) from 436 patients with CCS | r = 0.82, p | ||
| BA mean difference: 0.01 | ||||||
| AUC 0.86 [95% CI: 0.83–0.89] | ||||||
| FAVOR II Europe-Japan [59] | Prospective, multicentric | 2018 | 317 vessels with intermediate lesions (30–80%DS) from 329 patients with CCS | r = 0.83, p | ||
| BA mean difference: 0.01 | ||||||
| AUC 0.92 [95% CI: 0.89–0.96], p | ||||||
| FAVOR III China [60] | Superiority RCT (26 Chinese sites) | 2021 | 3825 vessels with intermediate lesions (50–90%DS) in pts with CCS or ACS randomized 1:1 towards angiography- or QFR-guided revascularization | Composite of death from any cause, myocardial infarction, or ischaemia-driven revascularisation at 1 year: | ||
| QFR-guided group: 5.8% | ||||||
| Angiography-guided group: 8.8% | ||||||
| HR 0.65 [95% CI: 0.51–0.83], p = 0.0004, driven by fewer myocardial infarctions and ischaemia-driven revascularisations | ||||||
| FAVOR III Europe-Japan (NCT03729739)/on-going | Non-inferiority RCT (40 international sites) | 2018–2023 | 2000 vessels with intermediate lesions (30–80%DS) from patients with CCS randomized 1:1 towards FFR- or QFR-guided revascularization | Composite of death from any cause, any myocardial infarction, or any unplanned revascularization at 1 year post-randomization. | ||
| FFR |
Angiography-based 3D coronary tree reconstruction (including bifurcations). Analytical equation based on Poiseuille’s law. | Pellicano et al. [54] | Prospective, multicentric | 2017 | 203 vessels with intermediate lesions (50–90%DS) from 184 patients with CCS | Agreement against invasive FFR |
| (FFR cut-off | ||||||
| r = 0.88, p | ||||||
| BA mean difference: 0.007 | ||||||
| AUC 0.93 | ||||||
| FAST-FFR Study [52] | Prospective, multicentric | 2018 | 319 vessels with intermediate lesions from 301 patients with CCS | r = 0.80, p | ||
| BA mean difference: 0.01 | ||||||
| AUC 0.94 [95% CI: 0.92–0.97] | ||||||
| FFR |
CTCA-based 3D coronary tree reconstruction (including bifurcations). Coronary flow derived from ventricular mass. BCs as lumped parameter models of aortic inlet, and coronary microcirculation. | DISCOVER-FLOW [61] | Prospective, multicentric | 2011 | 159 vessels with lesions |
Agreement against invasive FFR |
| (FFR cut-off | ||||||
| r = 0.72, p | ||||||
| BA mean difference: 0.02 | ||||||
| AUC 0.90 | ||||||
| DeFACTO [62] | Prospective, multicentric | 2013 | 82 vessels with 30–70%DS (intermediate stenosis) from 82 patients with CCS | Agreement against invasive FFR (FFR cut-off | ||
| r = 0.50, p | ||||||
| BA mean difference: –0.05 [–0.25 to 0.15] | ||||||
| AUC 0.71 [95% CI: 0.58–0.83] | ||||||
| NPV 0.91 [95% CI: 0.80–0.97] | ||||||
| PLATFORM [63] | Prospective, multicentric | 2016 | 584 patients with 20–80% likelihood of CAD and |
Composite of death, myocardial infarction and unplanned revascularization at 1 year: | ||
| FFR | ||||||
| Angiography-guided group: 1.07% | ||||||
| Lower costs and same QoL in CTCA+FFR | ||||||
| ADVANCE [64, 65] | Prospective, multicentric | 2020 | 4288 patients with CCS who underwent CTCA and have 1 year data available | Composite of death, myocardial infarction and ACS leading to urgent revascularization at 1 year: | ||
| FFR | ||||||
| P3 Trial [66] | Prospective, multicentric | 2022 | 123 vessels with FFR |
Agreement between post-PCI FFR | ||
| BA mean difference: 0.02 | ||||||
| Abbreviations: 3DQCA, Three-dimensional Quantitative Coronary
Angiography; ADVANCE, Assessing Diagnostic Value of Non-invasive FFR | ||||||
From the technical viewpoint, CAAS-vFFR uses angiography-based 3D vascular models without reconstruction of side branches [53]. The user is requested to provide the invasively measured aortic root pressure [53]. Next, to compute the CAAS-vFFR the pressure drop along the vessel segment of interest under hyperemic condition is instantaneously calculated by solving a simplified fluid dynamics equation accounting for pressure losses due to viscous friction of the blood flowing through the narrowed vessel and pressure losses due to flow separation downstream from the narrowing, with empirically determined coefficients [67].
Similarly, 3D side branch-free vessel reconstructions are employed by QFR for the vFFR computation [57]. The algorithm automatically divides the reconstructed vessel into equally spaced consecutive segments and estimate the pressure drop for each segment as a quadratic function of the hyperemic flow velocity, with coefficients dependent on the stenosis geometry. By assuming a fixed mean hyperemic coronary flow velocity of 0.35 m/s [68], the algorithm generates an initial output, called ‘fixed-QFR’ (fQFR). To improve patient-specificity, the software allows applying the TIMI frame counting analysis—as related to vessel flow velocity [69]—and to obtain the contrast-QFR (cQFR) at non-hyperemic conditions or the adenosine-QFR (aQFR) after intravenous administration of adenosine [68]. cQFR was shown to be superior to both fQFR and aQFR [57].
Differently from CAAS-vFFR and QFR, vessel geometrical reconstructions for
FFRangio include bifurcations with side branches with diameter
The application of CFD to non-invasive imaging modalities to predict blood flow
and lesion-specific FFR preceded the development of angiography-derived FFR
software (see Table 1). Taylor and colleagues [70] provided the first example of
virtual fractional flow reserve derivation from CTCA, the so-called FFR
 Fig. 4.
Two case examples showing the results of the HeartFlow CFD based tool
for the computation of the virtual fractional flow reserve from CTCA (i.e., the
FFR
Clinical evidence proved higher per-vessel diagnostic performance for FFR
More recently, alternative solutions based on magnetic resonance angiography
(MRA) have been also proposed. Contrast-enhanced ECG-gated 3T magnetic resonance
scanners were used to produce 3D coronary images with a resolution of 0.64
Blood flow velocity relates to general physical laws governing balance among fluid forces. Ideally, undisturbed blood flow crossing a straight coronary segment presents the general characteristics of laminarity with co-axiality of the flow velocity vectors pointing to the same direction and decremental magnitude towards vessel walls where the blood interacts with the endothelial surface. In this condition, the blood velocity profile is axial-symmetric at each vessel cross-section. However, any deviations from straight vessel geometry markedly impact coronary flow patterns. In particular, the presence of curvature imparts a displacement of the location of the maximum velocity with respect to the vessel, in consequence of the vessel curvature-generated centrifugal force acting on the streaming blood. The deflection of the maximum peak velocity from the centerline (as in the classical Poiseuille flow) to the outer side of the curved vessel is the consequence of the balance between the centrifugal force, the viscous forces exchanged by the wall with blood and of the pressure gradient generating radially on the vessel cross-section, which leads to the establishment of the so-called secondary flows on the vessel cross-section. The composition of the two blood flow components, the one along the main flow direction (through-plane component) with the secondary flows (in-plane component) leads to the production of fully 3D blood flow patterns characterized by helical motion. The described phenomenon is exacerbated by the presence of bifurcations and side branches. As a result, flow disturbances are generated close to the internal and external vascular walls facing the carina [80], where blood flow separation and reattachment to the vessel wall, stagnation and recirculation may occur. Such flow disturbances are recognized as aggravating flow events related to the atherosclerotic disease onset/development [81, 82]. In other cases, vascular remodeling may occur, disrupting the smooth interface between blood flow and endothelium. Typically represented by coronary atherosclerotic plaques, these anatomical elements shape the local hemodynamics imparting multidirectionality and flow disturbances. Depending on the level of luminal protrusion, the local hemodynamics may be altered not only ‘near-wall’ but also in the bulk region of the vessel.
Differently from intracoronary pressure gradients, an invasive assessment of velocity vector fields and shear forces generated by the interaction between the viscous flowing blood and coronary arteries wall is at the moment elusive [23]. Personalized computational simulations have the potential to bridge this gap, providing a reliable quantification of the velocity field and shear forces after verification, validation, and uncertainty quantification of coronary models [83]. Currently, the application of CFD simulations for the characterization of flow patterns in human coronary arteries remains a subject of research. Commercial software solutions for clinical use are still not available.
In Sections 6.1 and 6.2, computationally derived biomechanical quantities describing the near-wall and intravascular flow patterns are discussed. Focus is centered on their role in understanding of atherosclerotic pathophysiology and their clinical application.
The interaction between the viscous blood and the vessel wall imparts at the
blood-endothelium interface a state of stress, i.e., a force per unit surface.
Analytically, the vector resultant of those frictional forces applied to a given
endothelial unit area and with orientation tangential to the luminal surface is
defined as wall shear stress (WSS), measured in N/m
In regions of disturbed shear forces, such as near arterial bifurcations, the
long-term exposure to low WSS values (typically
Conversely, high WSS magnitude values (typically
Notably, areas of low and high WSS may be contiguous. Low WSS surface areas are
typically located at inner curvatures, at the waist of bifurcations or downstream
of a stenosis (Fig. 5A). Conversely, high WSS surface areas are located at outer
curvatures, at the flow divider of bifurcations, upstream or at the lesion throat
(Fig. 5A) [6, 12]. For this reason, the interpretation of WSS values in absolute
terms only could be misleading, and its contextualization in a proper
physiological context is mandatory. As a consequence, in addition to the
traditional time-average WSS (TAWSS, namely the WSS magnitude averaged along the
cardiac cycle) [23], several WSS-based quantities have been introduced/tested,
aiming at quantifying different features of the WSS profile, with particular
attention to its multidirectionality and magnitude variability along the cardiac
cycle (Fig. 6) [92, 93, 94]. For instance, WSS-based quantities were proposed
describing (i) the degree of flow reversal (oscillatory shear index, OSI) [95],
(ii) the near-wall solute residence time (relative residence time, RRT) [96],
(iii) the multidirectional character of the disturbed blood flow through the
quantification of the cycle-averaged WSS component orthogonal to the mean WSS
vector direction (transverse WSS, transWSS) [97], or (iv) the variability of
contraction/expansion action of endothelial shear forces along the cardiac cycle
(topological shear variation index, TSVI) [98] (Fig. 5B). High OSI (
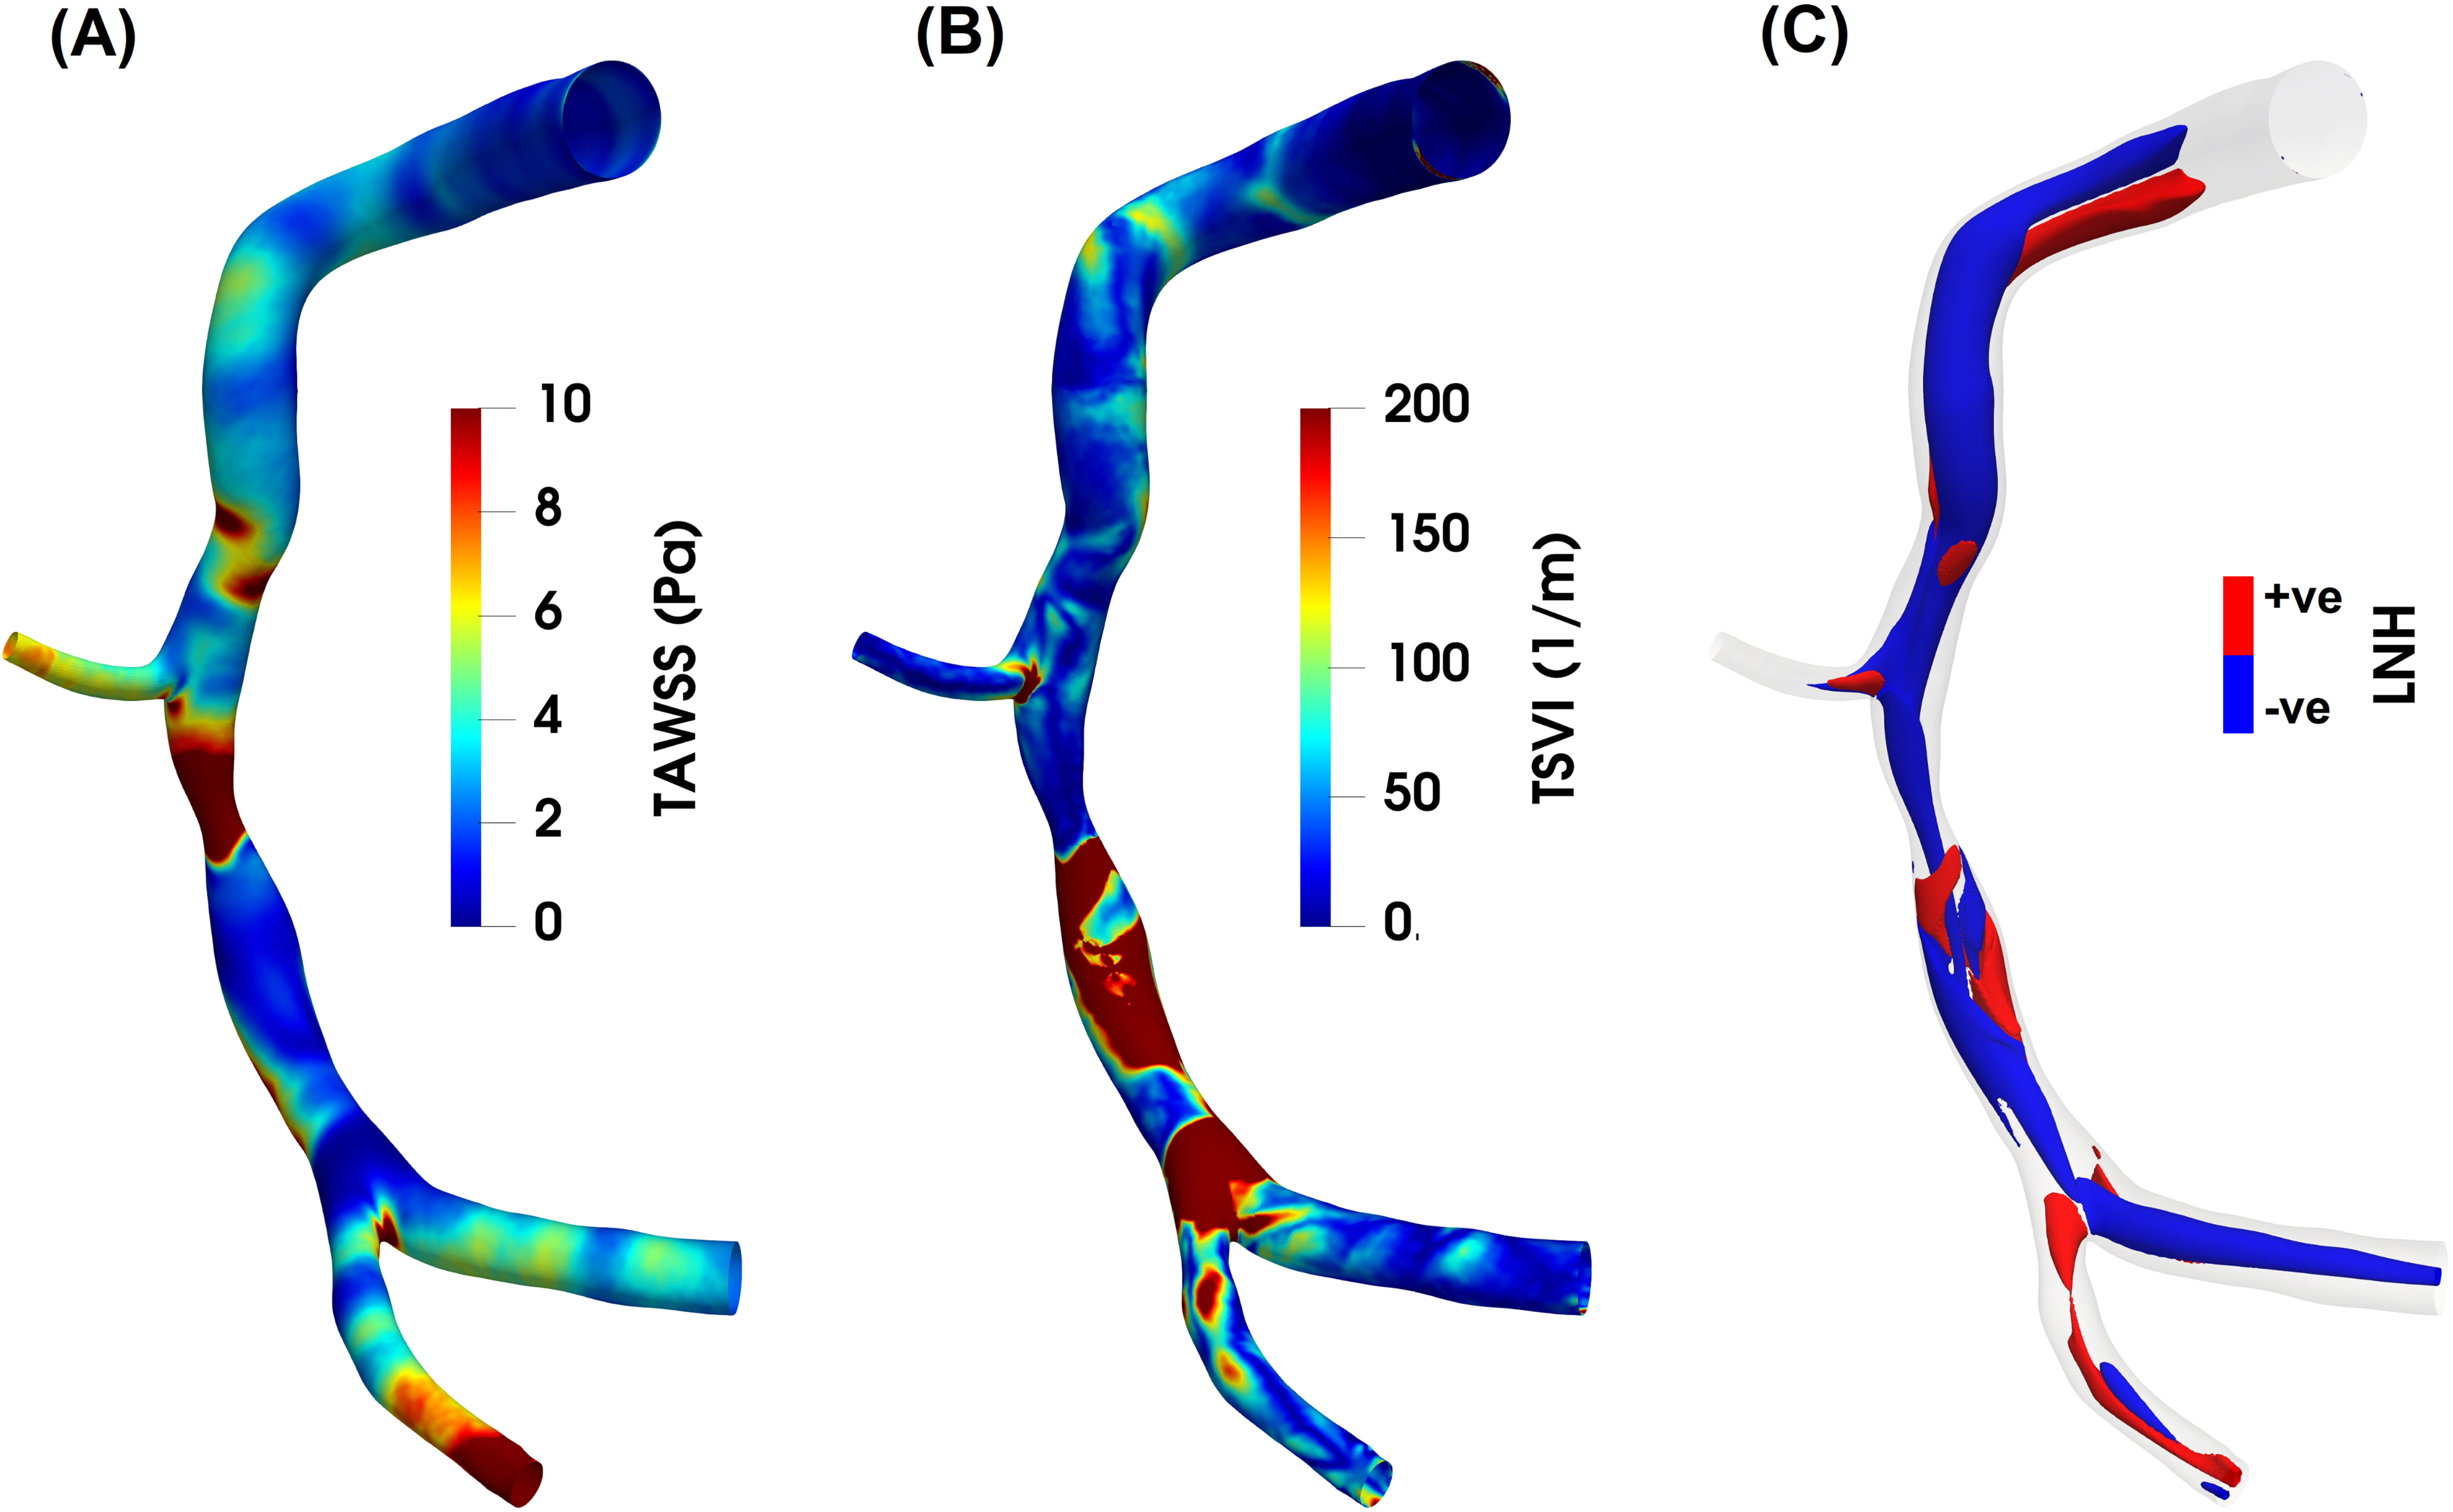 Fig. 5.
Luminal maps of (A) time-average wall shear stress (TAWSS), (B) topological shear variability index (TSVI) and (C) cycle-average local normalized helicity (LNH) for an explanatory diseased right coronary artery model. As expected, high TAWSS values characterize the stenotic region of the coronary artery, while low TAWSS are present downstream of the stenosis (panel A). As for the TSVI, a high variability in WSS contraction/expansion action at the endothelium during the cardiac cycle clearly emerges downstream of the stenosis, at the bifurcation region and at the side branch (panel B). Counter-rotating helical flow structures develop in the intravascular region of the coronary model here reported (panel C). Right-/left- handed helical blood patterns are identified by positive/negative LNH values and displayed in red/blue, respectively. The diseased right coronary artery belongs to a patient recruited during the RELATE clinical trial (ClinicalTrials.gov Identifier: NCT04048005).
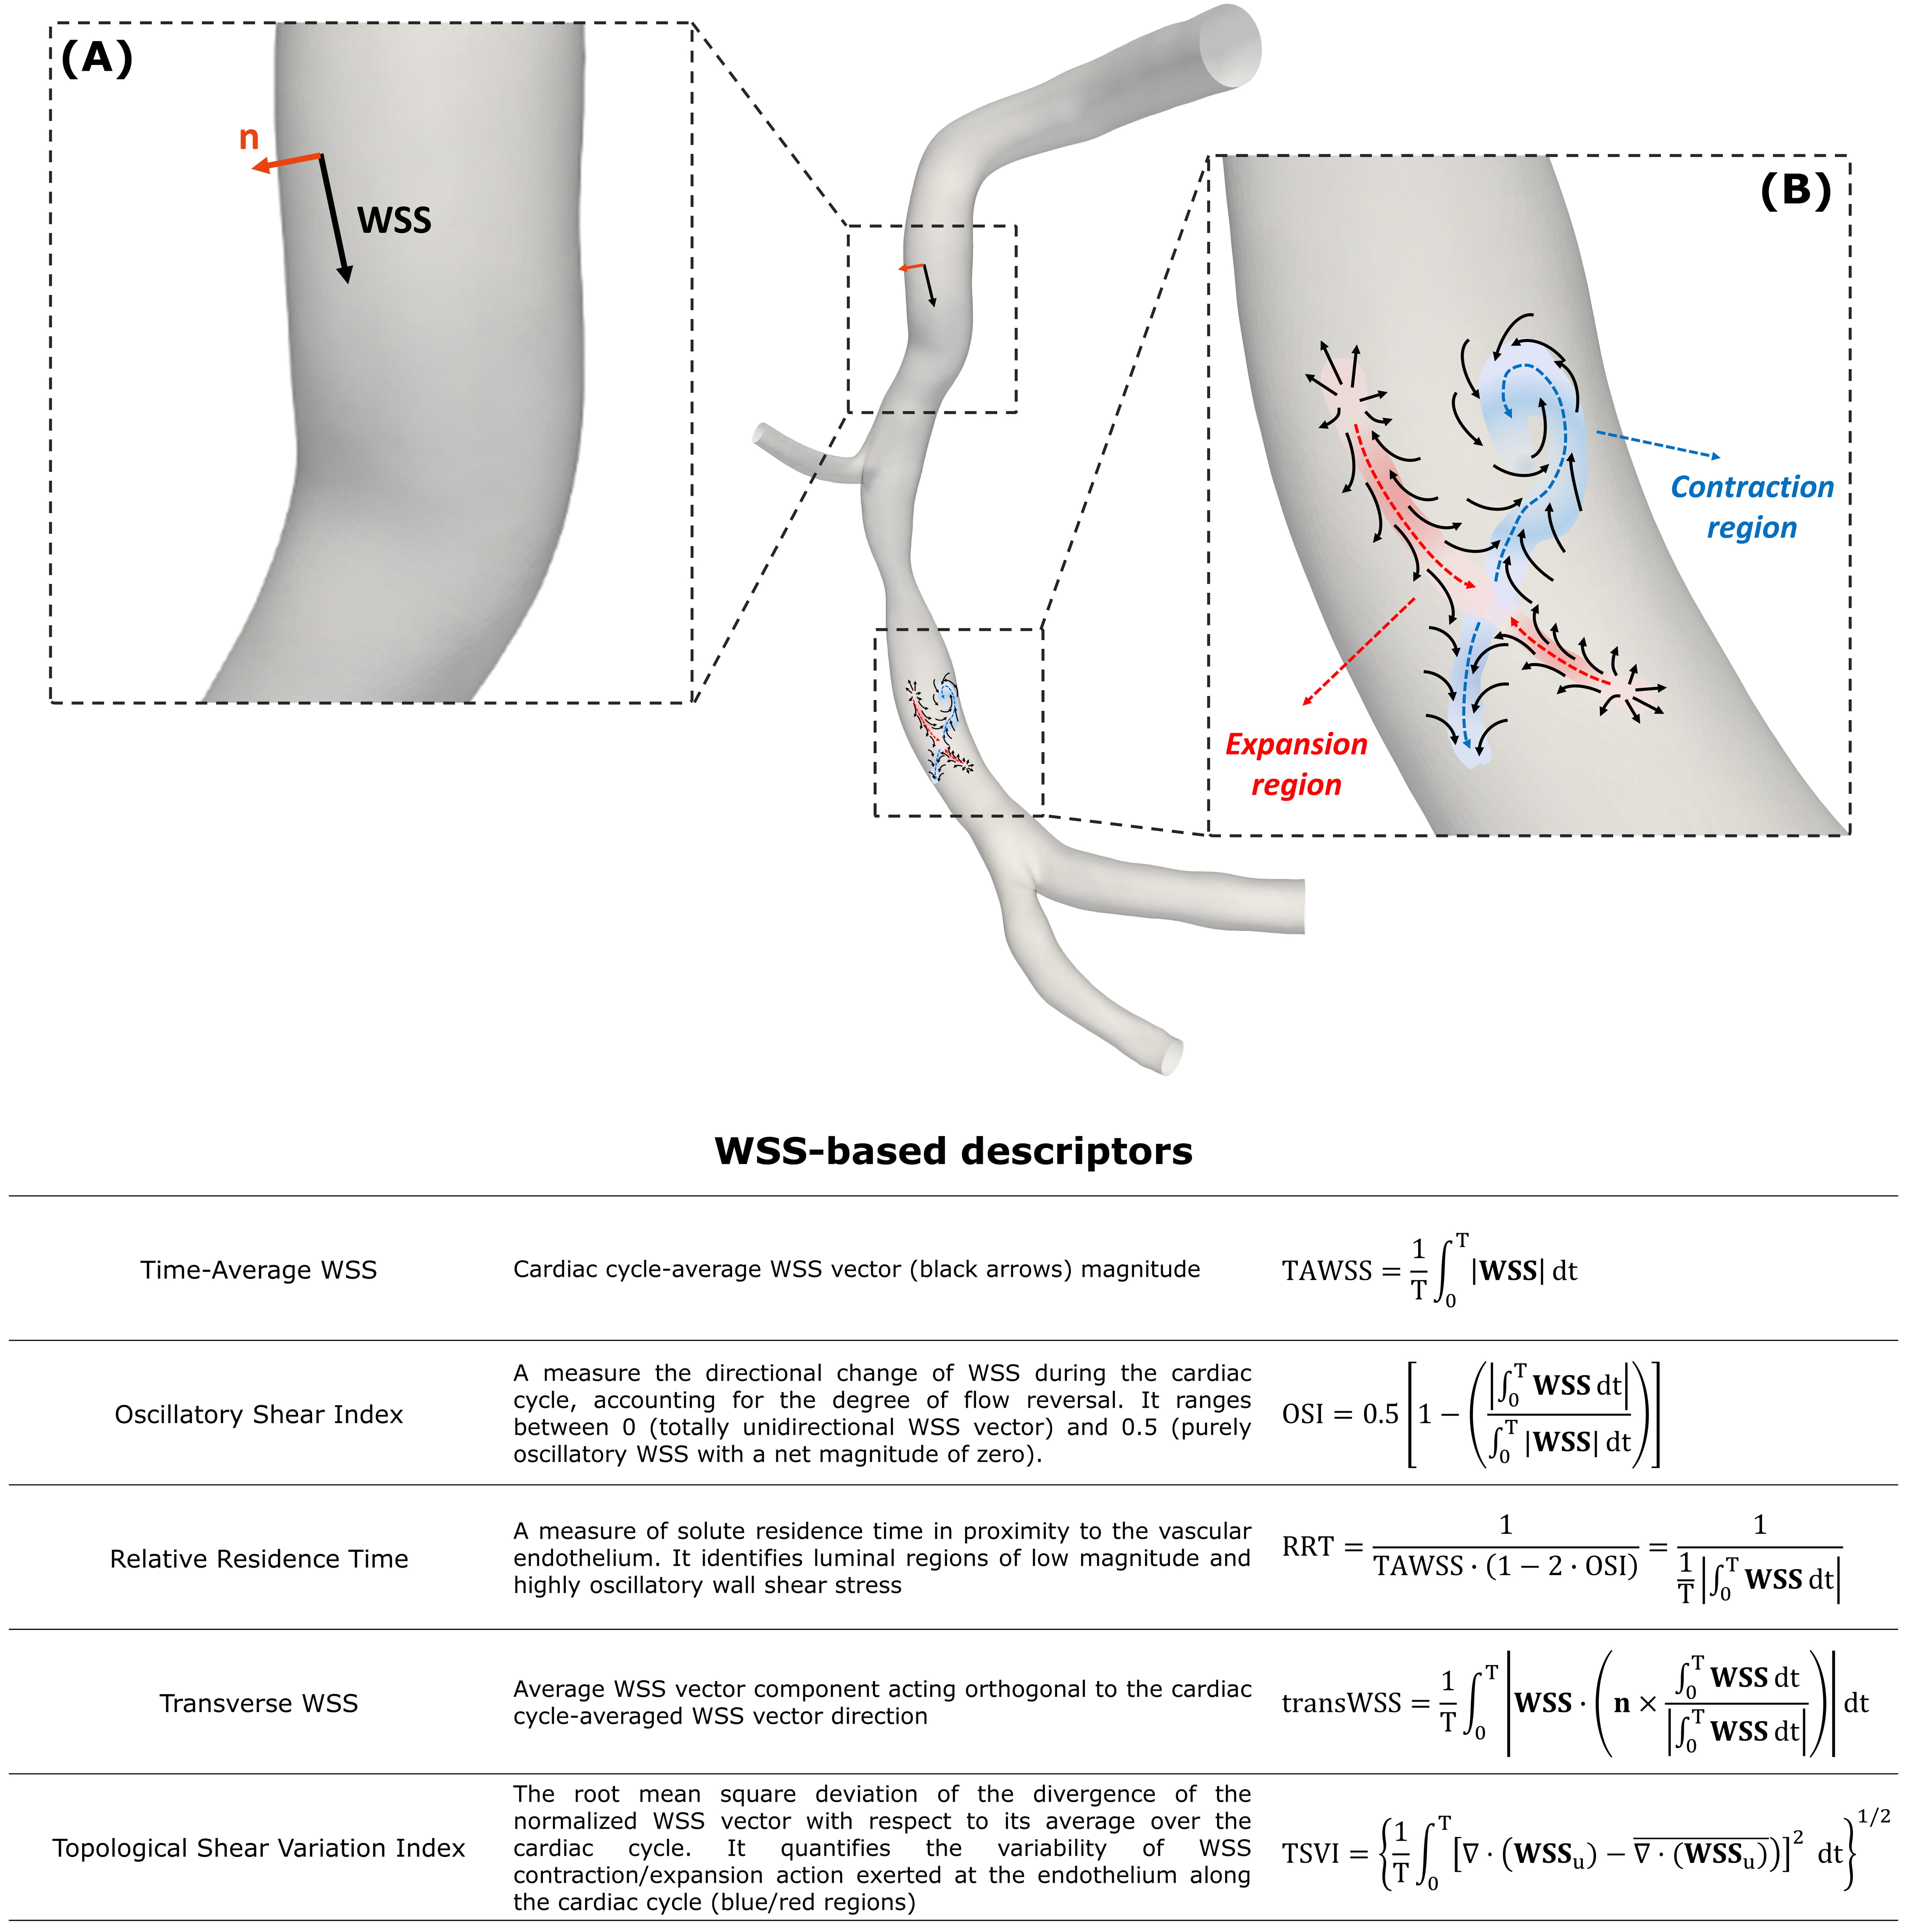 Fig. 6.
Near-wall hemodynamic descriptors. (A) Example of WSS
vector acting on a generic point at the luminal surface (black arrow) of a
diseased right coronary artery. At the same point, the unit vector n
normal to the vessel wall is reported (orange arrow). (B) Explanatory maps of WSS
vector field (black arrows) with identified contraction/action regions at the
luminal surface of the same artery coloured by blue/red, respectively. The
diseased right coronary artery belongs to a patient recruited during the RELATE
clinical trial (ClinicalTrials.gov Identifier: NCT04048005). The table at the
bottom reports the WSS-based descriptors of disturbed flow. For each descriptor,
a short caption together with the mathematical formulation is reported. T is the
cardiac cycle; WSS
Besides the role of WSS, distinguishable intravascular flow features have also been suggested to markedly impact the atherosclerotic disease natural history. Previous studies have clearly revealed that (i) arterial blood flow, under physiological conditions, is helical and (ii) the associated helicity intensity is instrumental in suppressing arterial flow disturbances in ostensibly healthy arteries, being thereby potentially protective for atherosclerotic lesions at the early stage [103, 104, 105, 106, 107, 108, 109].
The analysis of arterial helical flow patterns can be provided by using the local normalized helicity (LNH) [108]. This hemodynamic quantity, defined as the cosine of the angle between the local velocity and vorticity vectors, allows for the identification of the rotating direction of helical fluid structures based on its sign (i.e., positive—right-handed; negative—left-handed) (Figs. 5C,7). Recent evidence, based on the visualization of intravascular LNH iso-surfaces, has pointed out that helical flow is a feature characterizing the physiological intravascular hemodynamics of healthy coronary arteries [103, 110]. The topology of coronary helical flow structures strongly depends on the vessel geometry (i.e., curvature, torsion, bifurcations, presence of stenosis), which may affect their generation, transport, and intensity along the arterial length [111].
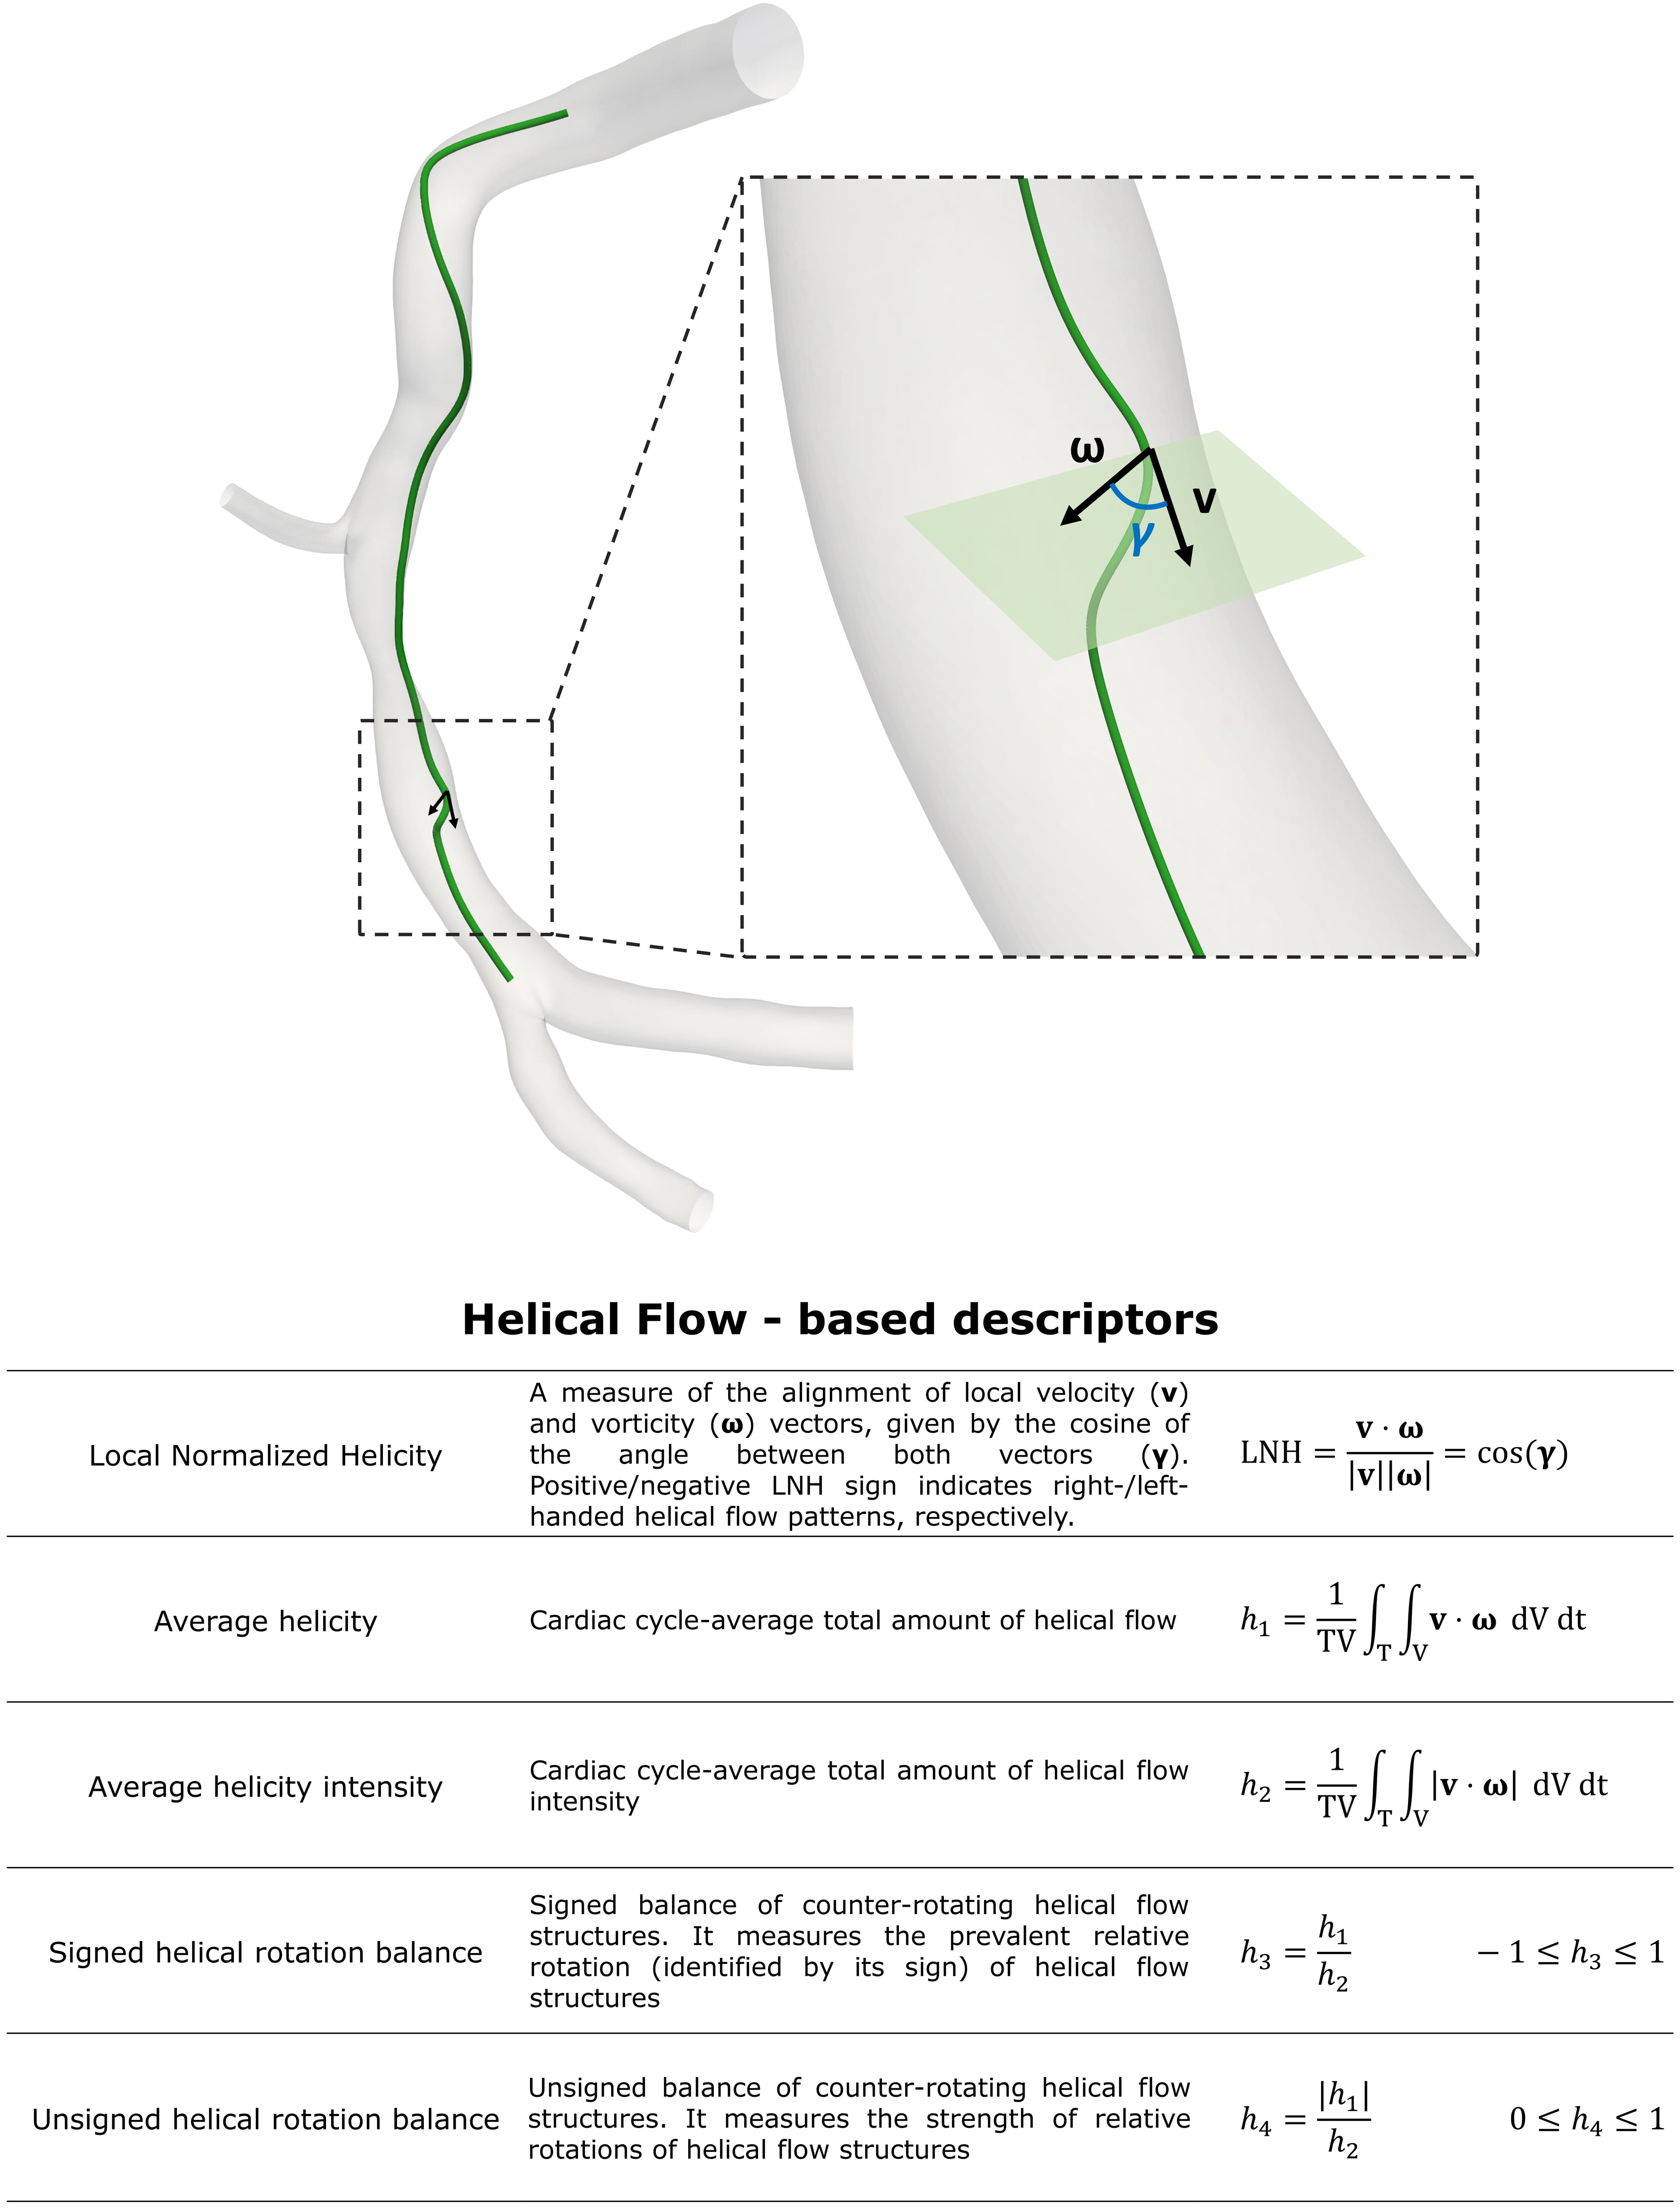 Fig. 7.
Intravascular hemodynamic descriptors. Figure: example of the
helical-shaped trajectory described by an element of blood moving within an
explanatory model of right coronary artery. This diseased artery belongs to a
patient recruited during the RELATE clinical trial (ClinicalTrials.gov
Identifier: NCT04048005).
A quantitative characterization of helical flow in terms of strength, size and
relative rotational direction can be obtained by several helicity-based
descriptors, named as h indices (Fig. 7) [92, 93, 94, 105]. In detail, cycle
averaged helicity (h
All these aspects together with the clinical feasibility of helical pattern quantification—at least in large arteries—by means of four-dimensional (4D) flow PC-MRI have stimulated the interest on the use of helical flow as a potential surrogate marker for the atherosclerotic risk at the early stage. The in vivo measurements of intravascular fluid quantities such as helical flow, which are less sensitive to noise, lumen edge definition, spatial and temporal resolution than in vivo WSS assessment [112, 113], could be a novel surrogate determinant of plaque vulnerability. In the near future advances in clinical imaging (e.g., applying 4D flow PC-MRI sequences properly developed to measure coronary blood flow) [114] and online CFD analysis are indeed expected to allow non-invasive in vivo-based prediction of coronary atherosclerotic or plaque rupture risk based upon helicity-based descriptors [12, 115].
Despite recent developments, intracoronary computational hemodynamics simulations still present several criticalities hampering their clinical usability.
Firstly, considering that ‘vessel geometry shapes the flow’ [12], a reliable personalized CFD simulation requires accurate 3D reconstruction of the coronary artery lumen. Hence, inaccuracy in the vascular tracing, inadequate space resolution or blooming artifacts (especially for CTCA-based modalities) might affect the reconstructed vascular geometry [116]. This is even more critical in case of bifurcations, where daughter vessels lie on different spatial planes and geometrical reconstructions based on two ICA projections could be therefore inaccurate [117]. Moreover, additional manual corrections are often required for the contouring of the polygon of confluence of coronary bifurcations [118]. Ideally, an accurate 3D vessel reconstruction could be achieved using intravascular imaging techniques, such as IVUS or OCT. However, invasiveness, the limitation to measure one vessel at a time, and costs advocated the exploration of alternative imaging modalities, namely CCTA and ICA, to perform CFD simulations for clinical applications. While adopted for intracoronary pressure gradient evaluation, the use of CCTA in CFD modelling for the characterization of flow patterns and shear forces is limited because of the low image resolution and presence of artifacts. Nevertheless, the potential utility of CCTA-derived CFD for the identification of high-risk plaques was successfully validated in the EMERALD study [119]. Recently, angiography-based CFD simulations were also applied in human coronary arteries with promising results for the quantification of the WSS patterns [90, 91]. Validation against IVUS and OCT, used as ground-truth, is in process [116, 120].
Secondly, the definition of BCs, which highly impact the final results of the CFD simulations, is challenging and presents a high degree of uncertainty because intracoronary flow measurements are seldom executed in the clinical routine and often characterized by low accuracy and repeatability, thus requiring the use of theoretical assumptions and/or idealizations [121, 122, 123, 124]. When clinical measurements are available, a patient-specific approach to define inlet/outlet BCs should be preferred to generalized/estimated ones, which might result in not realistic profiling of flow disturbances, especially near side branches and curvatures where atherosclerotic plaques preferentially develop [123, 124]. Furthermore, the heterogeneity in their definition can often preclude comparison of the results from different studies.
Thirdly, computational time needed to execute CFD simulations varies according to model complexity, spatiotemporal discretization, tracing length and computer characteristics, precluding in most cases the ‘on-line’ execution of CFD simulation within the time window of a diagnostic coronary angiogram. Of note, the computational time adds up to the time needed to upload the imaging data and to reconstruct the 3D coronary artery model (e.g., in case of angiographic data, to upload two angiographic projections, to complete the vessel tracing and to obtain the 3D vessel model). Therefore, a higher level of automation is needed to move CFD simulations from the lab to clinical practice. Next generation CFD software are expected to produce reliable coronary hemodynamics simulations within few minutes (or even instantaneously) and with minimal operator interference. In this context, a recent study has shown the clinical use of a prototype commercial software (CAAS Workstation, WSS tool, Pie Medical, Maastricht, The Netherlands) able to provide transient hemodynamic results for mild coronary artery lesions in terms of WSS-based descriptors using angiographic data and CFD modelling in less than 15 minutes [90]. Furthermore, ad hoc programmed artificial intelligence and in particular machine learning algorithms can be trained to predict flow components directly from the coronary imaging and vessel geometry [125, 126, 127], hence bypassing the time-demanding computation of instantaneous intracoronary flow and pressure. This task can be achieved adopting several different strategies: among them we mention the use of physics-informed neural networks that, integrating mathematical equations governing blood flow with very few patient-specific measurement points within a flexible deep learning framework, have already demonstrated to improve WSS quantification in diseased arterial flows [128]. Moreover, cloud CFD application may diminish computational time by allowing remote use of high-performance computing clusters, and, if associated with a centralized core laboratory, could favor the quality of the analysis while reducing inter-operator variability. On one hand, all this will facilitate clinical application of CFD simulations. On the other hand, it will push the boundaries of intracoronary biomechanics simulations even further. In fact, recent modelling strategies are combining plaque structural stress and strain with hemodynamic shear stress, thus providing a more comprehensive analysis of the local biomechanics exerted on plaques or vascular components, essential in understanding plaque vulnerability and in predicting results after coronary interventions [129].
Lastly, in order to justify the routine clinical application of CFD simulations in the catheterization laboratories, more robust clinical evidence for CFD results is advocated. To this aim, the execution of randomized trials is required to confirm the relationship between CFD results (with particular reference to the near-wall and intravascular hemodynamic quantities) and clinical outcomes, and ultimately to define the role of CFD simulations in clinical practice. Additional technologies, such as augmented reality and more immersive user interface, might also play a role towards the clinical use of these modalities, offering a more intuitive reading of intracoronary flow specifics to physicians [130].
CFD models of coronary hemodynamics allow a far-deeper understanding of the
critical relationship between intracoronary flow, vascular anatomy and plaque
composition. In fact, the interplay between biology (patient risk profile,
genetics and congenital vascular anatomy), intravascular pressure gradients and
specific flow patterns has proven effects on atherogenesis, plaque composition
and destabilization, as outlined in the ‘hemodynamic risk hypothesis’ [3, 12].
This gained basic knowledge has stimulated CFD based clinical applications,
providing physicians with reliable non-invasive tools for intracoronary pressure
gradients estimation as well as the quantitative assessment of intracoronary
shear forces on the endothelium and their link with functional plaques
characterization and vulnerability assessment, to be used for predictive
purposes. Moreover, CFD application might entail also procedural planning (e.g.,
post-PCI FFR
Overcoming current technical challenges with modern technologies will allow for quicker and more reliable computational solutions, which, validated in the proper clinical settings, will ultimately favor a wider use of a physiology-based lesion evaluation in the clinical practice, with expected benefit for patients and financial gain.
AC discloses receiving research grants and consulting fees from Medyria AG (Winterthur, Switzerland).
AC, GDN—literature search and manuscript preparation; MLR, FD, GMDF, DG—literature search and manuscript revision; UM—literature search, manuscript revision, and supervision; CC—literature search, manuscript preparation, manuscript revision, and supervision. All authors read and approved the final manuscript.
Not applicable.
We would like to express our gratitude to all those who helped us during the writing of this manuscript. Thanks to all the peer reviewers for their opinions and suggestions.
This work has been supported by the Italian Ministry of Education, University and Research (FISR2019_03221, CECOMES).
The author declares no conflict of interest. Fabrizio D’Ascenzo is serving as one of the Editorial Board members of this journal. We declare that Fabrizio D’Ascenzo had no involvement in the peer review of this article and has no access to information regarding its peer review. Full responsibility for the editorial process for this article was delegated to Jerome L. Fleg.
References
Publisher’s Note: IMR Press stays neutral with regard to jurisdictional claims in published maps and institutional affiliations.