


 , Eduardo I.C. Beltrão 1,2,*
1 Biomarkers in Cancer Research Group (BmC) - Federal University of Pernambuco (UFPE), 50670-901 Recife, Brazil
2 Department of Biochemistry- Federal University of Pernambuco (UFPE), 50670-420 Recife, Brazil
3 Instituto de Investigação e Inovação em Saúde, Universidade do Porto, 4200-135 Porto, Portugal
4 Institute of Molecular Pathology and Immunology, University of Porto, 4200-135 Porto, Portugal
5 Institute of Biomedical Sciences Abel Salazar, University of Porto, 4050-313 Porto, Portugal
6 Faculty of Medicine, University of Porto, 4200-319 Porto, Portugal
email: ebeltrao@hotmail.com (Eduardo IC Beltrão)
Abstract
Gene expression studies aimed at analyzing cancer cells under hypoxia and serum deprivation conditions show major potential for understanding molecular mechanisms associated with tumor progression as well as resistance to antitumor agents. To the best of our knowledge, a study for the identification of appropriate housekeeping genes in breast and lung cancer cells under hypoxia and serum deprivation conditions is currently missing. Given the relevance of a reliable and accurate normalization, we herein aimed to identify the appropriate housekeeping genes for breast and lung cancer cell lines cultured under hypoxia and/or serum deprivation. The stability of five commonly used housekeeping genes (ACTB, $\beta $2M, GUSB, 18S rRNA, and PPIA) was assessed after reverse-transcription quantitative real-time PCR in MDA-MB-231 and NCI-H460 cancer cell lines using GeNorm, NormFinder and BestKeeper software. GeNorm and NormFinder ranking revealed ACTB, GUSB and PPIA as the most stable genes for both tumor cell lines. Our results support the use of ACTB/PPIA for MDA-MB-231 and GUSB/PPIA for NCI-H460 cells as the most stable combination for normalization of gene expression under hypoxic and serum deprivation conditions. Our results highlight the importance of the selection of the housekeeping genes in cancer cells subjected to different physiological stresses, such as hypoxia and serum deprivation.
Keywords
- Breast cancer
- Housekeeping genes
- Hypoxia
- Lung cancer
- RT-qPCR
- Serum deprivation
Abbreviations
ACTB: $\beta $-Actin;
$\beta $2M: $\beta $2-microglobulin;
Ct: Cycle threshold;
CV: Coefficient of variation;
DMEM: Dulbecco's modified Eagle's medium;
FBS: Fetal bovine serum;
GUSB: $\beta $-glucuronidase;
HKG: Housekeeping genes;
H10: Hypoxia in DMEM/10% FBS;
H0: Hypoxia/without FBS;
N10: Normoxia in DMEM/10% FBS;
N0: Normoxia in DMEM/without FBS;
PPIA: Peptidylprolyl isomerase A;
r: Pearson correlation coefficient;
R2: Correlation coefficient;
RT-qPCR: Real-time quantitative PCR;
SD: Standard deviation;
18S: 18S ribosomal RNA.
The sensitivity and reproducibility of the RT-qPCR technique to measure transcript abundance and to detect differences in gene expression[1,2] has made it an essential tool in several laboratories dedicated to biomedical research. RT-qPCR is frequently employed to understand the mechanisms leading to disease and to search for novel biomarkers and therapeutic strategies[3]. Therefore, housekeeping genes (HKG), known for their abundant and stable expression with the independence of the model and the experimental conditions applied, are used to minimize methodological errors and to ensure the correct quantification of the gene expression[4,5]. Recent studies have proven that there is no universal HKG for RT-qPCR analysis since the stability of HKG can be altered by several factors such as the model system under study and the experimental conditions employed[6,7]. Hypoxia and serum deprivation are among the experimental conditions that can lead to modulation of HKG expression[8,9,10,11].
For decades, the abundance and stable expression of some structural and metabolism-related genes were the first choice as expression gene normalizers, without any stability analysis in the assessed context[6,7]. In order to evaluate the stability of candidate genes and to avoid inaccurate normalizations, several mathematical approaches have been developed to select the best HKG for RT-qPCR analysis. GeNorm, NormFinder and BestKeeper are among the most frequently used algorithms. To determine the stability (M value) of each candidate, GeNorm is based on the geometric mean. The highest stability is defined by values of M $<$ 1.5[12,13,14]. NormFinder defines the stability of each candidate and the ideal number of reference genes considering both intra- and inter-specific variations between groups[15]. Similar to GeNorm, genes with the lowest M value are considered to be the most stable ones[15,16]. BestKeeper determines the correlation coefficient (r) of each candidate gene based on the standard deviation (SD) and the coefficient of variation (CV). Values of SD [$\pm $ CP] $<$ 1 and SD [$\pm $ x-fold] $<$ 2 are associated with an r value closer to 1, indicating the most stable gene[17].
Since hypoxia and serum deprivation are conditions that resemble the context of the in vivo tumor microenvironment[18,19], we decided herein to investigate the best HKG combination for transcript level analysis under these conditions. For this purpose, we analyzed the expression stability of five commonly used HKGs (ACTB, $\beta$2M, GUSB, 18S rRNA and PPIA) in mammary and pulmonary tumor cell line models. To the best of our knowledge, this is the first study evaluating the stability of expression of reference genes in MDA-MB-231 and NCI-H460 cancer cell lines cultured under hypoxic and serum deprivation conditions.
The human tumor cell lines MDA-MB-231 (triple negative breast cancer, ATCC) and NCI-H460 (non-small cell lung cancer, NCI) were used in this study. Cells were cultured in Dulbecco's modified Eagle's medium (DMEM) (Gibco, Life Technologies) supplemented with 10% fetal bovine serum, FBS (Gibco, Life Technologies) with medium renewal every 48 h. Cultures were maintained at 37$^{\circ}$C in a 5% CO$_{2}$ humidified atmosphere. Cultured cells were routinely tested for mycoplasma contamination and cell line identity was confirmed by STR profiling.
MDA-MB-231 and NCI-H460 cells were incubated for 48 h at 37$^{\circ}$C under the following conditions. Control group (N10): normoxia (21% O$_{2}$, 74.7% N$_{2}$, 4.3% CO$_{2})$ in DMEM 10% FBS; N0 group: normoxia (21% O$_{2}$, 74.7% N$_{2}$, 4.3% CO$_{2})$ in DMEM/without FBS; H10 group: hypoxia (1% O$_{2}$, 94% N$_{2}$, 5% CO$_{2})$ in DMEM/10% FBS; H0 group: hypoxia (1% O$_{2}$, 94% N$_{2}$, 5% CO$_{2})$ in DMEM/without FBS. A BINDER C-150 incubator (BINDER GmbH, Tuttlingen, Germany) was used for the hypoxia experiments. The increased expression and the nuclear location of the hypoxia marker HIF-1$\alpha $ validated our hypoxic system[20].
The transcription analysis was performed after forty-eight hours of incubating the cells under the four different conditions (N10, N0, H10 and H0), since in this interval of time no major changes in cell viability were displayed[20]. Total cellular RNA was extracted using the TRIzol Reagent (Invitrogen, USA) according to manufacturer's instructions. RNA concentration and purity were determined by NanoDrop ND 1,000 Spectrophotometer (Nanodrop Technologies Inc, Delaware, USA). Ribosomal RNA band integrity was evaluated using 1% agarose gel electrophoresis. Synthesis of cDNA was carried out only in samples that showed integrity of the 28 S and 18 S rRNA bands and whose 260/280 ratio values ranged from 1.8 to 2.0. The reverse transcription was performed with 3 $\mu$g of RNA, using random primers and the SuperScript® IV Reverse Transcriptase Kit (Invitrogen, USA) following the manufacturer's instructions.
RT-qPCR was performed with 2 $\mu $L of diluted cDNA, 10 $\mu $M of each primer, 5 $\mu $L SYBR® Green Master Mix (1X) (Thermo Fischer Scientific; former Savant, MA, USA) and ultrapure water in a final volume of 10 $\mu $L using the ABI 7500 (Applied Biosystems, Foster City, CA, USA). Two independent experiments and three technical replicates per condition were performed. Negative controls without templates were added for each reaction. Thermal cycling conditions used were as follows: initial denaturing step at 95$^{\circ}$C for 10 min followed by 40 cycles of 15 S at 95$^{\circ}$C and 1 min at 60$^{\circ}$C. Melting curve analyses were performed to ensure the specificities of the amplification reactions.
The HKG candidates of this study were selected according to a panel of reference genes used for RT-qPCR normalization in breast cancer, lung cancer, hypoxia and serum deprivation studies[1,21,22,23,24,25,26]. Five genes were selected: Actin beta (ACTB), $\beta $2-microglobulin (B2M), $\beta $-glucuronidase (GUSB), Peptidylprolyl isomerase A (PPIA) and 18S ribosomal RNA (18S). The efficiency value and correlation coefficients (R$^{2})$ for each primer were calculated with the ABI 7,500 system software. The primer sequences and details of the candidate reference genes are listed in Table.
GeNorm (Version v3.5)[14], NormFinder (Version 20)[15] and BestKeeper (Version 1)[17] softwares were used to evaluate the expression stability of the five HKG candidates. The equation RQ $=$ E$^{\rm -(minCq-sampleCq)}$, suggested by Spiegelaere et al.,[16], was used to calculate and to correct the relative quantities used as GeNorm and Normfinder input. The analysis of the best combinations of HKGs was also performed with the GeNorm and the NormFinder softwares; the Bestkeeper does not provide this information.
RT-qPCR analysis and agarose gel electrophoresis revealed the specificity of each primer through the detection of a single peak in the melting curve and a single band in the gel, respectively. The R$^{2}$ and E values of the five HKG candidates ranged from 0.99--1.00 and 90%--105%, respectively (Table 1).
| Symbol | Gene name | Primer sequences (5’→3’) | Product size/bp | R2 | E(%) |
|---|---|---|---|---|---|
| ACTB | Actin, beta | F: agaaaatctggcaccacacc R: tagcacagcctggatagcaa | 173 | 0.99 | 90 |
| β2M | Beta-2-microglobulin | F: agcgtactccaaagattcaggtt R: atgatgctgcttacatgtctcgat | 206 | 1 | 105 |
| GUSB | Beta-glucuronidase | F: agccagttcctcatcaatgg R: ggtagtggctggtacggaaa | 160 | 1 | 90 |
| PPIA | Peptidylprolyl isomerase A | F: agacaaggtcccaaagac R: accaccctgacacataaa | 118 | 1 | 100 |
| 18S | 18S ribosomal | F: cgccgctagaggtgaaattc R: cattcttggcaaatgctttcg | 67 | 0.99 | 90 |
The variation of mRNA expression levels of each candidate gene was evaluated by mean cycle threshold (Ct) analysis. In both tumor cell lines, these genes had similar expression levels, with 18S being the most abundantly expressed gene, with Ct values ranging from 5.898 to 6.345 (MDA-MB-231) and from 5.771 to 5.896 (NCI-H460). On the other hand, GUSB was the least expressed gene, with Ct values ranging from 22.427 to 22.678 (MDA-MB-231) and from 21.900 to 22.777 (NCI-H460) (Fig.1).
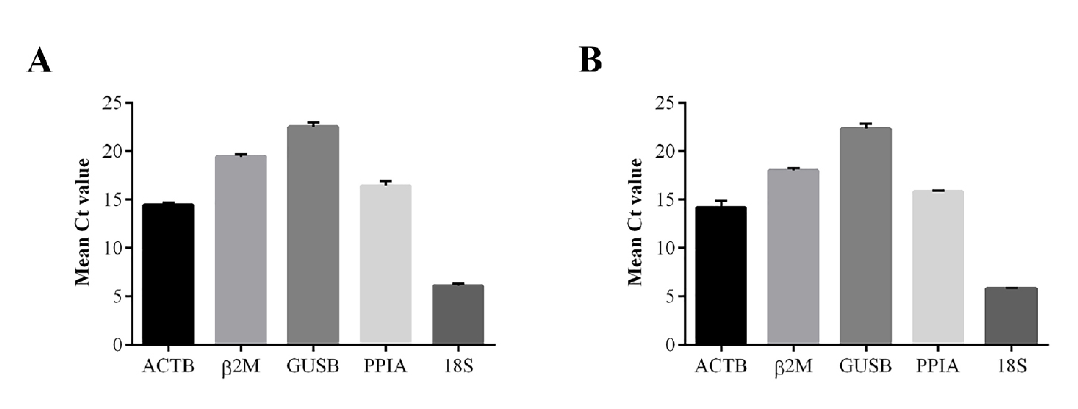 Fig. 1.
Mean Ct values of HKG candidates. (A) MDA-MB-231 and (B) NCI-H460 cells cultured in normoxia with FBS supplementation (21% O$_{2}$, 10% FBS$_{ }$-N10), hypoxia with FBS supplementation (1% O$_{2}$, 10% FBS$_{ }$-H10) and normoxia and hypoxia without FBS supplementation, N0 and H0, respectively, for 48 h. Data are expressed as the mean $\pm $ standard deviation. Ct, threshold cycle.
The GeNorm ranking of the MDA-MB-231 cells revealed that ACTB, PPIA and GUSB were the most stable genes, exhibiting the lowest M values, and 18S and $\beta $2M were the least stable genes, with the highest M values (Fig. 2A). In NCI-H460 cells, GUSB, PPIA and ACTB were the most stable genes and $\beta$2M and 18S were the least stable ones (Fig. 2B). In addition, the GeNorm analysis for the best pair of HKG for normalization revealed ACTB/PPIA, with a combined stability value of 0.04, and GUSB/PPIA, with a combined stability value of 0.03, as the best combinations in MDA-MB-231 and NCI-H460 cells, respectively.
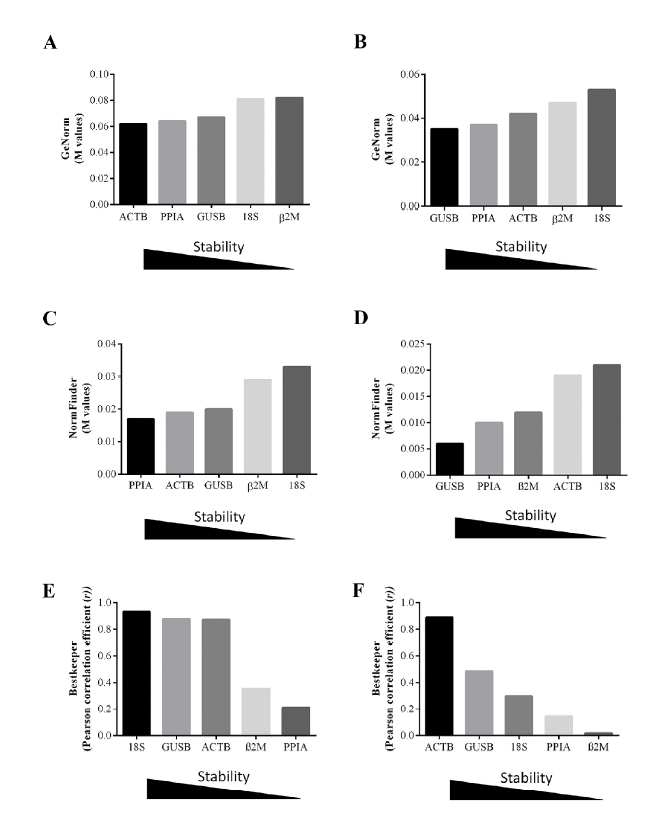 Fig. 2.
Expression stability values of HKG candidates analyzed by GeNorm, NormFinder and BestKeeper softwares. GeNorm average expression stability measures (M) of HKG candidates in MDA-MB-231 (A) and NCI-H460 (B) cell lines. NormFinder ranking of HKG candidates and their expression stability in MDA-MB-231 (C) and NCI-H460 (D) cell lines. Correlation coefficient ($r)$ values of the HKG candidates analyzed by BestKeeper software in MDA-MB-231 (E) and NCI-H460 (F) cell lines.
Gene stability was also ranked by NormFinder, which calculates the variation of the candidate and the variation between subgroups for each sample. The NormFinder ranking identified PPIA as the most stable gene, followed by ACTB and GUSB, in MDA-MB-231 cells (Fig. 2C). In NCI-H460 cells, GUSB, followed by PPIA, were the most stably expressed genes (Fig. 2D). In both tumor cell lines, the most suitable combination of genes was ACTB/18S, with a combined stability value of 0.010 in MDA-MB-231 and of 0.0020 in NCI-H460 cells under normoxic, hypoxic and serum deprivation conditions.
In MDA-MB-231 cells, standard deviation (SD) analysis performed with BestKeeper software showed that the gene with the lowest variation value was $\beta $2M (SD [$\pm $ CP] $=$ 0.19; SD [$\pm $ x-fold] $=$ 1.13) while PPIA exhibited the highest value (SD [$\pm $ CP] $=$ 0.38; SD [$\pm $ x-fold] $=$ 1.28). Correlation coefficient $(r)$ analysis revealed 18S ($r=$ 0.932; $p =$ 0.001), followed by GUSB ($r =$ 0.877; $p =$ 0.001) and ACTB ($r =$ 0.872; $p =$ 0.001), as the best reference genes (Fig. 2E). In NCI-H460 cells, the lowest variation value (SD [$\pm $ CP] $=$ 0.08; SD [$\pm $ x-fold] $=$ 1.05) was observed in 18S, while ACTB exhibited the highest variation value (SD [$\pm$ CP] $=$ 0.57; SD [$\pm $ x-fold] $=$ 1.44). However, the correlation coefficient $(r)$ revealed ACTB as the best reference gene ($r =$ 0.888; $p =$ 0.001) in these cells (Fig. 2F). To evaluate the correlation of each HKG with the BestKeeper index, we selected the correlation coefficient $(r)$ due to its greater precision when compared to the SD[16].
In the hypoxic microenvironment, cancer cells activate major adaptive pathways, including a shift towards anaerobic metabolism and a significant reprogramming of the cell transcriptional activity as a survival strategy[27]. Cancer cell cultures grown under serum deprivation conditions is commonly used to mimic the tumor milieu, where due to the lack of sufficient vascularization, cancer cells are inefficiently supplied with neither oxygen nor nutrients[18,19]. Furthermore, serum availability has been recently associated with altered expression of HKG[11]. Given the importance of RT-qPCR analysis for the characterization of cancer cells[3,5], we investigated the stability of expression of five HKG commonly used in the field of breast and lung cancer using cells cultured under hypoxic and serum deprivation conditions. In the present study, we selected the most commonly used triple negative breast cancer cell line (MDA-MB-231) and a broadly used non-small cell lung cancer cell line (NCI-H460), and applied three different statistical algorithms to evaluate the expression of the selected HKG. To the best of our knowledge, this is the first study identifying the appropriate set of HKG for reliable quantitative gene expression analysis in breast and lung cancer cells under hypoxic and serum deprivation conditions.
Our results show a similar expression profile comparing both the Ct mean analysis and the stability values (M) identified by the GeNorm and the NormFinder software. The results also reveal that the ACTB, $\beta $2M, GUSB, PPIA and 18S genes are potential candidates for the normalization of gene expression analysis in mammary and pulmonary tumor cell line models under hypoxic and serum deprivation conditions.
Despite the fact that GeNorm and the NormFinder ranked similarly the genes for MDA-MB-231 and NCI-H460 cells, the combined stability analysis differed between the distinct softwares and the tumor cell lines. GeNorm displayed the ACTB/PPIA combination for MDA-MB-231 and GUSB/PPIA for NCI-H460 as the most suitable pair of genes for normalization, while NormFinder suggested ACTB/18S as the most suitable pair of genes. These differences resulted from the heterogeneous gene expression profile of the tumor type, the experimental conditions, and the stability of the reference genes, being in agreement with the literature (Supplementary Table 1)[28,21,29,22]. In addition, the aforementioned variability can also be attributed to the different algorithms applied by the GeNorm and NormFinder[23,30,31,32,33]. However, for the single HKG analysis, the first three ranked genes by GeNorm and NormFinder were the same ones, implying no substantial differences in their stability.
NormFinder, BestKeeper and GeNorm apply different and highly complex mathematical algorithms to determine the stability of the reference gene candidates. The average variations of the candidate genes, the sensitivity towards co-regulation and the different primer efficiencies are key factors for software analyses[13,16,34]. In this context, we can explain the differences observed between the most stable reference gene presented by BestKeeper analysis in comparison to the results obtained with NormFinder and GeNorm. Besides, the correction of the mean Ct by the efficiency of each primer was performed on the input data of the latter two softwares as previously described[16].
Despite of the ACTB/18S combination stability in breast cancer cell lines described by Liu and collaborators[21], the present study showed more similar values between ACTB/PPIA in MDA-MB-231 by the $\Delta $Ct and the subsequent normalization analysis as well as by the output from the GeNorm and the NormFinder algorithms. Similarly, our results suggested the GUSB/PPIA combination rather than the ACTB/PPIA described by Ali and collaborators[24], to display higher stability in the non-small cell lung cancer cell line NCI-H460.
In relation to the stability analysis, $\beta $2M, although being in the limit of tolerance, resulted to be the least stable among the analyzed candidates. While $\beta $2M is being used as a control gene in cell line models under hypoxia[10,25,30,35], several studies have also demonstrated its unsuitability as a reference gene under hypoxia and serum deprivation conditions due to its variable gene expression[11,21,26,33,36]. Our results, together with those of the current literature, preclude the use of $\beta $2M as a reference gene in the above studied conditions.
Considering classical internal controls, ACTB, GUSB and PPIA are commonly used in gene expression analyses by RT-qPCR, including studies in breast and lung cancer cells under hypoxia[12,21,33,37,38]. Despite contradictory evidence regarding the use of ACTB as a reference gene under hypoxic and serum deprivation conditions[11,25], our results are in agreement with previous studies demonstrating the stability of ACTB in different tumor models subjected to hypoxia[6,26,36] and herein specifically in MDA-MB-231 cells under hypoxic and serum deprivation conditions.
Although the limited accessibility to nutrients may potentially affect the expression of HKG in a similar way to oxygen deprivation[6,25], the effects of serum availability on tumor cells has been poorly characterized. In this respect, despite the constant use of normalizing genes in various studies[4,39,40,41,42], including hypoxia[10,33,43] and serum deprivation conditions[11], this is the first study that identified PPIA and GUSB as appropriate reference genes for RT-qPCR analysis in breast and lung cancer cells undergoing hypoxia and serum deprivation.
Lastly, the present study proposes the use of ACTB/PPIA (MDA-MB-231) and GUSB/PPIA (NCI-H460) as the most suitable combination of genes for normalization of gene expression under hypoxia and serum deprivation. In the same time, we do not recommend the use of the $\beta $2M as a normalizing gene under the abovementioned conditions.
In conclusion, the current study highlights the relevance of the correct selection of the HKG before undertaking transcriptomic analyses under different cell culture conditions. Furthermore, this pivotal point applies to all types of samples, including both tumor cell lines and tissues, where an accurate study of HKG is crucial in order to draw the correct conclusions of the transcriptomic analysis under study.
EICB and CAR were responsible for the conception of the study. APBA and MB designed the experiments and analyzed the data. APBA performed the experiments. All authors were involved in the preparation and critical revision of the manuscript.
The authors declare no conflict of interest.