


 , Yi Zhang 1, Yuwei Su 1, Jiaming Kang 1, Weihang Qi 1, Shaoqing Li 1, Jiamei Zhang 1, Kaili Shi 1, Mingmei Wang 1, Yonghui Yang 1, Guangyu Zhang 1, Lei Yang 1, Gongxun Chen 1, Sansong Li 1, Yuxia Hu 2,3,4,*
 , Dengna Zhu 1,4,5,*
1 Department of Rehabilitation Medicine, Department of Paediatrics, The Third Affiliated Hospital of Zhengzhou University, 450052 Zhengzhou, Henan, China
2 School of Electrical Engineering, Zhengzhou University, 450001 Zhengzhou, Henan, China
3 Henan Key Laboratory of Brain Science and Brain-Computer Interface Technology, 450001 Zhengzhou, Henan, China
4 Institute of Neuroscience, Zhengzhou University, 450001 Zhengzhou, Henan, China
5 Key Laboratory of Pediatrics Brain Injury in Henan Province, Henan Provincial Pediatrics Clinical Medical Research Centre, The Third Affiliated Hospital of Zhengzhou University, 450052 Zhengzhou, Henan, China
Abstract
Global developmental delay (GDD) is a common childhood neurodevelopmental disorder characterized by the core symptoms of cognitive impairment. However, the underlying neural mechanisms of the cognitive impairment remain unclear. This study aimed to both analyze differences in electroencephalography (EEG) connectivity patterns between children with GDD and typical development (TD) using brain functional connectivity and to explore the neural mechanisms linking these differences to cognitive impairment.
The study enrolled 60 children with GDD and 60 TD children. GDD participants underwent clinical assessment via the Gesell Developmental Schedule (GDS). Resting-state EEG data were subjected to brain functional connectivity analysis and graph theory metric-based network analysis, with intergroup functional differences compared. Subsequently, correlation analysis characterized the relationships between GDD subject's brain network metrics and GDS-derived cognitive developmental quotient (DQ). Finally, three support vector machine (SVM) models were constructed for GDD classification and feature weight factors were calculated to screen potential EEG biomarkers.
The two groups exhibited complex differences in functional connectivity. Compared with the TD group, the GDD group showed a large number of increased functional connections in the θ, α, and γ-bands, along with a small number of decreased functional connections in the α and γ-bands (all p < 0.025). Brain network analysis revealed lower global efficiency, local efficiency, clustering coefficient and small-world coefficient, as well as higher characteristic path length in GDD children across multiple bands (all p < 0.05). Correlation analysis indicated that global efficiency and small-world coefficient in θ and γ-bands were positively correlated with the DQ, while the characteristic path length in α and γ-bands was negatively correlated with DQ in the GDD group (all p < 0.05). Machine learning models showed that a quantum particle swarm optimization SVM (QPSO-SVM) achieved the highest classification performance, with characteristic path length in the γ-band being the highest weighted metric.
Children with GDD exhibit abnormal patterns of brain functional connectivity, characterized by global hypo-connectivity and local hyper-connectivity. Specific network metrics under these abnormal patterns are significantly correlated with cognitive impairment in GDD. This study also highlights the potential of the γ-band characteristic path length as an EEG biomarker for diagnosing GDD.
Keywords
- global developmental delay
- electroencephalography
- functional connectivity
- Gesell Developmental Schedules
- support vector machines
Global developmental delay (GDD) is a common childhood neurodevelopmental disorder characterized by core symptoms of cognitive impairment. It is a relatively prevalent birth defect with a poor prognosis, affecting 1–3% of children [1]. The majority of children with GDD progress to intellectual disability by age five, resulting in delayed intellectual, motor and language development, as well as reduced life expectancy, thereby posing significant threats to life and health [2, 3].
The etiology of GDD is complex, with multiple factors interacting reciprocally. The heterogeneity of etiologies underscores their intricate neurodevelopmental mechanisms, which remain largely unexplored and pose significant challenges for developing effective interventions. Furthermore, current GDD diagnosis methods rely primarily on clinical symptoms and assessment scales [4], which are highly subjective, casting doubt on the accuracy and reliability of evaluation results. This presents challenges for the early diagnosis of GDD. Thus, exploring objective assessment metrics and identifying potential biomarkers are highly important for early diagnosis and precision intervention in children with GDD.
Network analysis based on neural signals provides a method to address the above
issues. The core symptom of children with GDD is cognitive impairment, which
leads to structural and functional brain changes, manifested as alterations in
the brain network and its parameters [5]. An EEG study exploring brain network
change mechanisms in children with perinatal stroke-related cognitive impairment
revealed that specific cognitive functions correlate with distinct brain network
properties and functional network characteristics after perinatal stroke reflect
poorer cognitive function in these children [6]. A quantitative EEG spectral and
functional connectivity analysis revealed that patients with Parkinson’s disease
and mild cognitive impairment exhibited significant alterations in the phase lag
index (PLI) in the
The combined application of EEG analysis and machine learning methods represents an active research area in neuroscience and disease diagnosis. Machine learning algorithms extract information from EEG signal features to train models, reducing subjectivity in manual analysis and enabling more objective classification of different brain states or disease diagnoses. Currently, with the widespread application of artificial intelligence, machine learning is undergoing rapid development in the context of neurodevelopmental disorders such as GDD, and is particularly suitable for constructing diagnostic and prognostic models for neurological disorders [17].
In summary, EEG-based brain network analysis has played a significant role in numerous neurological disorders because of its unique advantages. However, few studies have focused on brain network characteristics in children with GDD. The aim of this study was to investigate alterations in brain functional connectivity and network analysis between children with GDD and TD individuals. Here is hypothesized that: (a) Compared with TD children, GDD children exhibit altered EEG functional connectivity featuring a dual pattern of “global hypoconnectivity and local hyperconnectivity”; (b) Brain network metrics across different EEG bands are altered in GDD children, with certain metrics potentially serving as GDD biomarkers. To test these hypotheses, the weighted phase lag index (wPLI) was used across different bands for functional connectivity and brain network topological analysis to explore functional network differences between groups, examine correlations between brain network metrics, clinically obtain cognitive-related scale scores and finally establish a classification model using machine learning to distinguish GDD from TD children and identify potential GDD biomarkers.
Participants included children with GDD (GDD group) and typically developing
children (TD group). Inclusion criteria included: (a) Meeting the diagnostic
criteria for GDD defined in the Diagnostic and Statistical Manual of Mental
Disorders (Fifth Edition) (DSM-5); (b) GDD children showing scores
Participants in the GDD group were recruited from the Department of Child
Rehabilitation, the Third Affiliated Hospital of Zhengzhou University, Zhengzhou,
China. The participants in the TD group were sex- and age-matched and recruited
from local kindergartens during the same period. Sample size estimation was
performed via G*Power software (Version 3.1.9.7; Heinrich-Heine University,
Düsseldorf, Germany), which has a statistical power of 0.95 (1 –
This study was conducted at the Third Affiliated Hospital of Zhengzhou University from October 1, 2024 to March 31, 2025. It was approved by the Ethics Committee of the Third Affiliated Hospital of Zhengzhou University. The research was conducted in strict accordance with the Helsinki Declaration. Prior to the study, the research protocol was fully explained to the legal guardians of each participant.
The developmental status of the participants was assessed via a standardized
developmental evaluation tool GDS which was especially for children ranging from
0–6 years of age [18]. The scale determines normal development and identifies
delays or abnormalities by observing a child’s behavioral performance across
multiple domains. Each assessment was independently performed by three trained
clinicians who followed protocols for consistency and reliability. The assessment
results are expressed as a developmental quotient (DQ), where DQ = (developmental
age/chronological age)
Participants sat in a quiet temperature-controlled room for resting-state EEG
recordings with their eyes closed. A 32-channel Ag/AgCl scalp electrode system
(ZhenTecBci Co., Ltd., Xi’an, China), arranged according to the international
10–20 system, was used, comprising thirty acquisition electrodes and two
electrooculography electrodes (horizontal electrooculogram right and horizontal
electrooculogram left). The reference electrode was placed at CPz (Central
Parietal z) and the ground electrode at FPz (Frontopolar z). Electrode impedance
was maintained below 5 k
EEG data were preprocessed via EEGLAB v14.1.2b (https://eeglab.org) and MATLAB R2021b (https://ww2.mathworks.cn/), involving the following steps: Removal of horizontal electro-oculogram right (HEOR) and horizontal electro-oculogram left (HEOL) electrodes; bandpass filtering (0.1–40 Hz) to reduce noise; manual removal of corrupted data segments, with bad channels replaced by the average of neighboring channels; manual artifact removal; segmentation into two second epochs; independent component analysis to isolate brain activity components, removing those affected by eye movements, muscle activity, or cardiac artifacts; referencing to the average electrode; rejection of segments with significant electromyographic artifacts or extreme amplitudes; with each subject ultimately retaining 90 consecutive two second segments, for a total of 180 seconds of preprocessed EEG data.
The brain networks within a 1–40 Hz frequency range were calculated via the
HERMES (https://hermes.med.ucm.es/) toolbox, with frequency bands divided into
Where Sxy,t is the phase of x(t) and y(t) at time t, and where
Currently, the complex network analysis method based on graph theory is widely used to study the interconnection relationships between brain regions. The construction of functional brain networks mainly involves the selection of nodes and edges. In constructing functional networks, electrode positions are regarded as nodes, and the wPLI values between electrodes serve as edges. However, noise and non-feature signals often lead to many weak connection edges in a network. To distinguish the brain region dependency effectively between individuals within GDD and TD groups while maintaining global network connectivity as much as possible, this study used a 40% threshold to capture the topological features of the brain network [22], see Supplementary Material 1. Connections below the threshold were set to 0, and connections above the threshold were retained, converting the calculated fully connected brain functional matrix into an undirected weighted thresholded network.
Network-based statistics (NBS) is a method specifically designed for the statistical analysis of brain network/functional connectivity matrices [23]. The MATLAB-based NBS toolbox (https://www.nitrc.org/projects/nbs) was used to identify subnetworks with statistically significant differences in between-group comparisons of brain networks. To better quantify the connection relationships and structural characteristics of functional brain networks, five basic indices of complex networks were selected for quantitative characterization [24], including global efficiency, local efficiency, characteristic path length, the clustering coefficient and the small-world coefficient. Generally, global efficiency characterizes the overall transmission efficiency of parallel information in the network. Local efficiency is used to measure the closeness of connections between a node and its neighboring nodes, reflecting local transmission efficiency. The characteristic path length, the average distance between any two nodes, represents the network’s signal transmission capability and describes the efficiency of information transfer within the network. The clustering coefficient refers to the degree to which the neighboring nodes of a given node are interconnected. In brain networks, a high clustering coefficient is typically associated with improved information processing and cognitive abilities [25].
A small-world network is a network structure with efficient information transfer
characteristics, whose core features are a high clustering coefficient and short
average path length. It is commonly used to describe an intermediate state
between regular and random networks. Brain networks achieve a balance between
local functional modularity (high clustering) and global integration (short path
length) through small-world properties, supporting complex functions such as
cognition and memory [26]. The small-world coefficient (
The MATLAB Brain Connectivity Toolbox (BCT, http://www.brain-connectivity-toolbox.net) was used to calculate brain network parameters [27]. These metrics collectively provide insights into the brain network efficiency and information transmission capacity of the two groups of participants.
The support vector machine (SVM), a supervised machine learning algorithm, exhibits unique advantages in binary classification problems. It separates data points of different classes by identifying the optimal hyperplane [28], while enhancing model generalization by maximizing the boundary between classes. In this study, a thematic classification method was used to extract five brain network indicators as features from five frequency bands, and machine learning-based SVM models were developed to evaluate their classification ability for the TD and GDD groups. To optimize model parameters, particle swarm optimization (PSO) and quantum particle swarm optimization (QPSO) algorithms were introduced. These swarm intelligence optimization algorithms search for optimal solutions by simulating collaborative-competitive mechanisms in biological groups: PSO updates on the basis of particle position and velocity iterations, whereas QPSO introduces probabilistic search characteristics from quantum mechanics to enhance the global optimization capability [29]. A 10-fold cross-validation strategy was adopted (90% data for training and 10% for testing per fold), with model performance evaluated across five dimensions: Accuracy, precision, recall, F1 score and area under the receiver operating characteristic curve (AUC) [30].
To determine feature importance, permutation feature importance was used to identify key features [31]. This method measures feature significance by randomly shuffling feature values and observing the degree of decline in model prediction performance. In this study, 100 random permutations were performed to enhance reproducibility and the five most important features were identified and reported, providing data support for mining neurobiological GDD markers. The technical roadmap of this study is given in Fig. 1.
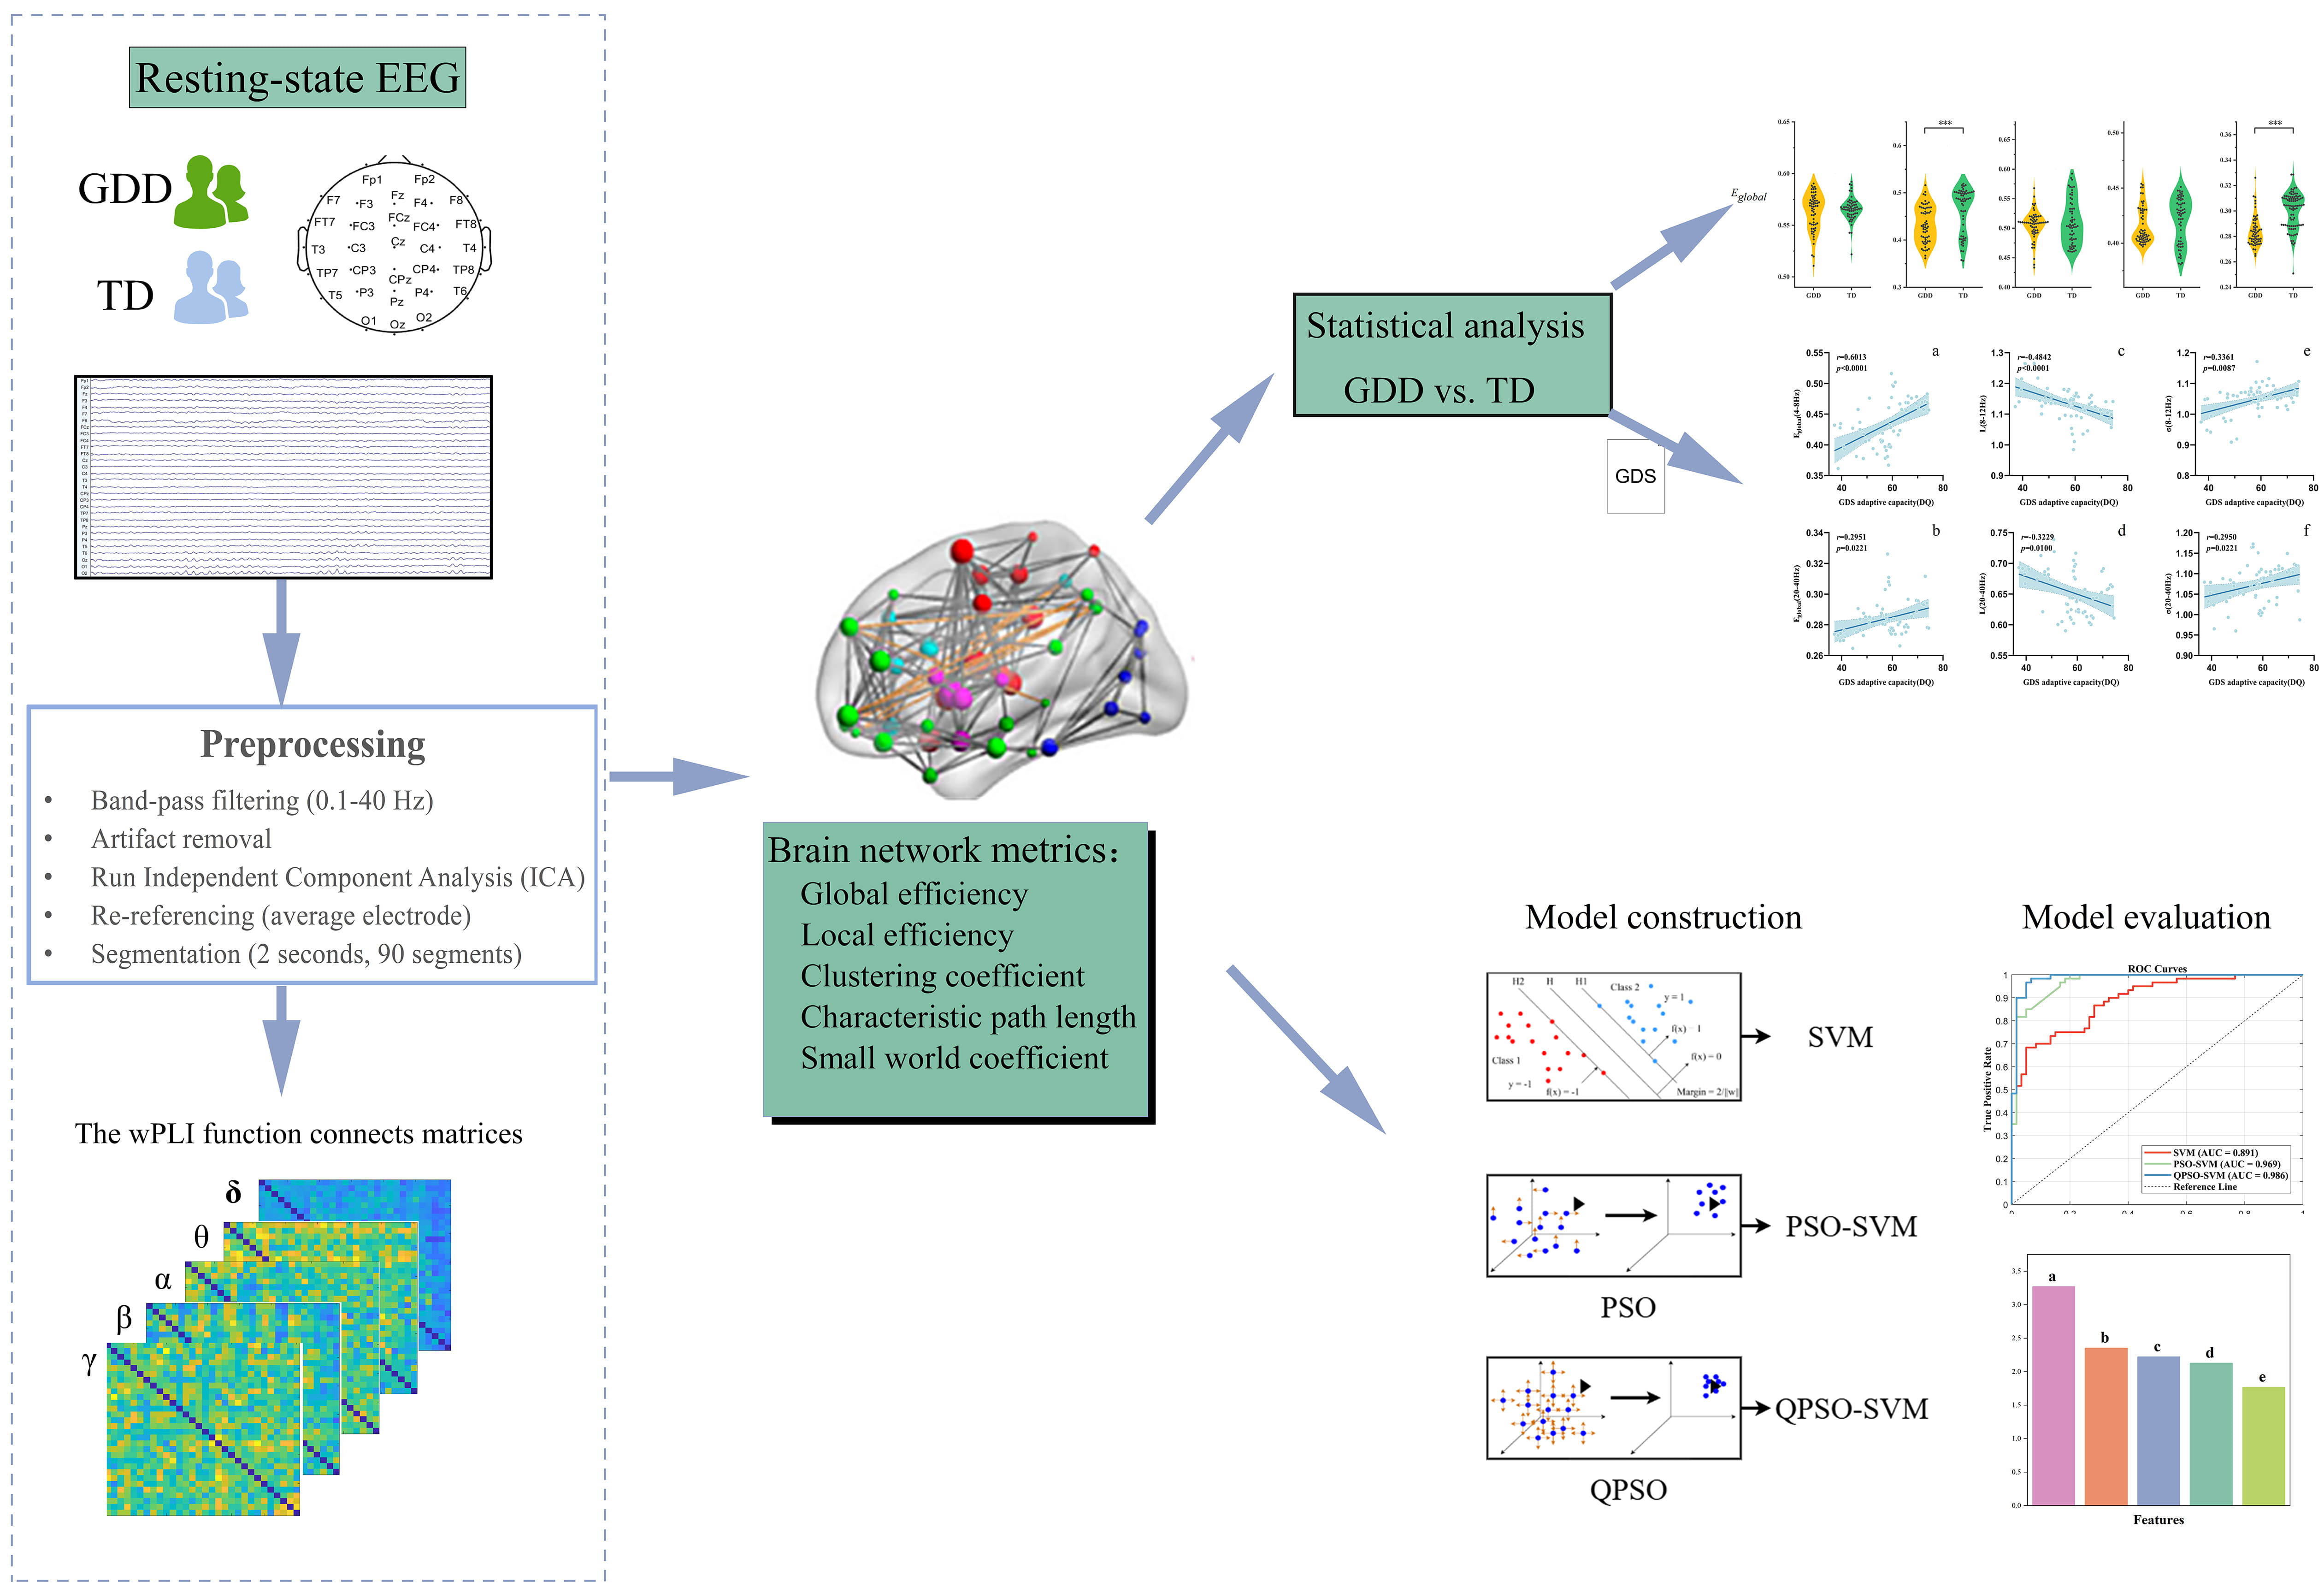 Fig. 1.
Technology roadmap.
Subfigures (a–f): Correlation between different brain network metrics and adaptive
capacity (DQ) in the GDD group; Features (a–e): (a,b)
Characteristic path lengths in the
This study used the statistical and machine learning toolboxes in MATLAB R2021b
for statistical analysis. The NBS method was employed to identify subnetworks
with significant differences via two-tailed t-tests with a threshold of
2.6 and 50,000 random permutations. The family-wise error rate corrected
p-value threshold was set at 0.025. Statistical analysis visualization
was performed via GraphPad Prism 9.5.0 (GraphPad Software, Inc., San Diego, CA, USA) (https://www.graphpad.com). Continuous
variables are expressed as the mean
All the subjects completed the data collection. No significant differences were observed between the two groups of children in terms of sex, age, or handedness (Table 1).
| Demographics | Categories | GDD | TD | Z/ |
p-value |
| Number | 60 | 60 | |||
| Sexa | Boy/Girl | 30/30 | 35/25 | 0.838 | 0.360 |
| Age (year)b | 2.80 (1.10) | 2.80 (1.00) | 0.175 | 0.861 | |
| Height (cm)b | 94.50 (10.70) | 97.45 (8.50) | 0.347 | 0.729 | |
| Weight (kg)b | 13.65 (2.90) | 13.40 (2.40) | 1.397 | 0.162 | |
| Handa | L/R | 4/56 | 2/58 | 0.174 | 0.402 |
GDD, Global developmental delay group; TD, Typically developing group; L/R (left/right); a Chi-square test; b Rank-sum test.
To compare and analyze functional connectivity strength differences between the
two groups of brain networks, NBS was employed to identify statistically
significant subnetworks, which were then visualized. Results revealed significant
differences in brain functional network connectivity between the GDD and TD
groups, with the GDD group showing reduced global functional connectivity
strength and increased local functional connectivity strength, as given in Fig. 2. Specifically, the local functional connectivity strength across the
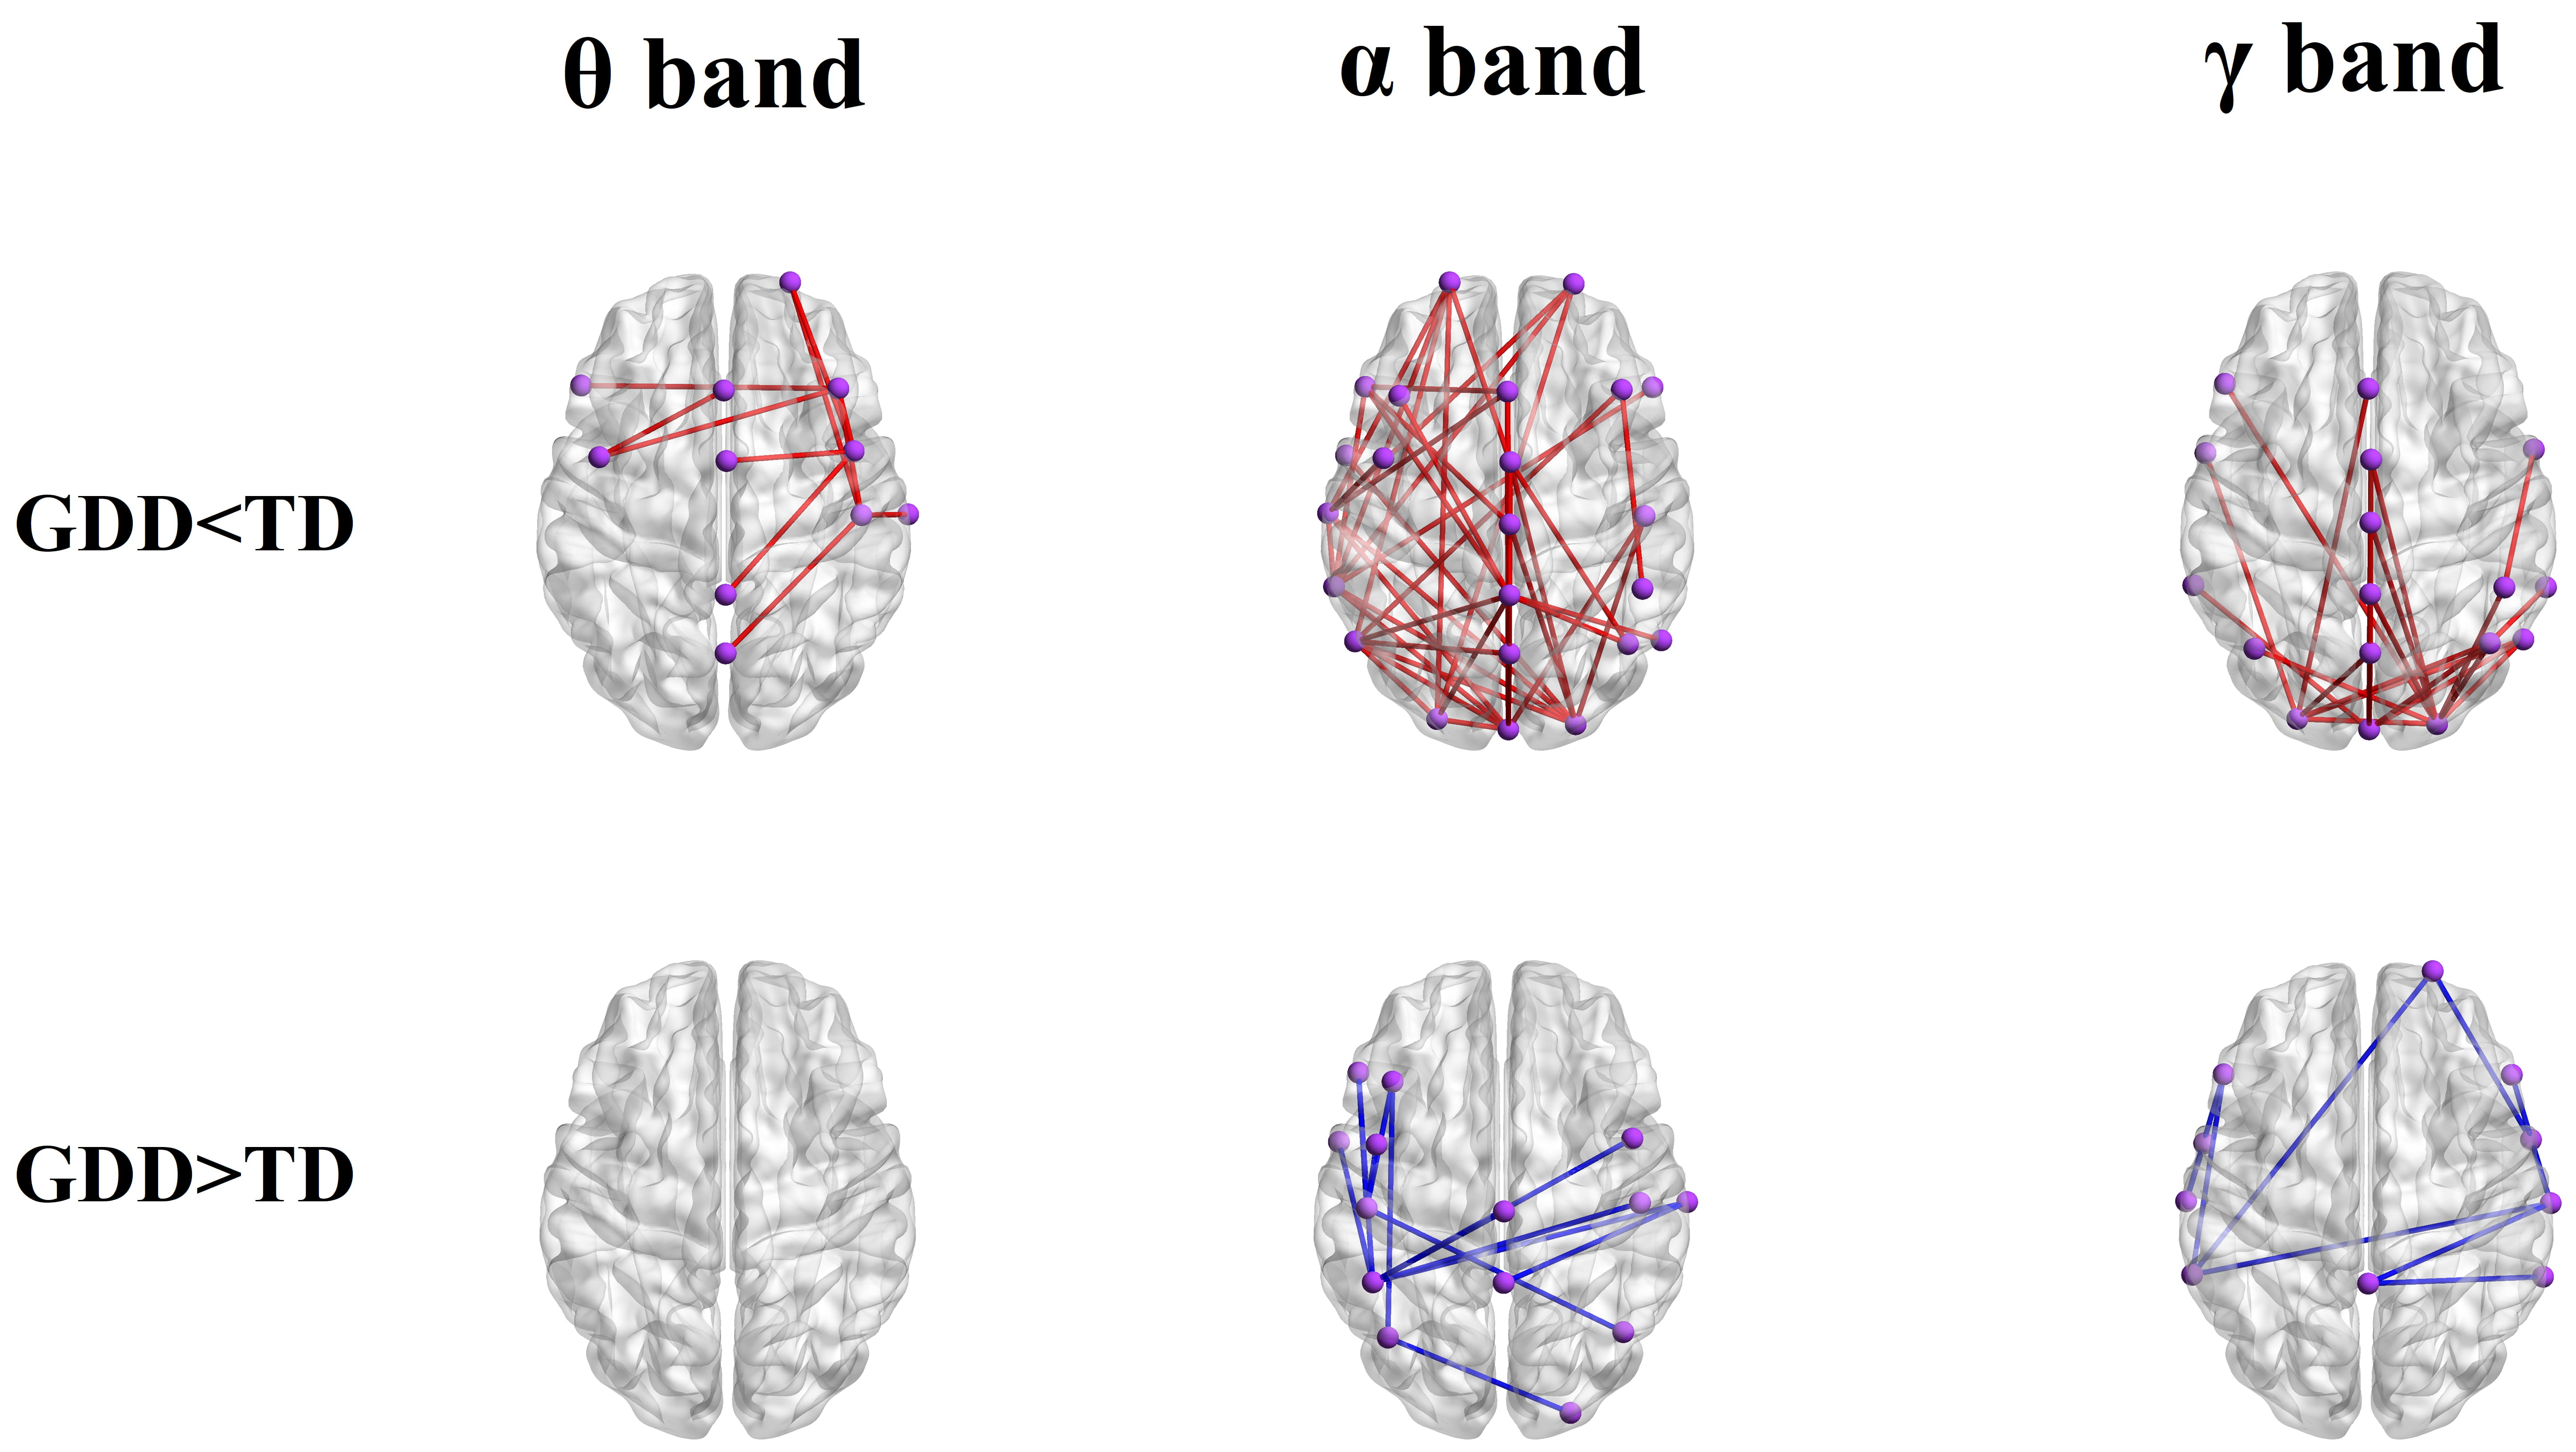 Fig. 2.
Comparison of the difference in wPLI connection strength between
the GDD and TD groups in different frequency bands. GDD, Global developmental
delay group; TD, Typically developing group; GDD
Results of the brain network parameter analysis revealed significant differences
in network metrics across the four EEG bands between the GDD and TD groups (Fig. 3). Small-world network analysis revealed that the brain networks of both groups
exhibited small-world properties (
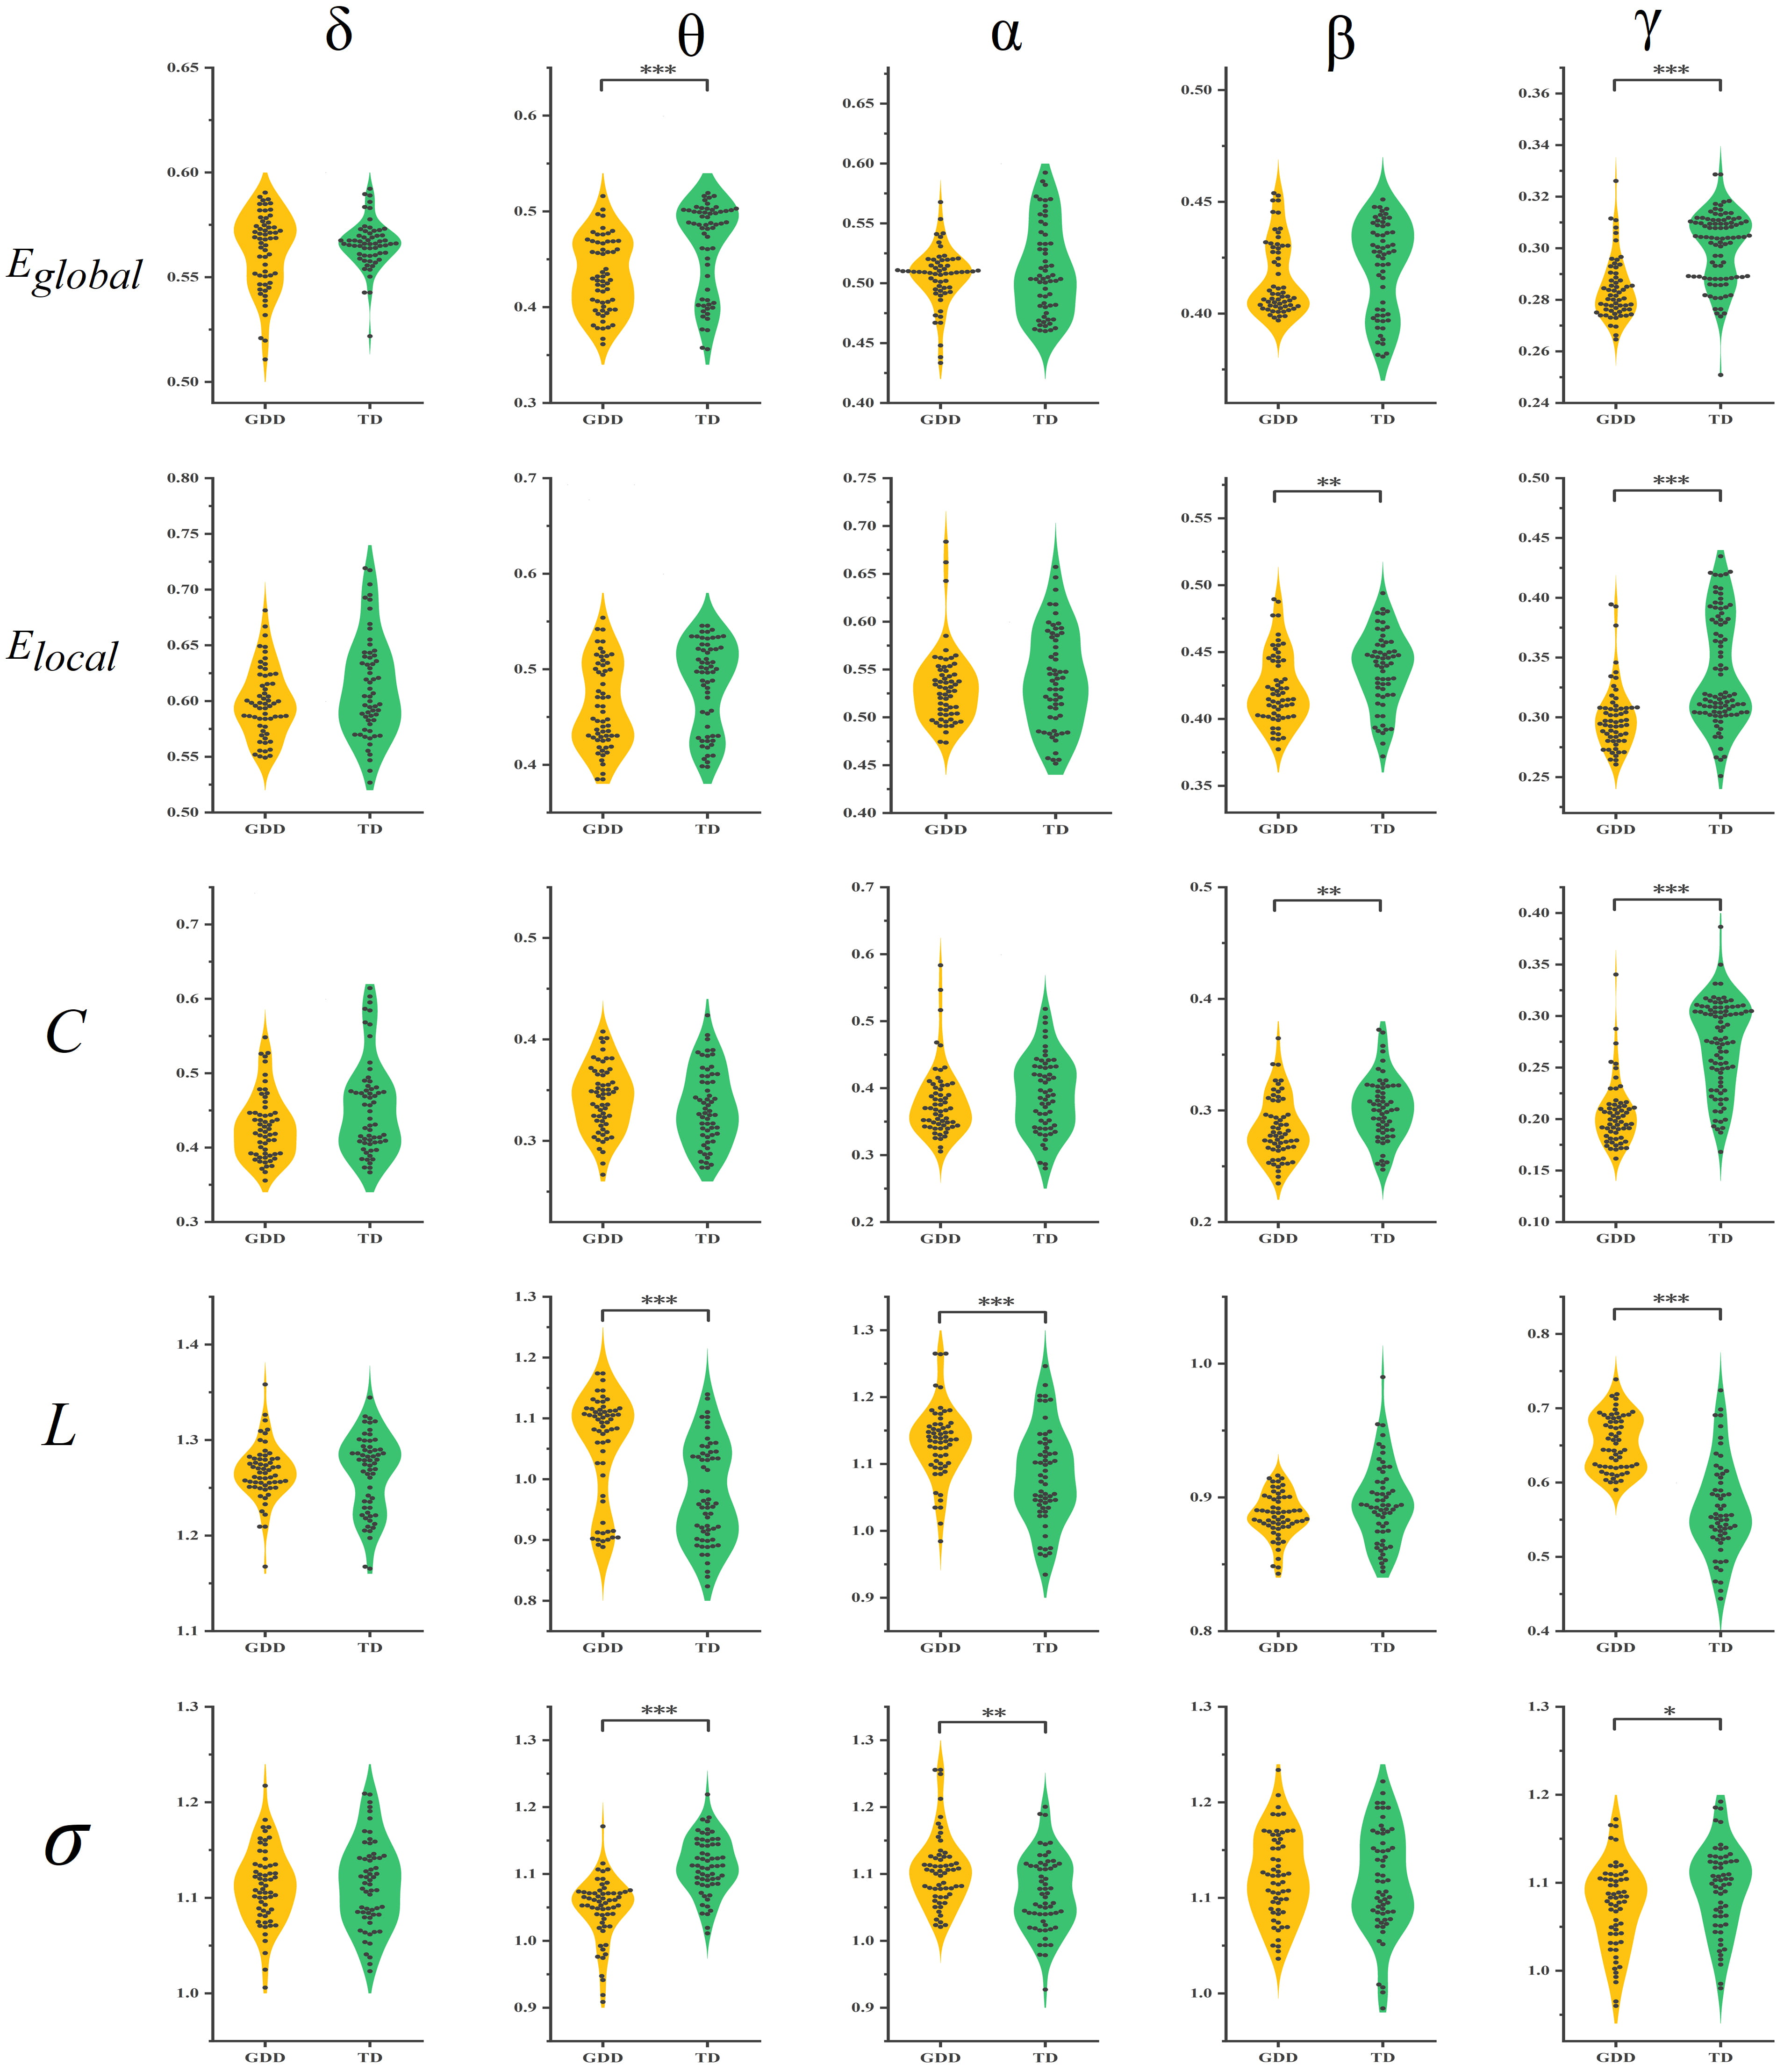 Fig. 3.
Comparison of differences in different brain network metrics in
different frequency bands between the GDD and TD groups. Eglobal, Global
efficiency; Elocal, Local efficiency; C, Clustering coefficient;
L, Characteristic path length;
Specifically, in the
In the
In the
In the
Supplementary Material 2 gives more detailed statistical results of the brain network parameters.
To evaluate the relationships between cognitive function and brain network
metrics in GDD participants and identify potential biomarkers, the correlations
between the five brain network topological metrics and the GDS social adaptation
DQ in the GDD group were analyzed. Results revealed significant positive
correlations between the global efficiency in the
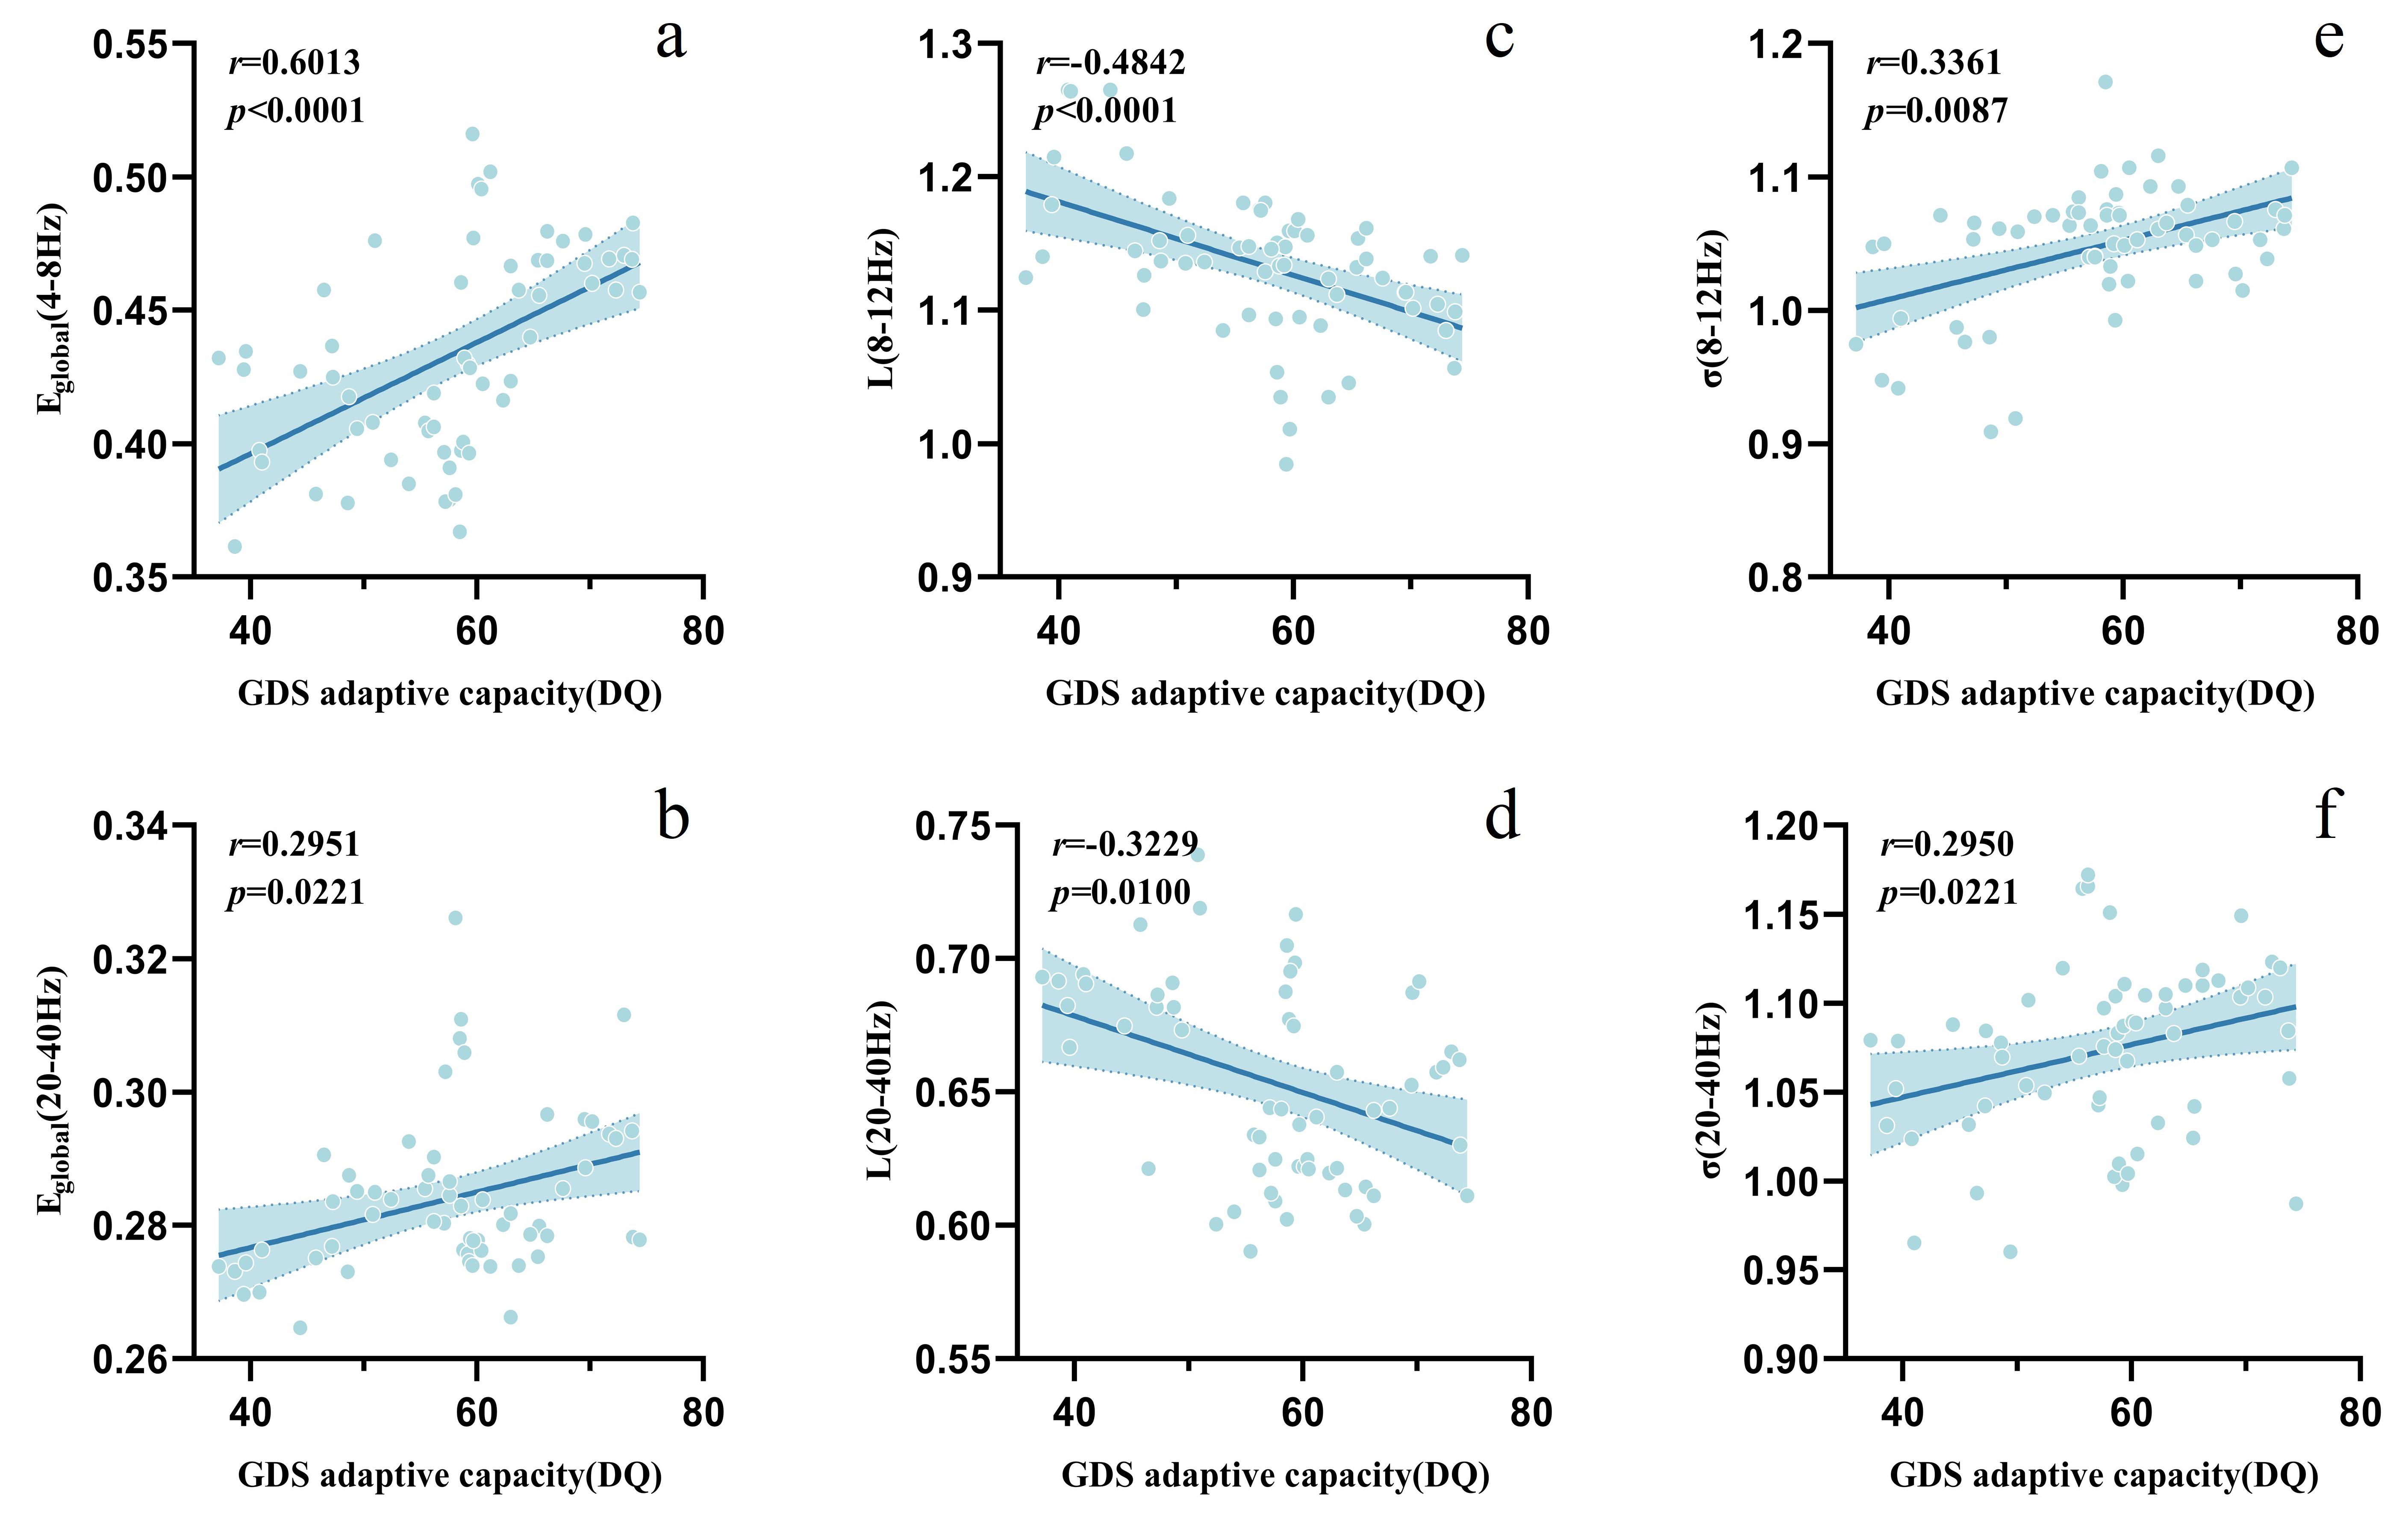 Fig. 4.
Correlation analysis between adaptive capacity (DQ) and brain network metrics in the GDD group.
ROC curves demonstrated that the quantum particle swarm optimization SVM (QPSO-SVM) model achieved the highest AUC value of 0.986, whereas the AUC values for SVM and PSO-SVM were 0.891 and 0.969, respectively, as given in Fig. 5a. Among these models, QPSO-SVM outperforms the others in terms of accuracy, precision, recall, and F1 score (Fig. 5b).
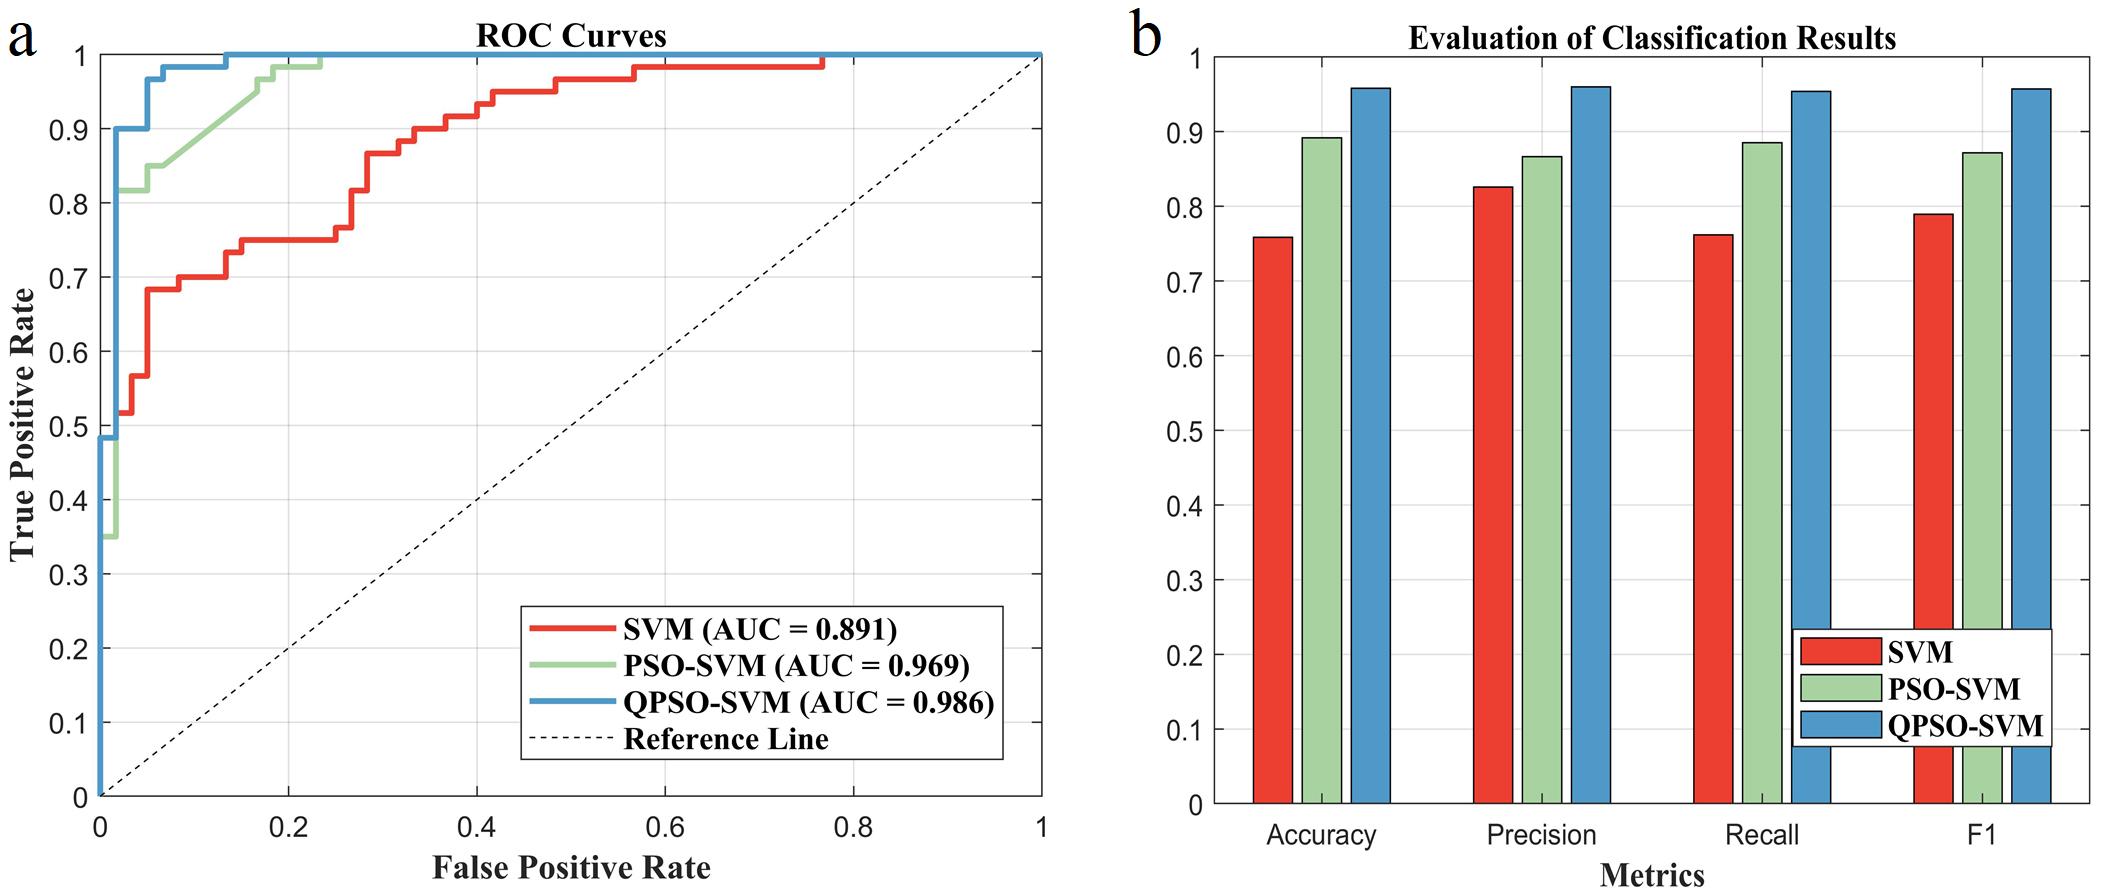 Fig. 5.
Evaluating the classification effects of different SVM models. (a) Comparison of ROC curves and AUC values for different classification models. (b) Multi-criteria performance evaluation of different classification models. ROC, Receiver operating characteristic; AUC, Area under ROC curve. The accuracy of the SVM is 0.7417, that of the PSO-SVM is 0.8917 and that of the QPSO-SVM is 0.9583. The precision of the SVM is 0.9189, that of the PSO-SVM is 0.8507, and that of the QPSO-SVM is 0.9508. The recall of the SVM is 0.5667, that of the PSO-SVM is 0.9500, and that of the QPSO-SVM is 0.9667. The F1 of the SVM is 0.7021, that of the PSO-SVM is 0.8978, and that of the QPSO-SVM is 0.9587.
Fig. 6 presents the average feature weights of the top five features across the
three models after 100 random permutations, with the characteristic path length
in the
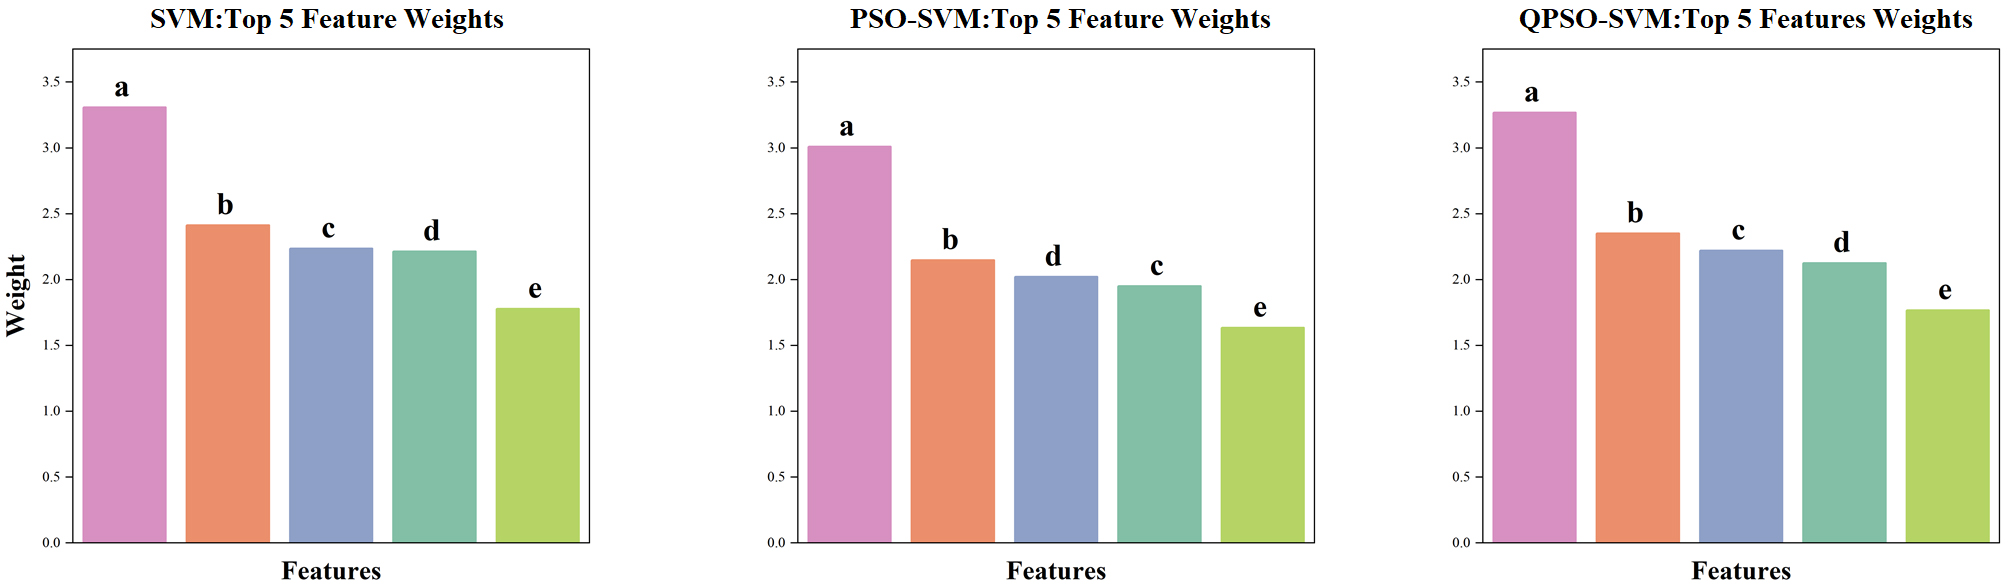 Fig. 6.
Top five feature weight rankings of different SVM models. SVM,
PSO-SVM and QPSO-SV make the top five average features. The weight ranges of the
three models were not normalized. (a,b) Characteristic path lengths in the
To the best of our knowledge, this is the first study to comprehensively explore
whole-brain functional connectivity between GDD and TD participants via EEG and
the first to report associations between graph-theoretical network metrics and
cognitive impairment in GDD patients. This study basically validated the
pre-established hypotheses. Specifically, GDD participants presented
significantly weaker connectivity across multiple frequency bands, with enhanced
connectivity in specific bands, demonstrating a dual pattern of “global
hypoconnectivity and local hyperconnectivity”. In terms of brain network
metrics, GDD participants presented significantly reduced global efficiency,
local efficiency, clustering coefficients and small-world coefficients, as well
as extended characteristic path length across multiple bands, when compared to TD
participants. Correlation analysis and machine learning results indicated that
alterations in brain network parameters across certain bands were significantly
associated with cognitive function scores in GDD participants, among which the
characteristic path length in the
Functional networks in the human brain typically exhibit high levels of segregation and integration to enhance local and global information processing efficiency [32]. EEG functional connectivity analysis, by quantifying the synchronization of electrical signals across different brain regions reveal spontaneous coordinated activities within intrinsic networks such as the default mode network (DMN), reflecting the brain’s modular organization and information integration capabilities. Graph-theory-based brain network analysis enables a comprehensive exploration of alterations in GDD brain functional connectivity at a higher level of network organization. In the following sections, the differences in brain functional connectivity and network analysis metrics between the two groups of participants across different frequency bands are discussed, as are the underlying neural mechanisms.
Findings across the five frequency bands validated the pre-established
hypothesis tested here: GDD participants presented reduced functional
connectivity in three bands (
Correlation analysis revealed that brain network parameters in GDD participants
were closely associated with cognitive functions. Specifically, in GDD
participants cognitive function was positively correlated with global efficiency
in the
SVM, which is rooted in statistical learning theory, achieves structural risk
minimization and serves as a supervised learning technique for classification and
regression [58]. It has been widely applied to construct clinical disease
classification models. Among the three models, the QPSO-SVM model demonstrated
the best classification performance. However, its high AUC value suggests a risk
of overfitting, which may be related to the small sample size in this study and
may affect model generalization to new data. In the future, sample size should be
expanded and multi-centre external validation should be conducted to mitigate the
impact of such overfitting. Repeated permutations of feature parameters to
observe model performance help highlight the contribution of features to model
prediction, thereby screening valuable biomarkers. Results show that the
characteristic path length in the
This study has several limitations. First, the sample size was relatively small, making subgroup analysis on the basis of the severity of cognitive impairment difficult. Future studies could enroll larger samples from multiple centers to better understand the heterogeneity among GDD populations. Second, the heterogeneity of GDD etiologies and the high noise in participant’s EEG data limited the choice of sliding thresholds when constructing functional brain networks. Stratified analysis or collection of fNIRS/MRI data with higher SNRs could support range threshold analysis in the future. Finally, the cross-sectional design of this study does not allow the inferring of causal relationships or unraveling the associations between cognitive-behavioral assessments and functional connectivity in GDD participants. Prospective designs are recommended for future research on this topic.
This study, which is based on resting-state brain network analysis of EEGs and
machine learning algorithms, demonstrated that GDD participants exhibit an
abnormal connectivity pattern characterized by “global hypoconnectivity and
local hyperconnectivity”. It also reveals correlations between brain network
parameters in specific frequency bands and cognitive functions in GDD, where the
characteristic path length in the
The datasets used and analyzed in the present study are available upon request from the corresponding author.
Conceptualization: ZH, YZ, DZ and YH. Methodology: YH, ZH, YZ, and DZ. Software: ZH, YZ. Validation: ZH and YH. Formal analysis: ZH. Investigation: YS, JK, WQ, YY, LY, GC, SaL, GZ, MW. Resources: DZ, YH. Data Curation: ZH, ShL, JZ, KS. Writing—Original Draft: ZH, YZ. Writing—Review & editing: DZ, YH. Visualization: ZH, YZ, DZ. Supervision: DZ and YH. Project administration: DZ and YH. Funding acquisition: DZ and YH. All authors contributed to editorial changes in the manuscript. All authors read and approved the final manuscript. All authors have participated sufficiently in the work and agreed to be accountable for all aspects of the work.
The study was conducted in accordance with the Declaration of Helsinki. The research protocol was approved by the Ethics Committee of the Third Affiliated Hospital of Zhengzhou University (Ethic Approval Number: 2024-268-02). All of the participants provided signed informed consent.
The authors thank all the participants and their parents for their assistance and cooperation with our study. The authors would like to acknowledge the use of DeepSeek (https://www.deepseek.com/) for the Chinese-English translation, English grammar checking and building classification models via code in the preparation of this manuscript.
This research was funded by the Open Research Program of the NHC Key Laboratory of Birth Defects Prevention, grant number NHCKLBDP202508; the Key Project of Medical Science and Technology Tackling Plan of Henan Province 2024, grant number SBGJ202402069.
The authors declare no conflict of interest.
During the preparation of this work the authors used DeepSeek (https://www.deepseek.com/) in order to check spell and grammar. After using this tool, the authors reviewed and edited the content as needed and takes full responsibility for the content of the publication.
Supplementary material associated with this article can be found, in the online version, at https://doi.org/10.31083/JIN44410.
References
Publisher’s Note: IMR Press stays neutral with regard to jurisdictional claims in published maps and institutional affiliations.