


 , Lie Wu 1, Lu Jia 1, Qilahu Sa 1, Xia Guo 1, Lili Cui 1, Fangling Sun 2, Dewang Gao 1, Jiayu Lv 1, Zi Guo 1, Xiaoshan Wang 2,*
1 Department of Neurology, The First Affiliated Hospital of Baotou Medical College, 014010 Baotou, Inner Mongolia, China
2 Department of Neurology, The Affiliated Brain Hospital of Nanjing Medical University, Nanjing Medical University, 210029 Nanjing, Jiangsu, China
Abstract
Migraine is the most common primary headache disorder encountered in clinical practice and is associated with a significantly reduced quality of life. Despite abundant research, the underlying pathophysiological mechanisms behind migraine development remain unclear. Literature reviews indicate that most studies utilized functional magnetic resonance imaging (fMRI) and electroencephalography (EEG), often yielding inconsistent results. In contrast magnetoencephalography (MEG) offers superior temporal and spatial resolution, making it better suited for capturing the neural dynamics underlying migraine without aura (MwoA).
MEG data were obtained from 33 migraine cases and 22 healthy controls (HC). We used Minimum norm estimation (MNE) combined with Welch’s technique for spectral power analysis, and graph theory for network topology analysis.
Significant group differences were observed in the theta and alpha bands spectral power, with the MwoA group exhibiting increased theta power and decreased alpha power relative to HC. Graph theory analysis revealed a higher path length in the MwoA group compared to the HC group.
Individuals with MwoA demonstrate distinct alterations in cortical excitability and functional network organization. These findings suggest that MwoA is associated with impaired information integration. The opposing patterns of increased and decreased cortical excitability across frequency bands further underscore the complex and multifaceted nature of MwoA pathology. These findings may contribute to a deeper understanding of the neural mechanisms and functional network disruptions underlying MwoA pathophysiology.
Keywords
- migraine without aura
- spectral power
- graph theory
- magnetoencephalography
Migraine, a debilitating neurological disorder, impacts over a billion individuals globally, with an age-standardized prevalence of 14.4% as reported by the World Health Organization [1]. The condition’s pathophysiology remains incompletely understood due to its heterogeneous and multifactorial origins, where multiple mechanisms may interact or overlap [2]. Recent progress in neuroimaging has significantly enhanced insights into migraine’s underlying processes. Techniques like functional magnetic resonance imaging (fMRI) and electrophysiological methods, including quantitative electroencephalography (EEG), have been employed to study brain function in migraine patients during rest and sensory stimulation [3]. Examinations of neural oscillations across frequency bands have uncovered distinctive patterns of intrinsic brain activity in migraineurs [4, 5, 6]. Migraine is related to primary neural dysfunction, which can lead to various extracranial and intracranial changes [7] as well as imbalance between excitatory and inhibitory neuronal activity [8]. Numerous studies support abnormal neural activity in migraine [9, 10].
“Resting state” describes a state of wakefulness without engagement in any cognitive or motor activities. According to a comprehensive study [11], cognitive tasks raise the brain’s energy expenditure by no more than 5% compared to baseline, demonstrating that the brain remains highly active even in the resting state. Robust and well-defined intrinsic neural activity underlies the oscillatory dynamics and functional connectivity in the resting-state cortex. Given the endogenous and self-generated nature of neural activity, resting-state methodologies are utilized to examine functional architecture of the brain and its modifications in nervous system diseases [12, 13, 14, 15]. However, neuronal activity in the resting state in individuals with migraine without aura (MwoA) has not been well studied. To address this research gap and more intuitively understand the functional network characteristics of the brain, this study adopts graph theory. Through graph theory [16, 17], a crucial step in the analysis of brain connectivity, it has been shown that the brain is a complex network, similar to other large networks, and can be divided into interconnected sub-networks. In graph theoretical terms, the brain’s connectome may be modeled as G = (V,E) [17], with V corresponding to vertices (each symbolizing a distinct brain area) and E to the edges linking these vertices/regions. Different features can be extracted from the graphs, allowing for the analysis and study of brain pathologies, individual differences, etc. Graph theory is an ideal tool for examining brain topology, and provides a opportunity to understand integrative aspects of brain structure in migraineurs [18, 19, 20]. Graph theory enables quantitative characterization of brain networks (represented as nodes and edges corresponding to cortical regions and their connections) through multiple neurobiologically meaningful metrics [21], and has recently been employed to demonstrate both structural and functional connectivity alterations in migraine populations [22, 23, 24, 25, 26].
As noted, most studies of migraine pathophysiology have used fMRI and EEG imaging techniques. Magnetoencephalography (MEG), a non-invasive modality capturing magnetic fields generated by neuronal currents [27], combines higher temporal resolution than fMRI with greater spatial precision than EEG [28]. This advantage motivated our use of MEG to investigate migraine-related neural dynamics.
In summary, this study used MEG to analyse cortical excitability and brain network topology in MwoA cases at rest and invoked graph theory concepts to quantify network metrics, and our research is a whole brain global analysis. Thus, better understanding of the characteristics of neural activity in the migraine cerebral cortex could contribute to the treatment of migraine neurophysiology.
For this study, we recruited 33 patients with MwoA who attended the Headache Clinic, Department of Neurology, Brain Hospital of Nanjing Medical University from January 2022 to December 2022 and 22 age- and gender-matched healthy controls (HCs) recruited from the community through advertisements.
All the patients in the MwoA group met the diagnostic criteria of the third edition of the International Classification of Headache Disorders and had not received preventive medication for migraine. During the magnetic resonance imaging (MRI) scan, there were no migraine attacks or discomfort. Medication-overuse headache was excluded.
The HC group was selected from healthy individuals who were matched with the MwoA group in terms of age and gender, and who had no history of headache or family history of headache.
The age range of all the subjects was between 18 and 60 years old. They were right-handed, had no history of drug abuse, and all excluded those with any neurological or mental disorders. Patients who were unable to undergo MEG examination or who were uncooperative were excluded.
Migraine information was collected including when patients had migraine onset, monthly headache frequency, headache duration, headache severity, and medication use. The visual analog score (VAS) was used to measure pain in migraine patients. All participants completed various scales including the Hamilton Anxiety Rating Scale (HAMA), and Hamilton Depression Rating Scale (HAMD).
MEG data were acquired using a whole scalp CTF 275-channel MEG system (VSM MedTech Systems, Inc., Coquitlam, BC, Canada) in the magnetically- shielded MEG room of Nanjing Brain Hospital. Prior to data acquisition, all metallic objects were removed from each participant’s body. Three coils were positioned and secured at the nasion and pre-auricular points as anatomical landmarks for precise coregistration with subsequent MRI. A 3-minute empty-room measurement was conducted before MEG recordings to characterize sensor and background noise, enabling noise covariance calculation for source-level analyses. The sampling frequency of MEG data is 6000 Hz, and the acquisition time of each group of MEG data was 120 s, and a total of 6 groups of data were acquired. Noise reduction processing was required while acquiring the data. During MEG data acquisition, participants were required to remain in a supine position with eyes closed while maintaining a relaxed yet awake state. Pre- and post-recording head localization was performed to maintain
MRI scans were performed using a 3.0 T MRI system (Siemens, Munich, Germany). To avoid MRI bias due to changes in head orientation, the MRI acquisition coordinates were calibrated by the preplaced marker positions of the three coils in the MEG recordings. This method allows the anatomical location of the MRI to be determined after visualization of MEG data, ensuring accurate fusion of each participant’s MRI and MEG data.
To remove non-neural signals and environmental artifacts from MEG data, the following processing steps were implemented: (1) manual artifact rejection to eliminate noise caused by head displacement or external interference; (2) 50 Hz power line noise filtering (including harmonic frequencies) to eliminate electrical contamination; (3) initiation of MEG recordings with a 3-minute empty-room measurement to capture ambient and sensor noise for computing noise covariance matrices, enabling subsequent offline source analysis that accounts for residual instrumental, sensor, and environmental noise components. Cortical models for source analysis were performed using the FreeSurfer image analysis package (Version 7.11, Athinoula A. Martinos Center for Biomedical Imaging, Boston, MA, USA), which reconstructs T1-weighted structural images into surface-based representations. The software executes a detailed geometric reconstruction of the scalp and brain grey and white matter, providing a three-dimensional topographical description of the brain surface for assessing grey and white matter boundaries. To avoid interference of peak discharges with the MEG signal, a 60 s continuous segment was selected for each group of participants. The following six frequency bands were selected for MEG analysis: delta (2–4 Hz), theta (5–7 Hz), alpha (8–12 Hz), beta (15–29 Hz), gamma1 (30–59 Hz) and gamma2 (60–90 Hz).
For source-level cortical activation estimation in MEG data, we employed minimum norm estimation (MNE), a method previously validated as highly stable [29]. The forward model for MNE analysis was constructed using the overlapping spheres approach, modeling each cortical vertex (approximately 15,000 in total) as a current dipole. Current source distributions were then estimated with: (1) restricting the direction of the current sources to be orthogonal to the cortical surface; (2) a depth-weighting algorithm to compensate for the inhomogeneous sensitivity of the current directions and depths; and (3) use of a regularization parameter
We calculated the oscillatory functional connectivity (FC) values of 68 brain regions using corrected amplitude envelope correlation (AEC-c) analysis using DK mapping [31, 32]. Previous studies support that AEC-c analysis is reproducible and stable [33, 34, 35]. Consistent with prior research, we extracted cortical oscillatory signals from each brain region derived from source-reconstructed activity within each frequency band. Prior to envelope computation, signal pairs were orthogonalized to eliminate spurious connectivity arising from volume conduction and field spread effects [36]. The MEG signals were then subjected to Hilbert transform to obtain amplitude envelopes, representing temporal fluctuations in signal power. Pearson correlation was employed as the FC metric to compute amplitude envelope correlations between regional pairs, as quantified by AEC-c values. Higher AEC-c values indicate stronger synchronization of amplitude envelope fluctuations between two regions. For all patients, we computed these values across all brain regions, generating a 68
Graph theory serves as a robust analytical framework that has been extensively employed in both structural and functional brain research to quantify connectivity patterns and characterize topological properties of neural networks [37]. Within this mathematical construct, networks are represented as graphs comprising nodes (corresponding to cortical regions in our study) interconnected by edges (weighted by AEC-c values [33, 34]). To comprehensively evaluate global and local network topology across frequency-specific neural networks, we computed four fundamental graph metrics: (1) nodal strength (S)—defined as the summation of weights from all edges connected to a given node, with mean S representing the average connection strength of all nodes; (2) clustering coefficient (C)—quantifying the likelihood of interconnectedness among a node’s neighbors, where the mean C reflects the network’s clustering propensity; (3) path length (L)—calculated as the shortest path length between node pairs in weighted networks (with edge lengths defined as the reciprocal of connection weights [21, 38]); and (4) global efficiency (E)—measuring the network’s capacity for parallel information transfer [39, 40]. All graph theoretical analyses were implemented using NetworkX (https://networkx.org/).
Group differences in demographic and clinical data were assessed using the independent samples t-tests, one-way analysis of variance (ANOVA), or chi-squared test, as appropriate. We conducted a Shapiro-Wilk test on the data to check for normality, and the results showed that the data did not conform to a normal distribution. Therefore, U-tests were used to compare the values of spectral power and graph theory correlation parameters in six frequency bands between the MwoA and HC groups, with Bonferroni correction for multiple comparisons. Finally, linear regression analysis was conducted to confirm the above group differences of connectivity measures after adjustment of anxiety, and depression. The MEG measures showing group differences were tested for clinical correlation with VAS and psychometric scores by using the Pearson correlation. The threshold for statistical significance was p
Information about the 33 MwoA patients and 22 HCs included in the analysis is provided in Table 1. There were no significant group differences in terms of gender or age. HAMA and HAMD scores were higher in the MwoA group (Table 1).
| Variable | MwoA group | HC group | p |
| Gender | 13M/20F | 9M/13F | |
| Age (years) | 37.82 | 37.91 | |
| Frequency of headaches (days/month) | 13.67 | - | - |
| Duration of headaches (years) | 2.33 | - | - |
| Frequency of headache medication use (days/month) | 5.00 | - | - |
| HAMA | 14.42 | 5.68 | |
| HAMD | 9.61 | 4.68 | |
| VAS | 5.73 | - | - |
SD, standard deviation; MwoA, migraine without aura; HC, healthy control; HAMA, Hamilton Anxiety Scale; HAMD, Hamilton Depression Scale; VAS, visual analog score; M, male; F, female.
Using DK mapping, 68 regions of the whole brain were analyzed. Comparison of spectral power revealed that the MwoA group had greater power than the HC group in the theta (5–7 Hz) frequency range (p = 0.030) (Fig. 1) and lower power in the alpha (8–12 Hz) frequency range (p = 0.024) (Fig. 2).
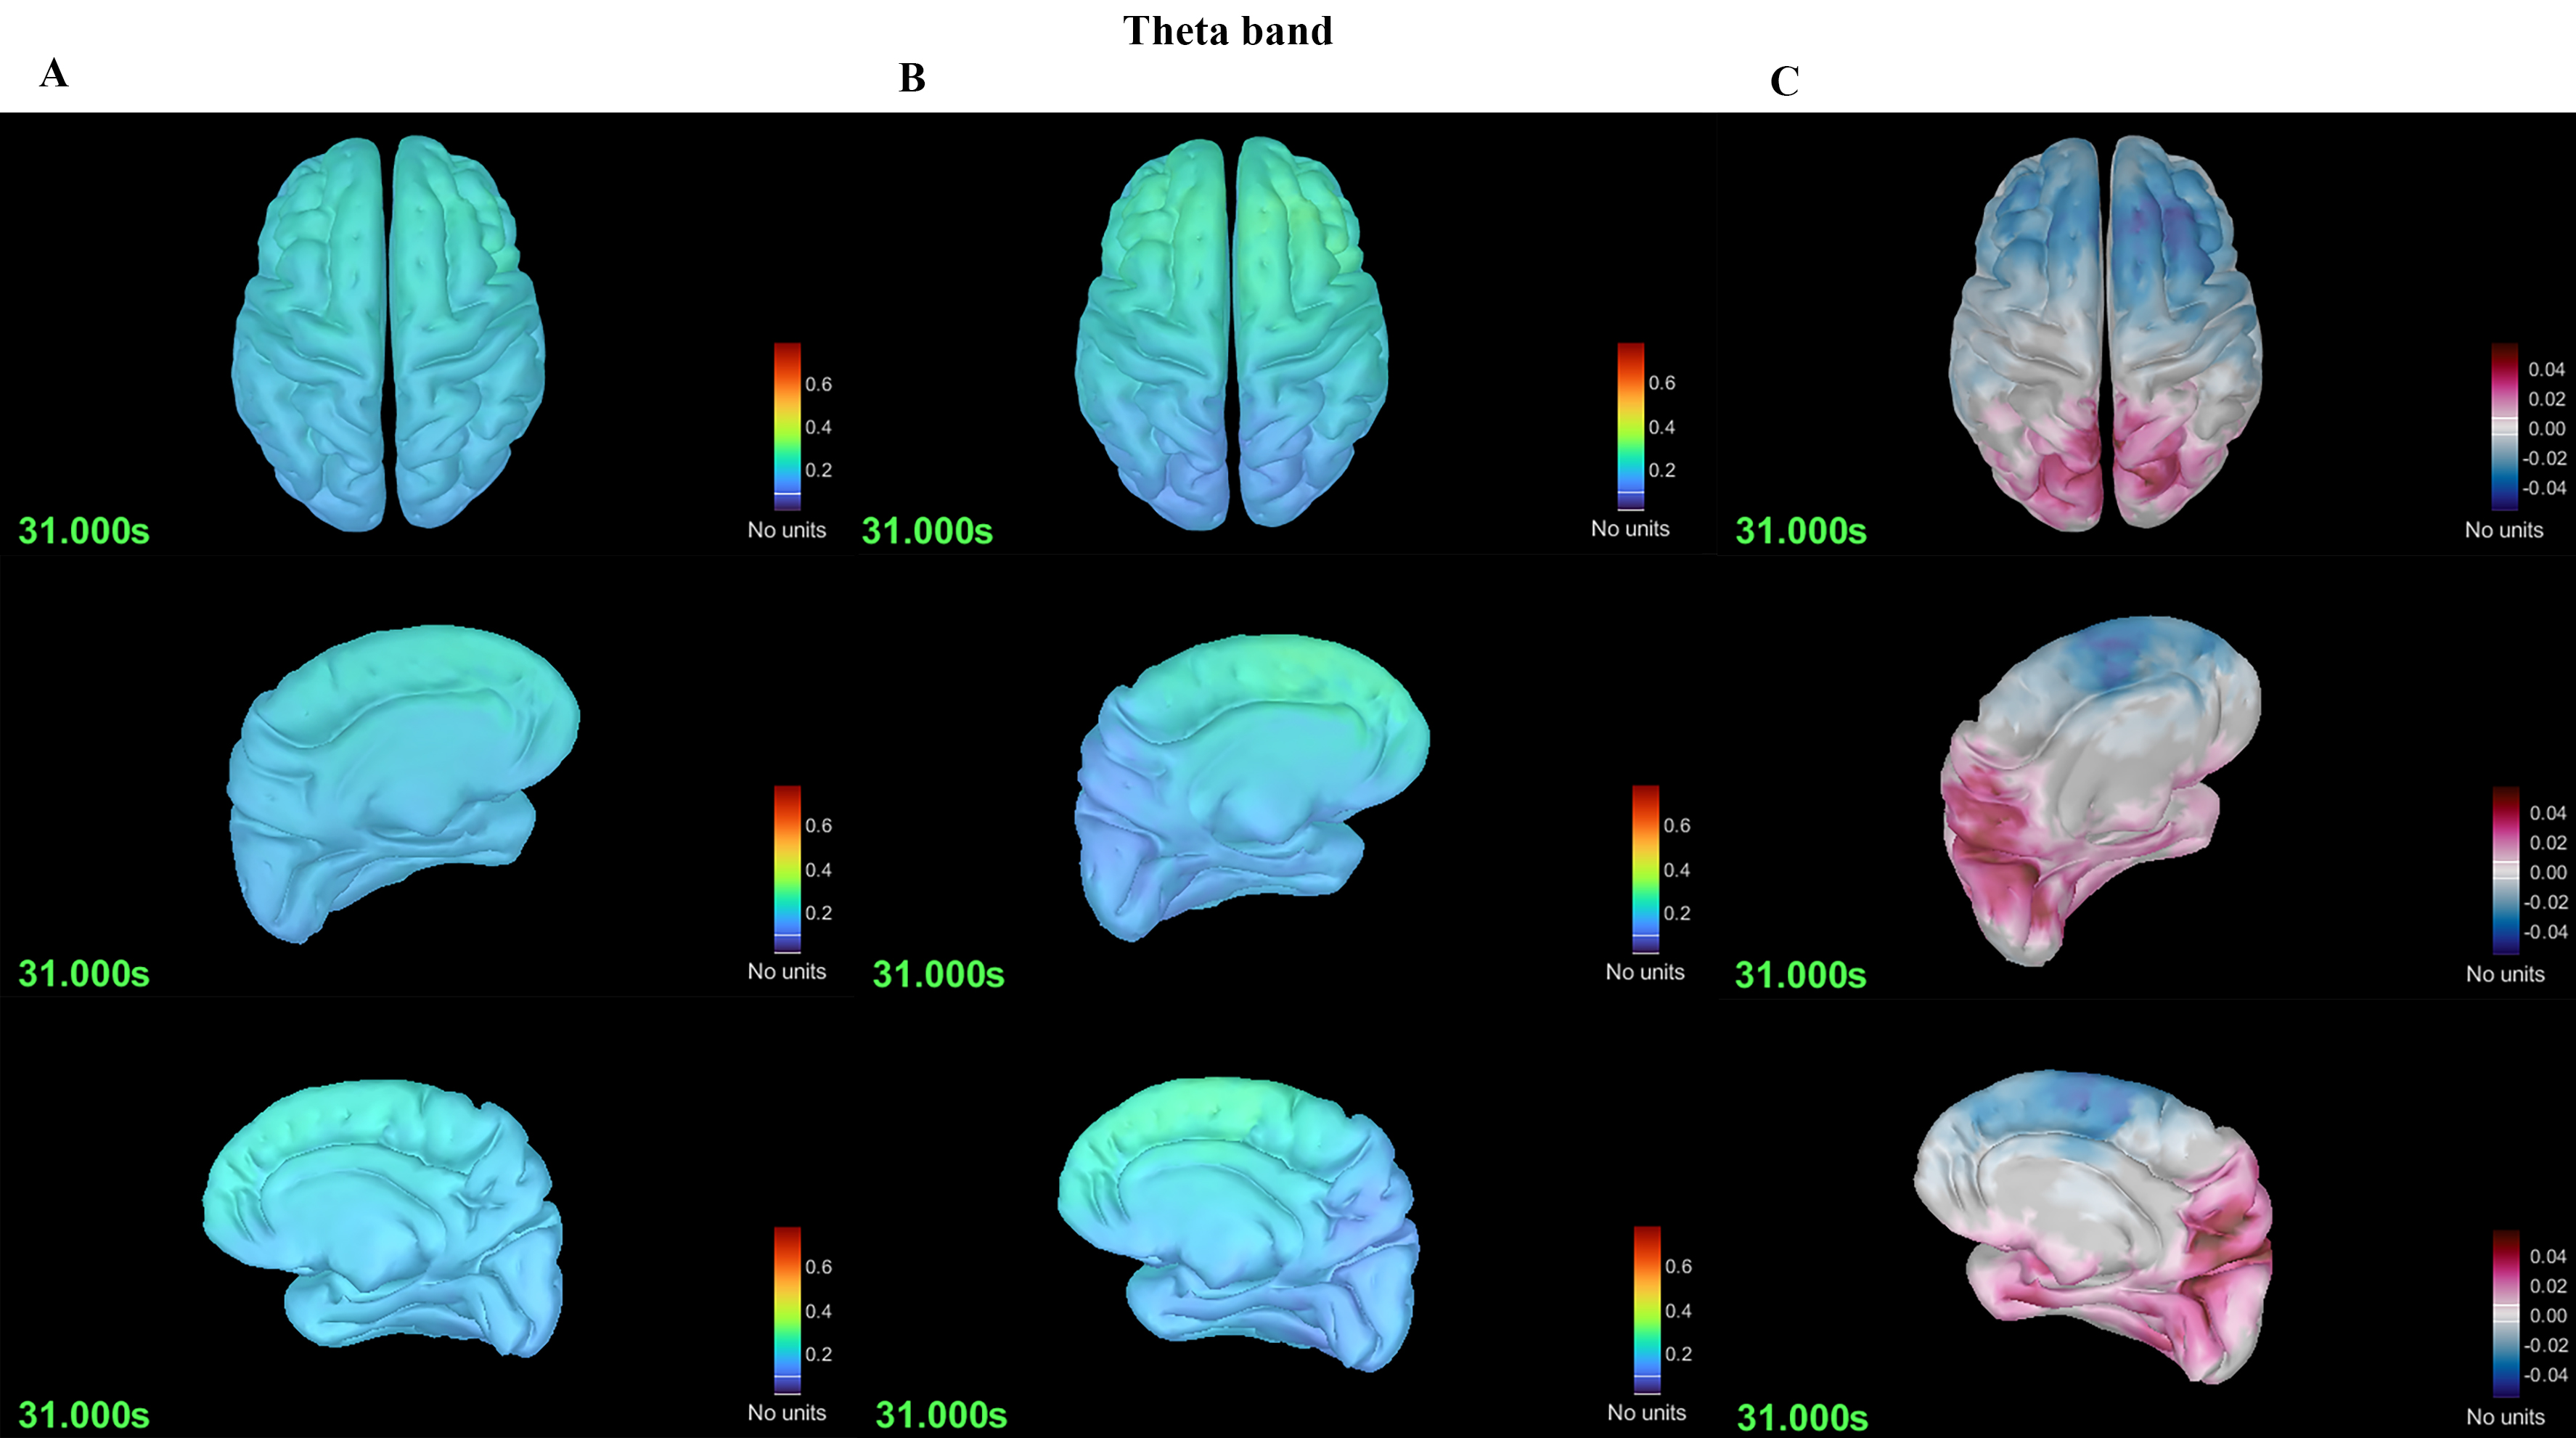 Fig. 1.
 Differences in spectral power in the theta band between the migraine without aura (MwoA) and HC groups. (A) Spectral power plot of the MwoA group. (B) Spectral power plot of the HC group. (C) Differences in spectral power between the MwoA and HC groups.
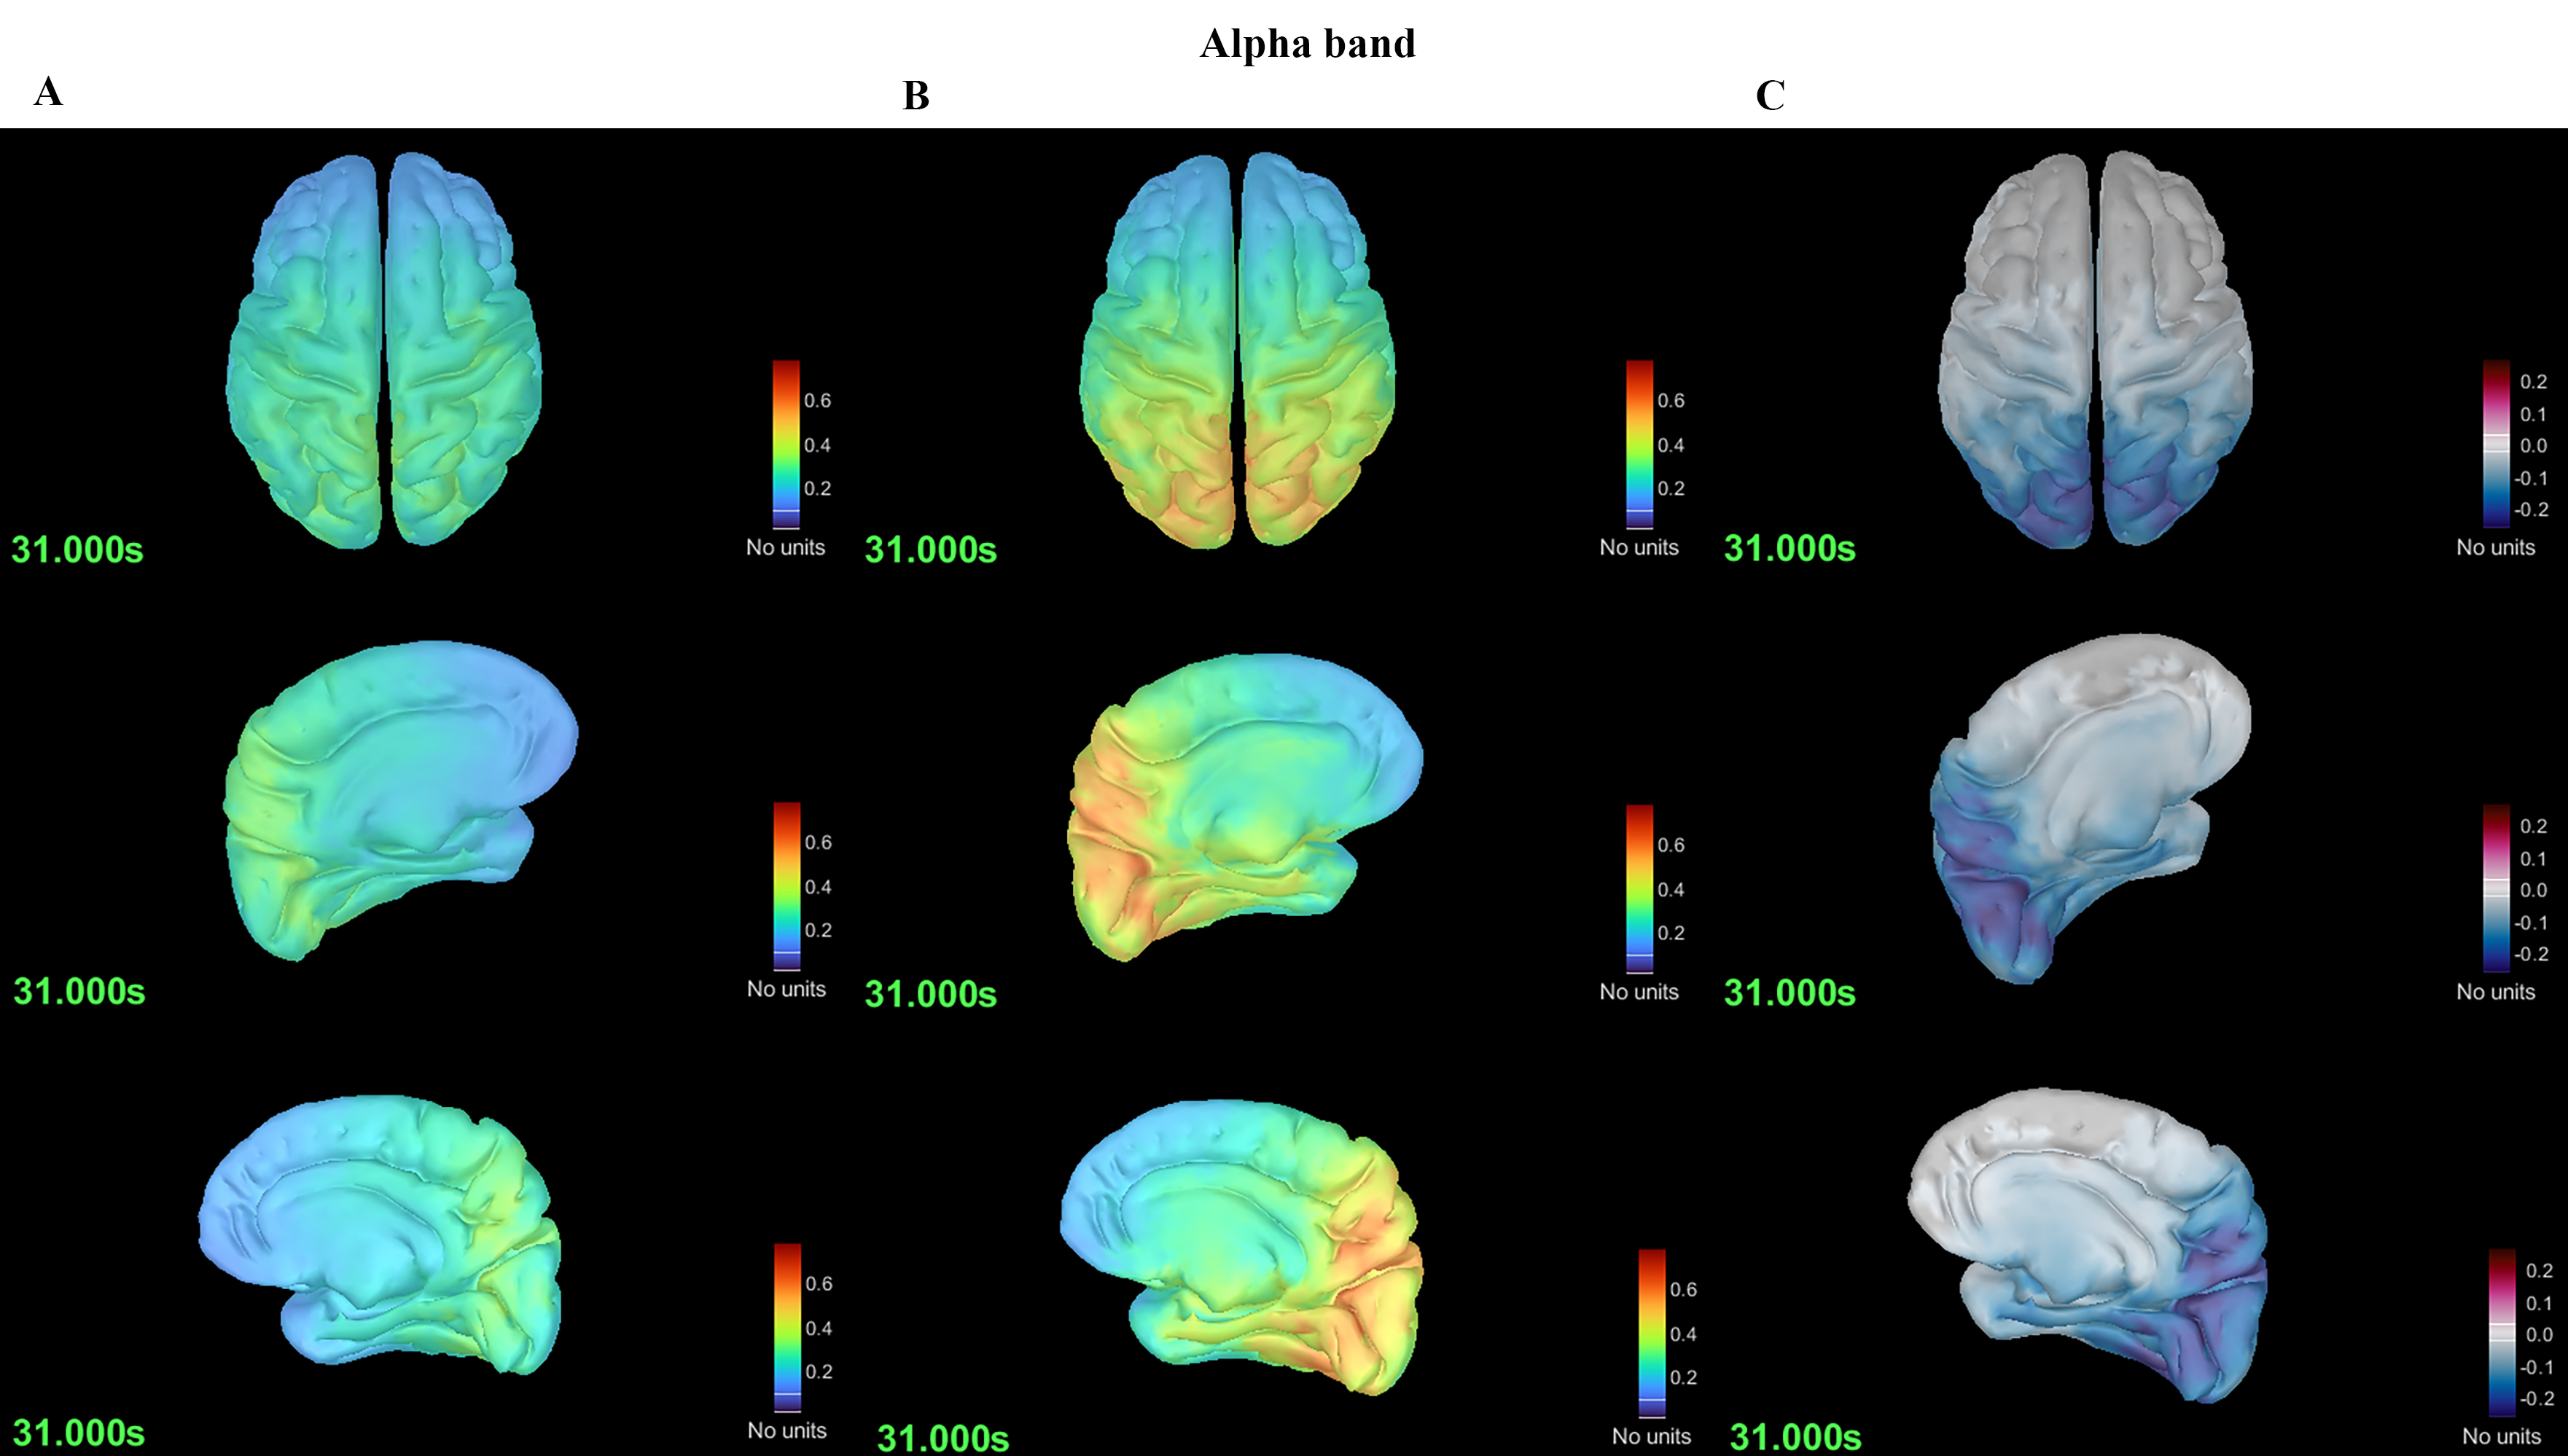 Fig. 2.
 Differences in spectral power in the alpha band between the MwoA and HC groups. (A) Spectral power plot of the MwoA group. (B) Spectral power plot of the HC group. (C) Differences in spectral power between the MwoA and HC groups.
Graph theory analysis for the whole brain revealed that, in the alpha (8–12 Hz) band, the MwoA group had a larger L than the HC group (p = 0.001), but no differences in terms of S, C, or E (Fig. 3). For the other five bands (delta, theta, beta, gamma1 and gamma2), there were no group differences in S, L, C and or E.
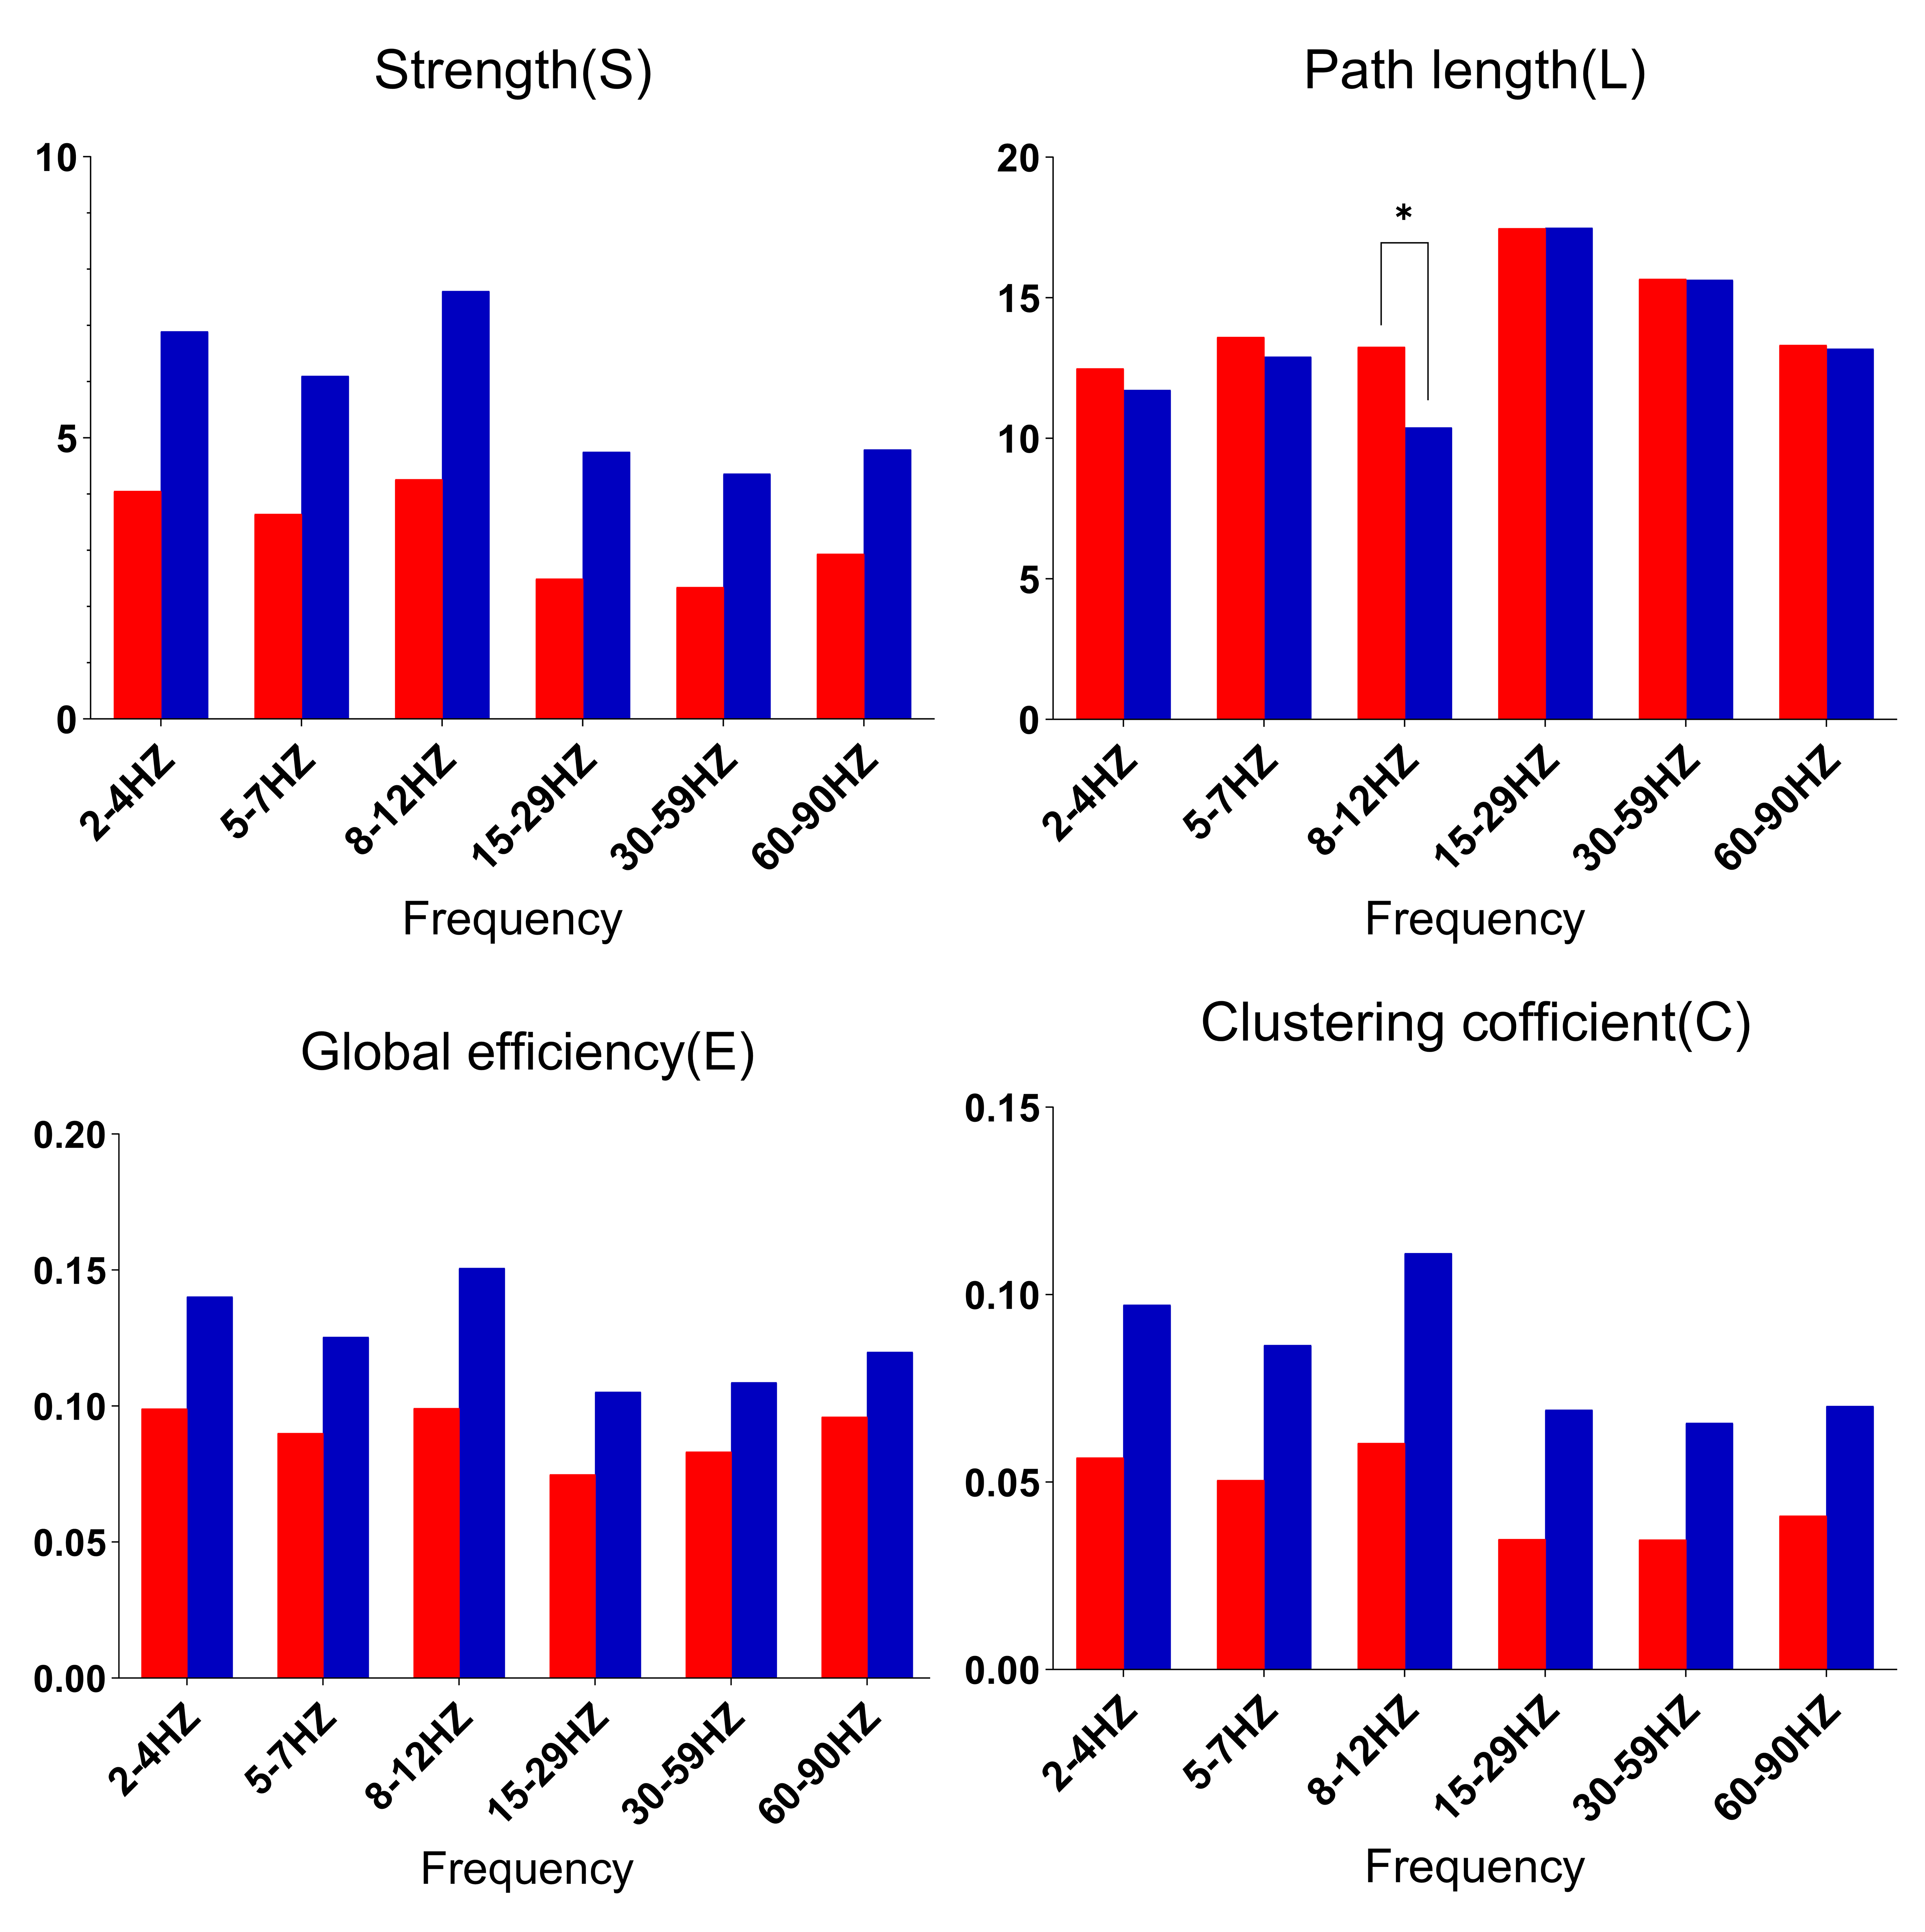 Fig. 3.
 Comparison of network parameters between the MwoA and HC groups. * denotes higher spectral power in the MwoA group than in the HC group; * p
Taking into account the influence of HAMA and HAMD on the spectral energy and graph theory analysis results of MwoA, we used linear regression analysis to correct for the control variables HAMA and HAMD, and then obtained the above results of MwoA, which still had statistical significance. We conducted Pearson correlation analyses between the spectral energy of MwoA in the theta frequency band and alpha frequency band, as well as the L value, and the clinical variable data (HAMA, HAMD, VAS). No significant correlations were found.
This study compared differences between MwoA and HC groups in terms of spectral power and brain network connectivity, with the aim of obtaining a characterization of neural activity in MwoA cases, thereby possibly providing theoretical basis for the magnetic stimulation therapy and drug treatment of MwoA in clinical practice.
We introduced graph theory analysis to quantify network connectivity strength and weaknesses to more intuitively understand the characteristics of the variations. We observed differences in the MwoA group in terms of both spectral power and network connectivity.
The spectral function of MwoA varies in a band-dependent manner. We observed that spectral power in the MwoA group increased in the theta band and decreased in the alpha band, which is consistent with the findings of a prior study [41]. Bjørk et al. [5] noted that migraine features higher theta wave power in the parieto-occipital and temporal regions. As early as 1964, Smyth and Winter [42] found that 43% of migraineurs showed abnormal theta activity in EEG (68%). Our findings that MwoA exhibits low cortical excitability in the alpha band are consistent with those of Javier Gomez-Pilar et al. [43], who used EEG to study excitability of the MwoA cortex and similarly found low cortical excitability in the alpha band in MwoA, a statistically significant difference that spread over the entire scalp.
Our study found differences in the spectral power and network topology of MwoA in the alpha frequency band. The alpha rhythm represents the most prominent neural oscillation in the human brain, particularly evident during eyes-closed wakefulness [44]. Previous studies have shown that migraineurs differ from healthy controls in alpha band activity at rest [45] or under repetitive light stimulation [46, 47]. The alpha band rhythms of migraineurs vary during the migraine cycle (pre-ictal, early-ictal and inter-ictal) [48] and over the course of the disease [5]. Prior studies of migraine neural activity in various frequency bands have found characteristic excitatory changes in the alpha band. Clemens et al. [49] and O’Hare et al. [45] compared migraineurs and HCs, finding increased spectral power of the occipital cortex in the alpha band in migraineurs. However, Neufeld et al. [50] observed a decrease in spectral power in the alpha band in patients with classical migraine. Gomez-Pilar et al. [43] analyzed the frequencies of interest and also observed a decrease in the spectral power of the occipital lobe in the alpha band in migraine patients. In a source-based analysis, Clemens et al. [49] reported an increase in spectral power in the alpha band in the anterior cuneate and posterior middle temporal gyrus in migraineurs, but a decrease in the alpha band bilaterally in the medial frontal cortex, anterior cingulate cortex, supra-frontal gyrus, and medial frontal gyrus. These inconsistent findings regarding neural activity in the alpha frequency band in the same cerebral cortex area in migraine patients may relate to the study methodology, study sample, and complexity of migraine headaches. Accordingly, results of migraine neuroexcitability should be interpreted with caution and future research is needed to increase the study population size, include patients from as many centers as possible, and use more advanced techniques to obtain more accurate data.
In contrast to traditional functional connectivity studies, graph-theoretic assessment of connectivity incorporates topological analysis, which combines algebraic topology, pure mathematics, and applied mathematics tools to study the shape or structure of complex networks [51]. Our findings refer to four main graph theory parameters, namely S, C, L and E.
L is a measure of integration of brain regions, which characterizes how easy or difficult it is for regions to communicate [21]. Shorter pathways imply stronger integration, whereas longer pathways imply weaker integration due to the longer distances that information must travel to flow between brain regions. In the current study, L in the alpha frequency band was greater in the MwoA group than the HC group, indicating that cortical information integration is weaker in MwoA. The longer L in migraine cases may relate to the multidimensional pain experience and its modulation [52]. The observed disruption of network topology in these brain regions in the MwoA group may be associated with ongoing stress and persistent pain. Changes in the network topology of the brain may imply that migraine is associated with functional reorganization, which makes migraine attacks more likely [53].
S is the average of possible connections between all signal sources, which reflects the tightness of connections in different brain regions. C indicates the likelihood that a node’s neighbors are also connected, while its mean value measures the tendency to form local clusters in the network. E denotes efficient transmission of information through a complex network [21, 38]. Prior study reports that E is low in migraine, suggesting that parallel information transfer is less efficient in the functional networks of migraineurs [54]. Similarly, the study of changes in multilayer neural networks reports that C and S are lower in migraine [55]. A study by Michels et al. [56] involving 19 HCs and 29 migraine patients similarly found that the migraine group had lower C and S in graph theoretic analyses. Migraineurs have been reported to exhibit abnormal local network topology, with one study finding high L and low C and E in migraine, suggesting that migraine brain topology is characterized by weakly integrated networks, inefficient information transfer, low centrality, and abnormal segregation [57]. In the present study, we did not observe group differences in these aspects of S, C and E, which may relate to the heterogeneity of migraine in the enrolled sample and the complexity of migraine pathophysiology.
This study is subject to several limitations. First, this is a cross-sectional study. It would have been better if a longitudinal view of changes in neural activity that occur after the initiation of migraine treatment had been conducted. Our study was a spectral energy and graph theory analysis of the overall brain region and did not examine specific MwoA brain regions of interest, which does not provide an effective target for precise magnetic stimulation of MwoA in clinical practice. We plan to follow up with a study of specific brain regions of interest to provide a better theoretical basis for the precise diagnosis and treatment of migraine.
By using MEG to analyze the spectral power and brain network topology of MwoA cases in the resting state, this study has shown that, compared to HCs, (1) MwoA cases have high cortical excitability in the theta frequency band; (2) MwoA cases have low cortical excitability in the alpha frequency band; and (3) MwoA cases have a greater path length value in the alpha frequency band. These findings suggest that changes in MwoA excitability are frequency-dependent and reflect the complexity of migraine disease. The great path length value suggests MwoA cases less capable of processing information.
MwoA, migraine without aura; HC, healthy controls; MEG, magnetoencephalography; fMRI, functional magnetic resonance imaging; EEG, electroencephalography; MNE, minimum norm estimation; AEC-c, corrected amplitude envelope correlation; FC, functional connectivity; PSD, power spectral density; SD, standard deviation; HAMA, Hamilton Anxiety Rating Scale; HAMD, Hamilton Depression Rating Scale; VAS, Visual Analog Scale; DK, Desikan-Killiany; MRI, magnetic resonance imaging; SNR, signal-to-noise ratio; ANOVA, oneway analysis of variance.
The original contributions presented in this study are included in the article, further inquiries can be directed to the corresponding author.
XZ, XW and LW designed the study. XZ, LJ, JL and ZG performed the research. XW, QS, XG and LC provided help and advice on acquiring and analyzing the raw data. XZ, FS and DG analyzed the data. XZ and LJ wrote the manuscript. XW and LW revised the manuscript. XZ obtained project funding support. All authors contributed to editorial changes in the manuscript. All authors read and approved the final manuscript. All authors have participated sufficiently in the work and agreed to be accountable for all aspects of the work.
Ethics approval was provided by the Affiliated Brain Hospital of Nanjing Medical University’s Human Research Ethics Committee (2016-KY023). All participants provided written informed consent. This study was conducted in accordance with the ethical guidelines of the Declaration of Helsinki and was reviewed and approved by the Medical Ethics Review Committee of Nanjing Brain Hospital.
We would like to express our gratitude to the patients, their families, and control individuals for study participation. We thank Dr. Yingfan Wang, Fengyuan Xu and Yihan Li for their assistance with data acquisition and processing.
This project is supported by the “Science and Technology Program of the Joint Fund of Scientific Research for the Public Hospitals of Inner Mongolia Academy of Medical Sciences”, and the funding project number is 2024GLLH0569.
The authors declare no conflict of interest.
References
Publisher’s Note: IMR Press stays neutral with regard to jurisdictional claims in published maps and institutional affiliations.