


 , Yongqiang Chen 1,†, Ke Zhao 1, Yanxuan Wei 1, Yongan Zhang 1, Kun Liu 2,*
 , Luo Shi 1,3,*
1 Department of Neurobiology, Hebei Medical University, 050017 Shijiazhuang, Hebei, China
2 Department of Laboratory Medicine, Hebei University of Chinese Medicine, 050200 Shijiazhuang, Hebei, China
3 Hebei Key Laboratory of Neurophysiology, 050017 Shijiazhuang, Hebei, China
†These authors contributed equally.
Abstract
Sodium homeostasis is crucial for physiological balance, yet the neurobiological mechanisms underlying sodium appetite remain incompletely understood. The nucleus tractus solitarii (NTS) integrates visceral signals to regulate feeding behaviors, including sodium intake. This study investigated the role of 11β-hydroxysteroid dehydrogenase type 2 (HSD2)-expressing neurons in the NTS in mediating sodium appetite under low-sodium diet (LSD) conditions and elucidated the molecular pathways involved, particularly the cyclic adenosine monophosphate (cAMP)/mitogen-activated protein kinase (MAPK) signaling cascade.
Using a murine model, sodium preference was assessed via a two-bottle choice test following LSD exposure. Previously published single-cell RNA sequencing data were re-analyzed to profile the transcriptional changes in HSD2 neurons. Pharmacological interventions employed MAPK inhibitor U0126 and cAMP inhibitor KH7 to dissect signaling contributions. Anterograde tracing and immunohistochemistry techniques were used to verify the efferent projections of HSD2 neurons. Autonomic function was evaluated by measuring blood pressure (BP), heart rate (HR), and phrenic nerve discharge (PND) parameters in anesthetized mice during HSD2 neuron activation.
LSD significantly activated HSD2 neurons and increased sodium intake. scRNA-seq analysis revealed upregulation of genes in the cAMP/MAPK pathways under LSD conditions. Pharmacological blockade of these pathways abolished LSD-induced sodium appetite. Anterograde tracing confirmed three primary downstream targets: the pre-locus coeruleus (pre-LC), lateral parabrachial nucleus (PBcL), and ventral lateral bed nucleus of the stria terminalis (vlBNST). Notably, HSD2 neuron activation did not alter BP, HR, or PND parameters, indicating no direct role in autonomic regulation.
LSD induces the activation of HSD2 neurons, which in turn causes sodium intake, a phenomenon that is eliminated by blocking the cAMP/MAPK signaling pathway. These neurons project to key forebrain and brainstem regions implicated in motivational behavior but do not directly modulate cardiovascular/respiratory functions. By replicating and extending prior research, this study supports and expands the present understanding of this field.
Keywords
- sodium
- appetite
- nucleus tractus solitarii
- RNA sequence analysis
- neurons
Sodium homeostasis is vital for electrolyte balance and extracellular fluid volume, with sodium intake playing a key role. Disruptions lead to severe health issues including hypertension and heart disease [1]. Aldosterone, a mineralocorticoid hormone, regulates sodium and potassium levels by promoting sodium reabsorption and potassium excretion in the kidneys. Hyperaldosteronism increases sodium retention and consumption, raising hypertension risks and related complications. When compared to individuals with primary hypertension, those with hyperaldosteronism have higher incidences of stroke, myocardial infarction and heart failure [2]. The reasons for these differences are not fully understood, but increased salt intake may contribute. Patients with aldosteronism often crave salt, worsening issues like left ventricular hypertrophy [3]. Reducing salt intake lowers blood pressure (BP) and potentially decrease cardiovascular complications [4], making it crucial to address aldosterone-driven salt appetite.
Excess mineralocorticoids significantly enhance sodium intake, a phenomenon initially observed in rats treated with deoxycorticosterone acetate [5, 6]. Blocking brain mineralocorticoid receptors (MRs) prevents this increased sodium appetite [7], suggesting that mineralocorticoid-sensitive neurons must drive sodium consumption motivation. Hydroxysteroid dehydrogenase type 2 (HSD2) expressing neurons are evolutionarily conserved and required for aldosterone-induced salt appetite [8]. Aldosterone acts specifically on cells expressing HSD2 and the MRs. HSD2 metabolizes cortisol and other glucocorticoids, making MR sites available for aldosterone binding [9, 10]. Thus, aldosterone-sensitive cells need both MR expression and HSD2 to prevent glucocorticoid activation. While MRs are widely expressed in the brain, HSD2 is limited to a small subset of neurons, particularly in the nucleus tractus solitarii (NTS) in human and rodent brains [8]. Persistent research efforts by Resch, Jarvie, Gasparini [11, 12, 13] and his team have shown that HSD2 neurons mediate sodium appetite following aldosterone stimulation. Despite progress in understanding HSD2 neurons, gaps remain in knowledge about their molecular, cellular, and circuit-level regulation [14, 15]. Aldosterone-inducible epithelial sodium channel (ENaC) subunits were not detected in HSD2 neurons under control or sodium-deprived conditions [11]. This was concordant with the lack of functional ENaC activity, as the ENaC inhibitor amiloride did not affect HSD2 neuron activity in sodium-deprived mice [11]. HSD2 neurons expressed serum/glucocorticoid regulated kinase 1 (Sgk1), an aldosterone/MR target gene involved in ion channel trafficking in the kidney, but its expression was not elevated in sodium-deficient mice [11]. Non-genomic effects of aldosterone signaling have been reported, but not all are sensitive to MR antagonism [16, 17]. Aldosterone is also suggested to interact with G protein-coupled receptor 30 (GPR30), although direct binding remains debated [18, 19]. Acute application of aldosterone has no effect on HSD2 neuron firing [11], suggesting that aldosterone neither signals through non-genomic means nor has sub-threshold effects in HSD2 neurons. Thus, the molecular mechanisms by which aldosterone activates central HSD2 expressing neurons appear to be distinct from its mechanisms in the kidney, warranting further investigation.
Although the core features of HSD2-neuron-driven sodium appetite have been described [11, 13], the molecular mechanisms by which dietary sodium deficiency activates HSD2 neurons remain largely unknown. Resch et al. [11] reported that chemogenetic stimulation of HSD2 neurons did not alter BP or heart rate (HR) in either anesthetized or awake-behaving mice. However, it remains unknown whether these neurons influence respiratory control. Therefore, the present work is explicitly designed as a replication-and-extension study: (1) we replicate key behavioral findings using optogenetics rather than chemogenetics; (2) we extend the physiological screen to respiration; and (3) we complement these data with a single-cell RNA-seq re-analysis to explore the transcriptional programs engaged by sodium depletion. This integrated approach strengthens confidence in prior observations while generating new mechanistic insight.
Mice of either sex (12 to 15 weeks old, 23 to 30 grams) were used in all experiments. The HSD11b2-Cre mice were purchased from Jackson Laboratories (Strain #030545, Bar Harbor, ME, United States). This line of mice was originally generated by Jarvie and Palmiter [13], who targeted Cre recombinase to the gene encoding HSD2 (HSD11b2). Mice were maintained on a 12-hour light/dark cycle at 22
Mice were anesthetized with pentobarbital sodium (60 µg/g, i.p.,P3761; Sigma-Aldrich, San Francisco, CA, USA) and secured in a stereotaxic frame. The NTS stereotaxic surgery procedure referenced our previously published paper [20]. Stereotaxic surgery was performed to inject viral vectors into the NTS of HSD11b2-Cre mice. rAAV9-hSyn-DIO-EGFP (Lot No. BC-0244, BrainVTA Co., Ltd, Wuhan, Hubei, China) labeled HSD2 neurons, while rAAV9-EF1
 Fig. 1.
 Experimental protocol. NSD, normal sodium diet and water provided ad libitum; LSD, low sodium diet and water provided ad libitum; LSD-H, a low sodium diet and water are provided ad libitum, but during the final 2 hours, the water is replaced with a 3% NaCl solution. Two separate groups of mice were used in conducting the “two bottle choice test” and the “immunofluorescent staining” experiment.
The detail method refers to our previous published paper [20]. Mice were anesthetized (urethane, 4 g/kg, i.p.), perfused with cold saline followed by 4% PFA (PBS, pH 7.4). Brains were post-fixed (4% PFA, 4 °C, 12 h), cryoprotected in 30% sucrose, and sectioned coronally. Sections were blocked (5% Bovine Serum Albumin with 0.25% Triton X-100, PBS, 30 min, room tempreture), incubated with primary antibodies (2% Bovine Serum Albumin-PBS, 4 °C, overnight), washed (PBS
Viral vectors encoding ChR2 were bilaterally injected into the NTS (rAAV9-EF1
To assess the impact of sodium deprivation on salt appetite in mice, animals were individually housed and provided with two bottles of purified water for a one-week acclimation period. On the test day, one of the water bottles was replaced with a 1.5% NaCl solution (A610476, BBI life sciences, Shanghai, China). Fluid intake was measured by manually weighing the bottles before and after consumption to calculate the liquid ingested over a 24-hour period. For more precise measurement of licking behavior during optogenetic activation of HSD2 neurons, we used a two-bottle choice lickometer system (ZS-PH; Beijing Zhongshidichuang Science and Technology Development Co., Ltd., Beijing, China). This system records the number of licks with a temporal resolution of 0.01 seconds, allowing accurate assessment of sodium preference. Mice were housed individually in cages equipped with two drinking tubes containing either distilled water or 1.5% NaCl for at least one week prior to testing. The operating principle of this lickometer system is similar to that of the Stoelting Lickometer System (https://stoeltingco.com/Neuroscience/Stoelting-Lickometer-System~10447). An electrical signal is generated each time the mouse’s tongue contacts the sipper tube, and each lick is recorded as an event within the software (Trigger Master V4.0, Shanghai VanBi Intelligent Technology Co., Ltd., Shanghai, China).
The detail method refers to our previous published paper [21]. Mice were anesthetized (pentobarbital sodium, 60 µg/g, i.p.) and a PE50 tube was inserted into the left common carotid artery, connected to a Millar Mikro-Tip® catheter pressure transducer (MIT0699, ADInstruments, Sydney, Australia). Data was recorded at 0.1 kHz and analyzed with LabChart software (PowerLab26T, LabChart 7.0, ADInstruments, Sydney, Australia).
The protocol was used as previously depicted [22]. Mice were anesthetized with urethane (1.3 g/kg, i.p.) and secured in a stereotaxic frame, underwent tracheostomy and bilateral vagotomy, then paralyzed (pancuronium, 5 mg/kg, i.p., P1918, Sigma-Aldrich, Saint Louis, MO, USA) and ventilated (100% O2). The left phrenic nerve was recorded using a silver electrode that was paraffin-immersed, while end-tidal CO2 (ETCO2) was maintained at approximately 4% as the basal level and was continuously monitored with a MicroCapStar capnograph (model 1000, CWE Inc., Ardmore, PA, USA). Signals were digitized (Micro1401), processed (rectified/smoothed: 0.1 s time constant, 2 kHz sampling, 30–3000 Hz bandpass), and analyzed offline (Spike2). Integrated PND frequency and peak amplitude were quantified.
Mice were anesthetized with pentobarbital sodium (60 µg/g, i.p.). A 27-G guide cannula (RWD Life Science, Shenzhen, China) was stereotaxically implanted into the fourth ventricle (i4V) at coordinates bregma, –6.23 mm; mediolateral, 0.0 mm; dorsoventral, –4 mm, and secured to the skull. Cannula placement was verified both intra-operatively and post-hoc. During surgery, the cannula (targeted to bregma –6.23 mm, referenced from literature [23]) was advanced while the attached 20 cm PE-50 line was filled with aCSF and held vertically. A sudden drop of the meniscus indicated penetration of the cerebellum and entry into the 4th ventricle. Following ventricle cannulation surgery, the mice were divided into three groups: aCSF (n = 10), KH7 (n = 14), and U0126 (n = 14). After a 5-day recovery period, i4V infusions were performed in conscious, freely moving mice using 33-G internal cannulas connected via 60 cm PE50 tubing to a 10 µL Hamilton 700 syringe. The syringe was mounted on a syringe pump (Pump 11 Elite, Harvard Apparatus) and infusions were delivered at a rate of 2 µL/min for one minute. KH7 (100 µM, HY-103194, MedChemExpress, Shanghai, China), a specific inhibitor of soluble adenylyl cyclase [24], and U0126 (10 µM, HY-12031A, MedChemExpress), a potent non-ATP competitive and selective MEK1/2 inhibitor [25, 26], were infused into the i4V. Control animals received an equivalent volume of vehicle (10% DMSO in corn oil). Because the internal cannula was connected to the pump via a 60 cm length of PE-50 tubing, hydraulic compliance and surface tension introduced a variable delay between pump advancement and fluid outflow. Although the pump was programmed to deliver 2 µL at 2 µL/min for 1 min, the actual volume that entered the 4th ventricle was smaller and could not be precisely quantified. Pilot tests showed that visible meniscus movement at the cannula tip lagged 15–30 s behind the pump command, estimating an actual delivered volume of approximately 1 µL. After infusion, the internal cannulas were removed and the guide cannulas were sealed. One hour later, 4 mice from each group were anesthetized and transcardially perfused for c-Fos and 11
We re-analyzed the published single-cell RNA-Seq data from Resch et al. [11] using the same preparation method as described previously. Publicly available RNA-seq data were obtained from the GEO database (accession GSE102332). Differential expression analysis was conducted using edgeR [27], with genes defined as significantly up- or down-regulated when they met the following thresholds:
Statistical analysis of data was performed using GraphPad Prism v9 (GraphPad Software Inc., SanDiego, CA, USA) and the results were expressed as the means
To test whether HSD2 neurons are activated by sodium deprivation or silenced by high sodium and to verify their role in sodium appetite, HSD11b2-Cre mice received AAV-Syn-DIO-EGFP for specific labeling of these neurons. After three weeks of viral expression, animals were maintained on standard chow and water ad libitum and then randomly assigned to three experimental groups: normal-sodium diet (NSD, n = 15), low-sodium diet (LSD, n = 11) and a low-sodium group with a terminal 2-h exposure to 3% NaCl (LSD-H, n = 6). During the fourth week (days 22–28) all mice were single-housed with two bottles of purified water to habituate. On day 29, the NSD cohort was split: nine mice continued on normal chow but one water bottle was replaced with 1.5% NaCl for 24 h and intake was determined gravimetrically, while the remaining six mice were transcardially perfused with 4% PFA for c-Fos immunostaining to assess neuronal activation. The LSD group was handled similarly: five mice were given 1.5% NaCl for 24 h with intake measured, and six were perfused for c-Fos analysis. The LSD-H group remained on LSD until two hours before perfusion, when one water bottle was exchanged for 3% NaCl; all mice were then perfused for c-Fos labeling. The timeline is summarized in Fig. 1.
Immunofluorescence results confirmed HSD2 neurons to be located near the obex of the 4V, extended caudally through the commissural NTS, and approached the spinomedullary transition (Fig. 2A). Mouse brains were sectioned into 0.02 mm-thick slices and EGFP marked HSD2 neurons bilaterally EGFP-expressing neuron soma were manually counted across six coronal sections (bregma: –8.0 to –7.0 mm; thickness, 20 µm; each separated by 120 µm) from each mouse (n = 6). Only neurons with a clearly visible soma within the tissue section were counted as part of the denominator. Each mouse had approximately 121
 Fig. 2.
 Dietary sodium deprivation increases c-Fos expression in hydroxysteroid dehydrogenase type 2 (HSD2) neurons. (A) Distribution of Enhanced Green fluorescent protein (EGFP)-labeled HSD2 neurons. Yellow areas indicating nucleus tractus solitarii (NTS) regions at different Bregma levels. 10N, vagus nerve nucleus; AP, area postrema; CC, central canal; 4V, fourth ventricle. n = 6, Scale bar = 20 µm. (B) Count of EGFP-labeled neurons across various Bregma levels. (C) Representative images showing c-Fos (red) expression in HSD2 neurons (green). Scale bar = 50 µm. (D) Distribution of c-Fos-positive neurons among EGFP-labeled neurons at varying Bregma levels. n = 6 mice per group. (E) Percentage of c-Fos-activated HSD2 neurons (EGFP+c-Fos+ neurons/total GFP+ neurons). **p
Salt preference dynamically shifts depending on physiological state. To verify that sodium deprivation can enhance sodium appetite in mice, we subjected them to one week of sodium deprivation (Fig. 1). 24-hour total fluid intake was determined by weighing the bottles. We found that NSD mice drank ~7 mL of water daily versus only ~1 mL of 1.5% NaCl, indicating a preference for water (Fig. 3A). Control mice maintained moderate salt avoidance (
 Fig. 3.
 LSD or optogenetic activation of HSD2 neurons increased sodium appetite. (A) 24-hour water intake (g) was calculated by directly weighing the water bottles before and after consumption. n = 9 in NSD (normal diet group) and n = 5 in LSD group mice. Data were analyzed using two-way ANOVA with post hoc Tukey test, ****p
A comprehensive brain-wide projection of HSD2 neurons was reported by Gasparini et al. [12]. The brain-wide projections of HSD2 neurons were reaffirmed through immunohistochemical labeling by mCherry, ensuring sensitive detection. Given that ChR2 integrates into the cell membrane along the entire length of the axon, brain tissues were utilized from mice subjected to the optogenetic experiments described above. To enhance the visibility of axonal terminals, immunostaining was conducted with an anti-mCherry antibody in brain sections. The whole brain projection pattern is depicted in Fig. 4A. Our observations confirmed that HSD2 neurons extend axons into three primary target regions: the lateral parabrachial nucleus (PBcL), the pre-locus coeruleus (pre-LC), and the ventral lateral bed nucleus of the stria terminalis (vlBNST) (Fig. 4B,C). The pre-LC receives a dense innervation of HSD2 axon terminals, which flank and streak through the LC laterally and extend medially between the LC and Barrington’s nucleus. Forebrain projections traverse the medial forebrain bundle and preoptic area to converge at the anterior commissure, where they form a dense terminal field within a specific subregion of the vlBNST. Outside the pre-LC, PBcL and vlBNST HSD2 projections are sparse, with minimal extension to the ventral lateral periaqueductal gray (vlPAG) (Fig. 4D) and scattered terminals near the ventral tegmental area (VTA) (Fig. 4E) in the ventral midbrain. Sparse boutons are also observed in the parasubthalamic nucleus (PSTh) (Fig. 4F) and lateral hypothalamus (LH) (Fig. 4G), with minimal HSD2 axonal presence in the central amygdala (CeA) (Fig. 4H) and paraventricular nucleus of the hypothalamus (PVH) (Fig. 4I) rostral to these areas. This mapping confirms the specific neural pathways of HSD2 neurons.
 Fig. 4.
 Validation the efferent projections of HSD2 neurons. (A) Sagittal diagram summarizing the axonal projections of HSD2 neurons. (B) Schematic of the lateral parabrachial nucleus (PBcL) and pre-locus coeruleus (pre-LC) locations in the mouse brain atlas, and fluorescent images of HSD2 axons (mCherry+, red) in the PBcL (left) and pre-LC (right). Tyrosine hydroxylase (TH)-positive neurons (blue) indicating the LC region. Sections were immunostained with an anti-mCherry antibody to enhance visibility. (C–I) Fluorescent images of HSD2 axons (mCherry+, red) in the ventral lateral part of the bed nucleus of the stria terminalis (vlBNST) (C), the ventrolateral periaqueductal gray (vlPAG) (D), the ventral tegmental area (VTA) (E), the parasubthalamic nucleus (PSTh) (F), lateral hypothalamus (LH) (G), the central amygdala (CeA) (H), and paraventricular nucleus of the hypothalamus (PVH) (I). Schematic drawing of coronal brain slices is shown in the left side of each fluorescence image (the specific nucleus area is indicated in yellow). Arginine vasopressin (AVP, green) denotes the location of the PVH.
To probe LSD-driven mechanisms in HSD2 neurons, we re-analyzed scRNA-seq data. This analysis expanded upon the foundational work of Resch et al. [11], by leveraging RNA-Seq data retrieved from the Gene Expression Omnibus database under the accession code GEO: GSE102332. In their experiments, mice were fed either a standard chow (0.3% Na+) or LSD (0.02% Na+) for 8–12 days. Subsequently, HSD2 neurons were manually picked from both the control (n = 33) and Na+ deficient (n = 32) groups for RNA profiling. Using the region-specific NTS marker Phox2b along with specific neuronal markers HSD2 (Hsd11b2) and MR (Nr3c2), it was confirmed that HSD2 neurons were successfully sequenced. Post the implementation of quality control protocols, we identified a cohort of 1193 genes that exhibited differential expression patterns. Specifically, 1079 genes were upregulated and 114 were downregulated in the LSD group when compared to the control group (
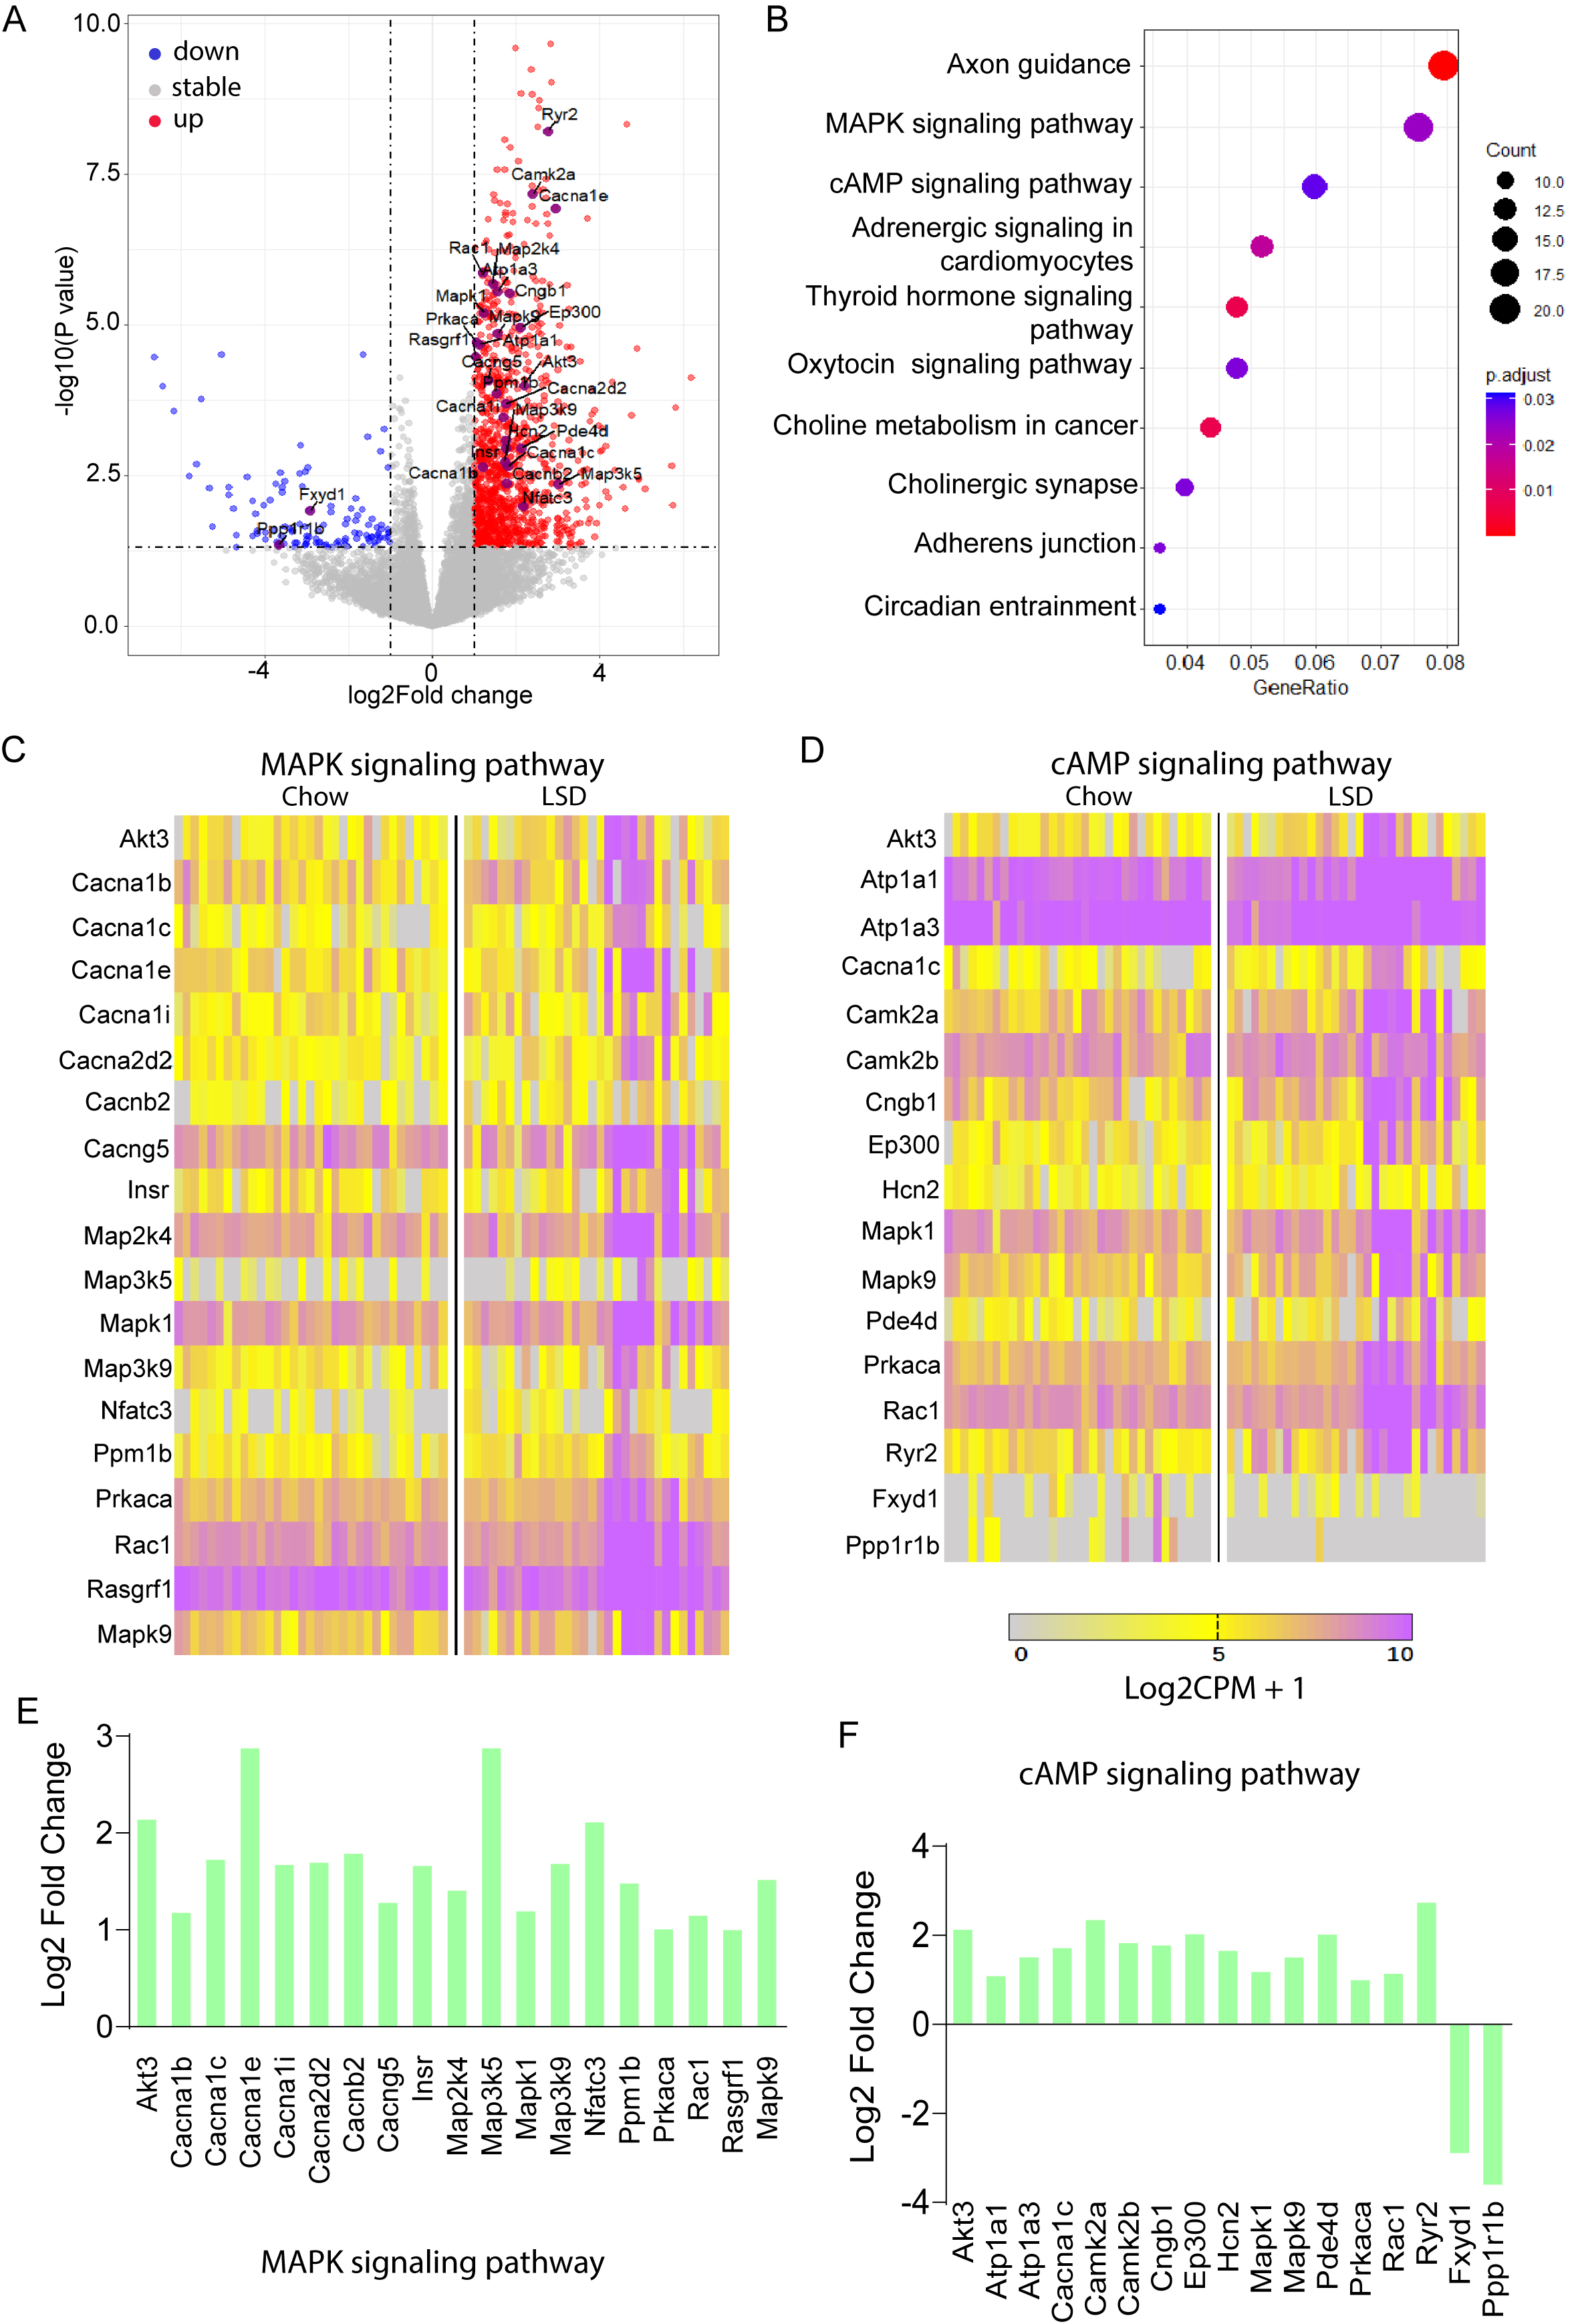 Fig. 5.
 Re-analysis of RNA-seq data reveals enrichment of mitogen-activated protein kinase (MAPK) and cyclic adenosine monophosphate (cAMP) signaling pathways in HSD2 neurons under LSD conditions. (A) Volcano plot illustrating genes affected by sodium deprivation. Dots (red) outside the gray-shaded area, indicate genes that are significantly upregulated (1079), while dots (green) indicate genes that are downregulated (114) in response to sodium deprivation (
Kyoto Encyclopedia of Genes and Genomes (KEGG) pathway analysis of differentially expressed genes identified the axon guidance pathway as the most significantly enriched, followed by mitogen-activated protein kinase (MAPK) and cyclic adenosine monophosphate (cAMP) signaling pathways (Fig. 5A). A volcano plot distinctly marked all differentially expressed genes associated with these pathways (Fig. 5B). Detailed examination revealed complete upregulation of all 19 genes in the MAPK pathway (Fig. 5C) and predominant upregulation in the cAMP pathway (15 of 17 genes upregulated, 2 downregulated; Fig. 5D). Quantitative expression changes for these genes are presented in Fig. 5E (MAPK pathway) and Fig. 5F (cAMP pathway), demonstrating significant pathway-specific alterations. These findings highlight the potential involvement of axon guidance and intracellular signaling cascades in regulating the observed biological processes.
Gene Ontology (GO) analysis of differentially expressed genes in HSD2 neurons revealed key functional implications (Fig. 6). Enriched terms included “inorganic anion transport” (GO:0015698), critical for maintaining neuronal ion homeostasis and regulating membrane excitability; “postsynaptic membrane organization” (GO:0001941), indicating potential modifications in synaptic structure and receptor distribution; “glutamate receptor binding” (GO:0035254), suggesting altered excitatory input strength; and “channel activity” (GO:0015267), reflecting potential changes in ion channel function. These findings collectively indicate that the identified genes may significantly modulate HSD2 neuron excitability through coordinated effects on ion transport, synaptic architecture, and receptor signaling, with likely consequences for neural circuit function and behavior.
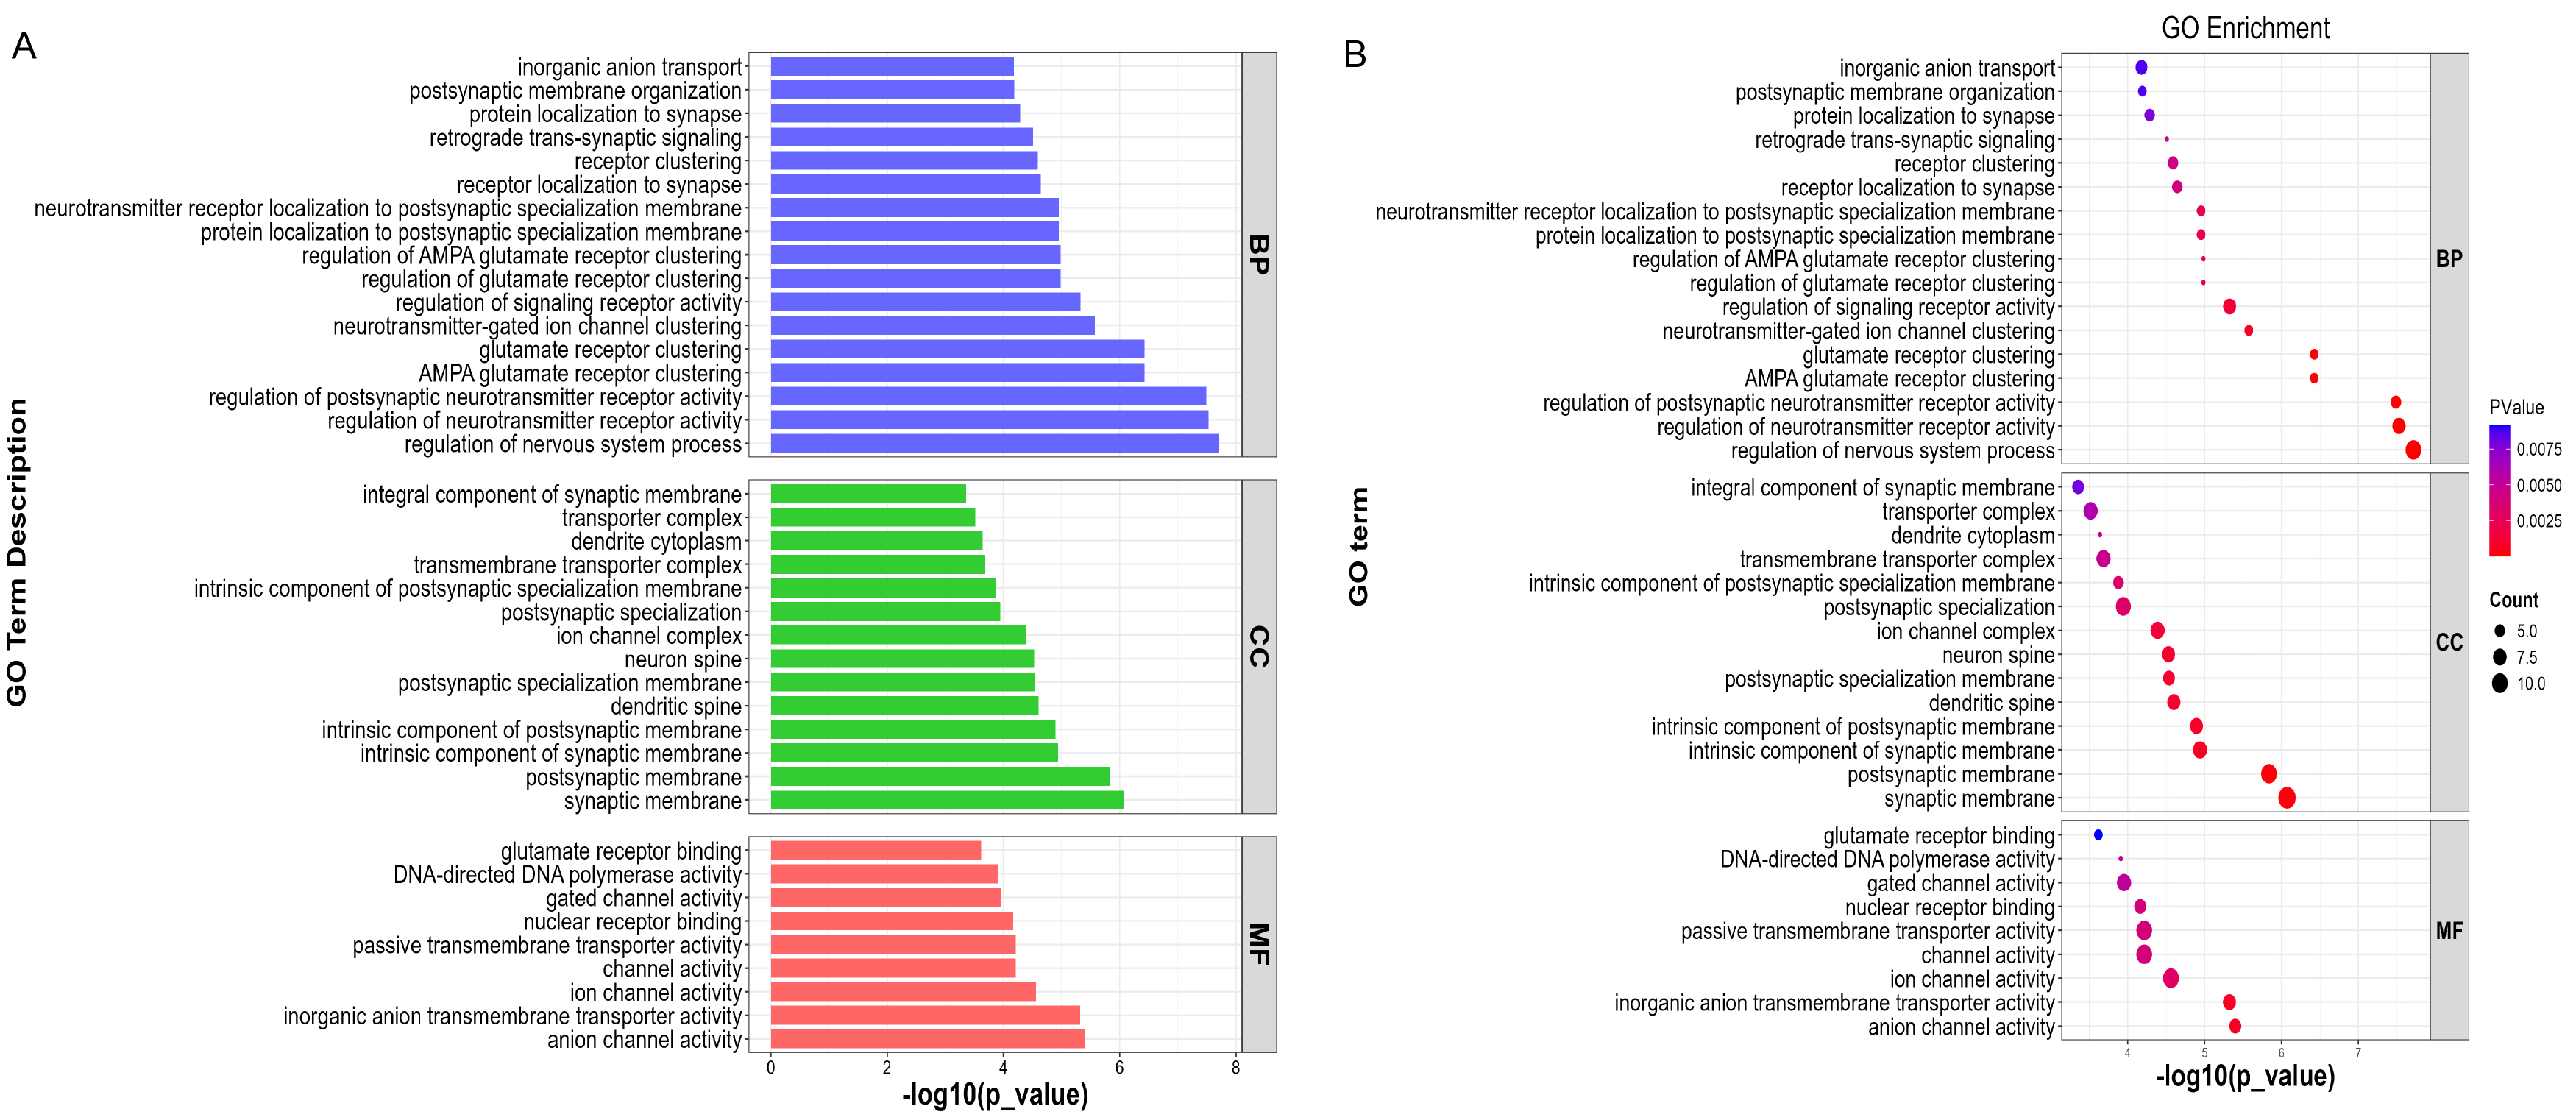 Fig. 6.
 Single-cell transcriptomic re-analysis of HSD2 neurons during sodium deficiency. (A) Statistically significant gene ontology (GO) terms (David database) of genes upregulated by sodium-deficient conditions. BP, biological process; CC, cellular compartment; MF, molecular function. (B) Bubble Chart of GO Terms.
In conclusion, the LSD-associated excitation of HSD2 neurons may involve transcriptional changes that increase cAMP and activate cAMP dependent protein kinase A (PKA), potentially activating the MAPK pathway and modulating neuronal excitability and sodium appetite. Although aldosterone/MR signaling is a plausible mechanism, further studies are required to confirm this.
To determine whether MAPK and cAMP pathways mediate LSD-induced sodium appetite, cannulas were implanted into the fourth ventricle of LSD-fed mice and either the MAPK inhibitor (U0126) or cAMP inhibitor (KH7) were administered, with aCSF as control. Sodium preference was then assessed using two-bottle choice tests. Cannula placement accuracy was verified post-hoc by blue dye injection (Fig. 7A). Pharmacological inhibition of key signaling pathways significantly altered sodium preference in LSD-fed mice (Fig. 7B). Control (aCSF-treated) animals showed strong saline preference (6.87
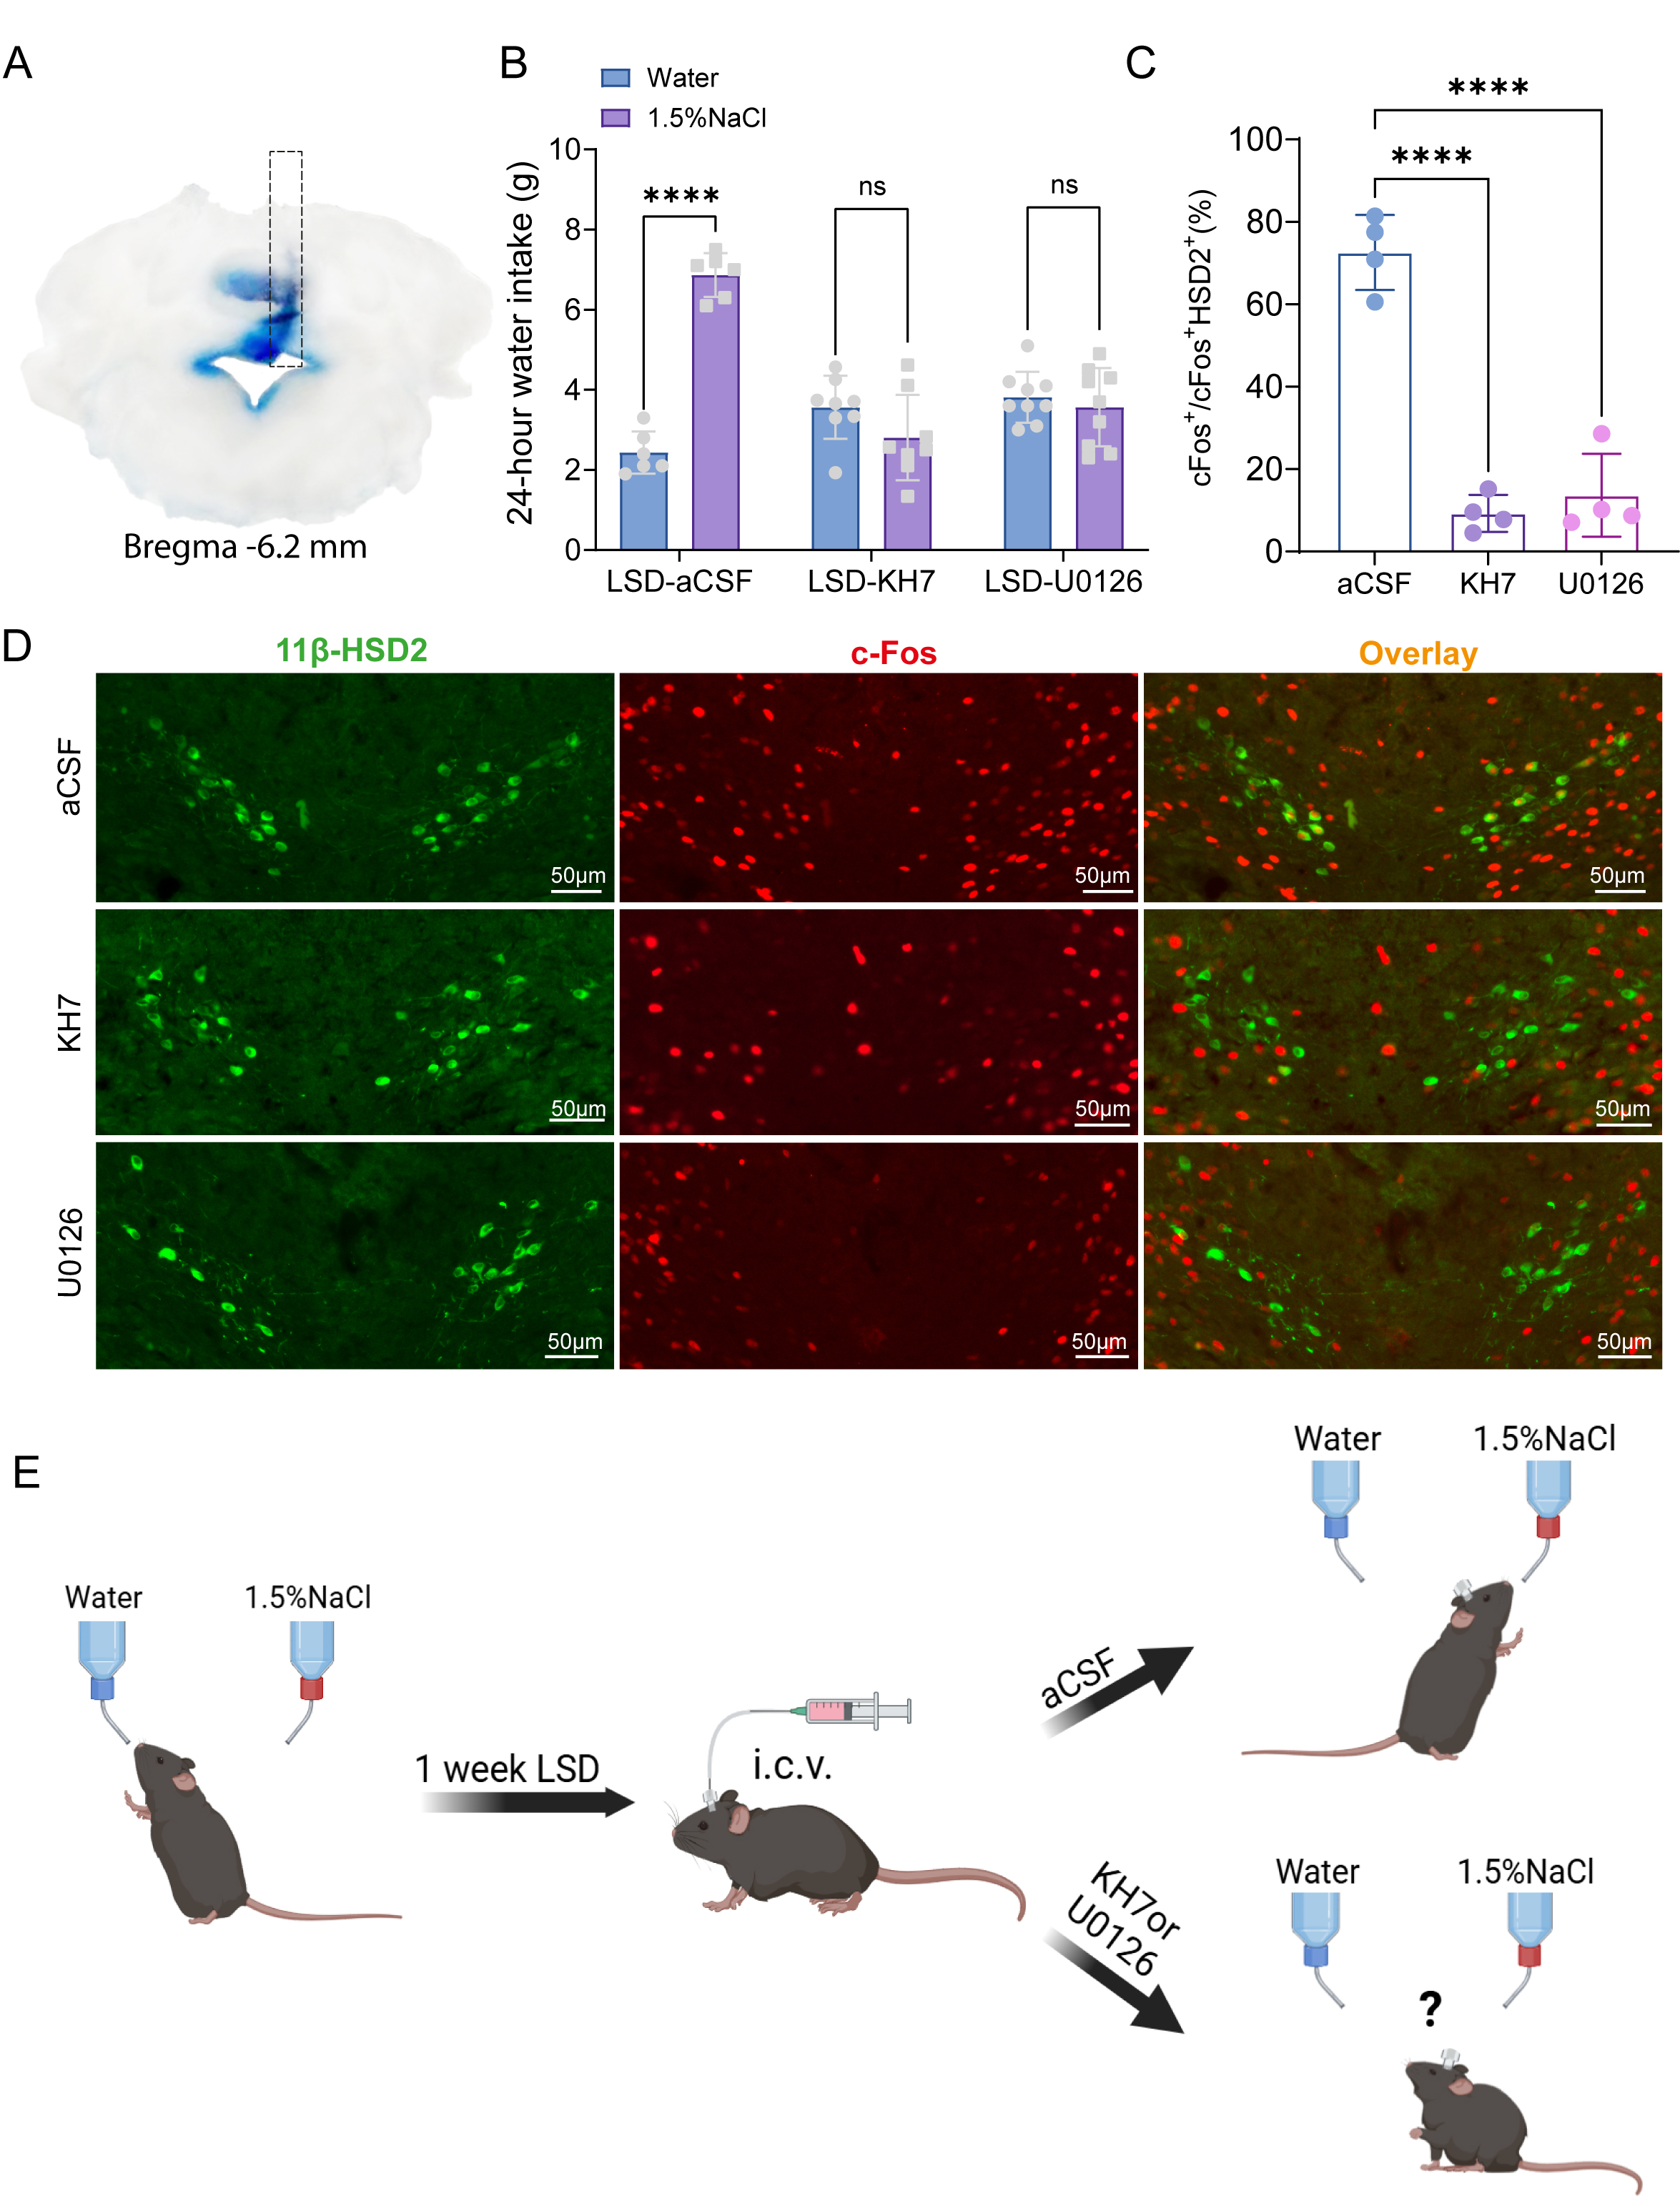 Fig. 7.
 Disruption of sodium appetite by inhibiting MAPK or cAMP pathways in mice on LSD. (A) A diagram illustrates the cannula placement in the i4V for drug delivery. Blue areas in brain sections show precise Pontamine Sky Blue injection into the i4V. (B) Bar graphs showing the volume of 1.5% NaCl solution and water consumed by mice in the aCSF (n = 6), KH7 (n = 8), and U0126 (n = 9) groups over 24 hours. Data are presented as mean
In summary, the MAPK and cAMP pathways are integral to the molecular mechanisms that underlie the activation of HSD2 neurons in response to low-sodium conditions. These pathways likely work in concert to regulate the neuronal activity and subsequent behavioral response that drives sodium intake in mice (Fig. 7E).
The knowledge regarding genes selectively targeted by aldosterone/MR in the brain is still incomplete. To address this, the currently reported canonical targets of aldosterone/MR signaling were analyzed (Fig. 8A,B). It was confirmed that known target genes of theoretical interest, such as the aldosterone-inducible subunits of the ENaC, including Scnn1a, Scnn1b and Scnn1g, were absent in both control and sodium-deprived HSD2 neurons. Interestingly, HSD2 neurons did express Sgk1, which is known to mediate aldosterone-induced trafficking of ion channels in the kidney. However, its expression was not upregulated in neurons from sodium-deficient mice. Among the known aldosterone/MR target genes expressed in HSD2 neurons, it was confirmed that two were found to be significantly upregulated under sodium-deficient conditions: WNK lysine-deficient protein kinase 1 (Wnk1) and the
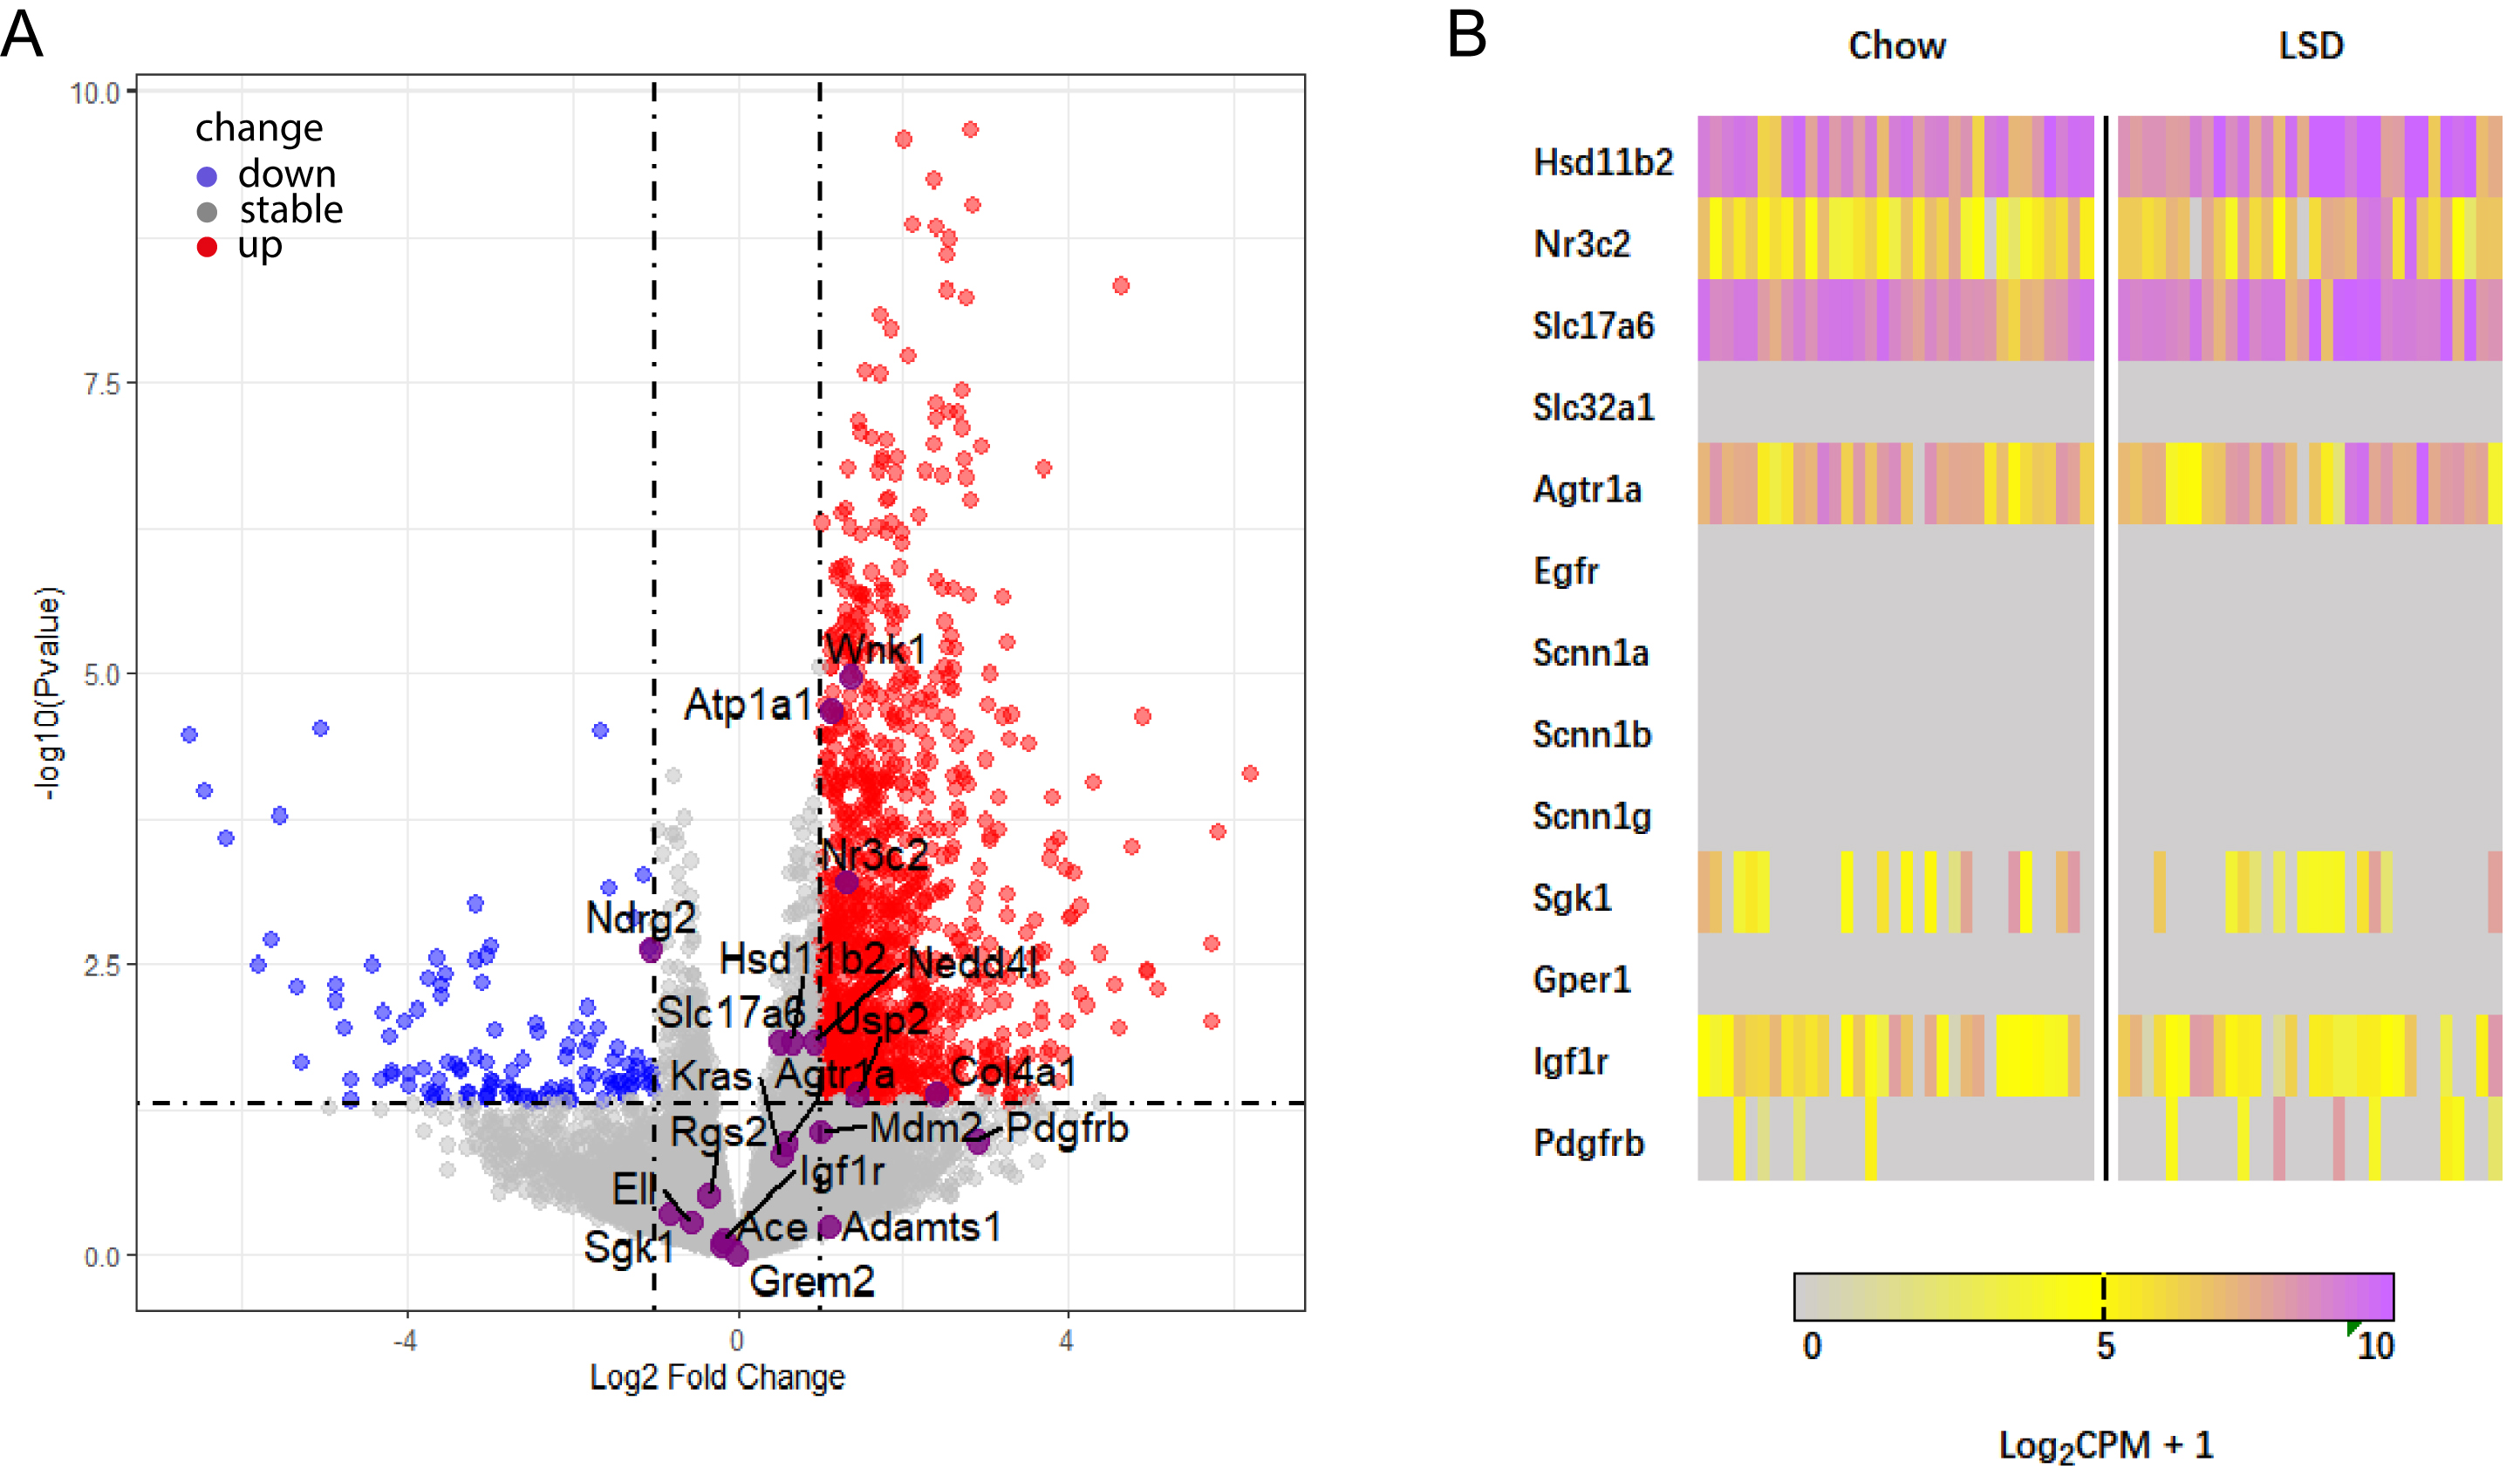 Fig. 8.
 Re-analysis of RNA-seq data confirms altered expression of mineralocorticoid receptor (MR)-associated genes in HSD2 neurons under LSD conditions. (A) Volcano plot illustrating the differential expression of MR-regulated genes upon sodium deprivation. Genes represented by color dots exhibit significant expression changes (log2 fold change
HSD2 neurons location in the NTS, which plays a crucial role in regulating cardiorespiratory functions [28], would make it reasonable to hypothesize that HSD2 neurons regulate BP and breathing. To test this, an optogenetic virus was injected into the NTS of HSD11b2-Cre mice (Fig. 9A). Under anesthesia, these neurons were blue light -activated these neurons and monitored arterial BP and PND. This investigation will aim to reveal whether HSD2 neuron activation influenced these physiological parameters, offering insights into their broader regulatory functions beyond sodium appetite. Fig. 9B illustrate the immunofluorescence validation of ChR2-mCherry expression in NTS. Results revealed that blue light activation of HSD2 neurons at various frequencies had no significant impact on the arterial BP and HR of the mice (Fig. 9C,D). Similarly, the activation of HSD2 neurons did not significantly alter the frequency and amplitude of PNDs (Fig. 9E–G). To confirm that optogenetic stimulation indeed activated HSD2 neurons, mice were perfused with 4% PFA one hour after blue light (10 Hz) activation, followed by immunofluorescent c-Fos staining. Analysis of results from three mice revealed that 68.1% of mCherry-positive neurons were also c-Fos positive (Fig. 9H), demonstrating that optogenetic stimulation effectively activated a majority of HSD2 neurons. Taken together these results indicate that HSD2 neurons, as activated in the current experimental paradigm, do not appear to coordinate autonomic regulation of cardiovascular and respiratory functions.
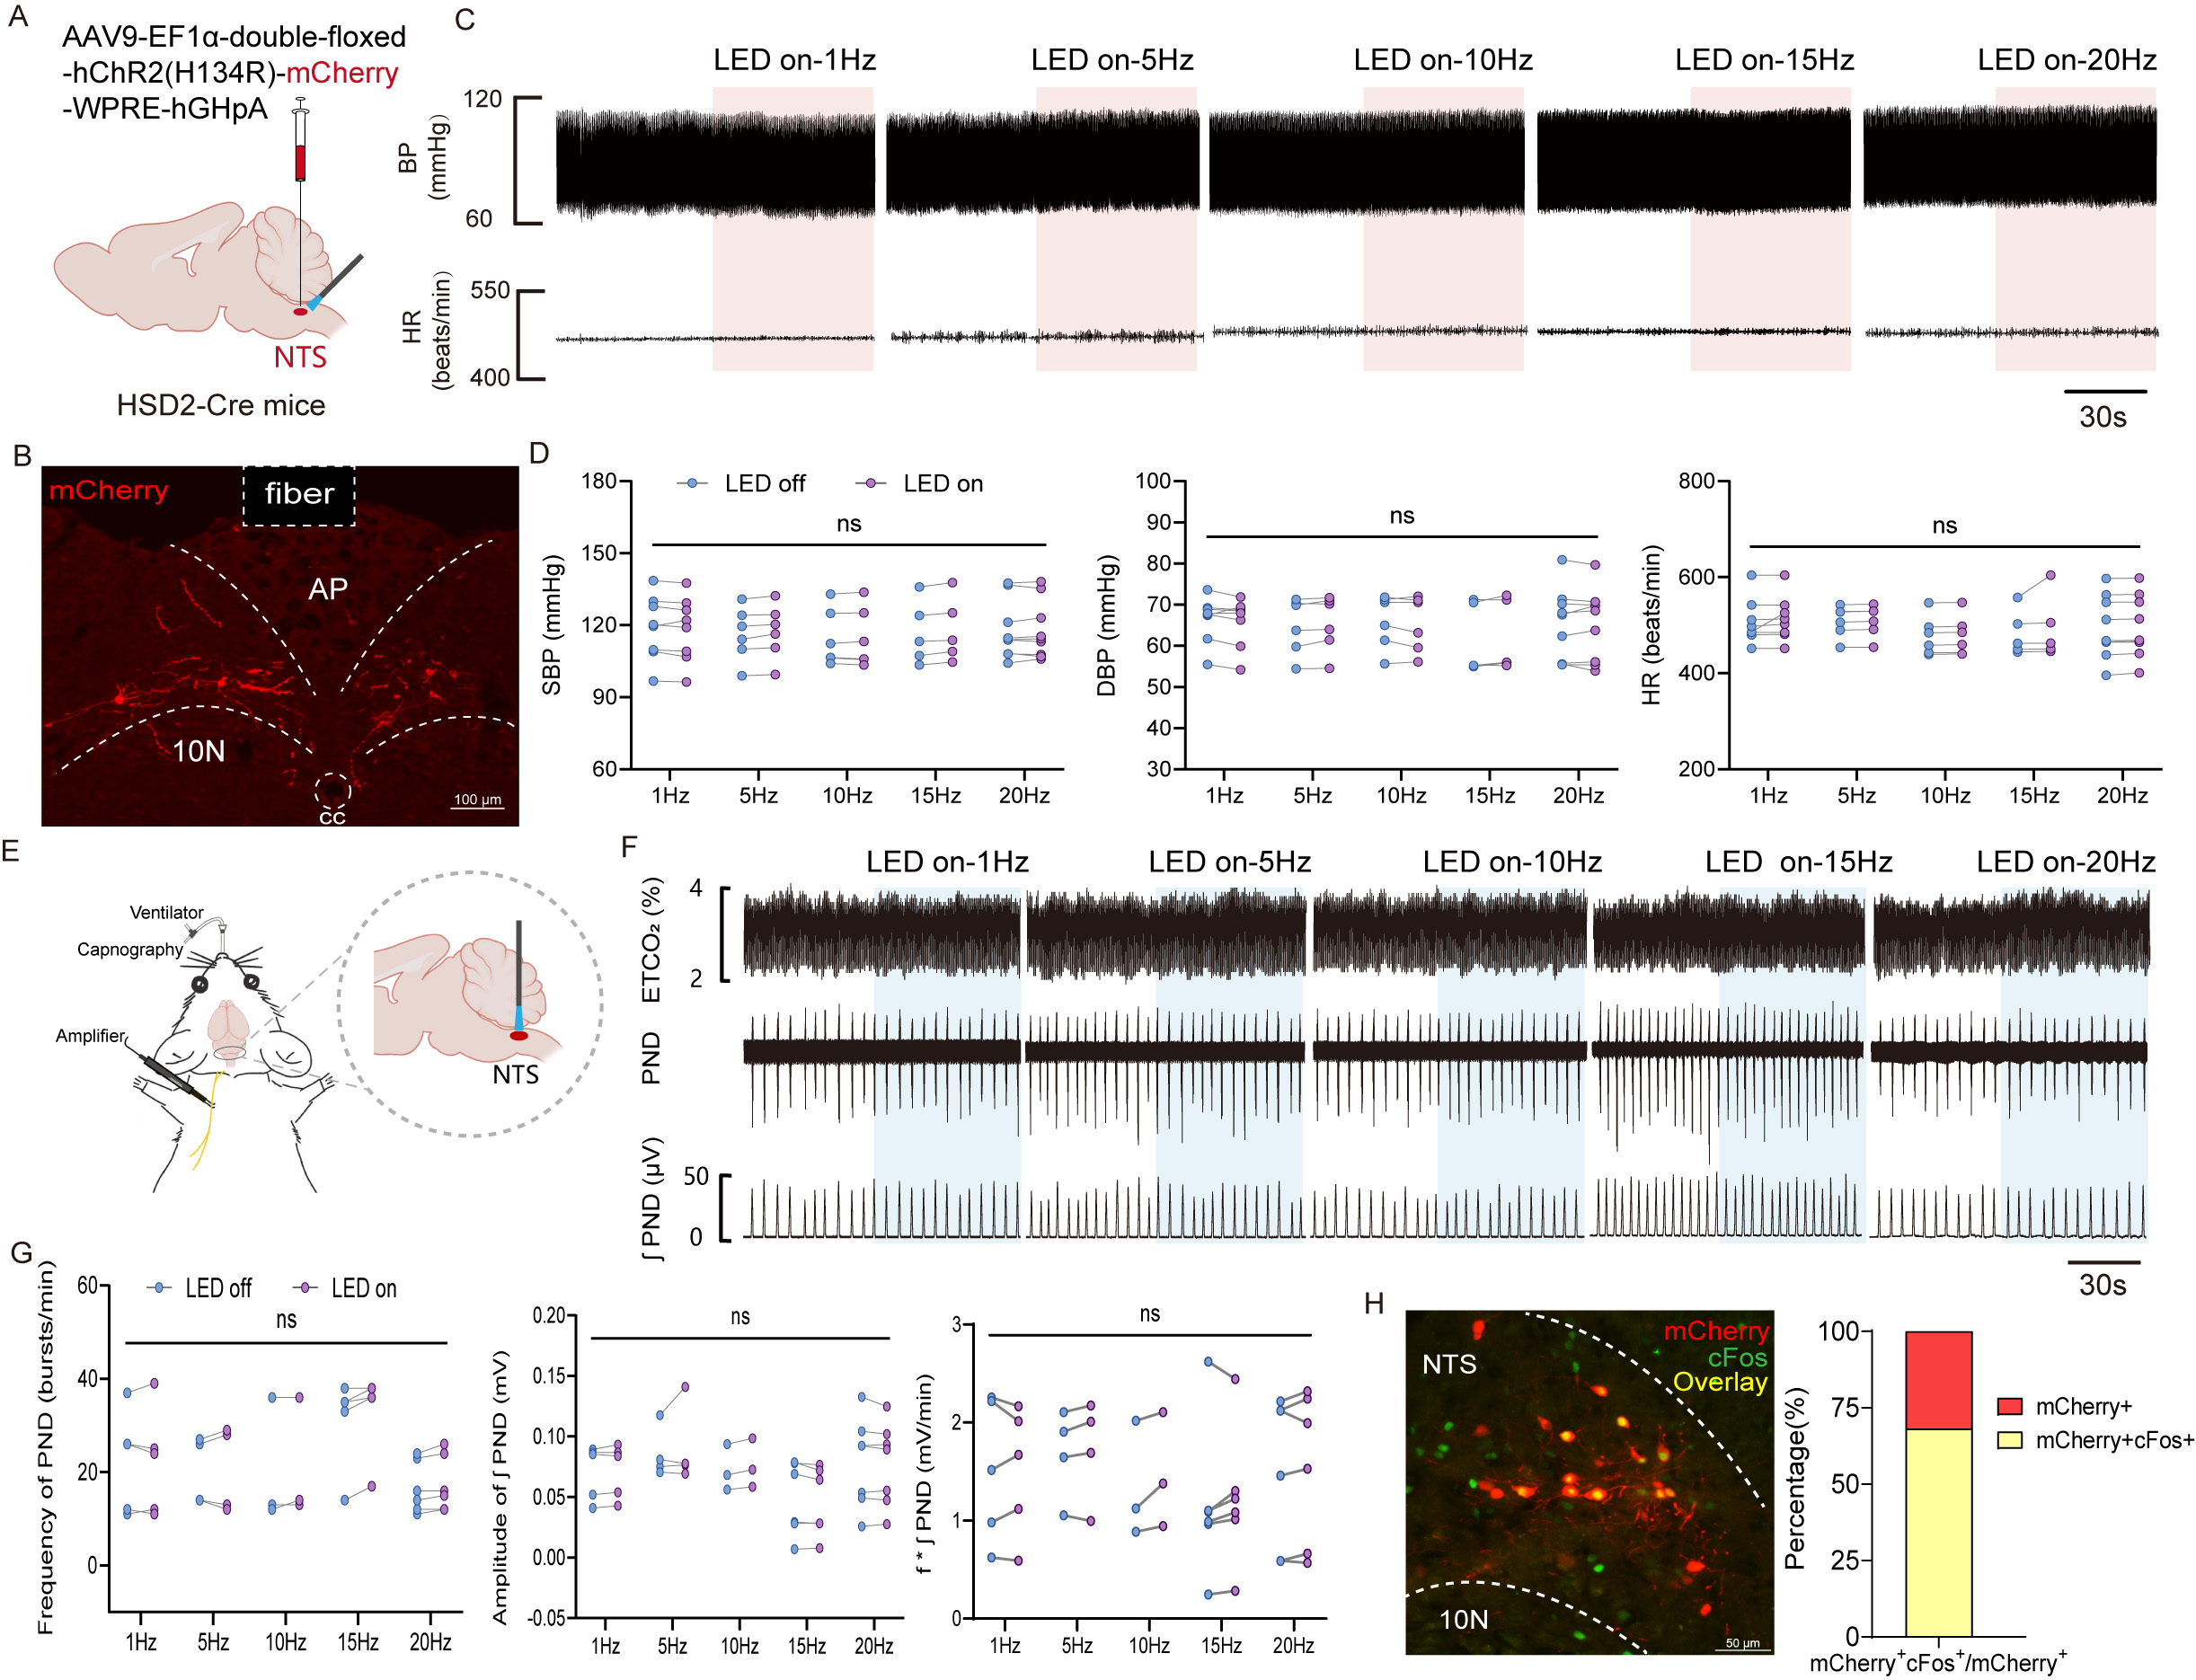 Fig. 9.
 Effect of activation HSD2 neurons on cardiovascular parameters and phrenic nerve discharge (PND). (A) Schematic of AAV-DIO-ChR2-mCherry injections. (B) Validation of ChR2-mCherry expression in NTS. Scale bars = 100 µm. (C) Typical traces of blood pressure (BP) and heart rate (HR) in response to 1, 5, 10, 15 and 20 Hz light frequencies stimulation (10 ms pulse width, 10 mW, 60 s). Scale bar = 30 seconds. (D) Changes in systolic BP, diastolic BP, and HR from BP recordings following optogenetic stimulation at various frequencies. The sample sizes (n) for 1 Hz, 5 Hz, 10 Hz, 15 Hz, and 20 Hz are 8, 6, 6, 5, and 9 respectively. (E) Optogenetic activation and schematic of PND recordings in anesthetized mice. (F) Representative traces showing the effect of 1 Hz, 5 Hz, 10 Hz, 15 Hz and 20 Hz photostimulation (10 ms pulse width, 10 mW, 60 s) on PND. (top) End-tidal CO2 (ETCO2); (middle) raw waveforms of PND; (bottom) PND integration (
Previous studies have highlighted the role of HSD2 neurons in regulating sodium appetite during sodium deficiency and analyzed their brain-wide projections and roles [8, 11, 12, 13]. Findings reported here validate this conclusion. Furthermore, optogenetic stimulation of the somata of HSD2 neurons was employed and an intake of saline (1.5% NaCl) was observed, without any significant alterations in BP, HR, or respiration. These findings complement previous experiments, in which chemogenetically stimulating HSD2 neurons or optogenetically stimulating their axons in vlBNST increased saline (3% NaCl) intake [8, 11, 13]. These findings also complement previous experiments, in which chemogenetic stimulation of HSD2 neurons failed to alter BP or HR in anesthetized and awake-behaving mice [11]. Upon re-analyzing single-cell sequencing data, it was found that in neurons of sodium-deficient mice, the cAMP and MAPK signaling pathways are significantly upregulated. Using KH7 and U0126 reduced sodium preference from LSD and reduced c-Fos expression in HSD2 neurons, indicating these pathways are important for activating neurons during sodium deficiency. Given that the drug was delivered into the 4V, we cannot rule out the possibility that its effects arose from actions on circumventricular neurons other than the NTS. Consistent with this interpretation, Monteiro et al. [31] reported that sodium depletion-induced activation of the MAPK pathway in the lamina terminalis was suppressed by i.c.v. administration of a MAPK inhibitor.
Most experimental tests of sodium appetite in rodents have been performed using 3% NaCl (0.51 M) as the test solution, as rats and mice typically drink little to no saline at this concentration until they develop a sodium appetite. In contrast, 1.5% (0.25 M) saline is not considered an ideal test solution because mice consume significant amounts of this concentration at baseline without sodium deprivation [32]. However, selection of 1.5% NaCl was based on the findings from Evans et al. [29]. In that study, it was shown that 11
Our RNA-seq re-analysis is based entirely on the data published by Resch et al. [11] (GSE102332). In their study, mice assigned to the sodium-deprivation group received a low-sodium food (0.02% Na+) for 8–12 days, whereas control mice were maintained on standard chow (0.3% Na+). In our experiments, the sodium-deprived group was given low-sodium food (0.05% Na+) for 7 consecutive days, and controls received normal food (0.28% Na+). These methodological differences may complicate direct comparison between the two datasets. Additional variables—including mouse strain, housing conditions, and the strategy used to label HSD2 neurons—could also influence the outcomes. Nonetheless, the two-bottle choice test confirmed a robust sodium appetite, and c-Fos immunostaining verified activation of HSD2 neurons, indicating that our experimental paradigm effectively recruits this neuronal population. Re-analysis of the RNA-seq data revealed enrichment of MAPK and cAMP signaling pathways in HSD2 neurons under low-sodium conditions, a finding we corroborated with pharmacological. Resch et al. [11] applied a differential-expression threshold of
Aldosterone binding to cytosolic MR forms homodimers, leading to nuclear translocation for genomic effects over hours to days and also triggers rapid non-genomic responses via second messengers [17]. Aldosterone-MR signaling in the brain is less well understood, and while MR gene regulation has been most studied in the hippocampus (crucial for memory and anxiety-related behaviors), the lack of HSD2 expression in this region suggests that MR signaling is primarily mediated by glucocorticoids [10, 33, 34]. The genomic effects are most evident in aldosterone-sensitive epithelial cells, such as those found in the distal nephron, colon, and sweat gland ducts [35]. In these cells, aldosterone regulates sodium reabsorption both by controlling channels such as ENaC, Sodium Chloride Cotransporter (NCC) and Na+, K+-ATPase [35, 36, 37, 38] and by regulating the transcription of kinases like Sgk1 and Wnk1 [39, 40, 41, 42, 43]. However, aldosterone-inducible ENaC subunits were absent in HSD2 neurons, while Sgk1 was expressed but unchanged in salt deficiency mice. Vallon et al. [44] demonstrated that Sgk1 null mice do not develop a sodium appetite in response to deoxycorticosterone acetate (DOCA) treatment, highlighting the need for further investigation into the role of Sgk1 in regulating HSD2 neuron activity and sodium appetite. Two known aldosterone/MR target genes, Wnk1 and Atp1a1, were significantly upregulated by sodium deficiency. Though Sgk1 expression does not change significantly, the genomic effects of aldosterone cannot be ruled out, and the upregulation of Wnk1 by low sodium induction on the excitability of HSD2 neurons still requires further investigation. The genomic effects of MR are also be influenced by epigenetic mechanisms and posttranscriptional regulation by microRNA, adding further complexity to its action [45, 46].
Non-genomically, MR triggers rapid responses through second messenger systems such as MAPK, PI3K, and Protein Kinase C (PKC), which facilitate immediate adjustments in electrolyte handling and vascular function [47]. Several cell culture studies have suggested a functional interaction between aldosterone/MR and the cAMP/the cAMP response element-binding protein (CREB) signaling pathway in MR-dependent nongenomic effects [48]. MR also interacts with membrane-associated proteins, activating both nearby tyrosine kinase and G-protein-coupled receptors and engages in signaling crosstalk with other pathways such as the nuclear factor of activated T-cells and CREB [17, 48]. Cheng et al. [49] demonstrated that aldosterone rapidly increases intracellular levels of cAMP and inositol trisphosphate (IP), activating multiple proteins in murine distal convoluted tubule cells within minutes. These rapid non-genomic effects are primarily mediated by the EGFR [17] and the GPR30 [50], which signal via cAMP or IP3 and respond to aldosterone stimulation [51, 52]. By engaging these receptors, aldosterone acutely modulates the phosphorylation of various kinases and kinase substrates within the MAPK/ERK, PI3K/AKT, and cAMP/PKA signaling pathways. Additionally, other mediators of rapid aldosterone effects, such as the IGF1R and PDGFR, may also be involved in these rapid signaling cascades [49, 53]. However, it is important to note that the expression of GPR30, EGFR, IGF1R, and PDGFR is either undetectable in HSD2 neurons or remains largely unchanged by sodium deficiency. Resch et al. [11] did not observe any rapid effects of aldosterone on HSD2 neurons in ex vivo brain slices. This suggests that aldosterone had no acute effects on HSD2 neurons in the experimental setup employed here. The specific roles of these receptors in HSD2 neurons require further investigation.
scRNA-Seq of HSD2 neurons in sodium-deprived mice showed enhanced excitability due to upregulated ion channel genes for hyperpolarization-activated cyclic nucleotide-gated channels (HCN) channels, CaV2.3, and NaV1.5. HCN channels are permissive, while NaV1.5 and CaV2.3 boost state-dependent firing [11]. Aldosterone/MR signaling integrates with cAMP and MAPK pathways to regulate ion channel function. In HCN channels, PKA-mediated cAMP phosphorylation increases channel opening probability, vital for rhythmic neuronal firing [54, 55, 56]. Sgk1 regulates NaV1.5 by inhibiting neural precursor cell expressed, developmentally down-regulated 4-like (Nedd4-2) and phosphorylating NaV1.5 to change its kinetics [57, 58, 59]. Persistent PKA activation also moves NaV1.5 to the cell surface in adult rat ventricular myocytes [60]. The exact mechanisms of aldosterone/MR’s effects on these channels in HSD2 neurons are unclear, but cAMP and MAPK likely play key roles. Studies showing that both aldosterone and angiotensin II modulate HSD2 neuron function highlight the complexity of understanding the molecular activation of HSD2 neurons in sodium deficiency [11, 61, 62, 63]. While scRNA-Seq efficiently finds differentially expressed genes, it’s unclear which are directly controlled by sodium deficiency/aldosterone-MR signaling and which are indirectly regulated by increased activity.
NTS neurons receive direct synaptic input from viscerosensory afferents, including peripheral chemoreceptors, baroreceptors, and pulmonary stretch receptors, which are well-known for mediating autonomic reflexes [20, 28, 64, 65]. Therefore, it was initially predicted that HSD2 neurons are involved in the regulation of BP and respiratory function [14, 66, 67]. However, it has since been shown that activating HSD2 neurons does not induce acute changes in BP. It has also demonstrated here that optogenetic activation of HSD2 neurons in anesthetized mice does not alter BP or PND. This is consistent with the projection characteristics of HSD2 neurons, as they do not form direct synaptic connections with nuclei in the medulla that are involved in cardiorespiratory regulation [12]. Of course, this does not rule out the possibility that HSD2 neurons may influence respiratory and BP regulation through effects on higher-order central mechanisms.
HSD2 neurons are critical for sodium appetite under LSD conditions, mediated by cAMP/MAPK signaling. These neurons project to key forebrain and brainstem regions implicated in motivational behavior but do not directly modulate cardiovascular/respiratory functions. These findings advance understanding of the neurocircuitry governing sodium homeostasis and identify potential therapeutic targets for disorders of electrolyte imbalance.
The datasets used and analyzed during the current study are available from the corresponding author on reasonable request.
XZ performed the research, acquired the data, and wrote the manuscript. YC conducted experiments and analyzed data; KZ, YW and YZ provided help and advice on experimental operations and data analyses. LS and KL designed, supervised and coordinated the study, and revised the manuscript. All authors contributed to editorial changes in the manuscript. All authors read and approved the final manuscript. All authors have participated sufficiently in the work and agreed to be accountable for all aspects of the work.
Animal use followed the ARRIVE 2.0 guidelines (https://arriveguidelines.org/arrive-guidelines) and adhered to the Guide for the Care and Use of Laboratory Animals of the Chinese Association for Laboratory Animal Science. It was approved by the Animal Care and Ethics Committee of Hebei University of Chinese Medicine (DWLL202503024).
We also thank the Core Facilities and Centers, Institute of Medicine and Health for experimental and technical support.
This work was funded by funds from the Science Research Project of Hebei Education Department (BJ2025052, QN2025434).
The authors declare no conflict of interest.
Supplementary material associated with this article can be found, in the online version, at https://doi.org/10.31083/JIN42286.
References
Publisher’s Note: IMR Press stays neutral with regard to jurisdictional claims in published maps and institutional affiliations.