


 , Bilal Husain 2, Jaleesa Stringfellow 3, Mauricio R. Delgado 1, Suchismita Ray 2,*
1 Department of Psychology, Rutgers University, Newark, NJ 07102, USA
2 Department of Health Informatics, Rutgers School of Health Professions, Rutgers University, Newark, NJ 07102, USA
3 Center for Molecular and Behavioral Neuroscience, Rutgers University, Newark, NJ 07102, USA
Abstract
The brain’s valuation network, including the ventral striatum and ventromedial prefrontal cortex (VMPFC), represents the value of rewards and punishments and underpins decision behavior. These neural signals are not fully characterized in individuals recovering from prescription opioid use disorder (POUD).
We tested the hypothesis that neural responses to monetary gain and loss differ in individuals recovering from POUD relative to individuals without prior substance use.
Twenty-three individuals in an early stage of recovery from POUD (abstinent 2–3 weeks after admission to an inpatient treatment facility, no other substance use disorder), and 21 neurotypical controls group individuals without prior history of substance use completed a card guessing task during functional magnetic resonance imaging (fMRI), gaining or losing small monetary amounts after each guess. Whole-brain and valuation network regions of interest (ROI) analyses compared POUD and control group fMRI signal responses to monetary gain and loss outcomes.
Ventral striatum signal change following gain and loss outcomes differed between the POUD and control groups. Specifically, time series analysis suggested that left ventral striatum responses following monetary losses remained elevated for a longer duration in POUD compared with control group participants.
This exploratory, small sample study suggests brain responses to non-drug incentives may differ in POUD compared with neurotypical controls, which has implications for understanding affective responses in individuals recovering from POUD.
Keywords
- addiction
- substance use disorder
- reward
- punishment
- valuation
- incentive
- striatum
When individuals with opioid use disorder (OUD) undergo recovery, it is important to consider how they respond to non-drug incentives. Prior research suggests that responses to non-drug rewards and punishments differ in individuals with substance use disorder compared to individuals without a history of substance use. These differences have been examined in individuals with substance use disorders involving opioids, nicotine, cannabis, and stimulants [1, 2]. Theoretical explanations of drug-seeking behavior suggest that increased motivation for drug rewards is partly in compensation for diminished positive experience of non-drug rewards in OUD [3]. Similarly, theory suggests that avoidance of non-drug punishments and negative affect are a key motivator for substance use [4]. Indeed, both diminished positive emotion (linked to positive non-drug rewards) and enhanced negative emotion (linked to aversive non-drug punishments) are characteristics of individuals with OUD [5]. The current study uses small monetary gains and losses to examine brain responses to non-drug incentives in individuals recovering from OUD, relative to a control group that has no history of substance use.
Prior research demonstrates that positive and aversive non-drug-related incentives elicit affective experiences that differ in OUD compared to individuals with no substance use history. For example, current and abstinent heroin users exhibit blunted responses to positive, pleasant affective (i.e., rewarding) non-drug stimuli (e.g., erotic images) and increased responses to negative affective stimuli (e.g., images of body injury/mutilation) [2, 6, 7]. Similarly, substance users including heroin, heroin and cocaine mixed, cocaine, and alcohol users showed reduced arousal responses to positive non-drug images relative to individuals with no history of drug use [7]. Specifically, heroin users showed reduced arousal responses to positive images and increased arousal responses to negative images in comparison to the control group [7]. This previous research has identified important differences in affective experience during recovery from OUD, but the potential neural basis of these differences is not fully studied in this population.
Neural responses to positive non-drug reward and aversive non-drug punishments are one avenue to more fully understand the distinct affective experience of non-drug stimuli in individuals with OUD. The perceived value of these stimuli is theorized to be represented by neural activity in regions including the ventral striatum and ventromedial prefontal cortex (VMPFC), which are targets of midbrain dopaminergic neurons and part of the mesocorticolimbic pathway [8, 9, 10]. However, drugs of abuse can alter responses in this circuit leading to disturbed valuation of drug-related stimuli [11]. While valuation of drug-related stimuli is well-studied, less attention has been paid to neural responses that underlie valuation of non-drug incentives. Natural reward cues elicit increased activity throughout the mesocorticolimbic circuit in healthy individuals [12, 13, 14] and a decrease in activity in this circuit among drug users, including nicotine, alcohol, cocaine, and cannabis users [15, 16, 17, 18], indicating reduced valuation of rewards. Due to dysregulation of this circuitry that underlies valuation of both positive and aversive stimuli, individuals with substance use disorders may exhibit reduced sensitivity to natural rewards that originate from healthy behaviors and social connections. Instead, they may rely on substance use to preserve a sense of wellbeing [19]. This dysregulation of the brain’s valuation network that may result from chronic substance use then also contributes to the maintenance of drug-use behavior [20, 21].
Though dysregulation of non-drug incentive responses is a key issue in several types of substance use disorders, previous research examining recovery from OUD has not focused on responses to positive and negative non-drug incentives in the brain’s valuation system. In the present study, we examine the neural responses to monetary reward in individuals with prescription opioid user disorder (POUD) who are in the first month of recovery, in contrast to a control group without any history of drug use. We hypothesize that neural responses to monetary gain and loss differ in individuals recovering from POUD compared to individuals who have no history of drug use.
The findings reported here are from a task included in a larger study protocol that examined brain structure and functional connectivity in POUD and control group participants [22]. For transparency, selection criteria and portions of procedural descriptions here are directly quoted here from a prior report based on the same sample of participants [23]. Twenty-three POUD group individuals (Sex: 18 male, 5 female; Age mean (M) = 31.0, SD = 7.3) and 21 control group individuals (12 male, 9 female; age M = 33.6, SD = 7.5) were included in the final sample. POUD group individuals were in the first 3 weeks of a 6-month inpatient residential treatment program. Control group individuals were matched for age, education, and race/ethnic background (Table 1). Participants were included only if they were between 21 and 54 years of age, English was their primary language, they were right-handed, and they had near 20/20 vision (or corrected). Exclusion criteria were any serious physical illness, history of childhood learning disability or current special education, presence of any serious psychiatric illness, MRI contraindications, claustrophobia, abnormal hearing, history of loss of consciousness for more than 30 minutes, alcohol abuse and dependence including past dependence, and for women, pregnancy. Control group participants had no current or past substance use history. Inclusion in the POUD group required a history of using prescription opioid (PO) pills for at least the past 1 year and the POUD participants had to meet criteria in the Diagnostic and Statistical Manual of Mental Disorders5th ed. (DSM-5) [24] for moderate-to-severe POUD, according to a structured clinical interview (SCID-5). Participants were excluded if they had co-occurring POUD and any other substance use disorder (including tobacco use) at a moderate-to-severe level [23]. Participants were also excluded if they failed to respond to 25% or more trials of the card guessing task (1 control participant excluded), or if head motion estimates exceeded 5mm in framewise displacement between any volumes (1 control participant excluded). The 44 participants (23 POUD, 21 control) who met all criteria were from an original pool of 46 (2 controls excluded as noted previously). Sample size was determined by practical constraints (availability of POUD participants during the data collection window).
| POUD | Control | t-stat | p | ||
| (n = 23) | (n = 21) | ||||
| Mean, Range (SD) | Mean, Range (SD) | ||||
| Age (yrs.) | 31, 22–48 (7.27) | 33.62, 24–54 (7.48) | –1.18 | 0.24 | |
| Education (yrs.) | 11, 2–18 (2.3) | 12, 3–19 (2.2) | –1.07 | 0.28 | |
| Race/Ethnicity | |||||
| Caucasian | 12 | 7 | |||
| African American | 8 | 11 | |||
| Hispanic | 2 | 2 | |||
| Not stated | 1 | 0 | |||
| Female (n) | 5 | 6 | |||
| Prescription Opioid Use | |||||
| Frequency (days/week) | 6.5, 3–7 (0.28) | na | |||
| Duration of use (yrs.) | 5.8, 2–18 (3.45) | na | |||
| Money spent ( | na | ||||
| DSM-5 criteria for POUD | |||||
| Number of criteria met | 8.75, 4–11 (2.10) | 0 | |||
| Cigarette use among participants who reported any smoking in the week before scanning: | |||||
| Number reporting any smoking | 20 | 1 | |||
| Frequency (days/week) | 6.95, 6–7 (0.22) | 7 | |||
| Quantity (cigarettes/day) | 8.2, 2–21 (5.40) | 7 | |||
| Cigarette use (means including participants who reported no smoking): | |||||
| Frequency (days/week) | 6.04, 0–7 (2.40) | 0.14, 0–3 (0.65) | 11.33 | ||
| Quantity (cigarettes/day) | 7.13, 0–21 (5.75) | 0.33, 0–7 (1.53) | 5.46 | ||
No subjects met tobacco use disorder criteria (it was an exclusion criterion), smoking measure is based on reported behavior in the week before scanning (after screening). DSM-5, Diagnostic and Statistical Manual of Mental Disorders; SD, standard deviation; na, not applicable.
On the day of scanning, participants provided written informed consent approved by the Rutgers University Institutional Review Board and were administered a urine screen to rule out pregnancy in women, and to ensure negative urine toxicology for cocaine, methamphetamine, THC, opiate, and benzodiazepines (One Step Multi-Drug Screen Test Panel). They were assessed for recent alcohol use with a breathalyzer. After the session, participants received a
Participants performed the card guessing task [14] following structural scans and a resting state functional scan, approximately 20 minutes after entering the scanner. Stimuli were presented and response times were collected using E-Prime version 2.0 (Psychological Software Tools, Pittsburgh, PA, USA). In each trial of the task, participants saw a card (white rectangle with a “?” in the center) and pressed a button to guess whether the value of the card was lower (second digit of the right hand) or higher (third digit of the right hand) than the number 5, with knowledge that the number would be between 1 and 10 but never 5, and that correct guesses would add
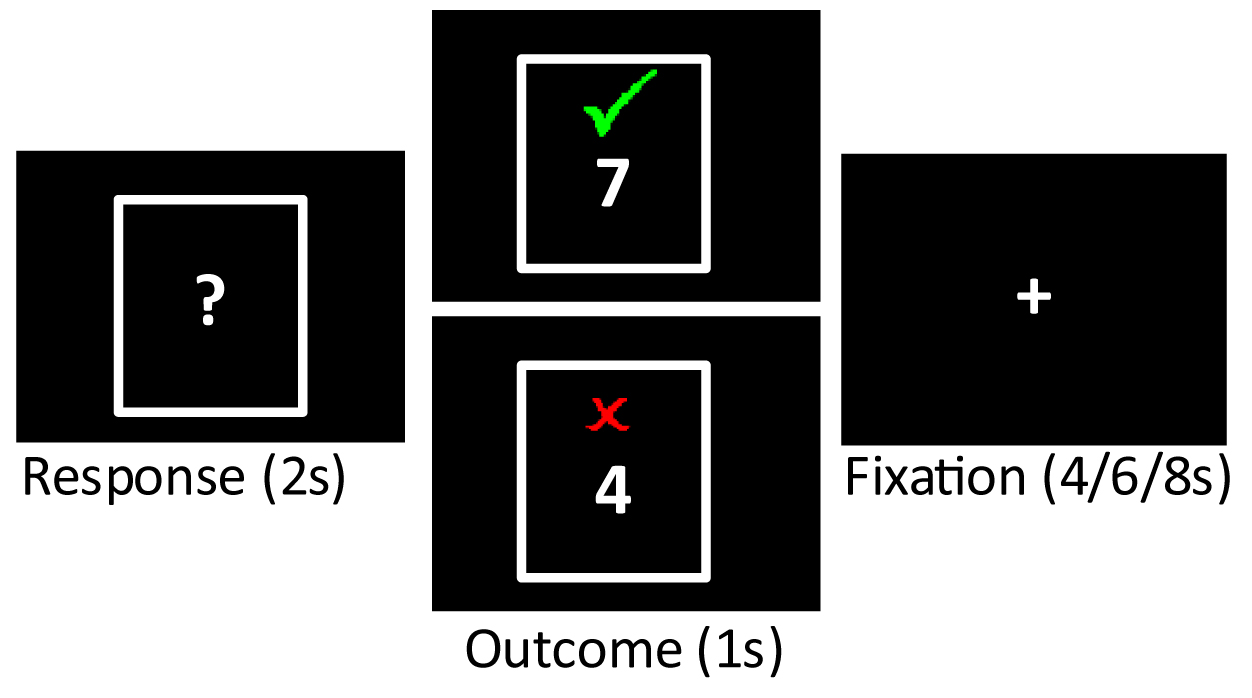 Fig. 1.
 Card guessing task. On each trial, participants had 2 s to guess whether the number on a card was low or high (“Response”). The outcome of the trial was then displayed (“Outcome”), with gain trials (green check) and loss trials (red X) equally probable. An inter-trial interval followed each outcome. Analysis was focused on BOLD signal elicited by the display of each outcome.
Mean response times were calculated for each participant (mean across all trials where the participant responded within the 2 s window) and used to calculated group means, which were entered into an independent samples t-test to examine potential differences between groups. No group differences were predicted.
Images were collected on a 3.0-T Siemens TRIO scanner (Siemens Medical Solutions USA, Malvern, PA, USA) as reported in reference [23]: Structural images were acquired with a T1-weighted MPRAGE sequence (256
The GLM consisted of three regressors to describe outcome events with 1 s duration (gain, loss, no outcome). These regressors were convolved with a canonical double-gamma response function in FSL’s FEAT analysis package [26]. Contrasts were computed to compare gain versus loss outcomes (POUD and control group separately), POUD gain vs control group gain outcomes, and POUD loss versus control group loss outcomes. Full model details are included in the Supplementary Materials.
For analysis of the time course of ROI event-related responses, the 0.6 s time to acquire a full BOLD volume was used as the time step to average signal values following the gain or loss outcome types. That is, the 20 volumes collected 0–12 s after each outcome screen presentation were averaged into 0.6 s time bins according to time elapsed following each type of outcome (20 bins), which yielded a description of average signal change in the 12 s following each outcome type. Signal change was calculated for each time bin as the average BOLD signal across voxels in an ROI, minus the mean ROI BOLD signal value across the whole functional scan. The values for gain and loss outcomes in each ROI were then submitted to group (POUD, control) by time (0–12 s) ANOVAS to examine potential group differences in the time course of neural responses to gain and loss (applying the Greenhouse-Geissler correction for non-sphericity for within-subject effects of time). Any analysis suggesting differences between groups were then repeated with covariates for age and sex. Post-hoc comparisons between groups were conducted at each time point in the case that there was a significant group or group by time interaction effect (uncorrected for multiple comparisons due to the exploratory nature of this analysis). For completeness in this exploratory analysis, a larger set of regions linked to reward or punishment valuation was defined from same meta-analysis that defined ventral striatum and VMPFC regions [29]. Voxelwise masks of regions that showed significant relation to positive or negative subjective value were used to define the regions examined. The regions were pre-supplementary motor area (pre-SMA), anterior insula, amygdala, and posterior cingulate (left and right-sided regions were defined for each). The time course of signal from these regions is analyzed and described in the Supplementary Materials.
Response times in the Card Guessing Task did not significantly differ for the POUD (M = 0.670 s, SD = 0.176) compared to the control group (M = 0.615 s, SD = 0.161; t(42) = 1.065, p = 0.293). Similarly, the number of missed responses did not significantly differ for the POUD (M = 1.261, SD = 2.115) compared to the control group (M = 1.143, SD = 1.493; t(42) = 0.215, p = 0.831).
The comparison of outcomes from monetary gain and loss showed that both POUD and control group participants exhibited a typical reward response. Bilateral regions of ventral striatum, VMPFC, and dorsal anterior cingulate cortex (dACC) showed significantly increased signal in response to gain compared to loss outcomes (see Fig. 2, Table 2; p
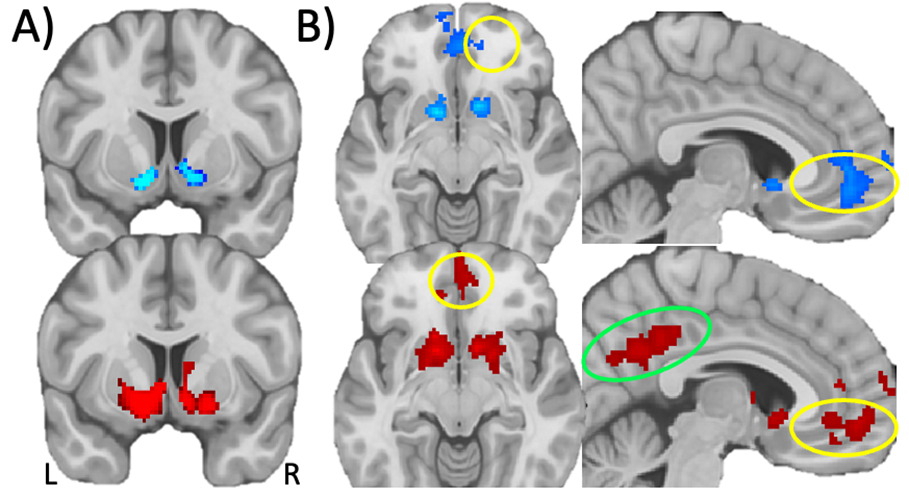 Fig. 2.
 Monetary gain versus loss responses in whole brain voxelwise GLM analysis. (A) Statistical map of monetary gain versus loss in POUD (blue) and control (red) participants in the ventral striatum (colors indicate voxelwise p
| Contrast, Group, Region | Peak coordinate (x, y, z) | Peak t-statistic | Voxels in cluster | ||
| Monetary Gain | |||||
| Control Group | |||||
| Left/Right VMPFC | 4, 52, –8 | 5.07 | 488 | ||
| Left/Right dACC | 12, 42, 18 | 4.32 | 46 | ||
| Left/Right Ventral Striatum | –14, 12, –6 | 8.16 | 1173 | ||
| Left/Right Posterior Cingulate | 0, –36, 38 | 5.45 | 1214 | ||
| Right Precuneous Cortex | 26, –60, 28 | 3.81 | 8 | ||
| Right Lateral Occipital Cortex | 54, –70, 2 | 4.74 | 485 | ||
| Left Lateral Occipital Cortex | –46, –74, 4 | 6.55 | 210 | ||
| Left Lateral Occipital Cortex | –46, –82, 26 | 4.94 | 3 | ||
| POUD Group | |||||
| Left/Right VMPFC and dACC | 10, 52, –4 | 5.75 | 785 | ||
| Right Superior, Middle Frontal Gyrus | 18, 26, 50 | 6.17 | 392 | ||
| Left Superior, Middle Frontal Gyrus | –18, 42, 42 | 4.43 | 23 | ||
| Right Ventral Striatum | 14, 12, –6 | 9.24 | 248 | ||
| Left Ventral Striatum | –12, 8, –10 | 8.31 | 140 | ||
| Left Lateral Occipital Cortex | –46, 74, 2 | 5.36 | 115 | ||
| Left Lateral Occipital Cortex | –50, 78, 16 | 5.02 | 4 | ||
| Control | |||||
| No regions above threshold | |||||
| POUD | |||||
| No regions above threshold | |||||
Non-parametric permutation test, p
VMPFC, ventromedial prefrontal cortex; dACC, dorsal anterior cingulate cortex; POUD, prescription opioid use disorder.
This analysis examined responses in a priori regions of interest in ventral striatum and VMPFC, based on gain versus null and loss versus null contrasts from the GLM. Contrast estimates for gain (gain versus null) and loss (loss versus null) outcomes were entered into a 2 (group: POUD, control) by 2 (outcome valence: gain, loss) mixed ANOVA for each region. There was a main effect of outcome valence (gain
| Effect, Region | F(1,42) | p value | Effect size η2 | |
| Main effect of Group | ||||
| Left ventral striatum | 3.51 | 0.068 | 0.077 | |
| Right ventral striatum | 1.38 | 0.246 | 0.032 | |
| Left VMPFC | 2.22 | 0.144 | 0.050 | |
| Right VMPFC | 1.38 | 0.247 | 0.031 | |
| Main effect of Outcome Valence | ||||
| Left ventral striatum | 98.85*** | 0.702 (gain | ||
| Right ventral striatum | 93.33*** | 0.690 (gain | ||
| Left VMPFC | 24.81*** | 0.371 (gain | ||
| Right VMPFC | 38.95*** | 0.481 (gain | ||
| Interaction of Group and Outcome Valence | ||||
| Left ventral striatum | 3.29 | 0.077 | 0.073 | |
| Right ventral striatum | 0.951 | |||
| Left VMPFC | 0.02 | 0.891 | ||
| Right VMPFC | 0.06 | 0.808 | 0.001 | |
Estimates are from the analysis that assumed a canonical hemodynamic response function (double-gamma function [26]. Effect size is calculated as partial
The above analyses rely on signal estimates from a GLM analysis where each regressor is convolved with an assumed fixed hemodynamic response which aims to model the expected shape of the hemodynamic response over time for all events. This fixed hemodynamic response approach is insensitive to potential differences in the duration of a response to reward or punishment, which may be critical for understanding mental disorder [32]. Thus, an exploratory analysis was conducted to examine potential group differences in the time course of a response to monetary gains or losses, based on signal values over a brief window following each type of outcome. Region of interest average signal values 0–12 s (20 TRs) after each outcome event were averaged by outcome type (gain, loss) into 0.6 s time bins for each participant. These ROI event-related signal time course values for gain and loss outcomes were then submitted to group (POUD, control) by time (20 TRs from 0–12 s following an outcome) ANOVA (gain and loss separately for each region of interest). Signal time courses following gain outcomes showed a significant group by time interaction in right ventral striatum (F(8.21, 344.74) = 2.63, p = 0.008,
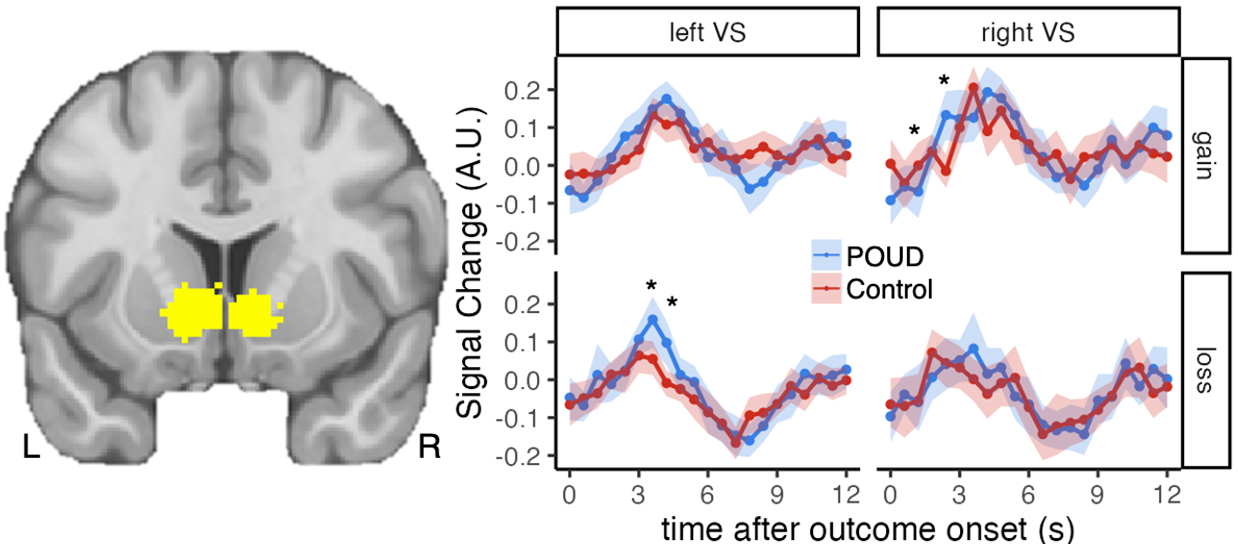 Fig. 3.
 Time course of the ventral striatum response to gain and loss. The left image shows ventral striatum a priori regions of interest defined by meta-analysis [29] (slice at y = 12). Plots show signal change in these regions over the 12 s period following each outcome (top: gain outcomes; bottom: loss outcomes). Points represent mean signal change across participants in each group, error bands indicate 95% confidence interval around the mean. “*” indicates p
The time course of neural responses in the broader set of ROIs (pre-SMA, anterior insula, amygdala, posterior cingulate) is described in the Supplementary Materials with group or group by time effects noted here if they met an exploratory threshold of p
This study addresses a gap in prior research by exploring the temporal dynamics of brain responses to monetary gain and loss among individuals recovering from POUD. While we did not observe a difference in magnitude of responses to reward or punishment in analyses assuming a fixed hemodynamic response over time, significant differences emerged in the time course of brain responses to monetary loss in the left ventral striatum, with POUD individuals displaying greater magnitude and prolonged duration of response to negative non-drug stimuli (monetary loss) compared to controls. In contrast, while controls initially showed a stronger response to monetary gain in the right ventral striatum compared to POUD, the POUD group demonstrated an increased response to monetary gain after 2.4 s relative to controls. These findings suggest that individuals with POUD exhibit slower response to positive stimuli and increased sensitivity to negative stimuli, consistent with previous research showing impaired emotional regulation among individuals with OUD [5, 6, 7].
Substance use is known to alter responses in neural systems that process reward and punishment, often resulting in reduced sensitivity to natural rewards and heightened sensitivity to stress or adverse outcomes. These alterations may persist even during abstinence, contributing to difficulties in early recovery. For example, maladaptive reward processing has been linked to the challenges individuals face in finding motivation and enjoyment in non-drug-related activities, which can undermine efforts to sustain abstinence [11, 16, 33, 34]. The heightened punishment response may make individuals more susceptible to the emotional toll of negative experiences and psychological stress during recovery, a factor that has been associated with relapse risk [35].
These findings underscore potentially significant barriers to recovery from OUD. A diminished or delayed reward response may hinder the ability to evaluate, engage with, and seek out positive non-drug reinforcers, including monetary rewards but this effect may extend to other non-drug rewards such as social experiences and support that are known to guard against relapse [36, 37, 38]. Increased sensitivity and temporally extended responses to punishment may amplify the impact of negative outcomes during early recovery, and negative affect and stress are known precipitators of substance use and relapse [38, 39, 40]. Although psychological and behavioral data describing participants’ continued recovery is not available, it is known that opioid use relapse can occur after long periods of abstinence [41]. Changes in the dynamics of the brain’s response to non-drug rewards and punishment may pose important challenges for individuals in recovery — greater negative affect and stress may motivate drug use and diminished or delayed positive affect simultaneously impairs individuals’ ability to cope with that negative affect and stress. Understanding these mechanisms is critical for developing treatment approaches that address these barriers. For instance, therapies that aim to bolster natural reward responses and negative affect regulation resources may help individuals in early recovery by providing structured strategies to cope with these challenges [5, 40, 41]. Mindfulness-oriented recovery enhancement is one example of a treatment approach that focuses on the positive experience of natural non-drug rewards and strengthens strategies for coping with negative affect and drug-related cues [5, 40, 41]. The current study provides a framework for understanding the dynamics of non-drug incentive processing. Brain responses to non-drug incentives differ in POUD and control participants here but it is unclear if differences are caused by opioid use. Mu-opioid receptors are prominent in the striatum and VMPFC [42, 43], thus the pathway exists for opioid use to alter incentive responses in these regions. The findings suggest value in future work that aims to link opioid systems in the brain to incentive processing and affective function (in the striatum and other regions) [42, 43] and work that tracks longitudinal changes in incentive processing with potential links to treatment outcomes.
The voxelwise whole-brain analysis showed that, in both the POUD and control participants, BOLD signal in ventral striatum and VMPFC regions was increased in response to monetary gain compared to loss outcomes. This finding is consistent with a large neuroimaging literature examining non-drug reward and punishment responses in neurotypical humans [9, 14, 29]. This voxelwise whole-brain analysis, which assumed a fixed hemodynamic response over time and tested for differences in the magnitude of the response (corrected for multiple comparisons), was insensitive to differences between the POUD and control participants. Therefore, follow up analysis focused on regions of interest to provide a potentially more sensitive test of differences in between the two groups, without correction for multiple comparisons and with an examination of the time course of signal change following monetary gain and loss. The primary ROI analysis specifically focused on ventral striatum and VMPFC because these regions have been identified as the key components of “valuation network” in a in meta-analysis of neuroimaging studies of reward and punishment [29]. Further exploration of regions that consistently show non-drug value-related signal (pre-SMA, anterior insula, amygdala, and posterior cingulate) [29] showed differences suggesting that responses to monetary gain may be greater in POUD compared to control participants in right pre-SMA and left anterior insula, and that right amygdala responses to monetary loss may be greater in POUD compared to control participants. Effect sizes for these comparisons are provided in the Supplementary Materials to benefit the design of future work on this topic.
While the ROI analysis provides a focused examination of brain responses to non-drug reward and punishment, it remains an important limitation of the study that examination of potential differences in other regions linked to emotion regulation could not be conducted, partly due to the limited sample size and partly due to the experimental focus on non-drug reward and punishment responses rather than emotion regulation function. Neural circuitry underlying the ability to up-regulate positive and down-regulate negative non-drug-related emotional experiences is certainly important for understanding potentially disordered affective responding in substance use disorders [2, 3, 6, 7, 44, 45]. For example, medial prefrontal cortex (MPFC) bidirectional connections with amygdala are hypothesized to be underlie emotion regulation and this circuit may be dysregulated in anxiety disorder [46]. Research using Magnetic Resonance Spectroscopy and dynamic causal modeling shows that gamma-aminobutyric acid (GABA) concentration in MPFC is related to state anxiety [47] and reduced MPFC to amygdala effective connectivity (thought to represent top-down control from MPFC to amygdala) [48]. The pre-SMA region examined in the current study is partly overlapping but somewhat posterior to the MPFC region implicated in the broader emotion regulation literature [29, 44, 45, 46, 47, 48], and the monetary reward and punishment experiences examined here do not tend to recruit the same MPFC region implicated in emotion regulation [29]. Our exploratory analysis showed potentially elevated amygdala non-drug punishment responses in the OUD group. Thus, the MPFC-amygdala circuit represents an important target for further work to understand non-drug positive and negative experiences in recovery from OUD.
The small sample size limited the statistical power and consequently results do not survive correction for multiple comparisons. The absence of an a priori hypothesis about the specific timing of the observed differences means that findings should be viewed as exploratory and targets of further research to replicate findings in larger and less restricted samples of individuals recovering from opioid use disorder. The focus on the first month of abstinence, while relevant for early recovery, may not capture the evolution of reward and punishment processing as neural circuits adapt to sustained abstinence. The selection criteria for the study restricted the sample and thus additional research is needed to characterize neural responses to reward and punishment over longer periods of abstinence, how they may change over time, and how they may vary with factors such as addiction severity, psychiatric disorder comorbidity, and treatment. An additional limitation of this study is that, despite not meeting criteria for moderate or severe tobacco use disorder at screening, participants reported smoking more in the week prior to scanning (Table 1). The data are unable to distinguish between participants who recently increased smoking upon entering the inpatient treatment facility and those who continued smoking behavior that was below the threshold for moderate tobacco use disorder. While we note this as a limitation it is also true that this behavior is representative of substance use populations [49].
In summary, this study contributes to a growing body of literature on the neurobiological underpinnings of substance use disorders, particularly during the critical early stages of recovery.
Findings from this small sample study show that brain responses to monetary rewards and punishments may differ in POUD compared to neurotypical controls. POUD participants showed a slower response to positive stimuli and increased sensitivity to negative stimuli in the ventral striatum. Findings underscore the importance of understanding the temporal characteristics of reward processing in substance use disorders and have implications for understanding affective experiences in individuals recovering from POUD.
The data and materials will be available on request. Analysis code and unthresholded statistical maps are available at https://github.com/jamilfelipe/CardTask-POUDpublic-2025/.
JPB and JS conducted data preprocessing and analysis. JPB, MRD, and SR designed and conducted the research. JPB, BH, JS, MRD, and SR interpreted the data and wrote the manuscript. All authors contributed to the editorial changes in the manuscript and read and approved the final manuscript. All authors participated sufficiently in the work and agreed to be accountable for all aspects of the work.
All subjects gave their informed consent for inclusion before they participated in the study. The study was conducted in accordance with the Declaration of Helsinki, and the protocol was approved by the Rutgers University Institutional Review Board (approval number: CR00025642).
We acknowledge the individuals with prescription opioid use disorder who volunteered for this study. We also acknowledge the CEO and staff members at Integrity House in Newark, New Jersey, for their support in this project.
This research was supported by the National Institute on Drug Abuse Grants (R03DA044496 and R61DA059906) to Suchismita Ray as a Contact Principal Investigator.
The authors declare no conflict of interest.
Supplementary material associated with this article can be found, in the online version, at https://doi.org/10.31083/JIN36969.
References
Publisher’s Note: IMR Press stays neutral with regard to jurisdictional claims in published maps and institutional affiliations.