


 , Samira Bouyagoub 1, Mara Cercignani 3, Paul R Ford 4, Natasha Sigala 1,*
1 Brighton and Sussex Medical School, University of Sussex, BN1 9RY Falmer, UK
2 RIKEN Center for Brain Science, 351-0198 Saitama, Japan
3 Cardiff University Brain Research Imaging Centre (CUBRIC), Cardiff University, CF10 3AT Cardiff, UK
4 Department of Psychology and Pedagogic Science, St. Mary’s University, TW1 4SX London, UK
Abstract
Cognitive training offers a potential approach for the prevention of cognitive decline in later life. Repetition of targeted exercises may improve, or at least preserve, both specific domain and general cognitive abilities by strengthening neural connections and promoting neuroprotective processes within brain networks. Importantly, middle-aged adults have been omitted from the cognitive training literature. In this experiment, we investigated short-term training (1 session) on a perceptual-cognitive-motor task in middle-aged adults. Furthermore, we examined the functional and structural neural correlates of this training.
Twenty-one healthy middle-aged adults between the age of 40 and 50 years underwent one scanning session during which they learned and performed the perceptual-cognitive-motor task. We compared performance and functional imaging on the Early and Late Learning phases of the task. We used diffusion Magnetic Resonance Imaging (MRI) to examine baseline microstructural variation in the brain in relation to training outcome. The diffusion indices included fractional anisotropy (FA), mean diffusivity (MD), neurite density index (NDI), and orientation dispersion index (ODI).
We found a significant improvement in performance following training on the task. The improvement correlated with gaming experience, but not with impulsivity. There were also significant training-induced changes in functional activity in cerebellar, cortical and subcortical brain regions. Furthermore, significant correlations were found between the diffusion indices of FA, MD, and ODI and training outcome.
These results suggest fast reorganisation of functional activity in the middle-aged brain, and that individual variation in brain microstructure correlates with fast visuo-motor task performance gains.
Keywords
- sensorimotor learning
- gaming experience
- impulsivity
- prediction error fMRI
- diffusion
- NODDI
- middle-aged
The development and use of complex motor skills decreases with age not only for biomechanical and neuromuscular reasons, but also due to a decline in cognitive functioning [1, 2, 3, 4, 5, 6]. In addition, the aging process is associated with widespread changes in the brain, and these changes contribute to deficits in motor and cognitive functioning [7, 8, 9, 10, 11, 12, 13]. Most motor skill learning studies investigating age-related changes compare older adults’ performances with that of younger adults, but do not include middle-aged participants [14]. This is a significant omission given that the few life-span studies that have been conducted indicate that the reduction in motor plasticity occurs not particularly in older age, but in middle-age (after a peak in youth and younger adulthood) [14, 15, 16, 17]. Studies looking at the acquisition of a complex motor skill showed that performance decrements start early in middle-age (30–45 years) [14, 15, 17]. For example, Janacsek et al. (2012) [17] investigated motor sequence learning across the life span, between 4–85 years of age, and found that in terms of reaction time and accuracy, age groups between 9 and 44 years of age showed similar degrees of sequence learning, and this was significantly higher than the youngest (4–8) and the two oldest (45–59 and 60–85) groups. Since it appears that motor skill learning ability starts to decline in middle-age, this would be an excellent age group for targeting training interventions.
The brain regions involved in motor skill learning differ depending on whether it is the early or late phase of training, and on the nature of the cognitive processes required [13, 18, 19]. Doyon et al. (2002) [20] proposed a model for characterising the complex pattern of brain activation underlying motor skill training. Two loop circuits, a cortico-striatal and a cortico-cerebellar system, are both recruited and operate in parallel during the fast learning stage. Early in the learning phase, the following structures are recruited: the striatum, cerebellum, motor cortical regions, as well as prefrontal and parietal areas. Similarly, in a model proposed by Hikosaka et al. (2002) [21], two loop circuits are recruited which specialise in learning spatial and motor features of sequences independently. Learning spatial coordinates is supported by a frontoparietal-associative striatum-cerebellar circuit, while learning motor coordinates is supported by an M1 (primary motor cortex)-sensorimotor striatum-cerebellar circuit. The coordinate transformation between the spatial and motor sequences depends on the supplementary motor area (SMA), pre-SMA, and premotor cortices. Importantly, it is argued that learning spatial coordinates is usually explicit and faster as it may be accompanied by increased attention or working memory, putatively involving prefrontal and parietal cortical regions [22]. By contrast, motor coordinates are usually processed implicitly and require minimum attention, therefore they are slowly acquired during learning.
Diffusion imaging studies show that inter-individual variation in white-matter microstructure, as measured by fractional anisotropy (FA), correlates with behavioural performance [23, 24]. In this experiment we looked for correlations of diffusion indices with task improvement, and did not quantify any structural changes before and after training. Other studies have shown that structural changes can occur following long-term training (days or weeks) of a new motor skill [25, 26], as well as within short timescales [27, 28]. Invasive microscopy procedures in animal models have detected regional structural changes, such as dendritic spine formation and oligodendrogenesis, after short-term motor skill training within 1–2.5 hours [29, 30]. Such short-term effects have been more difficult to detect so far by non-invasive techniques such as diffusion MRI. However, Sagi et al. (2012) [27] showed that this is indeed possible using diffusion tensor imaging (DTI). They scanned participants before and after a spatial navigation task based on a computer car race game. Microstructural changes in grey matter were significant after only 2 hours of training. Although widely used, DTI indices are average measurements across a voxel from multiple different compartments, including both intracellular and extracellular spaces [31]. Hence, a change in these measurements cannot be attributed to specific changes in tissue microstructure [32, 33, 34, 35]. Neurite orientation dispersion and density imaging (NODDI) is a diffusion MRI model that is able to differentiate between three different microstructural compartments: intraneurite, extraneurite, and cerebrospinal fluid (CSF) [33, 36]. NODDI indices therefore offer less ambiguous microstructural interpretations. Indeed, NODDI has been used with success to investigate age-associated changes to white matter [31], and cortical grey matter [37].
The aim of our experiment was to investigate the functional and structural correlates of short-term training in healthy middle-aged adults (40–50 years old). Participants in this study trained on a novel and complex perceptual-cognitive-motor (PCM) task (multiple object avoidance (MOA) task [38]). This task requires motor as well as cognitive processes (including decision making, working memory, attention, and pattern recognition). We chose the PCM task because it is multi-domain, a form of training particularly effective in improving cognitive function [39, 40, 41, 42]. We used functional Magnetic Resonance Imaging (fMRI) to investigate changes in activation over 1 session (31 minutes of training, consisting of 160 trials). In addition, we sought to link the performance gains following training with underlying structure. We used both DTI and NODDI to analyse microstructural inter-individual variation in grey and white matter in relation to training outcome.
We expected to find significant training gains in performance; a positive correlation of performance gains with prior gaming experience; a negative correlation of performance gains with impulsivity; increased activation in cognitive and motor networks in the later stage of training; differences in activity for successful vs. unsuccessful trials; and a correlation of individual microstructural differences in grey and white matter with task performance.
We recruited 22 right-handed participants, 11 females, aged 40–50 years old (mean (M)= 44.67, SD = 3.23) from staff and students of the Universities of Brighton and Sussex and the local community. All participants had normal or corrected-to-normal vision, and no history of psychiatric or neurological illness, or drug or alcohol abuse. One participant was excluded due to low task-engagement during the session, leaving 21 participants. Participants gave written informed consent before taking part in the experiment. The study conforms to the World Medical Association Declaration of Helsinki and ethical approval was obtained from the Brighton and Sussex Medical School Research Governance and Ethics Committee (12/101/SIG/SIG-03).
Participants received instructions for the PCM task prior to the scanning session. They used a fibre-optic MRI-compatible mouse (FOM-2B-10B, NAtA technologies, Coquitlam, British Columbia, Canada) to control the white cursor on the screen, such that it reached the red target whilst avoiding the green objects (Fig. 1). They were unaware of either the gain relationship of the white cursor movement or the amount of different movement patterns of the green objects. Participants first habituated to the scanner and MRI-compatible mouse by completing 8 PCM trials. They then completed 80 PCM trials (Early Learning phase) whilst undergoing fMRI scanning, followed by 72 PCM trials during a Middle Practice phase whilst undergoing structural and diffusion scanning, and finally they completed 80 more PCM trials (Late Learning phase) whilst undergoing fMRI scanning. All participants completed a short questionnaire, asking how often they played computer games, and classified as 0 for never, 1 for rarely, 2 for occasionally, 3 for frequently, and 4 for often. They also completed the Barratt Impulsiveness Scale (BIS-11), a 30 item self-report measure for the assessment of impulsiveness [43, 44].
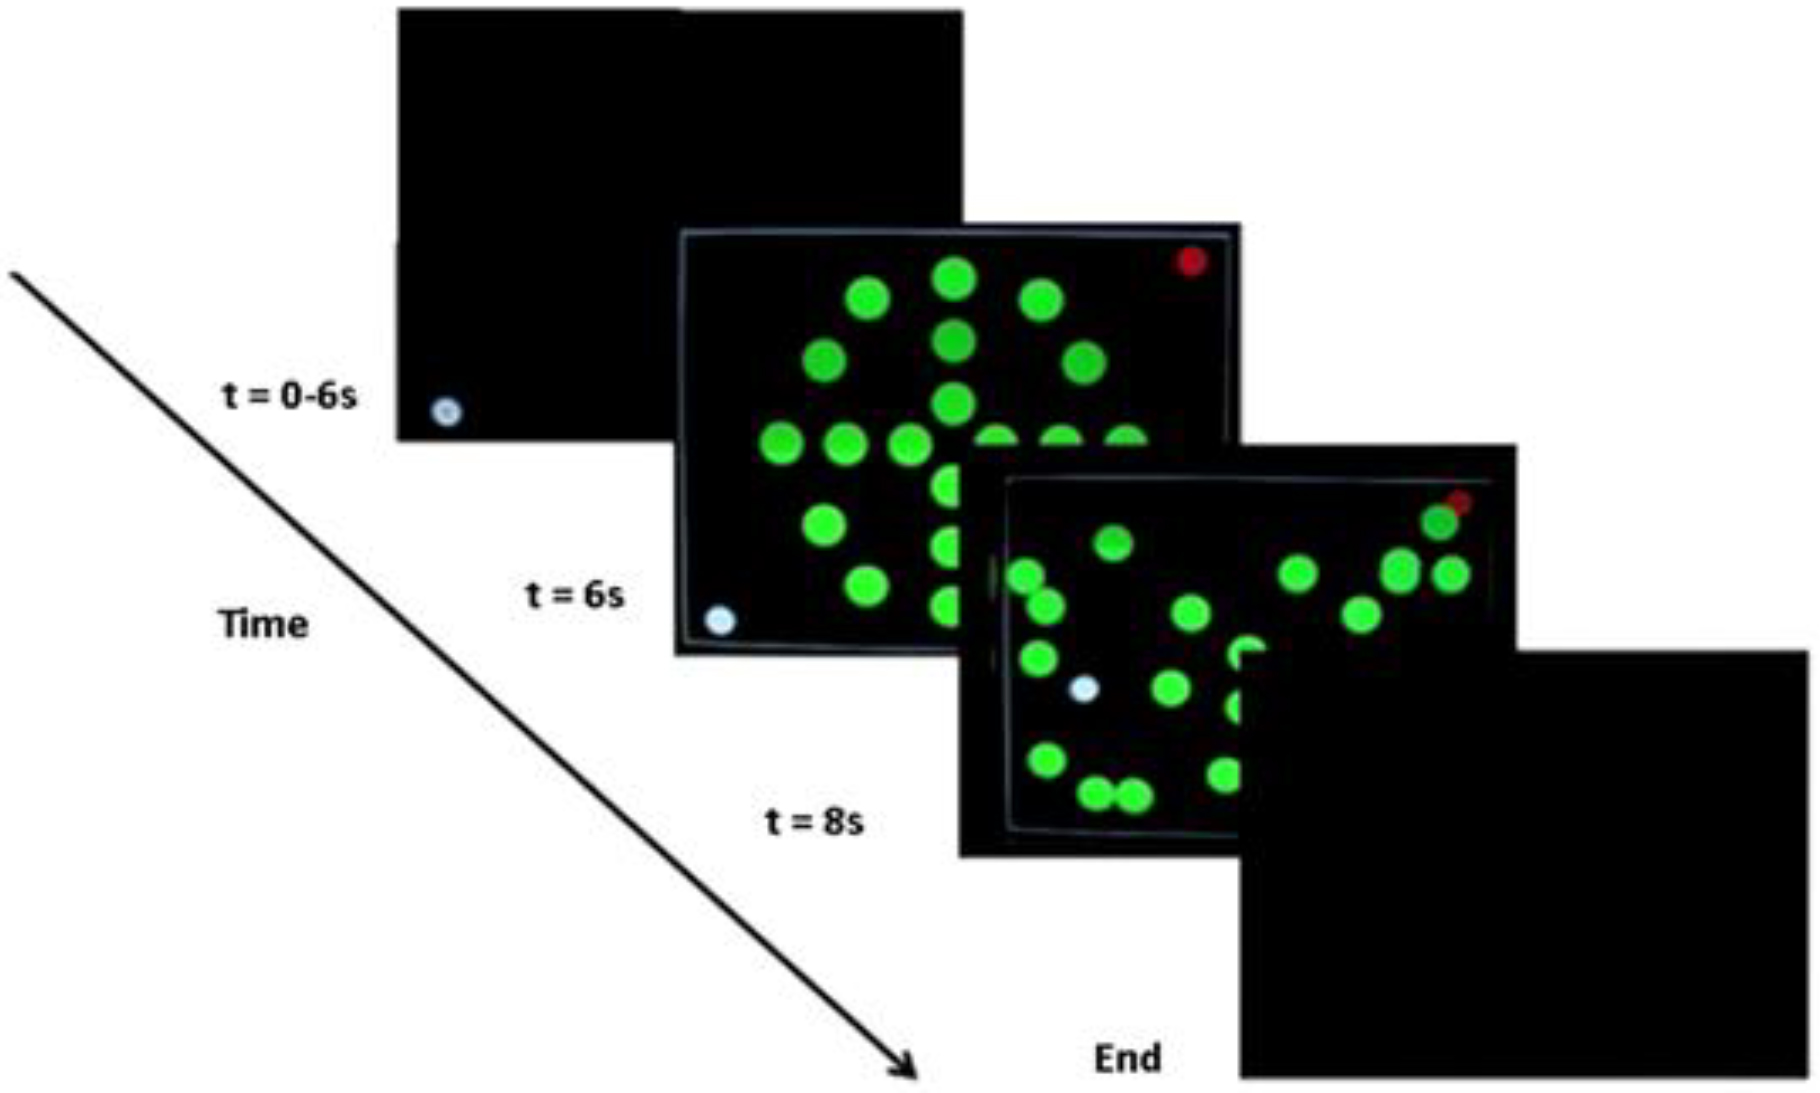 Fig. 1.
 Task. On each trial the participants had to move the cursor (white circle on the screen) from one bottom corner of the computer screen to a red circle target located in the diagonal top corner of the screen. Participants had to move the white cursor whilst avoiding the green moving objects (n = 20 circles).
The task goal was to move the cursor from one corner of the computer screen to a red circle target in the diagonal corner of the screen (Fig. 1). To achieve the task goal, participants had to move the white cursor to the red target whilst avoiding green objects (n = 20 circles) moving around the screen on pseudo-randomised linear trajectories. If the white cursor touched one of the green objects, the trial was unsuccessful. If the white cursor reached the red target, the trial was successful. The MRI-compatible computer mouse was held by the participant in their right hand and controlled the cursor location on the computer screen. When the task started, the white cursor first appeared in either the bottom left or bottom right of the screen. The starting positions of the white cursor changed pseudo-randomly from trial-to-trial, but with an equal number of these two possible starting positions across the experiment. There were four different movement patterns for the green objects that each began with the same starting positions. A total of eight movement patterns across the two starting positions were created by mirroring the original four movement patterns relative to either of the two starting positions of the white cursor in an attempt to have equal task difficulty on each starting position.
Each session included: a Blood Oxygen Level Dependent (BOLD) fMRI run 1 (15 min) (Early Learning phase, PCM task), structural T1-weighted volume (6 min) (Middle Practice phase, PCM task), multiband diffusion-weighted scan optimised for NODDI (9 min) (Middle Practice phase, PCM task), and BOLD fMRI run 2 (15 min) (Late Learning phase, PCM task). Total scanning time per session was about 45 minutes.
The images were acquired using a Siemens 1.5T Avanto scanner (Siemens, Erlangen, Bavaria, Germany) with a maximum gradient strength of 44 mT/m, and a 32-channel head coil.
The PCM task was presented on an in-bore rear projection screen, at a viewing distance of approximately 45 cm, subtending 5° of visual angle. Stimuli were delivered using Cogent2000 v1.32 running under MATLAB R2015a (The MathWorks, Inc., Natick, MA, USA). Time-course series of the two fMRI runs were acquired using a T2*-weighted echo planar imaging (EPI) sequence, obtaining 354 volumes during each of the PCM task. Each volume consisted of 34 axial slices oriented 30° to the anterior commissure – posterior commissure (AC–PC) line and covering the whole brain. Slices were acquired bottom–up in the sequential mode (repetition time (TR) = 2520 ms, echo time (TE) = 43 ms, flip angle = 90°, matrix size = 64
Diffusion-weighted data were acquired with single-shot, twice-refocused pulse gradient spin-echo echo planar imaging (EPI) (Tuch et al., 2003 [45]) with the following parameters: TE = 95 ms, TR = 4036 ms, field of view (FoV) = 240
We used the normalised learning index (LI) to assess individual learning progress for each participant.
We used the Statistical Package for the Social Sciences (SPSS IBM V.22, IBM Corp., Armonk, NY, USA) for analyses of behavioural data. We conducted tests of assumptions to ensure the chosen statistical analyses were appropriate for our data. To exclude a potential effect of participant sex, age, or education on task performance, we ran tests to determine if there were any relationships between the demographic data and the performance scores. Tests of assumptions for the point-biserial correlation of sex
Tests of assumptions for the Pearson’s correlation of age
Tests of assumptions for the Pearson’s correlation of education
To assess performance, we used the number of successful trials in the Early and Late Learning phases as the dependent variable. We applied a paired samples t-test on the successful trials on the PCM task comparing Early and Late Learning performance. Statistical significance was set at p
We used SPM12 (Wellcome Trust Centre for Neuroimaging, UCL, London, UK; https://www.fil.ion.ucl.ac.uk/spm/) running under MATLAB R2015a for data preprocessing and statistical analyses of the fMRI data. Preprocessing of functional images was carried out for each run separately, including slice time correction to the middle slice in time, spatial realignment to the first image, and unwarping. The T1-weighted structural image was coregistered to the mean functional image and subsequently segmented to obtain normalisation parameters based on the standard Montreal Neurological Institute (MNI) template. The segmentation parameters were used to transform each participant’s functional images and the bias-corrected structural image into MNI space. Voxel sizes of the functional and structural images were retained during normalisation, and the normalised functional images were spatially smoothed using an 8-mm FWHM (full width at half-maximum) Gaussian kernel.
Statistical analyses were performed using the general linear model. At the single subject analysis, fMRI run 1 (Early Learning) and fMRI run 2 (Late Learning) were entered as separate sessions into the model. For fMRI run 1 there were two conditions: EarlyLearning_Successful trials and EarlyLearning_Unsuccessful trials, and for fMRI run 2 the conditions were: LateLearning_Successful trials and LateLearning_Unsuccessful trials, resulting in 4 regressors of interest.
Results of the single-subject analyses were taken to second level to examine activation differences following training with a whole-brain analysis. The subject-specific beta images of Early Learning and Late Learning, Successful and Unsuccessful trials were entered into a 2
The diffusion weighted data were analysed using tools from the FMRIB Software Library (FSL, version 5.0.7, Oxford, UK). Data were corrected for eddy-current induced distortions and involuntary motion using FSL’s topup tool and Eddy command [48]. Mean diffusivity (MD) and fractional anisotropy (FA) were estimated by least square fitting of the data with the tensor model using the FSL tool dtifit. Next the NODDI fitting algorithm implemented in Matlab and distributed by the developers of NODDI [33] (http://www.nitrc.org/projects/noddi_toolbox) was used to yield neurite density index (NDI), orientation dispersion index (ODI), and isotropic diffusion maps. All the diffusion indices maps were normalised to the MNI space using the Advanced Normalization Tools (ANTs, version 2.1.0; http://stnava.github.io/ANTs). Images were spatially smoothed using a 5 mm FWHM Gaussian kernel. To quantify the relationship between performance and brain microstructure, we ran correlations between the PCM normalised LI scores and the DTI indices of FA and MD, and the NODDI indices of NDI and ODI. A statistical significance threshold of p
Regions of interest (ROIs) were selected based on the models for motor skill learning by Hikosaka et al. (2002) [21] and Ungerleider et al. (2002) [49]. These models include the striatum, cerebellum, premotor cortex, SMA, preSMA, M1, anterior cingulate, as well as prefrontal and parietal areas. In addition, we included the hippocampus as increases in activity have been demonstrated in this region for both the early and later stages of motor training (Schendan et al., 2003 [50]; Albouy et al., 2008 [51]; Fernández-Seara et al., 2009 [52]; Gheysen et al., 2010 [53]; King et al., 2013 [13]). And finally, the parahippocampal cortex was included as it is highly engaged during visuospatial processing (van Strien et al., 2009 [54]; Aminoff et al., 2013 [55]; Hohenfeld et al., 2020 [56]), a key aspect of the PCM task. We specified 14 anatomical ROIs bilaterally: striatum (including caudate and putamen), cerebellum, hippocampus, parahippocampus, SMA, preSMA, M1, premotor cortex, anterior cingulate, dorsal Prefrontal Cortex (dPFC), orbital PFC (oPFC), and inferior parietal cortex. The precuneus and vPFC were selected to serve as control regions. We did not expect to see a change in activity in these areas as they show increased activation during later stages of motor skill learning (Doyon, 1997 [57]; Sakai et al., 1998 [58]; Ungerleider et al., 2002 [49]; Doyon et al., 2003 [59]; Lehéricy et al., 2005 [60]; King et al., 2013 [13]). All ROI masks were from the WFU PickAtlas v2.4 (Maldjan et al., 2003 [61]; http://www.nitrc.org/projects/wfu_pickatlas/).
We found no relationship between the participant sex, age or education on task performance. As there were no significant relationships found between the demographics and training outcome, these variables were not used as covariates in any further analyses.
Tests of assumptions for the paired samples t-test comparing Early and Late Learning scores indicated no outliers. A Shapiro-Wilk test showed that the distribution of the differences was normal, W(21) = 0.970, p = 0.743. The difference of successful trials during the Late Learning phase (last 80 trials) (M = 37.00; SD = 14.59) to those in the Early Learning phase (first 80 trials) (M = 24.71; SD = 13.96) was statistically significant, t(20) = 7.52, p
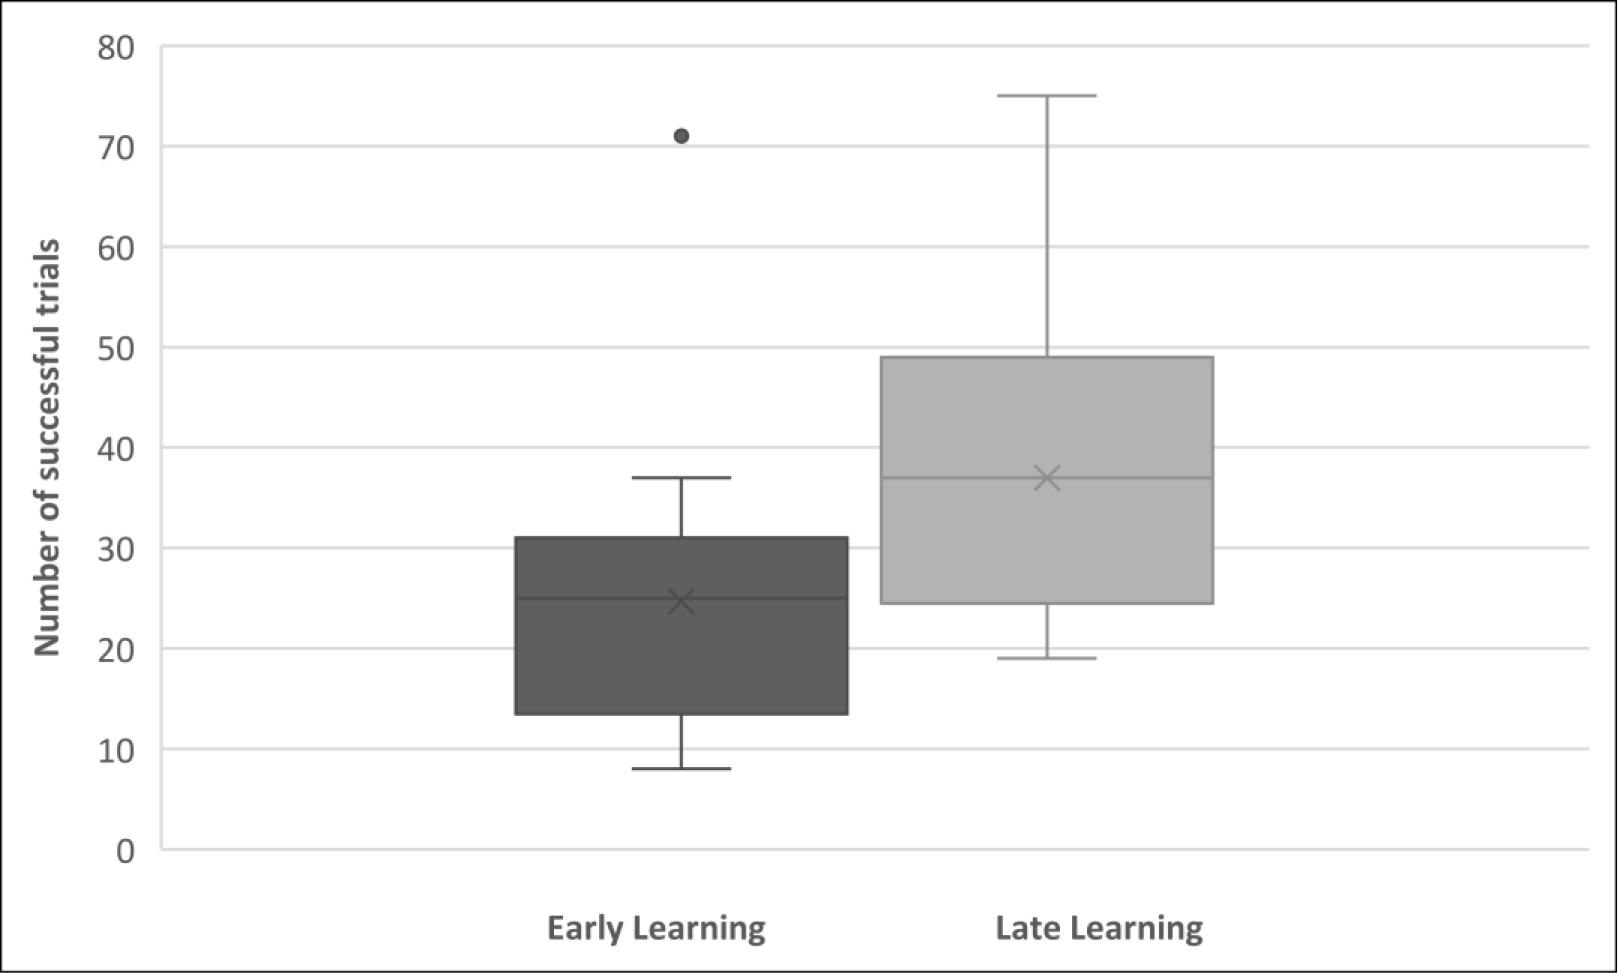 Fig. 2.
 Comparison of behavioural performance during the first 80 trials (Early Learning), and the last 80 trials (Late Learning) in a box and whisker plot. The median number of successful trials for the two phases of the task were 25 and 37 respectively. The black dot represents an outlier value of 71.
We ran a multiple regression for the LI, as well as the Early and Late Learning phase scores for each individual, with the level of the reported computer game experience of each participant, and their BIS-11 impulsivity scores (the total score, as well as the 3 Second-order Factors: Attentional, Motor and Non-Planning) (Mean BIS-11 score 64.5, range 50–93). Level of computer game experience as a predictor of accuracy (% successful trials) for the Late Learning phase was the only significant and positive correlation, p = 0.003.
We first tested whether performing more accurately in the Late Learning phase was associated with activations in particular brain areas. We performed a 2
The main effect of testing phase was observed in areas across two clusters (Table 1). The first cluster extended to 251 voxels and included the cerebellar vermis, the pons, the right (R) thalamus, and the R subthalamic nucleus. The second cluster extended to 132 voxels, and included the cerebellum (R Crus 1, Crus 2 bilaterally), and the R lingual gyrus.
| Brain region | MNI coordinates | F-value | Cluster size (voxels) | p-value FDR-corrected | ||
| x | y | z | ||||
| Cerebellar vermis (10) | 3 | –46 | –34 | 43.09 | 251 | 0.003 |
| Left pons | –3 | –19 | –22 | 26.69 | ||
| Right thalamus | 6 | –22 | –1 | 20.56 | ||
| Right pons | 3 | –28 | –37 | 15.34 | ||
| Right subthalamic nucleus | 9 | –13 | –10 | 12.43 | ||
| Left cerebellum (Crus 2) | –3 | –85 | –22 | 45.77 | 132 | 0.047 |
| Right cerebellum (Crus 1) | 6 | –85 | –19 | 38.90 | ||
| Right lingual gyrus | 21 | –94 | –7 | 27.58 | ||
| Right cerebellum (Crus 2) | 6 | –85 | –25 | 17.20 | ||
Areas within a cluster shown in descending order of F-value. A statistical significance threshold of p
We examined the differences in testing phase more closely using the contrasts Early
| Brain region | MNI coordinates | Cluster size (voxels) | p-value FDR-corrected | ||||
| x | y | z | t-value | ||||
| Early | |||||||
| Left cerebellum (Crus 2) | –3 | –85 | –22 | 6.77 | 159 | 0.014 | |
| Right cerebellum (Crus 1) | 6 | –85 | –19 | 6.24 | |||
| Right lingual gyrus | 21 | –94 | –7 | 5.25 | |||
| Right cerebellum (Crus 2) | 6 | –85 | –25 | 4.15 | |||
| Late | |||||||
| Cerebellar vermis (10) | 3 | –46 | –34 | 6.56 | 317 | 0.002 | |
| Left pons | –3 | –19 | –22 | 5.17 | |||
| Right thalamus | 6 | –22 | –1 | 4.53 | |||
| Right pons | 3 | –28 | –37 | 3.92 | |||
| Right subthalamic nucleus | 9 | –13 | –10 | 3.53 | |||
| Right precuneus | 12 | –43 | 53 | 5.10 | 185 | 0.019 | |
| Right mid cingulate cortex | 9 | –1 | 41 | 4.56 | |||
| Right SMA | 3 | –22 | 65 | 4.05 | |||
| Left paracentral lobule | –3 | –16 | 68 | 4.04 | |||
Followed by brain regions with increased activity in the Late relative to the Early Learning phase (Late
We computed separate 2
| Brain region | MNI coordinates | F-value | Cluster size (voxels) | p-value uncorrected | |||
| x | y | z | |||||
| Cerebellum ROI mask | |||||||
| Left cerebellum (Crus 2) | –6 | –85 | –22 | 39.97 | 79 | 0.033 | |
| Right cerebellum (Crus 1) | 21 | –88 | –28 | 24.22 | |||
| Right cerebellum (Crus 2) | 6 | –85 | –28 | 14.87 | |||
| Right cerebellum (VI) | 15 | –82 | –19 | 13.77 | |||
| Cerebellar vermis (10) | 3 | –46 | –34 | 43.09 | 65 | 0.050 | |
| Left cerebellum (Crus 2) | –21 | –88 | –31 | 12.56 | 11 | 0.400 | |
| Left cerebellum (IV–V) | –6 | –55 | –4 | 12.88 | 7 | 0.508 | |
| Striatum ROI mask | |||||||
| Left putamen | –18 | 8 | 5 | 21.24 | 45 | 0.096 | |
| Left caudate | –15 | 14 | 5 | 15.07 | 11 | 0.400 | |
| Right putamen | 27 | –7 | 8 | 12.35 | 9 | 0.449 | |
| M1 ROI mask | |||||||
| Left precentral gyrus | –48 | –4 | 44 | 17.25 | 10 | 0.424 | |
| Right precentral gyrus | 42 | –13 | 41 | 11.58 | 10 | 0.424 | |
| Left postcentral gyrus | –57 | –16 | 35 | 13.20 | 9 | 0.449 | |
| Left postcentral gyrus | –39 | –25 | 56 | 11.05 | 5 | 0.582 | |
| Premotor cortex ROI mask | |||||||
| Right posterior-medial frontal | 9 | –13 | 53 | 16.87 | 55 | 0.069 | |
| Right superior frontal gyrus | 24 | –1 | 59 | 24.08 | 32 | 0.155 | |
| Left paracentral lobule | –3 | –16 | 65 | 13.95 | 17 | 0.294 | |
| Left posterior-medial frontal | –3 | –10 | 65 | 13.00 | |||
| Left precentral gyrus | –48 | –4 | 44 | 17.25 | 12 | 0.379 | |
| Right posterior-medial frontal | 6 | 2 | 56 | 11.86 | 10 | 0.424 | |
| Right precentral gyrus | 42 | –1 | 41 | 10.82 | 7 | 0.508 | |
| SMA ROI mask | |||||||
| Right posterior-medial frontal | 9 | –13 | 53 | 16.87 | 103 | 0.017 | |
| Left posterior-medial frontal | –3 | –13 | 65 | 14.66 | |||
| Right posterior-medial frontal | 6 | 5 | 59 | 12.67 | 31 | 0.161 | |
| Left posterior-medial frontal | –12 | 8 | 59 | 15.94 | 20 | 0.256 | |
| Right posterior-medial frontal | 6 | 23 | 53 | 15.46 | 18 | 0.281 | |
| preSMA ROI mask | |||||||
| Right precentral gyrus | 48 | 8 | 41 | 18.03 | 14 | 0.341 | |
| Left posterior-medial frontal | 3 | 23 | 53 | 13.02 | 13 | 0.359 | |
| Right posterior-medial frontal | 6 | 17 | 47 | 11.17 | |||
| Anterior cingulate ROI mask | |||||||
| Left anterior cingulate cortex | –12 | 41 | –1 | 22.92 | 23 | 0.224 | |
| Right anterior cingulate cortex | 9 | 38 | –1 | 11.22 | 8 | 0.477 | |
| Parahippocampal ROI mask | |||||||
| Right lingual gyrus | 27 | –52 | –7 | 20.59 | 19 | 0.268 | |
| Right fusiform gyrus | 30 | –58 | –10 | 11.48 | |||
| Left hippocampus | –21 | –25 | –13 | 20.39 | 12 | 0.379 | |
| Left parahippocampal gyrus | –15 | –34 | –7 | 11.19 | |||
| Left fusiform gyrus | –33 | –13 | –31 | 15.67 | 9 | 0.449 | |
| Hippocampus ROI mask | |||||||
| Left hippocampus | –21 | –22 | –13 | 24.31 | 27 | 0.189 | |
| Inferior parietal ROI mask | |||||||
| Right supramarginal gyrus | 63 | –43 | 35 | 20.40 | 22 | 0.234 | |
| Right angular gyrus | 33 | –55 | 44 | 20.03 | 21 | 0.245 | |
| Left inferior parietal cortex | –30 | –52 | 47 | 21.48 | 16 | 0.309 | |
| Precuneus ROI mask | |||||||
| Right precuneus | 12 | –70 | 44 | 20.99 | 68 | 0.046 | |
| Right cuneus | 15 | –79 | 41 | 11.14 | |||
| Left precuneus | –12 | –49 | 53 | 22.76 | 34 | 0.143 | |
| Left inferior parietal cortex | –27 | –52 | 44 | 17.55 | 24 | 0.214 | |
| Left superior parietal cortex | –24 | –61 | 47 | 9.70 | |||
| Right calcarine sulcus | 3 | –64 | 17 | 11.61 | 22 | 0.234 | |
| Left calcarine sulcus | –3 | –70 | 17 | 11.34 | |||
| Right precuneus | 12 | –43 | 53 | 25.97 | 20 | 0.256 | |
| Right superior parietal cortex | 27 | –61 | 50 | 17.04 | 13 | 0.359 | |
| dPFC ROI mask | |||||||
| Right precentral gyrus | 48 | 5 | 38 | 18.38 | 26 | 0.195 | |
| Left posterior-medial frontal | 3 | 23 | 53 | 13.02 | 13 | 0.359 | |
| Right posterior-medial frontal | 6 | 17 | 47 | 11.17 | |||
| vPFC ROI mask | |||||||
| Right precentral gyrus | 60 | 8 | 20 | 18.53 | 13 | 0.359 | |
| Right IFG (p. Opercularis) | 57 | 11 | 17 | 16.73 | |||
| Right IFG (p. Orbitalis) | 39 | 20 | –16 | 14.62 | 7 | 0.508 | |
| Right insula lobe | 33 | 26 | 2 | 10.79 | 5 | 0.582 | |
| oPFC ROI mask | |||||||
| Right superior frontal gyrus | 24 | 62 | 2 | 17.40 | 14 | 0.341 | |
| Right middle frontal gyrus | 33 | 53 | 2 | 9.07 | |||
Organised by ROI mask used for the analysis. A statistical significance threshold of p
To further explore the differences in testing phase, we used an uncorrected threshold of p
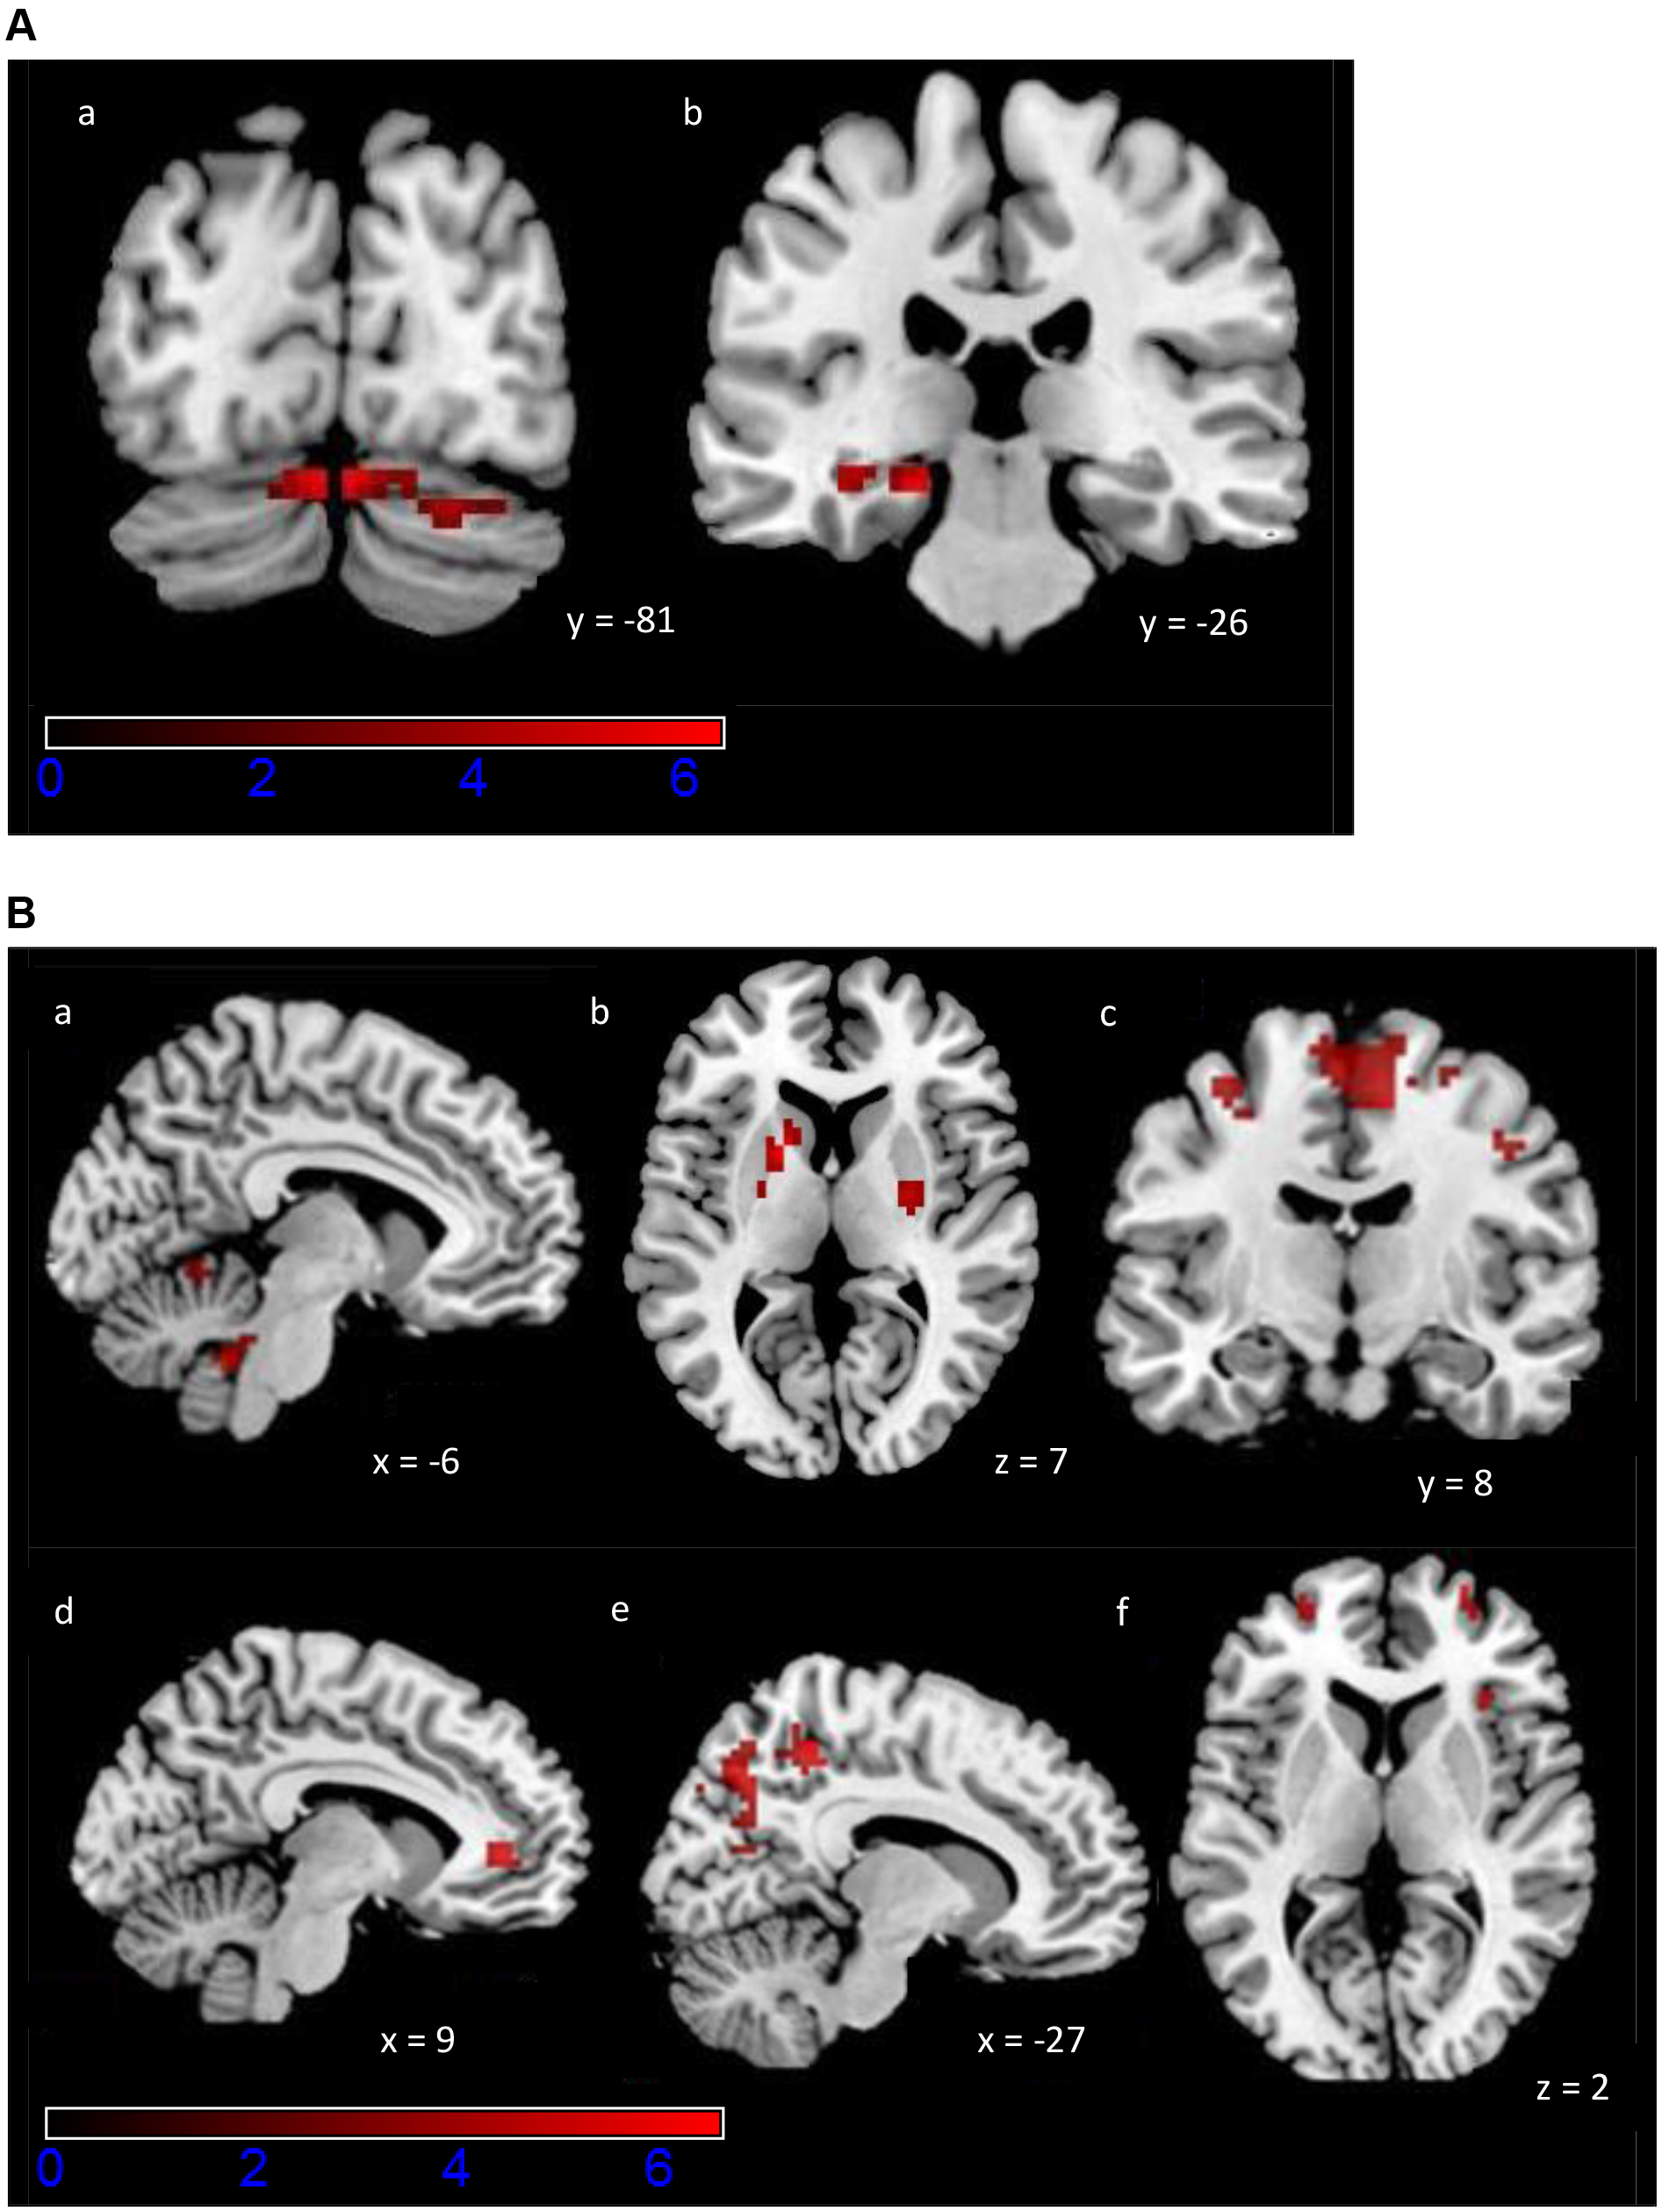 Fig. 3.
 Activation maps of the exploratory ROI analysis for the PCM task. Colour scale indicates z-scores, ranging from 0 to 6. (A) Increased activity during Early Learning (a) bilaterally in cerebellum, (b) left parahippocampal gyrus and hippocampus. A statistical significance of p
Finally, we calculated the correlations of the LI and the percent change in betas in the ROIs that showed a significant effect for the contrasts Early
We then looked for correlations between the LI and the diffusion MRI indices. We applied a statistical significance threshold of p
| Brain region | MNI coordinates | t-value | Cluster size (voxels) | p-value FDR-corrected | |||
| x | y | z | |||||
| FA negative correlation with LI | |||||||
| Right SMA (WM) | 18 | –20 | 58 | 5.28 | 35 | 0.002 | |
| Right SMA (WM and GM) | 12 | –20 | 60 | 4.83 | |||
| MD negative correlation with LI | |||||||
| Left cerebellum (IV–V) (GM) | –20 | –48 | –22 | 5.30 | 95 | ||
| Left cerebellum (VI) (GM) | –22 | –54 | –20 | 5.19 | |||
| Left middle temporal gyrus (GM) | –48 | –54 | 14 | 5.61 | 33 | 0.038 | |
| Right cerebellum (VI) (GM) | 24 | –72 | –18 | 4.65 | 29 | 0.049 | |
| ODI positive correlation with LI | |||||||
| Right SMA (WM) | 16 | –22 | 58 | 5.25 | 22 | 0.014 | |
A statistical significance threshold of p
In this experiment we examined the neural correlates of a novel and complex skill acquisition task that combined perceptual, motor and cognitive processes in healthy middle-aged adults (40–50 years old). There was a significant improvement in performance following training. This performance improvement could not be attributed to the participant demographics, including their age, sex and education. At a neurophysiological level, there was increased engagement of both cortical and subcortical areas within a relatively short time, supporting improved task performance. And finally, we found significant associations between brain microstructure and training outcome.
The number of successful trials increased significantly from the Early to the Late Learning phase of the PCM task, and the effect size was large and positive. The participants completed 160 trials within 31 minutes of training before the Late Learning phase. The fact that a relatively short training duration and a relatively low number of trials resulted in large performance improvement is in line with several studies showing significant task improvements following training, e.g., [6, 40, 62, 63, 64, 65, 66, 67, 68]. This improved performance in middle-aged adults is in agreement with findings in young adults, showing that practice with the PCM task led to better performance compared to controls that received no training [38].
The PCM scores for our participants were low, and there was still much room for improvement. The mean percentage of successful trials significantly increased from the Early Learning (M = 30.88%) to the Late Learning (M = 46.25%). By comparison, in the study by Bennett et al. (2018) [38], performance improved significantly in the post test for the practice group (M = 55%) compared to the control group that received no training (M = 20%) within 31 minutes of practice. One explanation for the lower training gains in our experiment could be that middle-aged participants are less able to learn the task than young adults. However, direct comparisons of the middle-aged adults and young adults of these different studies are difficult because the Bennett et al. (2018) [38] study was behavioural, whereas the present study was carried out in an MRI scanner. Conceivably the task is more difficult in the scanner as participants have to habituate to the scanner environment, in addition to completing the task while lying down, with a head coil mounted around the face, visualising the computer screen through a mirror system, and manipulating an unfamiliar mouse apparatus without being able to see one’s hand.
It is likely that 31 minutes of training was not enough time for the middle-aged participants to achieve expertise at this complex task. Changes in motor skill performance are known to evolve slowly, requiring many repetitions over several training sessions [18, 49, 69]. The acquisition of motor skills follows distinct stages, including an early, fast learning stage, in which considerable improvement in performance can be seen within a single training session, and a later, slow learning stage, in which further gains can be observed across several training sessions [18, 49, 70, 71]. With extended practice, the skilled behaviour becomes resistant to both interference and the passage of time, and can be readily retrieved at reasonable performance levels despite long periods without practice [18, 49, 72]. While it is clear that the middle-aged participants demonstrated significant performance improvements in the early fast learning stage, longer term training would be needed to see if further gains could be observed.
Moreover, we tested whether impulsivity and computer game experience could predict the performance improvement for each individual. Impulsivity is associated with specific measures of dysfunction of inhibitory control, ranging from disinhibited comments to risk-taking and aggression in clinical and non-clinical populations, e.g., [73, 74, 75]. Although we expected that participants with lower impulsivity scores might improve their performance more during the learning phase, possibly by exercising more inhibitory control and suppressing inappropriate motor responses or decisions, there was no significant association of the BIS-11 scores, or their components, with task performance. It is likely that sophisticated kinematic measures of movements were needed to reveal differences associated with impulsivity scores, e.g., [73, 74], rather than difference scores that capture overall performance accuracy and improvement. Computer game experience was associated with improved performance at the PCM task, which can be classified as near transfer to another type of computer game within the scanner environment. This result is in agreement with research that shows significant transfer benefits of computer gaming in the training of real-world skills, such as surgery and flight performance [76].
We found a significant main effect of testing phase: bilaterally in the cerebellum and pons, in the R thalamus, R STN, and R lingual gyrus. Specifically, there was greater activity bilaterally in the cerebellum (crus I and II), and in the lingual gyrus during Early Learning. This means there was a decrease in the activity of those areas in Late Learning, which may indicate a fast switch to more efficient processing in early visual areas [77], and in areas of the cerebellum that are connected with the dorsolateral prefrontal area 46 [78]. The activation of the unimodal (visual) lingual gyrus (middle occipitotemporal area) is congruent with findings that show its activation enhanced when visual and tactile information are combined to strengthen the representation of the visual stimulus [79], suggesting back projections from multimodal convergence areas can feedback and modulate representations in a primary modality [80].
Conversely, we observed increased activity in Late Learning in the cerebellum (vermis X), pons, thalamus, STN, precuneus, midcingulate cortex, SMA and paracentral lobule. Vermis X is part of the flocculonodular lobe, which is involved in visual tracking and oculomotor control [81]. The STN regulates function related to the basal ganglia, which includes motor, as well as cognitive and motivational processes [82]. Precuneus is central in integrated tasks that include visuo-spatial imagery, episodic memory retrieval and operations such as first-person perspective taking and experience of agency [83], which were important in the PCM task. Midcingulate cortex is crucial in execution of extended behaviours, by encoding distributed, dynamic representations of action sequences [84], which were a main feature of the PCM task. Finally, the SMA has a role in self-initiated movements [85]. The significant activation and engagement of these areas within a short time corresponds to those proposed by Doyon J et al. (2002) [20] for motor skill learning.
We did not observe a significant main effect of performance or interaction between testing phase and performance. This is likely because this is an early learning stage, and the neural signatures for successful and unsuccessful trials are not differentiated enough to be detected reliably.
Successful trial completion required working memory for navigating effectively to the target, anticipation/prediction of obstacle trajectories, and monitoring allocentric spatial relationships between objects, in addition to motor aspects, such as fine motor control, and adaptation to kinematics of self-referent motion and to cursor movement. Furthermore, the task goal could be achieved in multiple ways by executing cursor trajectories from a range of potential options. As expected, there was increased engagement of both cognitive and motor networks with just 31 minutes of training (160 trials).
Using an exploratory uncorrected threshold of p
The Doyon J et al. (2002) [20] model proposes that there are two loop circuits, a cortico-striatal and a cortico-cerebellar system, which are both recruited during the early learning stage of motor skill training regardless of the type of motor task.
However, in the later stage, after several sessions of training, the cortico-striatal and cortico-cerebellar systems contribute differentially to different types of motor tasks. For example, for motor sequence training the cerebellum becomes no longer essential, and the long-lasting retention of the skill will now involve representational changes (reflected through increased activity) in the striatum and its associated motor cortical regions, including the parietal and motor-related structures [18]. By contrast, a reverse pattern of plasticity is proposed for motor adaptation (learning to adapt to environmental perturbations): the striatum is no longer necessary for the execution and retention of the acquired skill; increased activity in regions representing this skill will now be present in the cerebellum, parietal cortex and motor-related cortical regions [18]. Thus, both the cortico-striatal and cortico-cerebellar loops are recruited in the early stage of motor skill training, while the later stage of motor sequence learning recruits the cortico-striatal system, whereas motor adaptation skills recruit the cortico-cerebellar system. Both the cortico-striatal and cortico-cerebellar systems were recruited in middle-aged adults. Indeed, our findings corroborate the regions suggested to be recruited in the early learning phase of the model—we found increased activity in the striatum, cerebellum, motor cortical regions (e.g., premotor cortex, SMA, pre-SMA, ACC), as well as prefrontal and parietal areas. However, in the present experiment we did not assess motor skill acquisition over the entire course of learning, and thus cannot assess the late training stage in order to fully examine this model.
In a similar model proposed by Hikosaka et al. (2002) [21], learning spatial coordinates during motor skill training is supported by a frontoparietal-associative striatum-cerebellar circuit, while learning motor coordinates is supported by an M1-sensorimotor striatum-cerebellar circuit. The Hikosaka et al. [21] model postulates that the regions engaged in the early stage of motor skill training are associative and involved in the fast learning of spatial coordinates, whereas in the late stage sensorimotor areas engage in the slower learning of motor coordinates. In line with this model, we found increased activity in frontoparietal-associative striatum-cerebellar regions (i.e., dPFC, inferior parietal cortex, ACC, caudate, rostrodorsal regions of the putamen, and regions in the cerebellum) indicating that this circuit was recruited to learn spatial coordinates in the PCM task.
Because of the exploratory nature of the ROI analyses, we do not focus on individual region activations, and only discuss the significant correlation of the LI with increased activity of the putamen and anterior cingulate with training improvement.
This finding is in line with studies showing that the rostrodorsal (associative) regions of the putamen are involved early in the learning process and are critical for acquiring a new motor skill, by extracting action value representations [60, 95, 96]. By contrast, activity in the caudoventral (sensorimotor) areas of the putamen increases as a function of practice, suggesting that this region is involved in the execution of well-learned motor skills [13, 60, 95]. Lehéricy et al. (2005) [60] demonstrated that performance was positively correlated with signal changes in areas activated during early learning, including the associative putamen. Conversely reaction time was negatively correlated with signal changes in areas activated during late learning stages, including the sensorimotor putamen. In addition, Jueptner et al. (1997) [95] showed that the shift of activation from the associative to the sensorimotor territories of the putamen was already completed after 50 min of training. These results indicate that motor representations shift rapidly from the associative to the sensorimotor territories of the putamen during early learning. Notably, we found increased activation in both rostrodorsal and caudoventral areas of the putamen, providing support for the notion that motor representations shift from the associative to the sensorimotor territories of the putamen during early learning.
A central role of the putamen in motor skill learning is the processing of reward prediction error signals, the discrepancy between the reward and its prediction. These signals originate from midbrain neurons that provide the basal ganglia with dopaminergic inputs, e.g., [21, 97, 98, 99, 100, 101]. Reward error signals attach a positive value to actions and objects accurately predicting positive outcomes in the early stage of learning, which shapes adaptive behaviour, e.g., [21, 96, 99]. Reinforcement Learning (RL) provides a useful framework for the learning of action and object values, and their consequences in terms of punishments and rewards in a given environment. A large body of experiments has mapped the RL mechanisms on fronto-striatal brain areas, modulated by midbrain dopaminergic inputs, and in association with the amygdala and the thalamus [96]. A study that tracked the dynamic representation of action values during learning [102], found that both the value of actions chosen based on previous outcomes, as well as those based on immediately available perceptual information, are represented in the dorsal striatum (caudate nucleus and putamen). This would be relevant for the PCM task, as both memorised successful action choices and immediately available visual information for action selection would be crucial for navigating each trial.
Putamen activation also increases in non-motor tasks involving a reward prediction error [103, 104]. Sommer and Pollmann (2016) [104] investigated if the occurrence of a target in a visual search display would elicit an increase of activation if the target’s location is predicted by a previously learnt spatial context. They demonstrated an intrinsic prediction error signal in the putamen in memory-driven visual search. Similarly, in the PCM task a successful trial would result in a positive intrinsic reward for a particular pattern and for the trajectory taken to the target, whereas an unsuccessful trial would generate a prediction error signal because at the early stage of learning, the possibility of reward is still very uncertain. Overall, the increased activity in the putamen most likely reflected a reward prediction error signal during task learning. The increased activity in the putamen, indicating greater processing of reward prediction error signals, correlated with improved behavioural performance.
As with the putamen activation, the significant positive correlation of activity in the ACC and task improvement most likely reflects a neural prediction error signal. The ACC plays a central role in error detection and performance monitoring, and several studies have reported activity in response to negative feedback [105, 106, 107, 108, 109], for an overview see [110]. The ACC activity contributes to a signal that has been termed feedback-related negativity (FN) or error-related negativity (ERN), indicating violations of expected outcomes. Similarly to midbrain dopamine neurons, the FN differentiates unpredicted rewards from unpredicted non-rewards [111], and has been reported in human EEG studies, e.g. [112], as well as in single unit recordings in the rodent ACC [113].
The PCM task required evaluation of the trial outcomes based on whether a choice of actions led to a successful trajectory to the target. The increased activity in both the putamen and ACC was significantly correlated with a better training outcome. Both regions process reward prediction error signals. ACC is primarily responsible for strategy selection, e.g., whether to approach the target from a particular direction, while the prefrontal and dorsal striatum circuits are responsible for the execution of the required actions [111]. Therefore, our results provide evidence that extracting action values at a high, strategic level in the ACC, and a more specific way in terms of action execution in the putamen, are critical steps in the early stage of task learning to optimise action selection and maximise performance.
Diffusion indices can be used to indirectly localise microstructural variation that might be indicative of learning outcome. Indeed, we found significant relationships between MD, FA, ODI, and the Learning Index. Our results show that inter-individual variation in brain structure was associated with extent of learning in middle-aged adults. This is in line with studies using diffusion MRI in young adults to demonstrate relationships between tissue microstructure and performance on cognitive and motor tasks [23, 27, 28, 114, 115, 116, 117]. For example, Johansen-Berg et al. (2007) [24] used DTI to show that variation in white matter integrity, indexed by FA, in the corpus callosum is significantly associated with variation in performance of a bimanual coordination task, supporting the idea that variation in brain structure reflects inter-individual differences in skilled performance. Our results are also in line with diffusion imaging studies in older adults investigating associations between brain microstructure and performance in cognitive and motor domains [12, 37]. For example, Bennett et al. (2011) [12] found that caudate-dPFC and hippocampus-dPFC tract integrity were significantly related to motor skill learning in healthy older adults (aged 63–72 years). Specifically, for both tracts, higher integrity, indexed by FA, was associated with greater motor sequence learning. Our results provide strong evidence of a relationship between brain microstructure and learning outcome, such that pre-existing inter-individual differences in brain structure could determine variations in skill learning.
We correlated the diffusion indices with the Learning Index, and we hypothesised that parameters indicating grey matter complexity and white matter integrity would be associated with better performance gains. We found a significant negative correlation between the training outcome and MD in the grey matter of the left middle temporal gyrus (specifically in human mid-temporal area: hMT+/V5) and bilaterally in the cerebellum (left Lobules IV, V, VI, right lobule VI); a significant negative correlation of the training outcome and FA in the grey and white matter of right SMA; and a significant positive correlation of the training outcome and ODI in the white matter of right SMA.
The area hMT+/V5 is especially critical for the perception of visual motion, e.g., [118], and therefore central for improving performance at the PCM task. Lobules IV and V are in the anterior lobe of the cerebellum, and process sensorimotor information, e.g., [119]. Therefore, our result is consistent with the contralateral connections between the cortical and cerebellar hemispheres for right-handed participants. Lobule VI is in the posterior lobe of the cerebellum and, additionally to sensorimotor processing, it has association area projections, including with temporal, parietal and prefrontal areas. Moreover it processes cognitive information, and shows bilateral activations in working memory tasks [119]. Consequently, the bilateral lobule VI involvement in our experiment is consistent with the cognitive demands of the PCM task. Furthermore, the ipsilateral SMA FA and ODI indices correlation with the training outcome is consistent with the SMA ipsilateral connectivity with the primary motor (M1) hand area. Functionally, stimulation of SMA can lead to LTP-like or LTD-like effects in M1, providing a potential physiological mechanism for neuroplasticity [120, 121].
MD can indicate tissue density, e.g., [27, 28, 32, 122, 123]. Lower levels of MD correspond to lower water diffusion rates, resulting from greater tissue density, i.e., a greater density of axons or dendrites, which restricts the overall rate of diffusion. Accordingly, we expected lower MD to be associated with greater improvement in PCM performance and indeed, this was the case in the grey matter of left hMT+/V5 and bilaterally in cerebellum. This is in agreement with other DTI studies that demonstrated an association between reduced MD in grey and white matter and greater task improvement [27, 28]. For example, Sagi et al. (2012) [27] examined grey matter microstructure in participants performing a spatial navigation task. They showed significant negative correlations between improvement rate on task performance and MD reduction in the left hippocampus and right parahippocampus. Using the same task, Hofstetter et al. (2013) [28] investigated white matter microstructure and found that improvement on the task correlated with reductions in MD in the fornix. However, although diffusion metrics are sensitive markers for subtle microstructural tissue organisation, they are not specific and are difficult to attribute to particular biological processes [124]. So, although we have established a clear relationship between lower MD and better training outcome on the PCM task, we can only speculate as to the cellular mechanisms underlying the variation in structure that supports better learning on this task.
FA refers to the orientation of water diffusion, independent of rate, and is a measure of fibre organisation and integrity [12, 27, 32, 122, 123, 125]. Higher FA values indicate that the diffusion of water molecules is restricted in the direction along axons, that fibres are more coherent and aligned, reflecting higher tissue integrity. Lower FA values indicate diffusion in the perpendicular direction. Several previous studies have shown that higher FA is associated with improved behavioural performance on visuospatial and cognitive tasks [24, 114, 116, 126, 127]. However, there are also reports of correlations of lower FA values with task performance. For example, Hofstetter and colleagues (2013) [28] showed that reductions in FA values in the fornix were correlated with improvement on a spatial learning and memory task. Tuch et al. (2005) [23] demonstrated that slower reaction times on a visuospatial task, i.e., worse task performance, were significantly correlated with higher FA in white matter of the right optic radiation, right posterior thalamus, right medial precuneus, and left superior temporal sulcus.
FA is a complex measure that is influenced by myelination, axon diameter, axon density [128], as well as by path geometry and the presence of crossing fibre pathways [24, 34, 129]. In areas with intravoxel fibre crossings, higher FA of an individual fibre population can result in a lower overall FA [23, 45, 130, 131]. The SMA contains a large number of connections, including short association or U fibres that connect neighbouring gyri, e.g., from the pre-SMA to the SMA and from the SMA to M1, e.g., [132]. The strong relationship between lower FA in both grey and white matter of the SMA and better training outcome on the PCM task that we demonstrated may be at least partly explained by this anatomical feature.
Using NODDI, we found a significant positive correlation of training outcome with ODI in the white matter of the right SMA. This was in contrast to our prediction of lower ODI values in the white matter, which would indicate less dispersion of water molecules and thus tracts that are more compact, parallel, directional and aligned [33], resulting in faster signal transmission [23].
The fact that the last two correlations of the FA and ODI indices are found in the ipsilateral SMA can be interpreted as additional recruitment during a time window of intense motor learning, planning and plasticity, potentially sharing similarities with longer reorganisation periods requiring recruitment of the SMA in both hemispheres, e.g., [133, 134, 135]. Furthermore, NODDI provides a way of interpreting changes in FA, i.e., to decouple the effects of axonal density (higher density would increase FA) and orientation dispersion (higher dispersion would decrease FA). The correlations with FA and ODI were overlapping in the SMA—within which we saw lower FA and higher ODI correlated with better training outcomes. Therefore, the ODI results confirm that the associations with FA reflected primarily an effect of orientation dispersion. The fact that the correlation is in the opposite direction could be due to the specific structure of SMA, and the fact that it contains many connections with multiple directions.
One of the limitations of our study is that it does not provide data on how the activated regions interact with one another and how information is transferred from one circuit to another during the course of motor training, for example, from the associative to the sensorimotor circuit, i.e., transformation from spatial to motor coordinates [21]. Functional and effective connectivity approaches could be used to assess connections between regions of a network, as well as between networks.
The question regarding the detailed underlying biological mechanisms of the observed relationships between the diffusion indices and training outcome in the PCM task cannot be addressed in this study. Histology offers the possibility to validate diffusion indices and to shed light on the cellular events that underlie the measures obtained in human neuroimaging studies of motor skill training, e.g., [127]. An animal study with a similar PCM protocol that correlates diffusion indices with histological measures such as the number of synaptic vesicles, number of dendritic spines and astrocytic processes would provide further information on the mechanisms underlying better training outcomes. Indeed, evidence suggests that in both grey and white matter, there is a strong link between neurite morphology determined from diffusion MRI and independent measures derived from histology [27, 28, 33, 127].
We have demonstrated specific associations between diffusion indices and training outcome in a small sample of 21 healthy middle-aged adults, suggesting that inter-individual variation in brain structure influences variation in skill learning. However, as this is a correlation study, we cannot confirm a causal role of brain structure on differences in skill learning behaviour. Additionally, given the main effect of session reported, all the suggested condition differences in the exploratory ROI analyses could indicate that they may be confounded by scanning time.
Finally, our experiment had a short timescale, and future research should use a longitudinal design to investigate the relationship of motor training with functional and structural brain changes and performance. There is emerging evidence that changes in diffusion indices can also occur in response to short-term training [27, 28, 136]. For example, Marins and colleagues (2019) [136] trained healthy individuals to reinforce brain patterns related to motor execution while performing a motor imagery task. After just one hour of training, participants showed increased FA in the sensorimotor segment of corpus callosum. Therefore, it may also be possible to design a pre- and post-training study of structural brain changes with short-term training.
Our findings show that even with short-term practice, middle-aged adults show significant plasticity in cognitive and motor abilities as evidenced by the training gains made on the task. We provide novel evidence for training-induced increased engagement of both cognitive and motor networks within a short time window, supporting improved performance on the task. We demonstrate that experience-related activity reorganisation begins to develop within cortical and subcortical regions as training progresses. Some of the functional changes, specifically in the putamen and the anterior cingulate, are associated with better training outcome, suggesting these areas might underlie learning of the task. Thus, targeting these areas in training could be particularly beneficial in improving task learning. Finally, for the first time in middle-aged brains, we show a significant association between brain microstructure and training outcome, indicating that inter-individual variation in brain structure is associated with learning rate.
ANOVA, analysis of variance; DTI, diffusion tensor imaging; FA, fractional anisotropy; L, left; MD, mean diffusivity; M1, primary motor cortex; MRI, magnetic resonance imaging; MOA, multiple object avoidance; NDI, neurite density index; NODDI, neurite orientation dispersion and density imaging; ODI, orientation dispersion index; PCM, perceptual-cognitive-motor; R, right; ROI, region of interest; SMA, Supplementary Motor Area.
The data that support the findings of this study are available from the corresponding author upon reasonable request.
DK: Data curation; formal analysis; methodology; project administration; writing – original draft. MU: Methodology; writing – review and editing. SB: Methodology; formal analysis (NODDI); writing – review and editing. MC: Methodology; supervision; writing – review and editing. PRF: Conceptualisation; funding acquisition; writing-review and editing. NS: Conceptualisation; funding acquisition; methodology; supervision; formal analysis; project administration; writing – original draft, review and editing. All authors read and approved the final manuscript. All authors have participated sufficiently in the work and agreed to be accountable for all aspects of the work.
Participants gave written informed consent before taking part in the experiment. The study conforms to the World Medical Association Declaration of Helsinki and ethical approval was obtained from the Brighton and Sussex Medical School Research Governance and Ethics Committee (12/101/SIG/SIG-03).
We would like to thank the radiographers and staff at the Clinical Imaging Sciences Centre for their help with the study.
This study was supported by a University of Brighton Rising Stars grant (PRF, NS) and research funds from the Brighton and Sussex Medical School (NS) and the Clinical Imaging Sciences Centre (NS).
The authors declare no conflict of interest.
References
Publisher’s Note: IMR Press stays neutral with regard to jurisdictional claims in published maps and institutional affiliations.