

 , Colin Hanna 1, John Tyler 1, Patrick Mohr 1, Huy Lu 1, Aidan Powell 1, Kenneth Blum 2,3,*
 , David Baron 2,4, Kai-Uwe Lewandrowski 5, Igor Elman 6, Albert Pinhasov 3, Mark S. Gold 7, Panayotis K. Thanos 1,3,8,*
1 Behavioral Neuropharmacology and Neuroimaging Laboratory on Addictions, Clinical Research Institute on Addictions, Department of Pharmacology and Toxicology, Jacobs School of Medicine and Biomedical Sciences, State University of New York at Buffalo, Buffalo, NY 14203, USA
2 Division of Addiction Research & Education, Center for Sports, Exercise & Mental Health, Western University of the Health Sciences, Pomona, CA 91766, USA
3 Department of Molecular Biology, Adelson School of Medicine, Ariel University, 40700 Ariel, Israel
4 Department of Psychiatry, Stanford University School of Medicine, Palo Alto, CA 94304, USA
5 Center for Advanced Spine Care of Southern Arizona and Surgical Institute of Tucson, Tucson, AZ 85712, USA
6 Cambridge Health Alliance, Harvard Medical School, Cambridge, MA 02139, USA
7 Department of Psychiatry, Washington University School of Medicine, St. Louis, MO 63110, USA
8 Department of Exercise and Nutrition, State University of New York at Buffalo, Buffalo, NY 14214, USA
Abstract
Exercise enhances overall health, playing an important role in protecting against diseases that impact brain function. Studies show that physical activity influences several key biological processes, including dopamine signaling, brain glucose metabolism (BGluM), and social behavior.
Male sedentary and chronic exercise rats were examined for dopamine signaling and social behavior. Tyrosine hydroxylase (TH) immunohistochemistry (IHC), and D1 and D2 receptor (D1R and D2R) autoradiography was used to assess dopamine signaling; [18F]-Fluorodeoxyglucose positron emission tomography (FDG PET) was used to measure brain functional connectivity; Crawley’s three-chamber sociability test was used to measure social behavior; and Pearson correlation was used to analyze correlations between social interaction and TH, D1R, and D2R binding.
Exercised rats demonstrated greater D1R binding within several regions of the caudate putamen and nucleus accumbens. PET image analysis showed significantly higher BGluM in the exercised rats compared with the sedentary controls across several brain regions. These regions are associated with enhanced functional connectivity related to movement, olfaction, cardiovascular function, and predator awareness. Exercise had no significant effect on social interaction. Pearson correlation analysis revealed a significant negative relationship between social interaction and D1R binding.
Chronic aerobic exercise did not significantly alter social interaction, TH, or D2R binding. D1R binding was enhanced in the exercise group compared with the sedentary group and was negatively correlated with social interaction. We speculate that approach behavior was attenuated by exercise due to social threat stimulation. Functional connectivity imaging data showed significant glucose metabolic activation within the cuneiform nucleus, which has been previously shown to be critical in defensive behavior. This may explain the lack of significant effect of exercise on approach or exploratory behavior. These findings support the potential of exercise in response to social behavior and the possible attenuation of social behavior towards a social threat or socially inappropriate behavior. Exercise can induce metabolic transience that may assist rats in detecting odors from larger predatory animals.
Keywords
- social interaction
- positron-emission tomography
- exercise
- brain glucose metabolism
- dopamine
- tyrosine hydroxylase
Physical exercise is known to enhance well-being and general health. It serves as a protective factor against many diseases including neurodegenerative, psychiatric and affective disorders, and cardiovascular diseases [1, 2, 3, 4, 5, 6, 7]. In humans, exercise directly affects the brain, increasing cortical thickness [8] and altering brain glucose metabolism (BGluM) [9, 10].
In rodents, exercise increases BGluM in the hippocampus, caudate putamen, and areas related to auditory sensory processing [11]. Various studies highlight the effects of exercise on brain function and behavior after cocaine exposure, including altering BGluM in the hippocampus and substantia nigra [12, 13] as well as decreasing cocaine-seeking behaviors [14, 15, 16, 17]. Moreover, physical exercise is continuously studied as a potential therapeutic strategy for drug addiction [5, 17, 18, 19, 20, 21, 22, 23, 24] as well as alcohol use disorder [25, 26].
It is believed that dopamine can modulate social behavior. In humans, polymorphisms in genes associated with dopamine transmission have been repeatedly associated with addiction, impulsive and compulsive behaviors, and conduct disorders involving sociability [27, 28]. Specifically, risk alleles of the dopamine receptor D4 (DRD4) gene have been found to correlate with aggression and anti-social behaviors [28, 29, 30, 31].
Manipulations that enhance dopamine signaling in the nucleus accumbens (NAc) increase social play behavior in adolescent rats; likewise, antagonism of D1 receptor (D1R) or D2R decreases social play [32]. Both D1R-like levels in the NAc and social play behaviors peak during a similar developmental window in rats, with declines in D1R levels corresponding to reductions in social play [33]. D1R activation also enhanced social recognition [34]. The influence of exercise on D1R and its subsequent behavioral modulation is also well-documented. Chronic treadmill exercise is associated with decreased D1R binding in the ventral striatum, including the NAc core and shell [15, 17, 35]. This reduction in D1R binding is linked to attenuation of drug-seeking behavior and facilitation of drug extinction [36, 37].
D2R mediated signaling is also linked to modulation of social behavior. Previous research has shown that D2R overexpression in Purkinje cells decreases sociability and impairs social preference [34]. Conversely, mice lacking D2R in Purkinje cells spent more time in social contact characterized by spending more time engaging in close interaction with another mouse than with an object, and preferring interaction with an unfamiliar mouse than with a familiar one [34]. Numerous studies have also outlined exercise’s ability to significantly affect D2R levels [35, 38, 39, 40, 41, 42]. Exercise-induced enhancement of D2R-like binding has been shown to promote defensive behavior and conditioned place avoidance, reduce drug consumption, increase motivation, and decrease depressive symptoms [35, 43, 44, 45]. Additionally, elevated D2R levels are associated with enhanced motivation, and conversely, decreased D2R is associated with attenuated motivation [44].
Tyrosine hydroxylase (TH) is the rate-limiting enzyme in the synthesis of catecholamines, notably dopamine, making it an important neurobiological marker of dopamine signaling. This relationship between TH and dopamine is reflected in the literature by the significant correlation observed between TH levels and dopamine bioavailability [46, 47]. Previous research has indicated that exercise-induced elevation in TH expression is linked to changes in social interaction, specifically a decrease in hyper-social behaviors [48]. Conversely, substance abuse is associated with decreased TH activity and TH levels [49, 50]. The exercise-induced enhancement of TH expression is consistently supported across numerous exercise models [48, 51, 52, 53].
Chronic aerobic exercise has been found to modulate BGluM in several areas within the rat brain [11, 12, 13, 54]. Female rats underwent an exercise regimen identical to the present experiment [54]. Using [18F]-Fluorodeoxyglucose positron emission tomography (FDG PET), researchers found that exercise significantly increases BGluM in the caudate putamen, postsubiculum, subiculum transition area, primary auditory cortex, internal capsule, and external capsule. Areas of activation affect several key functions within the brain, including movement and reward, auditory processing, and memory [54]. Chronic exercise following this protocol has also been shown to modulate the BGluM response to various doses of cocaine in rats. In male rats, chronic cocaine exposure led to activation in the amygdalopiriform transition area, basolateral amygdaloid nucleus/dorsal endopiriform nucleus piriform cortex layer 1, trigeminothalamic tract, perirhinal cortex/rhinal fissure, and secondary visual cortex, lateral area. Inhibition was found only in the primary somatosensory cortex [12]. In female rats, activation was observed in the postsubiculum, parasubiculum, temporal association cortex, entopeduncular nucleus, and granular and dysgranular insular cortex. Inhibition was observed in the ventral endopiriform nucleus after an acute dose of cocaine [11, 13].
A link has been established between social conditions and exercise. Specifically, exercise has been shown to provide reparative effects due to social isolation in rat pups [55, 56]. Both voluntary and forced exercises confer restorative effects for impaired sociability, novel exploration deficits, and hypoactivity in diabetic rats [57]. However, other studies on exercise have found no significant effect or even impairments, in social interaction, social memory, and anxiety-like or defensive responses [58, 59].
The reparative effects of exercise have also been shown in memory and exploratory behavior via exercise-induced changes in selenoprotein [60, 61]. Selenoproteins, specifically selenoprotein P, plays a critical role in neuroprotection and cognitive enhancement [60, 62] Building on the established the relationship between exercise, functional dopaminergic connectivity [35] and social behavior [55], we decided to investigate direct changes in social behavior after 6 weeks of forced exercise. Based on previous findings, we hypothesize that exercised rats will express more pro-social behavior than sedentary rats. Additionally, the correlations between social behavior, dopamine signaling, and FDG PET will be examined and compared between exercised and sedentary rats.
Individually housed male Lewis rats (n = 12; mean weight = 201.1 g) (Charles
River, Wilmington, MA, USA), at the age of 8 weeks, were used. The temperature of
the holding room was kept at a constant 22
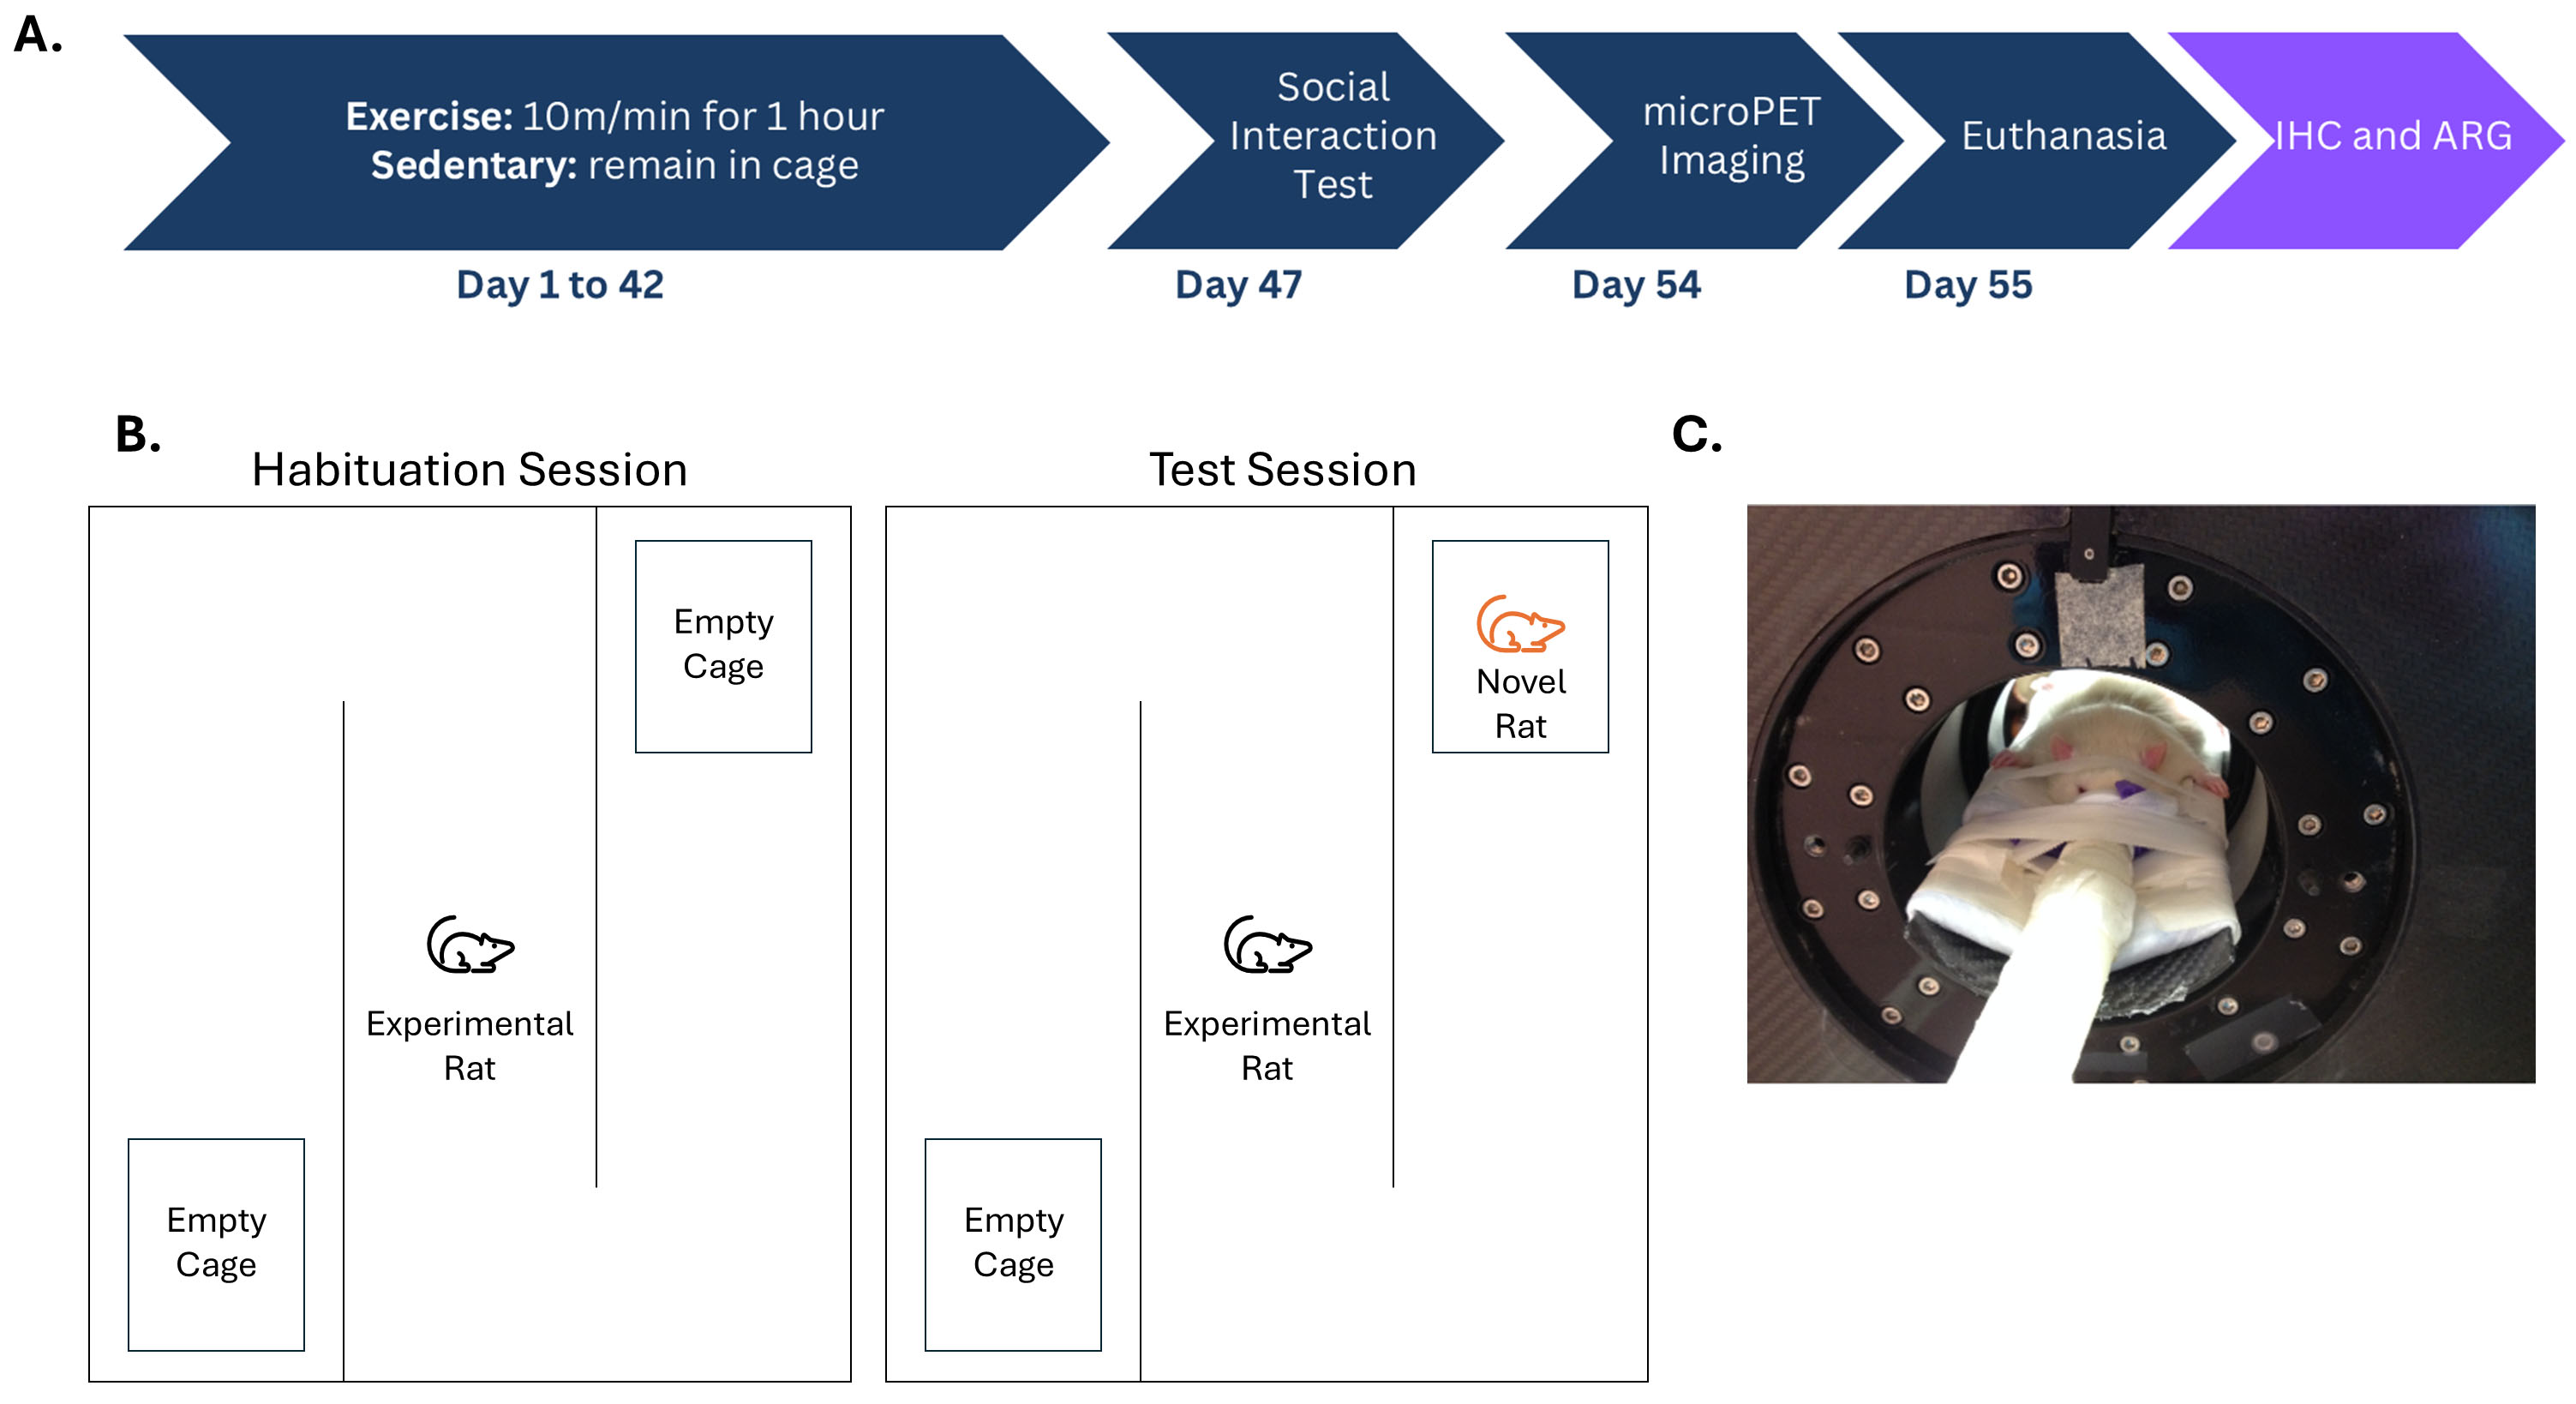
 Fig. 1.
An experimental timeline as well as representations of Crawley’s three-chamber sociability test and a rat undergoing a positron emission tomography (PET) scan. (A) Experimental timeline: Animals were divided into exercise and sedentary groups. The sedentary control rats remained in their home cages for 6 weeks while the exercise group completed a 6-week moderate-intensity aerobic exercise (MIAE) protocol. Five days following the completion of the exercise regimen, all rats underwent Crawley’s three chamber sociability test. Six days later, microPET scans were completed. On the following day, the rats were euthanized under 3% isoflurane anesthesia, administered via inhalation, and decapitated. Brains were collected, flash frozen, and sectioned in preparation for immunohistochemistry (IHC) and autoradiography (ARG) protocols that were completed at a later date. (B) A schematic of Crawley’s Three Chamber Sociability Test with the left side depicting the habituation session and the right side depicting the test session. (C) A rat positioned in a PET scanner in a supine position.
Rats in the experimental group (n = 6) underwent a forced exercise regimen after a one-week habituation period. A customized treadmill with four Plexiglas lanes was employed. Exercise was performed between 11:00 AM and 3:00 PM on all rats in the exercise group. Rats were given a 10-minute habituation period once loaded into the lanes. The treadmills’ rate of speed remained constant, at 10 meters per minute, throughout the experiment. The duration of the exercise session started at 10 minutes and increased from 10 minutes daily to a maximum of 60 minutes. After the first 30 minutes of exercise, the rats were given a 10-minute rest. The exercise regimen occurred five days per week for six weeks. The rats ran a total distance of roughly 16.5 km [63]. While the experimental rats were exercising, the control group (n = 6) remained in their cages [15, 63].
A social interaction test was performed 5 days after the completion of the
exercise program, using Crawley’s three chamber sociability test [64, 65] in a
room illuminated only by red light. Testing occurred during the dark cycle
between 1100 h and 1700 h. The test was performed in a social interaction arena:
a square enclosed unit with three chambers divided by partition, each measuring
20 cm by 60 cm (Fig. 1B). Metal cages (21.59 cm (L)
Seven days after the completion of the social interaction test, all rats (n = 12) were injected with 18F-FDG (Cardinal Health, Rochester, NY, USA) via intraperitoneal injection and PET scans were taken (Fig. 1C). 18F-FDG dosage was 500 µCi as previously described [11, 12, 13, 54]. In the 8 hours leading up to the scans, no food was allowed to facilitate normalization of blood glucose levels. The injections were followed by a 30-minute uptake period. Anesthesia was administered via inhalation using 3% isoflurane (MWI502017, VetOne, Boise, ID, USA) (maintained at 1% for the length of the scan). The rats were restrained on the scanner bed and scanned for 30 minutes. A PET R4 tomograph (Concorde CTI Siemens, Munich, Germany) was used for the scans. Scans were conducted with a transaxial resolution of 2.0 mm full width at 50% of maximum, and a transaxial field view of 11.5 cm [66]. Following the scans, rats were returned to their cages and given unrestricted access to food and water.
The MAP algorithm technique (15 iterations, 0.01 smoothing value, 256
Rats were euthanized using inhaled isoflurane anesthesia (~3.0%) and decapitation twenty-four hours following PET scans. The brains were collected, rapidly frozen in 2-methylbutane (CAS no. 78-78-4, Sigma Aldrich, St. Louis, MO, USA), and subsequently stored at a temperature of –80 °C until they were cryosectioned at 14 µm (sagittal plane) and mounted onto glass microscope slides. The tissue sections remained stored at –80 °C until they were utilized for in vitro receptor autoradiography and immunohistochemistry (IHC).
Rat brain section slides were initially dehydrated in 90% ethanol for 10
minutes at room temperature [42, 68]. TH IHC was performed similarly to other
experiments [69]. Following dehydration, the slides were washed in 1
D1R and D2R expression were assessed using [3H] SCH 23390 and [3H] spiperone autoradiography respectively (PerkinElmer, Boston, MA, USA). Binding was performed as previously described [35, 42]. All slides were submerged for 60 minutes in 50 mM Tris HCL preincubation buffer at room temperature (120 mM NaCl, 5 mM KCl, 2 mM CaCl2, 1 mM MgCl2, pH = 7.4). Specific slides were then submerged for 60 minutes in 2.5 nM [3H] SCH 23390 (specific activity = 85 Ci/mmol) or [3H] spiperone (specific activity = 16.2 Ci/mmol) and 40 nM ketanserin (S006, Sigma Aldrich) buffer solution at room temperature. Non-specific slides were submerged for 60 minutes in 1 µM flupenthixol (F114, Sigma Aldrich) buffer solution. Finally, all slides were washed twice for 5 minutes in 4 °C preincubation buffer followed by a dip in 4 °C in dH2O. The bound sample slides, as well as tritium standards, were placed against Kodak MR Film (Eastman Kodak Company, Rochester, NY, USA). The film was scanned at a resolution of 1200 dpi, and the images were analyzed using ImageJ software. The regions of interest included the VM CPU, VL CPU, DL CPU, DM CPU, NAc Shell, NAc Core, olfactory tubercle (OT), and substantia nigra (SNR), were examined for [3H] SCH 23390 and [3H] spiperone binding. All statistical analyses were conducted using GraphPad Prism 9 software with significance set at p = 0.05. Outliers, if present, were identified and removed using the ROUT method (Q = 1%). Two tailed unpaired t-tests were conducted comparing the binding values of the exercise group to those of the sedentary group for all regions of interest.
Pearson correlations were conducted to compare social interaction to TH, D1R, and D2R binding. Time spent interacting with the novel rat was correlated to mean binding using GraphPad Prism 9 software with significance set at p = 0.05. Outliers, if present, were identified and removed using the ROUT method (Q = 1%).
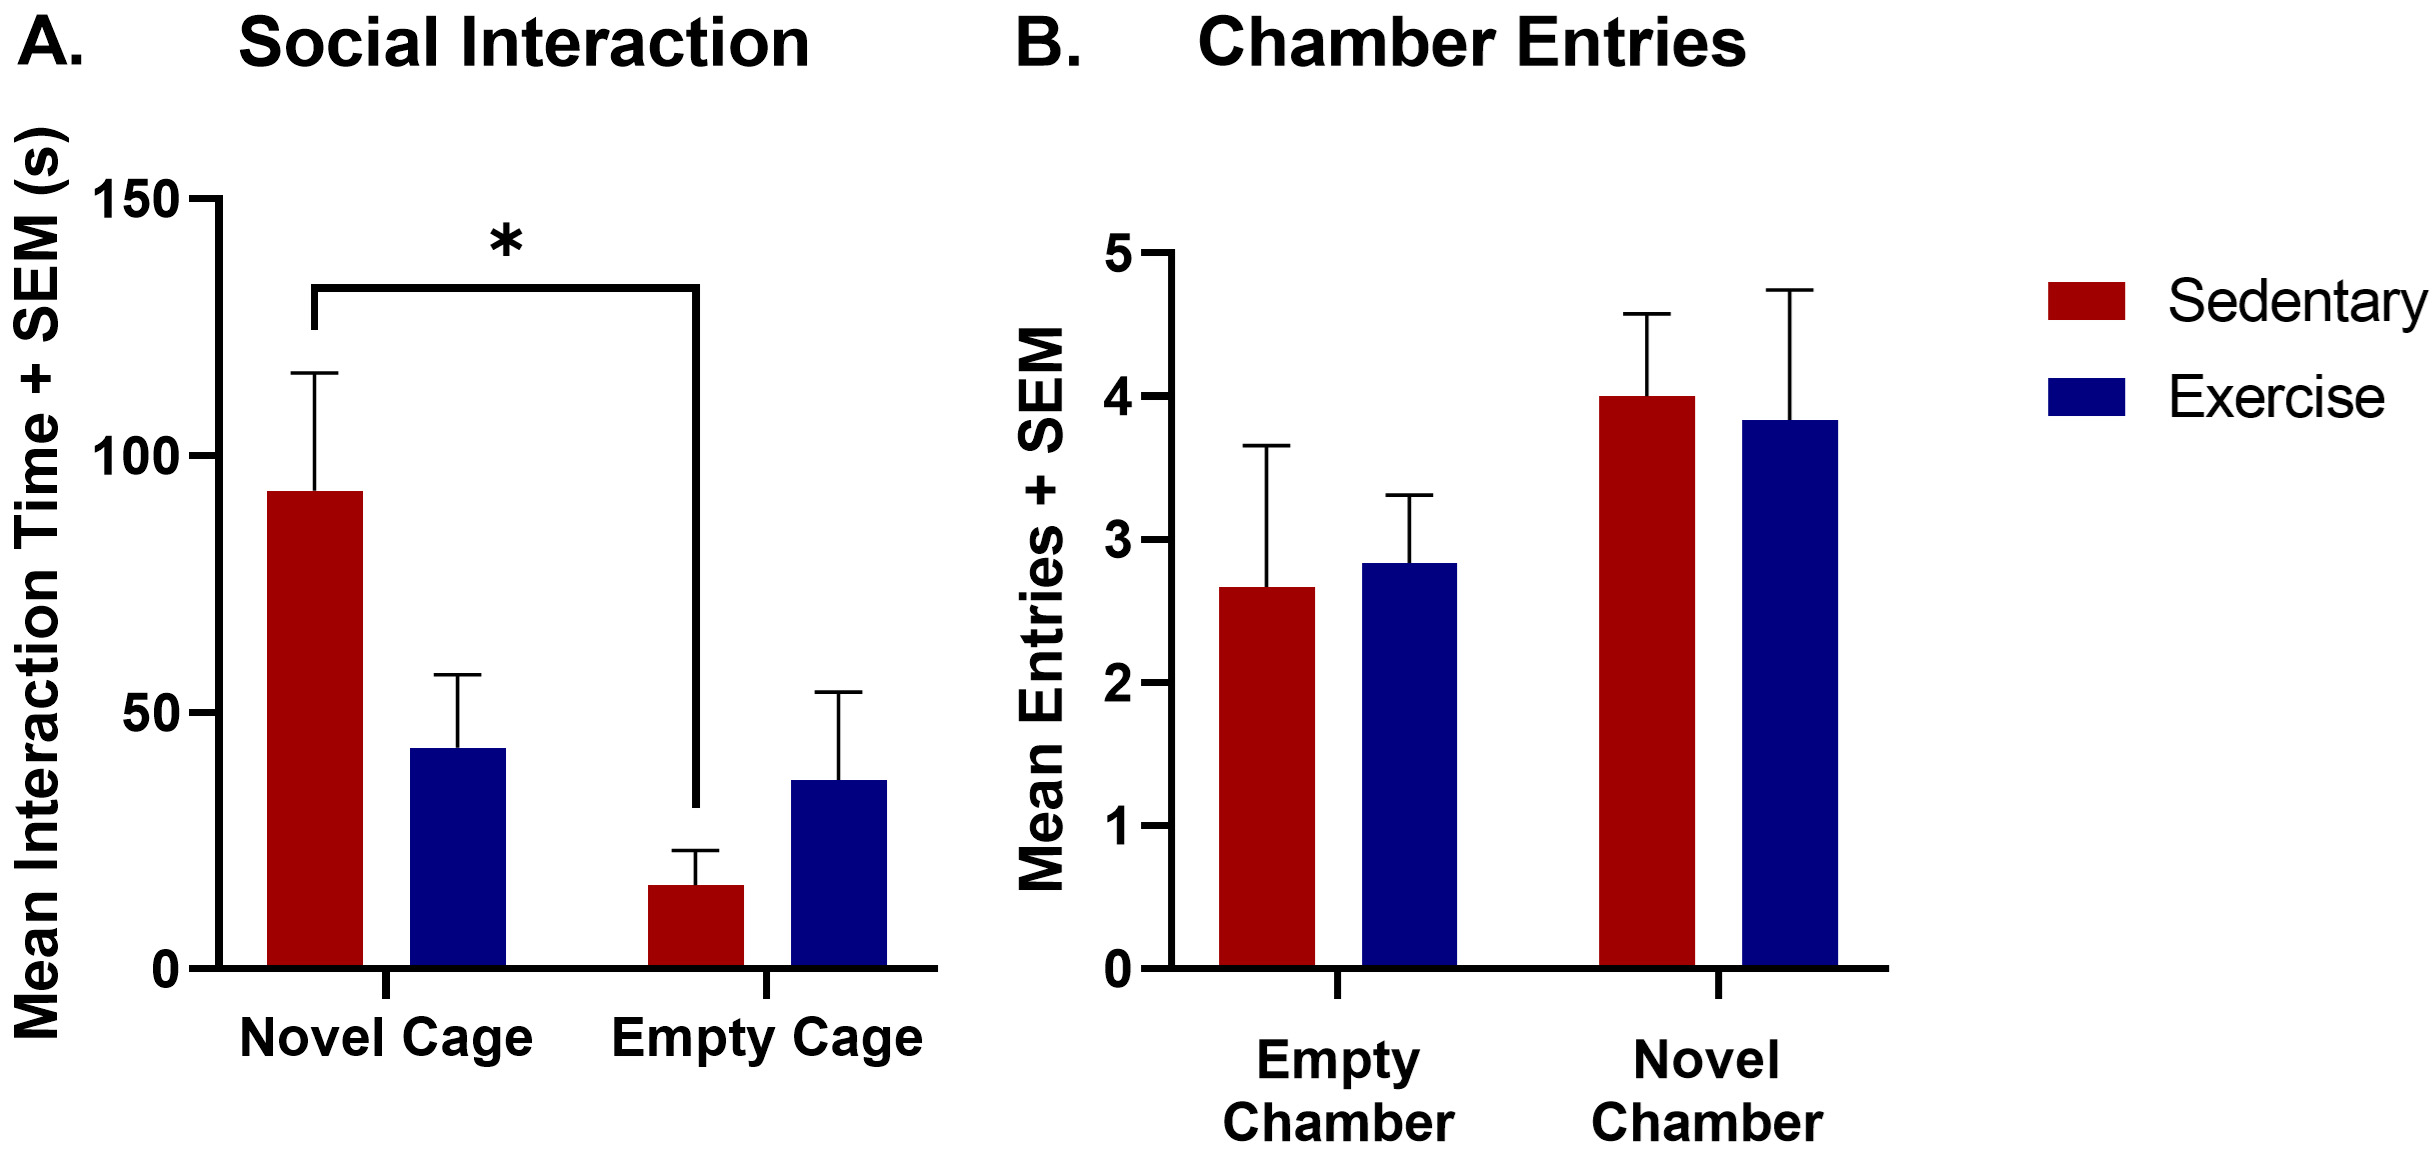
The results of Crawley’s three-chamber sociability test are presented in Fig. 2.
A two-way ANOVA was run with the factors of exercise and social stimulus. A
significant difference in social interaction time was found between the novel and
empty cages for sedentary rats [F(1,20) = 6.50; p
 Fig. 2.
Crawley’s three-chamber sociability results comparing both the
mean interaction time and mean number of chamber entries for the exercise and
sedentary groups. (A) A two-way ANOVA was used to measure social interaction
time across exercise condition (exercise vs sedentary) and environment (novel rat
cage versus empty cage). There was a significant effect of exercise
[F(1,20) = 6.5; *p
A two sample t-test (p
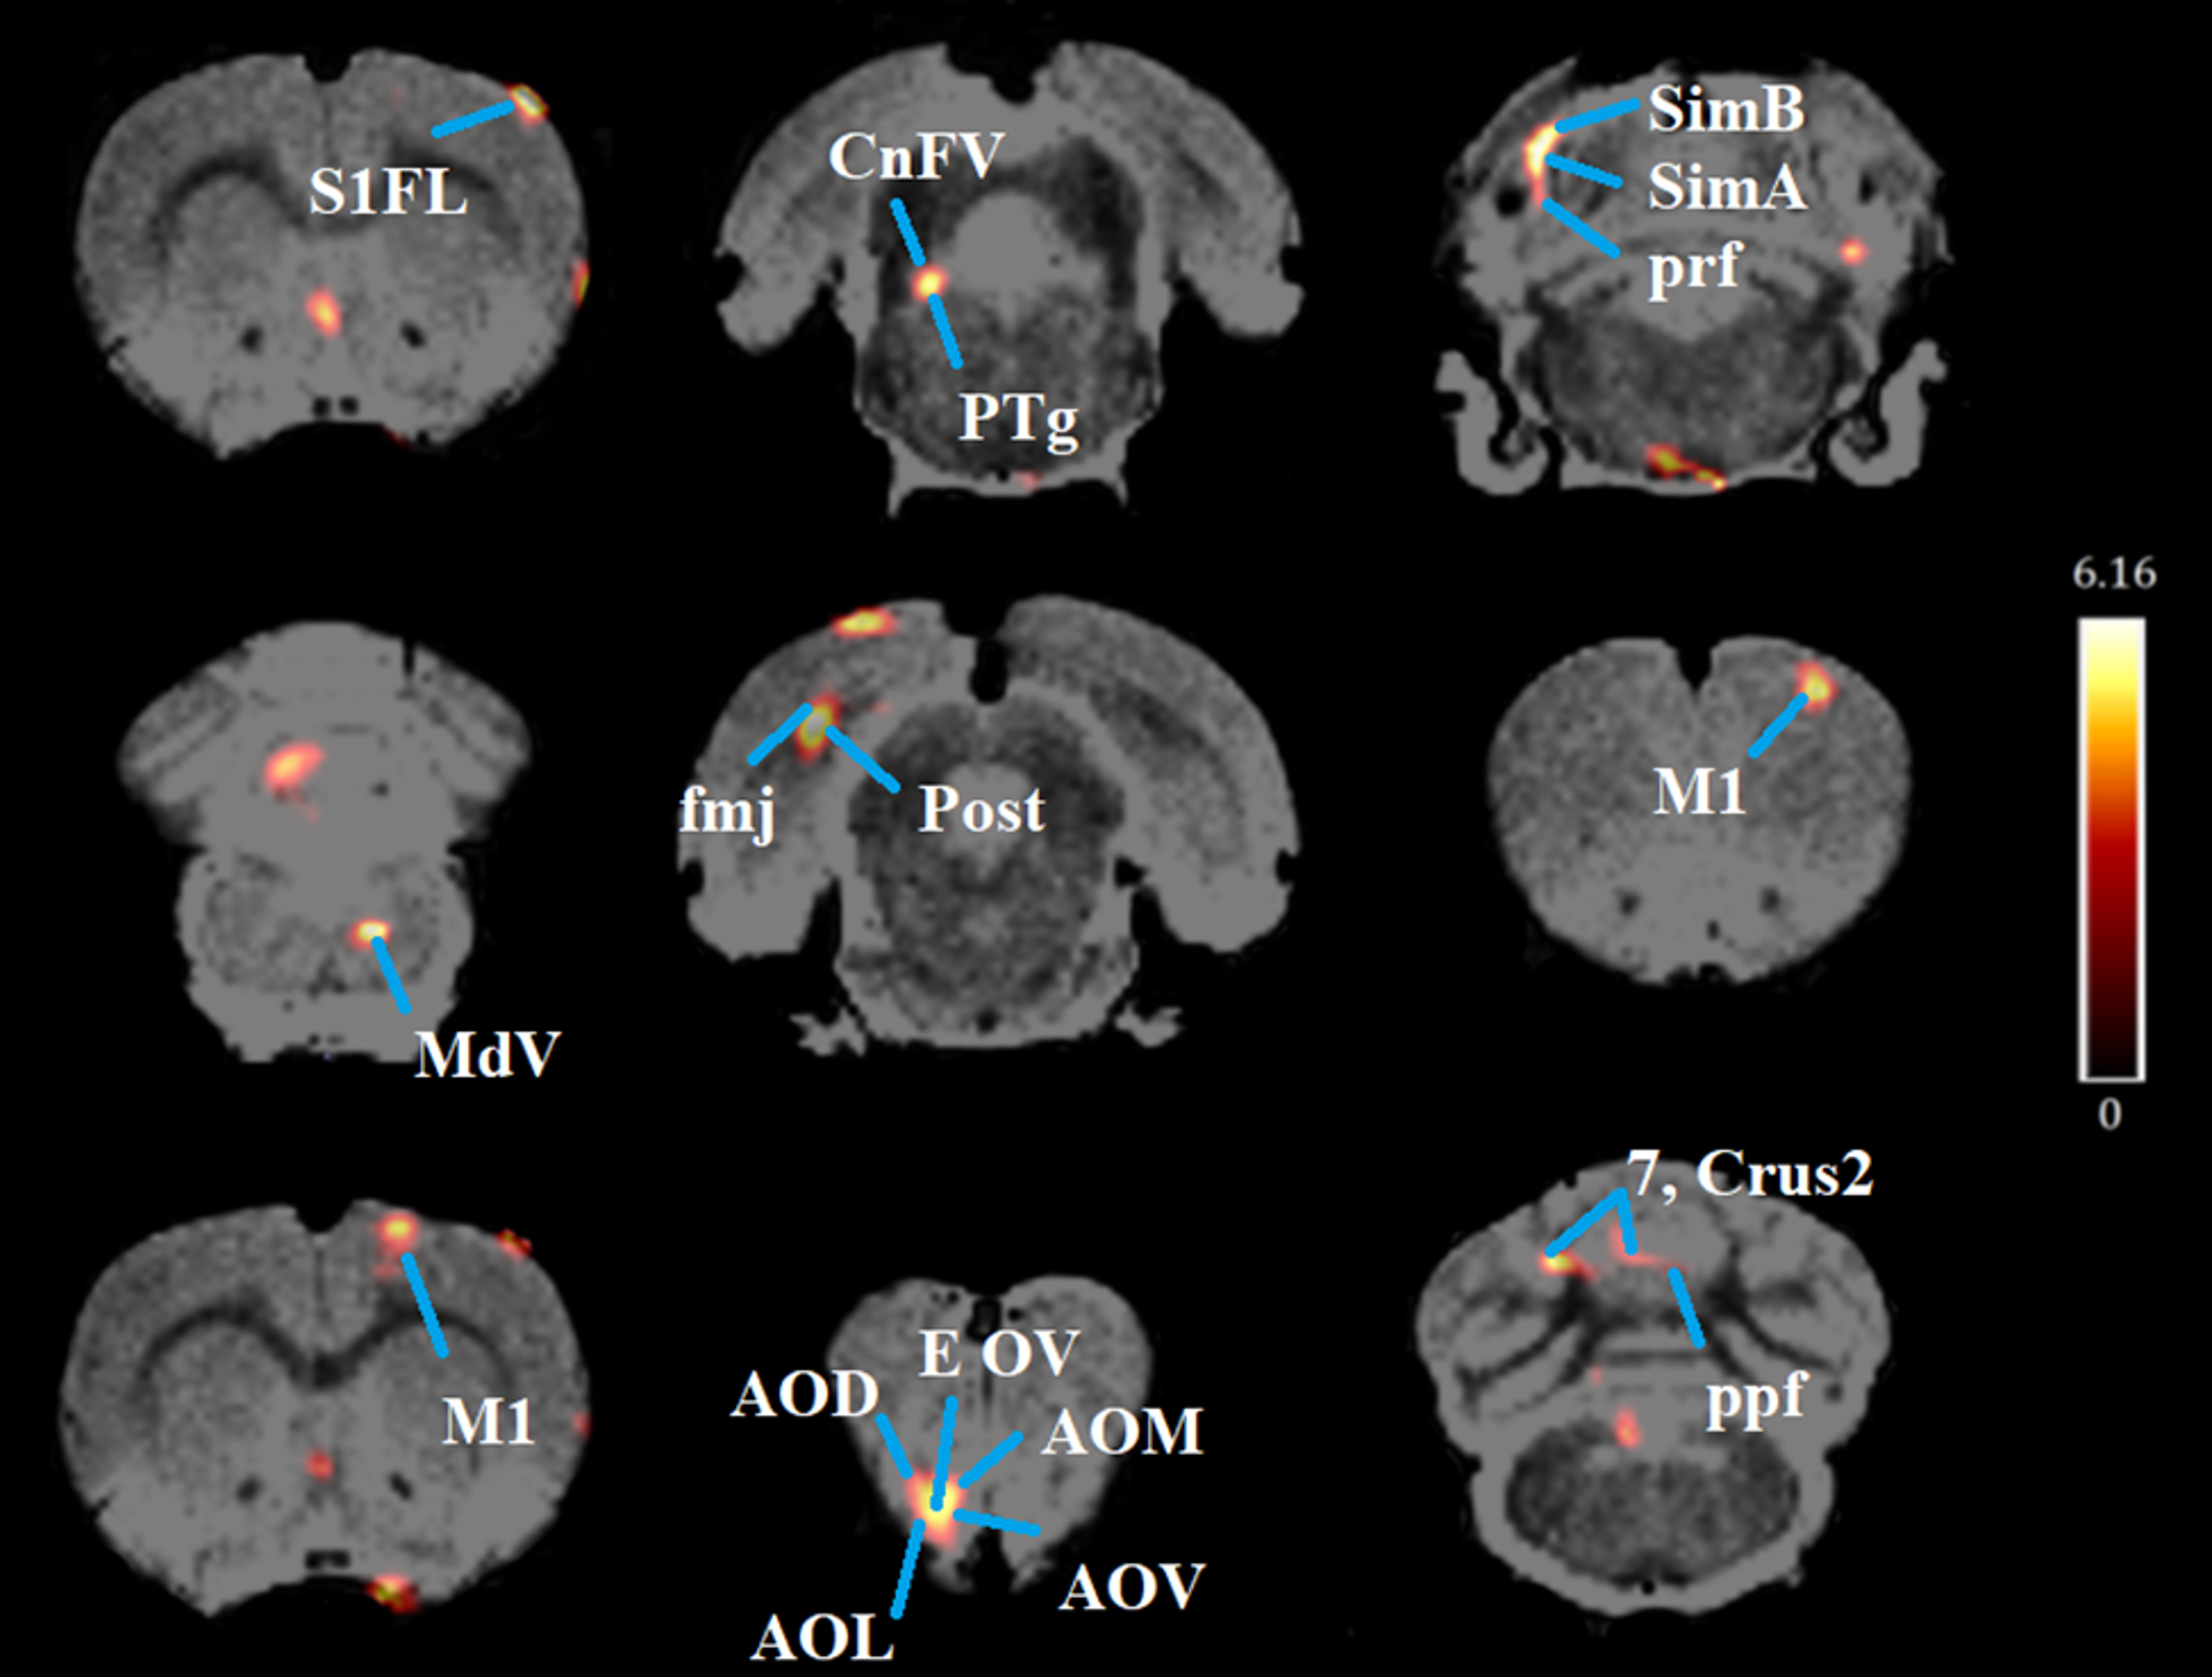
 Fig. 3.
Coronal PET images showing brain regions with significant
(p
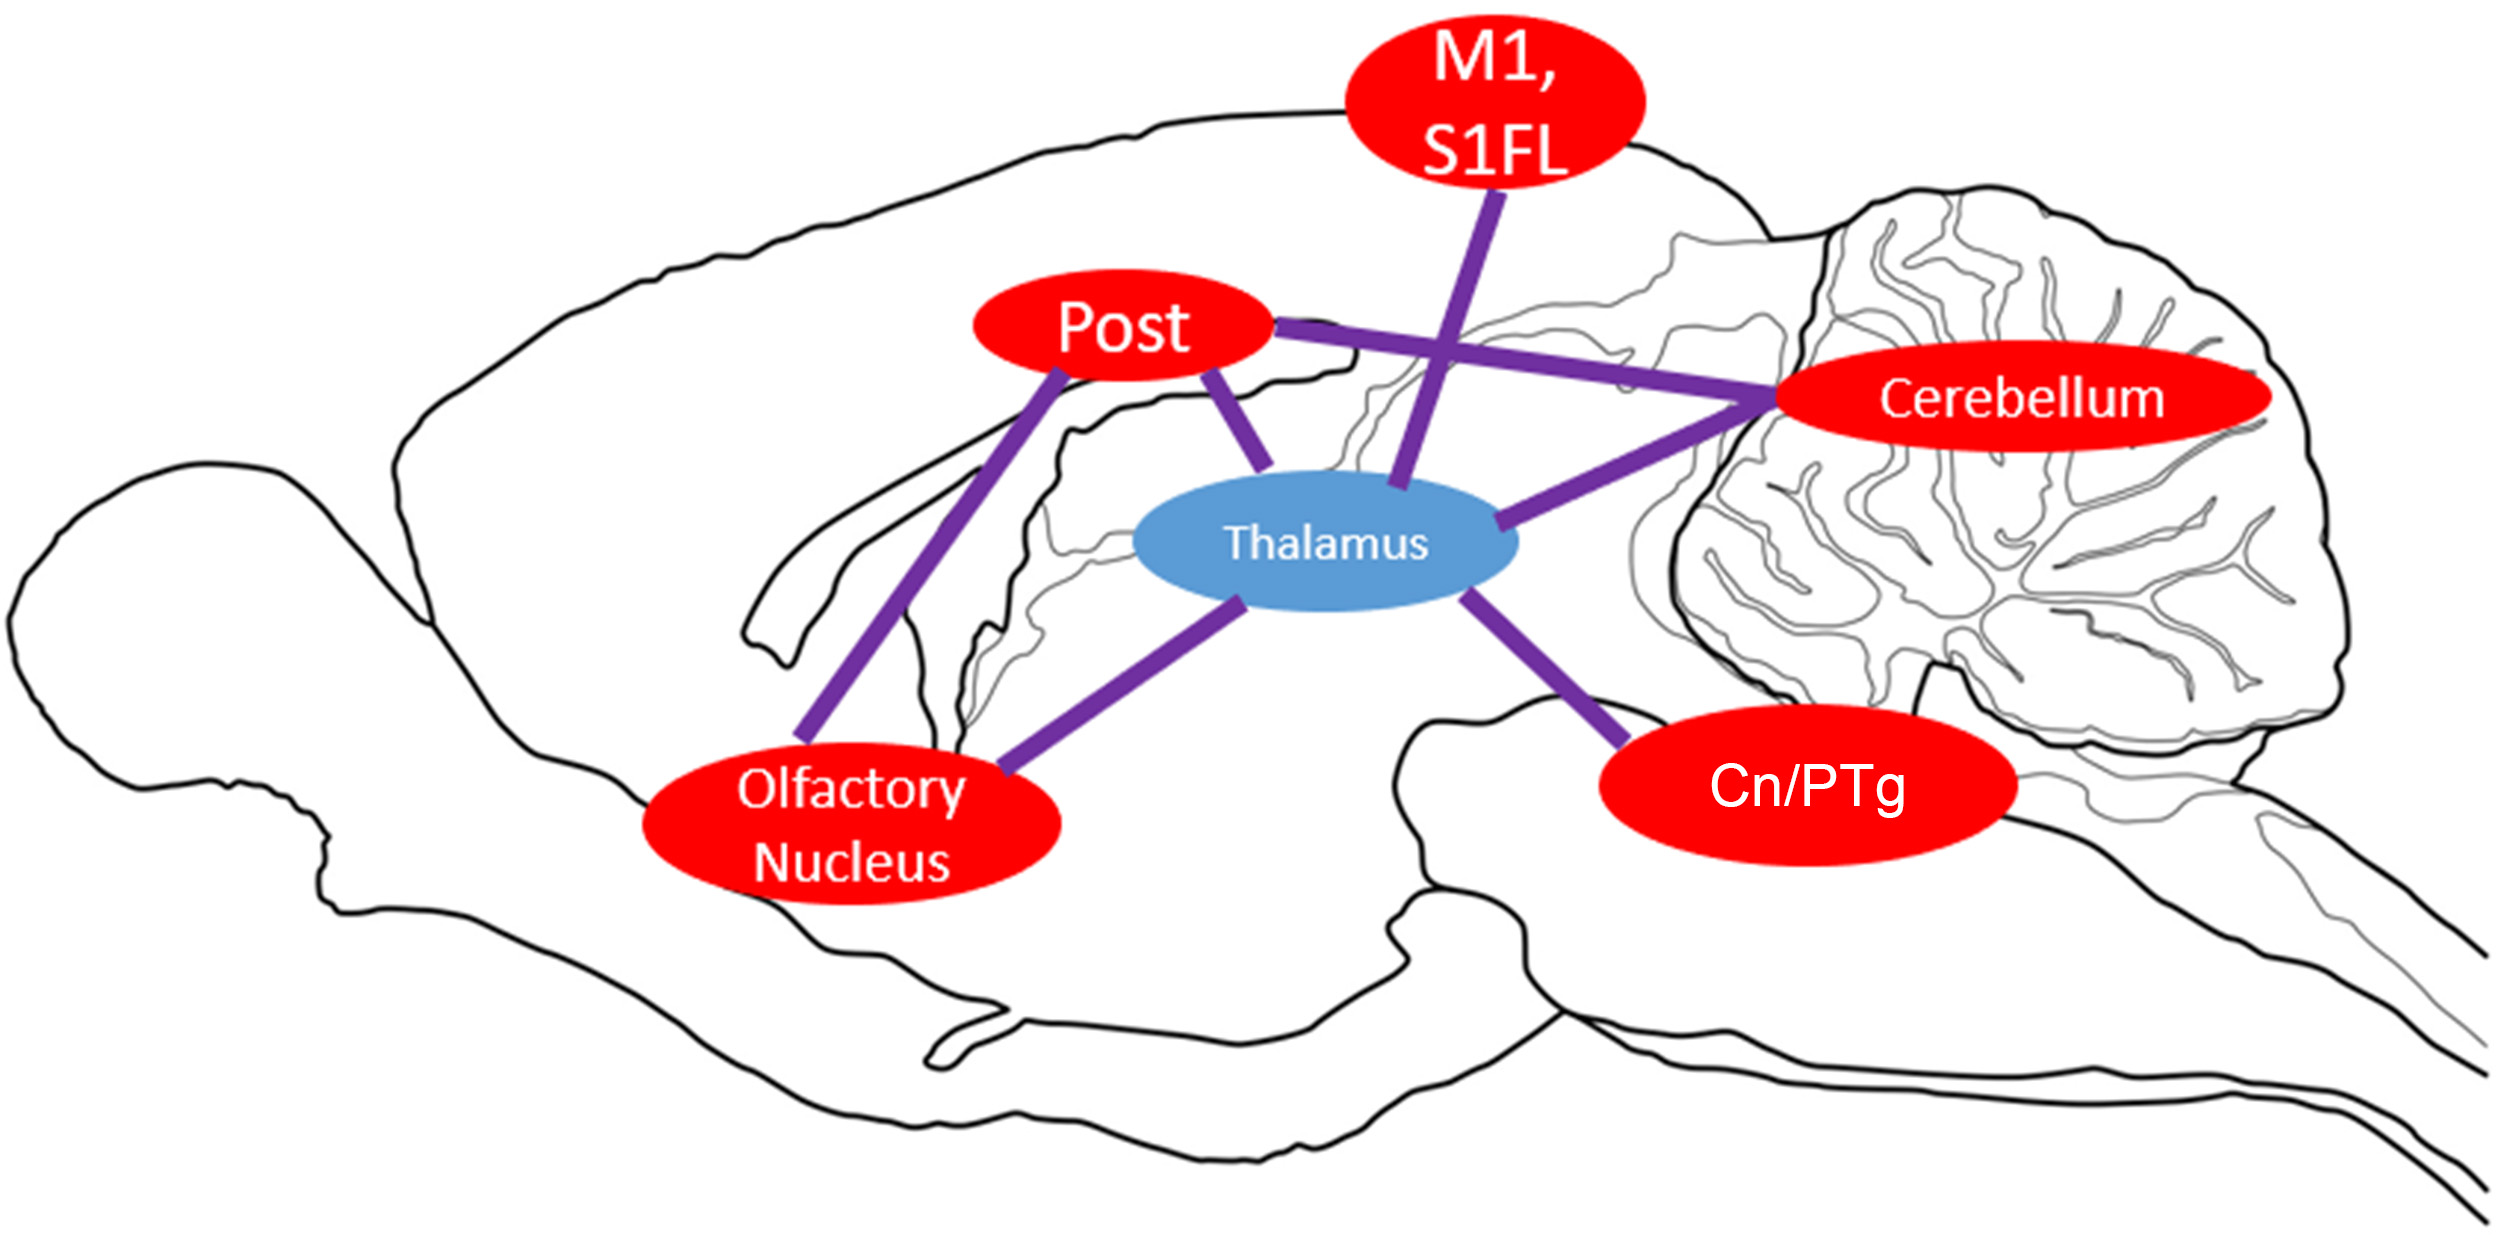
 Fig. 4.
A sagittal brain schematic illustrating the brain circuitry that showed increased BGluM and the connectivity between these regions in response to exercise and social interaction. Cn, cuneiform nucleus.
| Brain region | Cluster Location (General) | Medial-Lateral (mm) | Dorsal-Ventral (mm) | Anterior-Posterior (mm) | t-Value | z-Score | KE |
| Primary somatosensory forelimb region (S1FL) | Somatosensory cortex | 4.4 | 1.6 | 1.2 | 6.16 | 3.88 | 63 |
| Cuneiform nucleus: Cn (FV, FD); pedunculopontine tegmental nucleus: (PTg) | Midbrain, brain stem | –1.8 | 6.4 | –8.2 | 5.81 | 3.76 | 119 |
| Simple lobule A of the cerebellum (SimA), SimB, prf | Cerebellum | –3.6 | 3.2 | –9.6 | 5.5 | 3.65 | 304 |
| Pyramidal tract (py), medial lemniscus (ml), trapezoid body (tz) | Brain stem, hippocampus | 0.6 | 10.8 | –9.6 | 5.22 | 3.55 | 145 |
| Primary motor cortex (M1) | Motor cortex | 2.8 | 2.2 | 3.2 | 5.17 | 3.53 | 228 |
| Medullary reticular nucleus, ventral part (MdV) | Cerebellum | 1 | 8.8 | –14.4 | 5.08 | 3.49 | 83 |
| Post, fmj | Hippocampus | –4 | 3 | –7.6 | 5.02 | 3.47 | 350 |
| Olfactory nucleus (AOD, AOL, AOM) olfactory ventricle (EOV), anterior commissure (aci) | Forebrain | –1.2 | 6.8 | 4.8 | 4.99 | 3.46 | 275 |
| Crus2 of the ansiform lobule (Crus2), ppf, 7th and 8th cerebellar lobules | Cerebellum | –2.4 | 3.2 | –13 | 4.93 | 3.43 | 150 |
| M1 | Motor cortex | 1.6 | 1 | 0 | 4.85 | 3.4 | 863 |
Coordinates in stereotaxic space (medial–lateral, anterior–posterior, and dorsal–ventral) are provided for cluster location. The t-values and z-scores were calculated from the average BGluM of all voxels within the significant clusters. The number of voxels in the significant clusters is noted “KE”, voxel size 0.2 mm isotropic. BGluM, brain glucose metabolism; CnFV, ventral cuneiform nucleus; CnFD, dorsal cuneiform nucleus.
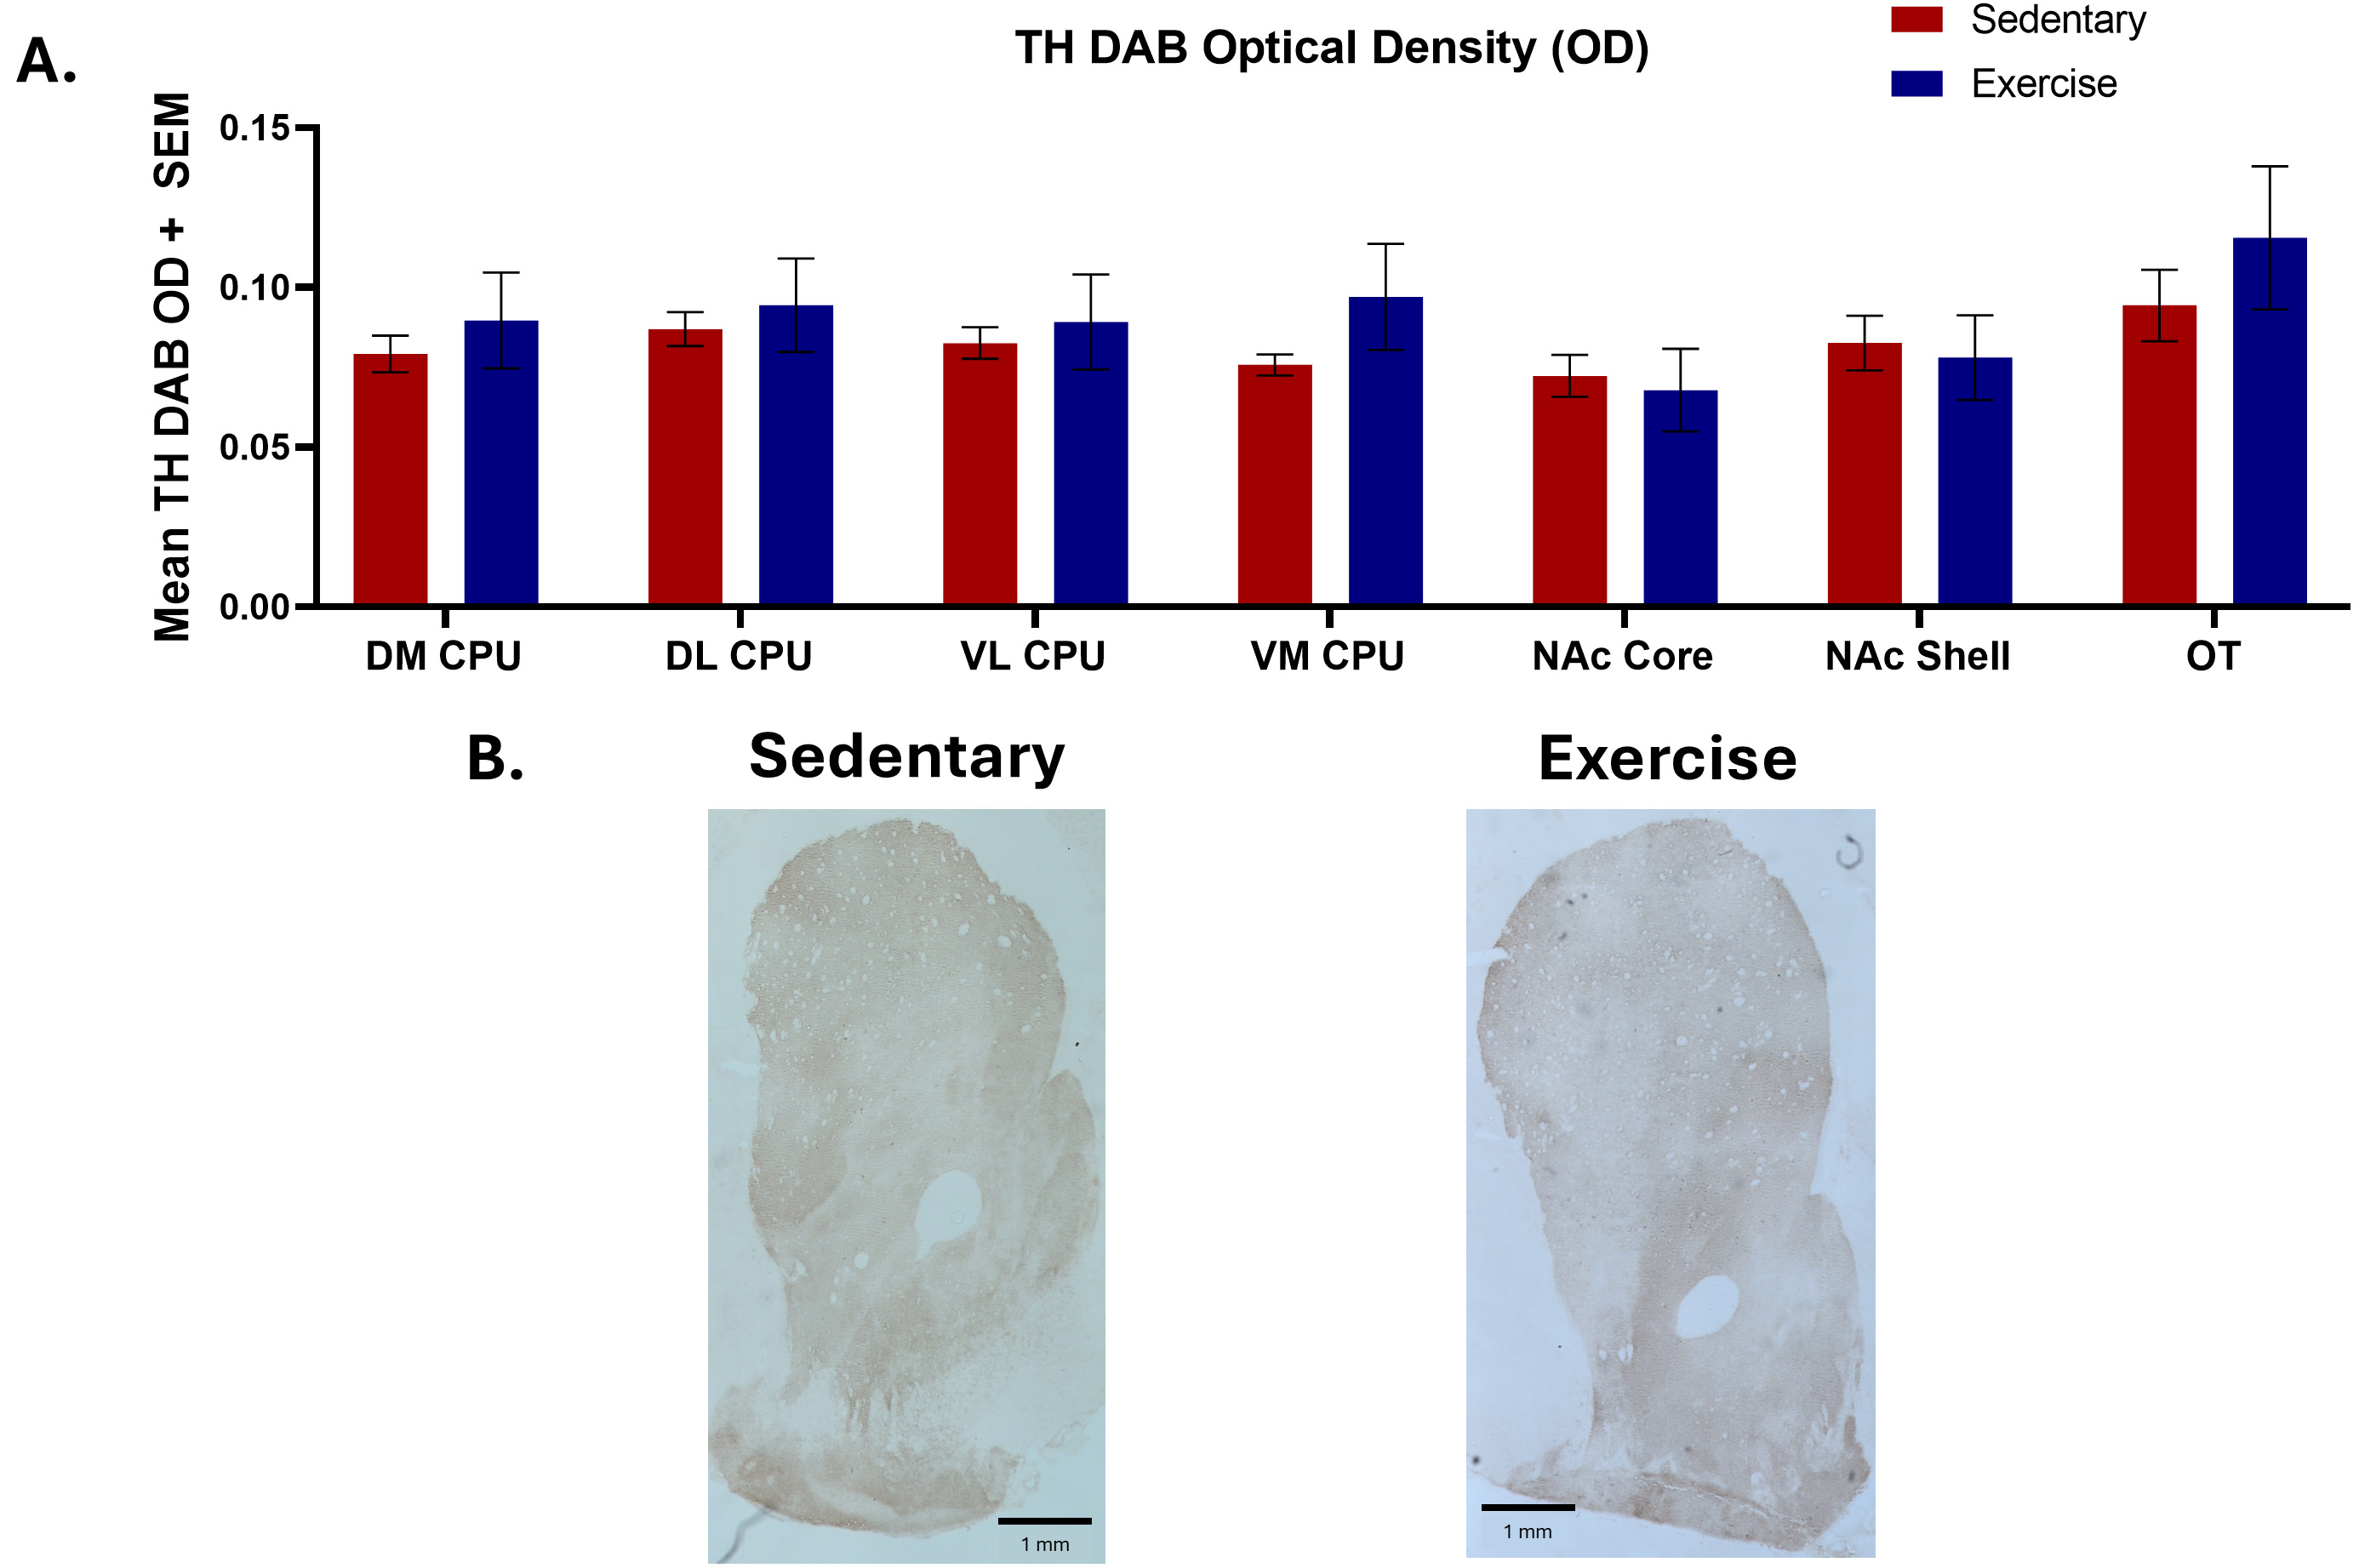
Two-tailed unpaired t-tests found no significant differences in TH IHC between exercise and controls groups across the DM CPU [n = 6 (sedentary), n = 5 (exercise), t = 0.705, p = 0.50], DL CPU [n = 6 (sedentary), n = 5 (exercise), t = 0.513, p = 0.62], VM CPU [n = 6 (sedentary), n = 5 (exercise), t = 1.376, p = 0.20], VL CPU [n = 6 (sedentary), n = 5 (exercise), t = 0.451, p = 0.66], NAc Core [n = 6 (sedentary), n = 5 (exercise), t = 0.328, p = 0.75], NAc Shell [n = 6 (sedentary), n = 5 (exercise), t = 0.290, p = 0.78], and OT [n = 6 (sedentary), n = 5 (exercise), t = 0.843, p = 0.42] (Fig. 5).
 Fig. 5.
Tyrosine hydroxylase immunohistochemistry results comparing
optical density measurements in several brain regions between exercise and
sedentary groups as well as representative images. (A) Two-tailed unpaired
t-tests found no significant differences in mean tyrosine hydroxylase
(TH) DAB Optical Density between exercise (n = 6) and sedentary (n = 5) groups.
Each bar represents the mean
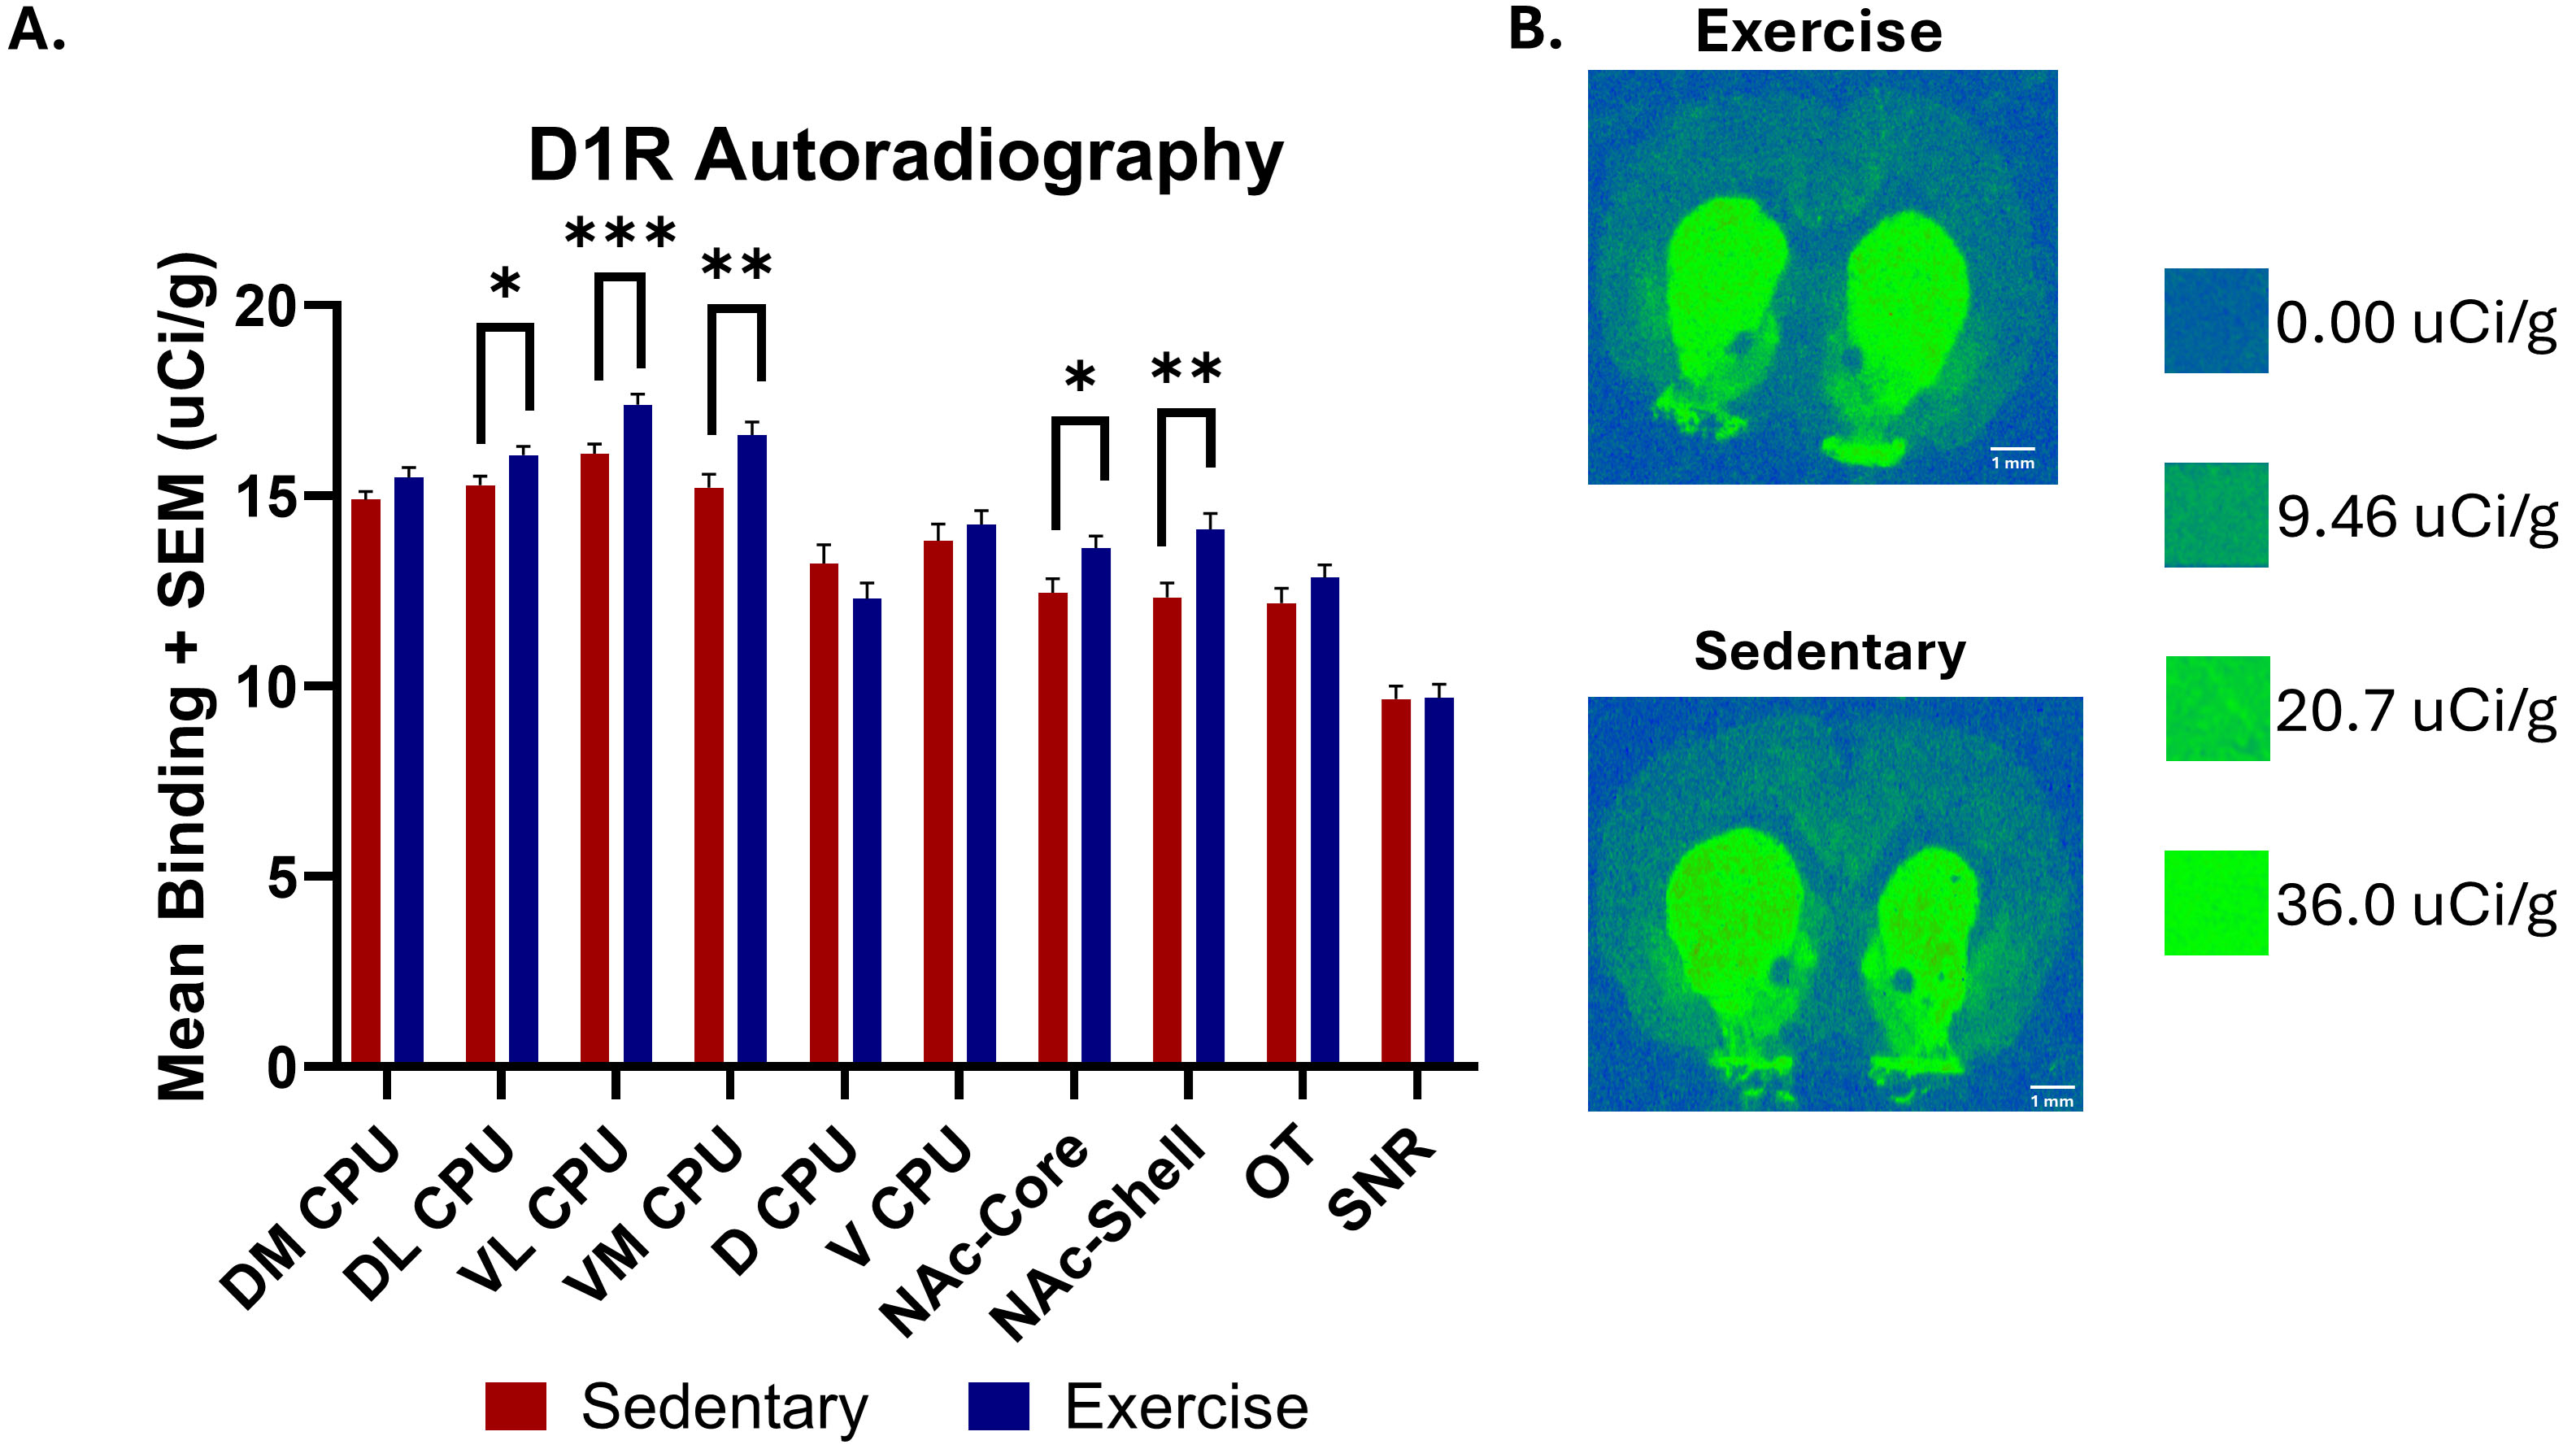
The results of [3H] SCH 23390 D1R binding are shown in Fig. 6. Two-tailed
unpaired t-tests revealed significant increases in D1R autoradiography
binding levels in the exercise group across several brain regions compared to the
control group. These brain regions include the DL CPU [n = 51 (sedentary), n = 52
(exercise), t = 2.341, *p
 Fig. 6.
Dopamine D1 receptor autoradiography comparing [3H] SCH 23390
binding in several brain regions between exercise and sedentary groups as well as
representative images of D1R binding. (A) Two-tailed unpaired t-tests
found a significant increase in [3H] SCH 23390 D1R binding in the exercise group
compared to the control group in the DL CPU [n = 51 (sedentary), n = 52
(exercise), t = 2.341, *p
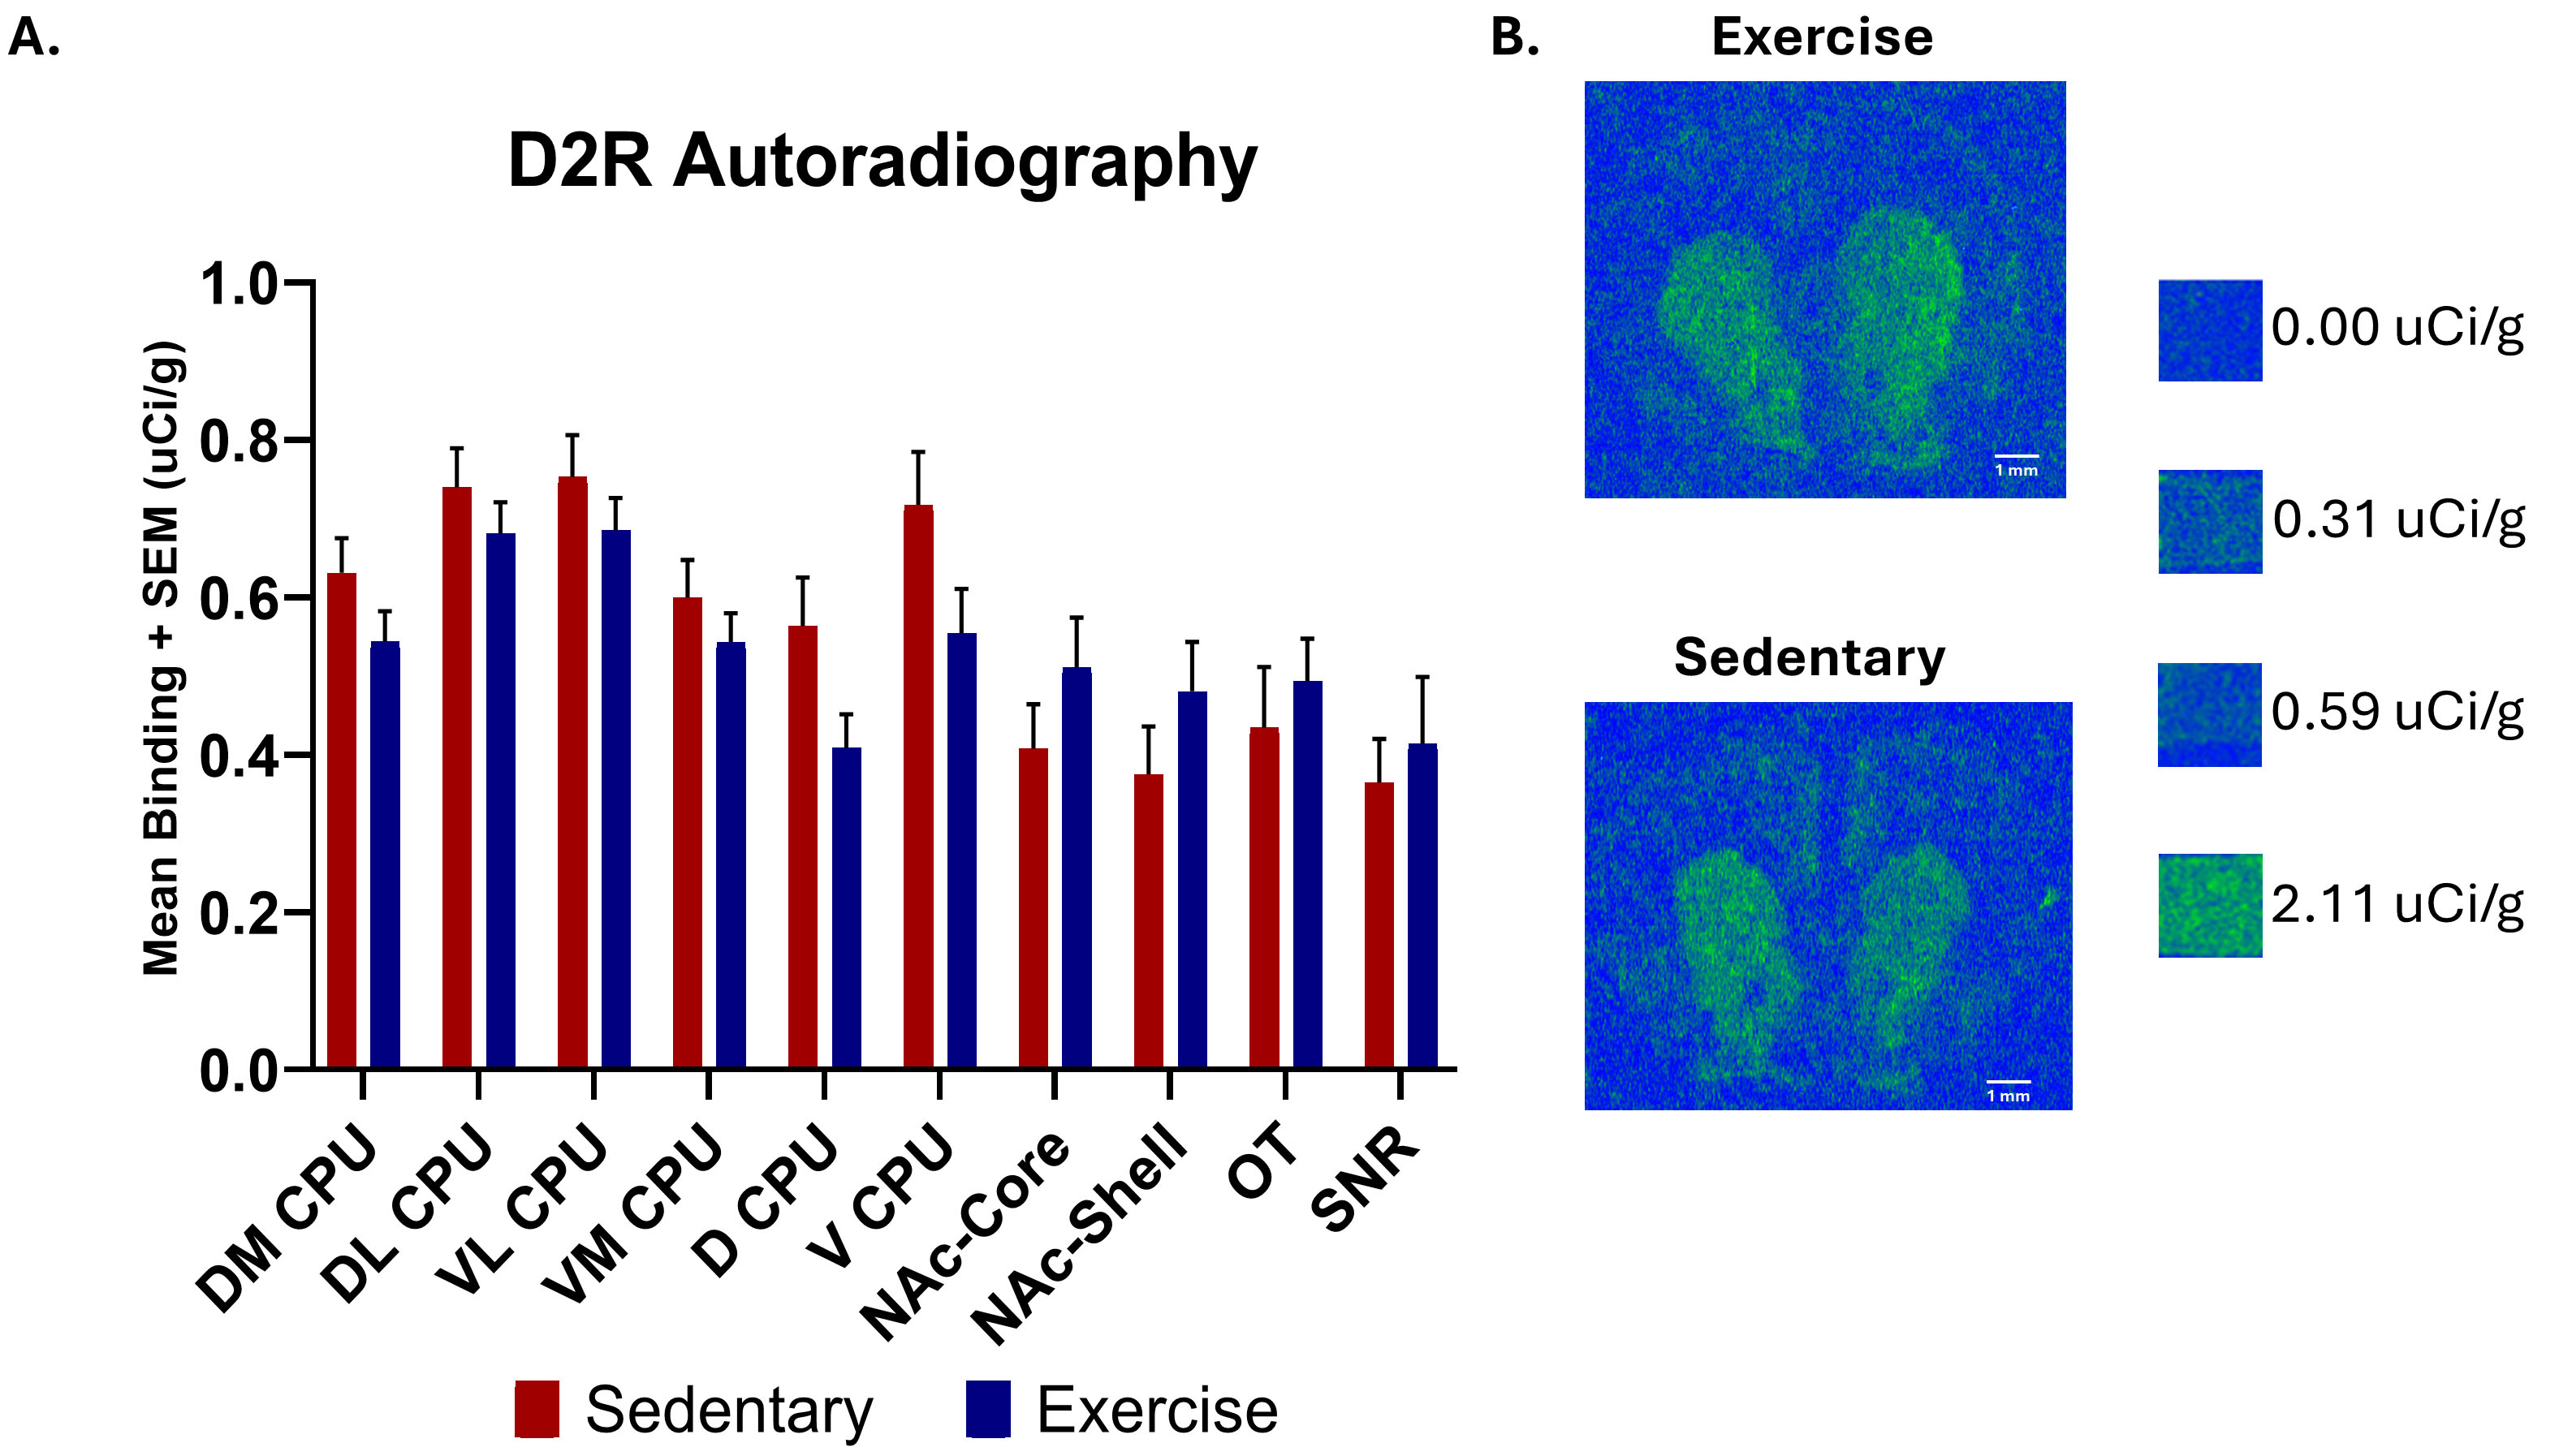
The results of [3H] spiperone D2R binding are shown in Fig. 7. Two-tailed
unpaired t-tests revealed no significant changes in D2R autoradiography
binding levels between the exercise and control groups for any of the brain
regions examined: DM CPU [n = 54 (sedentary), n = 59 (exercise), t = 1.488,
p
 Fig. 7.
Dopamine D2 receptor autoradiography comparing [3H] spiperone binding in several brain regions between exercise and sedentary groups as well as representative images of D2R binding. (A) Two-tailed unpaired t-tests found no significant changes between the exercise and sedentary groups for [3H] spiperone D2R binding. All values presented are average [3H] spiperone D2R binding levels + SEM, with units of µCi/g. (B) Representative images of [3H] spiperone D2R binding distribution in the rat brain for the exercise and sedentary groups. Scale bar: 1 mm.
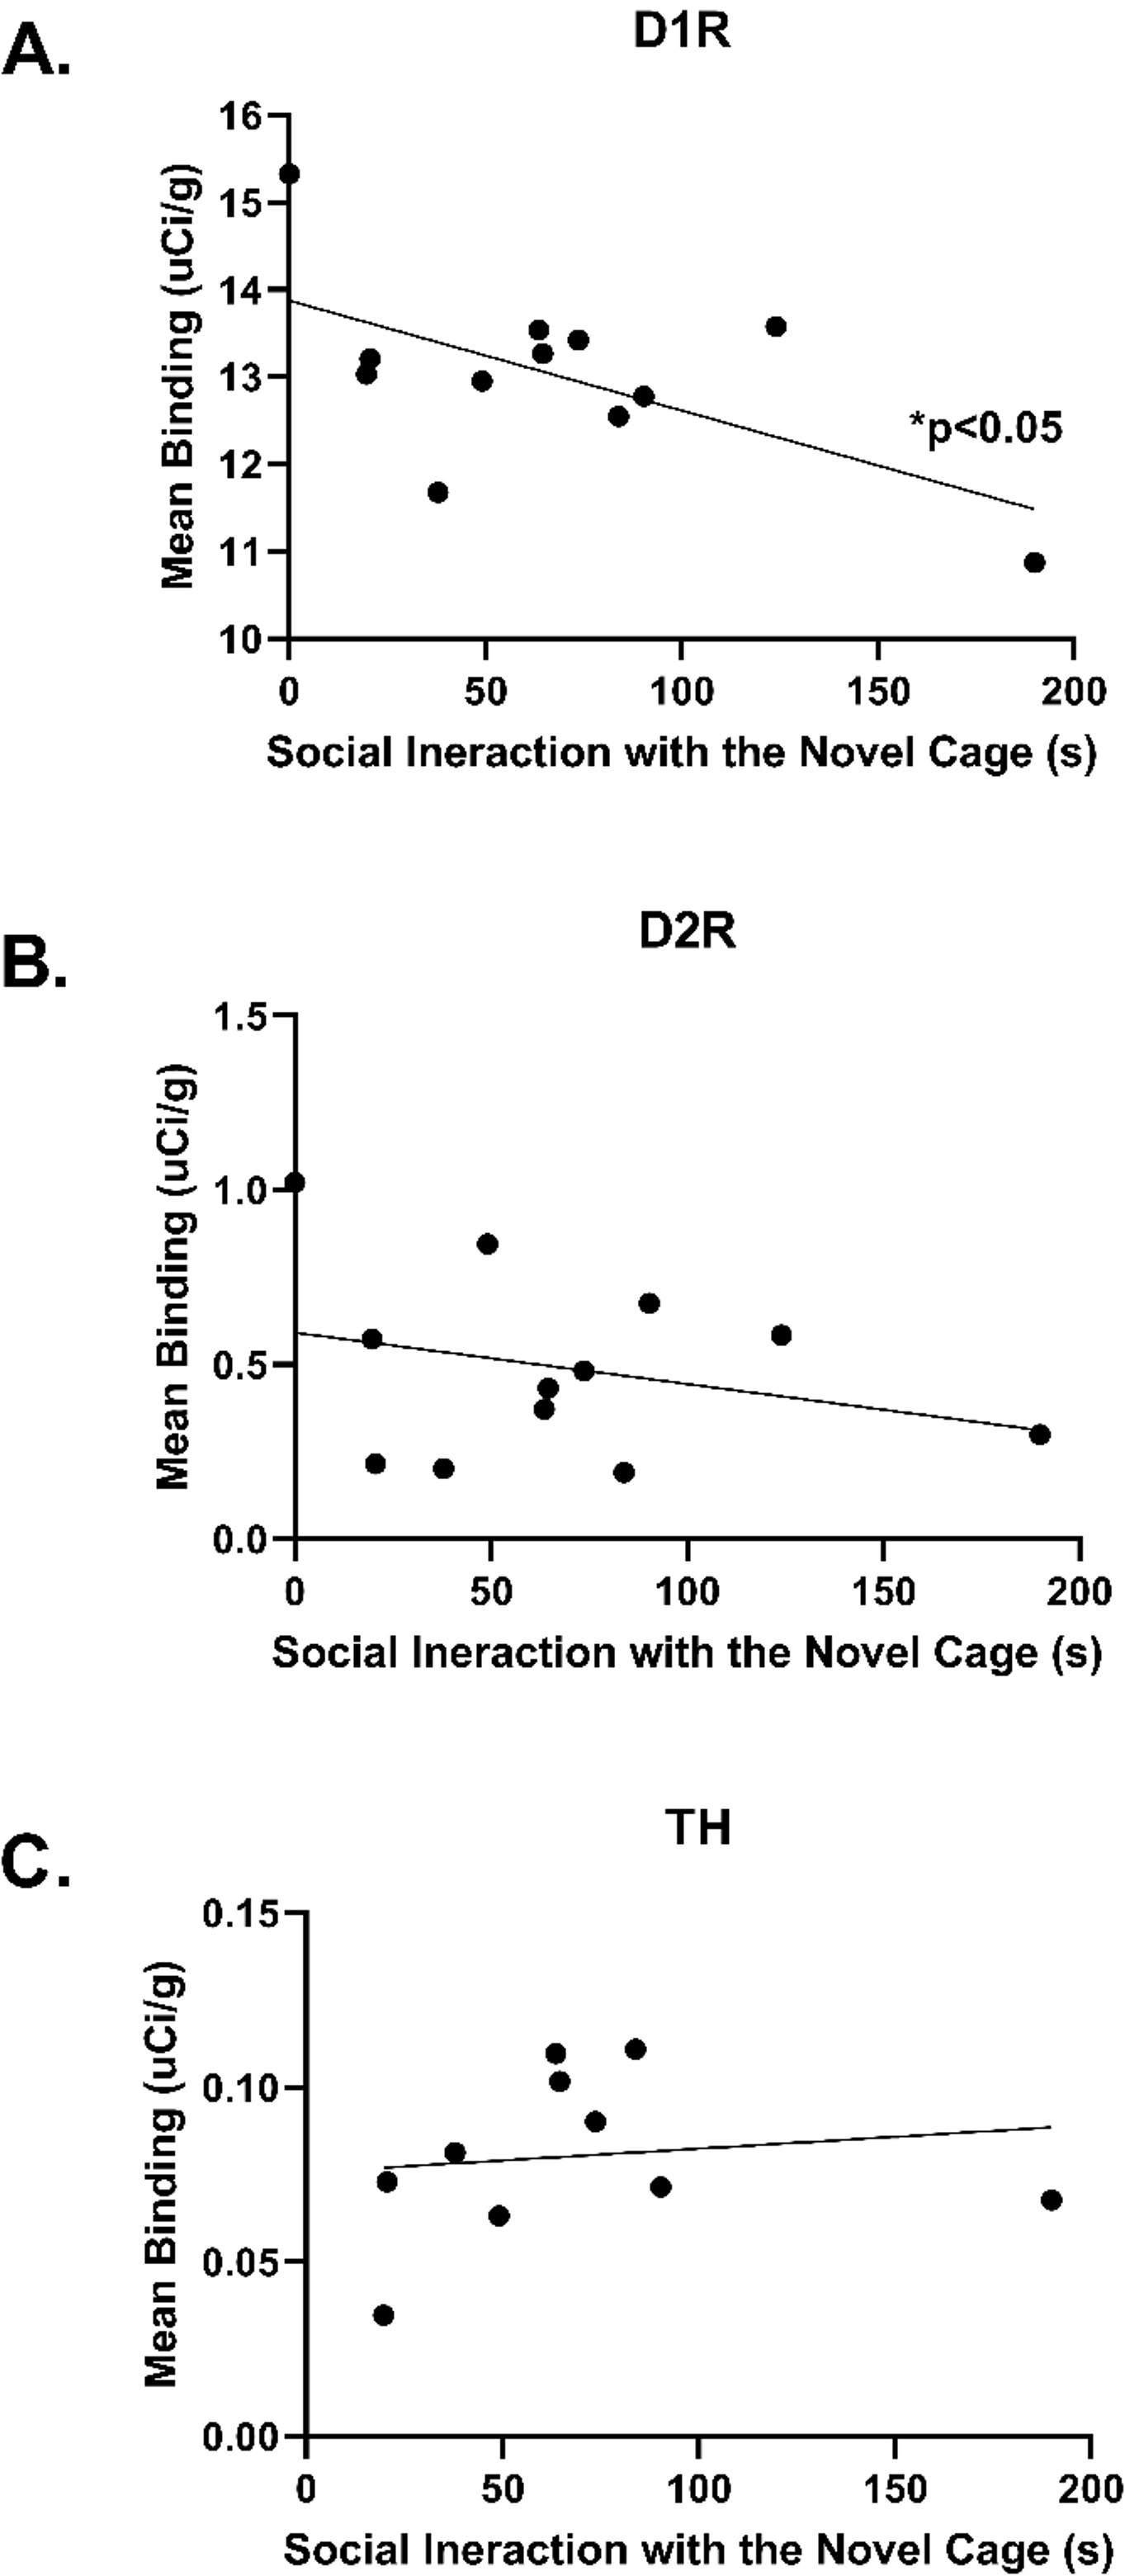
A significant negative correlation between D1R binding and social interaction
was found in the NAc Core [r = –0.601, R2 = 0.362, p
 Fig. 8.
Representations of Pearson correlations correlating mean
autoradiography binding or Immunohistochemistry labeling to social interaction
levels during Crawley’s three-chamber sociability test. (A) A negative
correlation of D1R binding in NAc Core and social interaction [r = –0.601,
R2 = 0.362, p
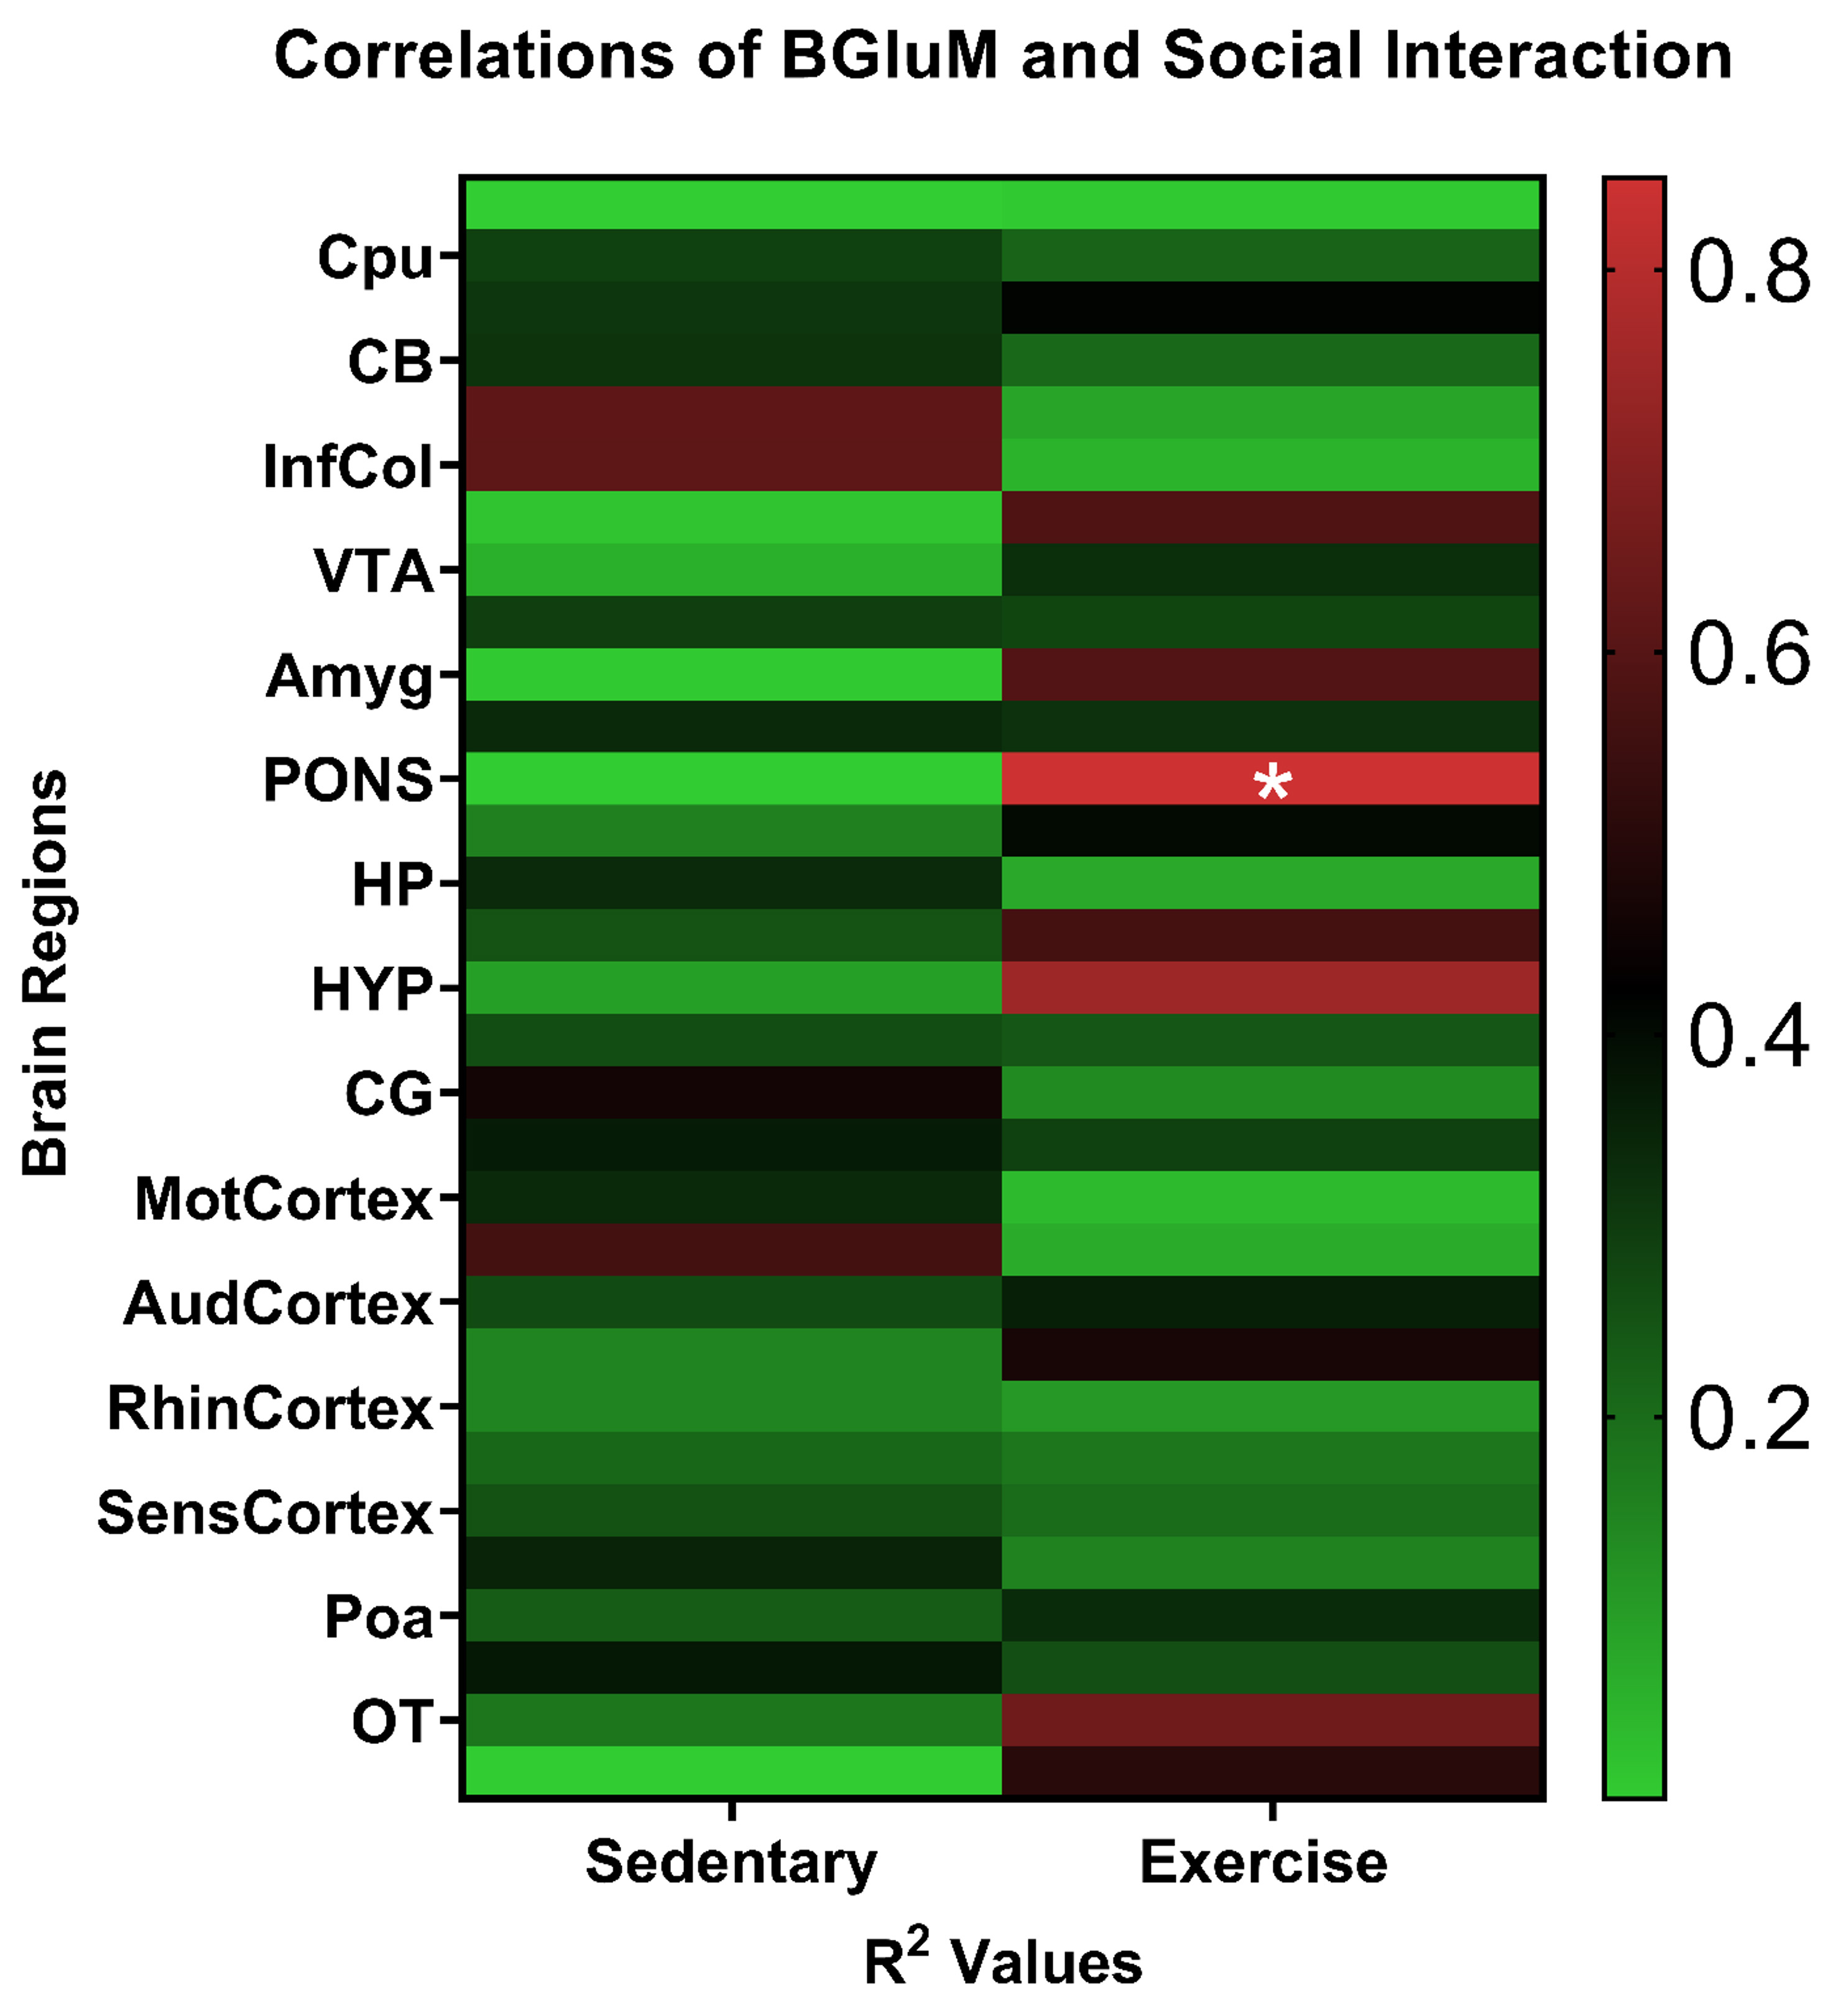
A series of correlation analyses was conducted between social interaction
behavior and BGluM for multiple brain regions (Fig. 9). The analyses found a
significant correlation between social interaction with the novel rat cage and
mean BGluM within the exercise group for the pons [r = –0.769, R2 = 0.592,
p
 Fig. 9.
Schematic representations of Pearson correlations correlating
BGluM levels to social interaction levels during Crawley’s three-chamber
sociability test. There was a significant negative correlation for the pons for
the exercise group [r = –0.769, R2 = 0.592, *p
The present results showed that sedentary rats spent significantly more time interacting with the novel rat age compared to the empty cage and this was consistent with previous research [65, 70]. Sedentary rats have also previously been found to have no significant effect in time spent with a novel rat compared to a toy [71]. In the current study, exercised rats did not show a significant increase in social interaction compared to sedentary controls. Prior research has shown that treadmill exercise mitigated stress-induced impairment of social interaction [71, 72]. Chronic exercise has been shown to reduce defensive social behaviors in rodents, leading to increases in prosocial behavior [73, 74]. These prior findings are important when assessing the present results. One possible reason for the discrepancy between our findings and prior studies may relate to the characteristics of the novel rat. Our novel rats that acted as the social stimulus were approximately 4 months older and typically ~50 g heavier; they were also more socialized as they were used for breeding. Therefore, one interpretation is that exercise treatment attenuated time spent interacting with the social threat of a larger size male rat.
The present PET imaging data also support the above findings and showed a significant activation (increased BGluM) in the cuneiform nucleus (CnF) of the exercised rats, which is a brain region known to be involved in locomotion and defensive response to natural threats [75, 76]. This brain area is also involved in stress-related cardiovascular responses in rats [77]. The CnF has been documented to receive input from the periaqueductal grey area to initiate freezing behaviors, as seen in our behavioral analysis. We speculate that the exercised rats could have a heightened sensory processing, leading them to enhanced perception of the older novel rats as a threat and, therefore, spend less time interacting with them. Further investigation into this phenomenon, including repeated testing, age and sex-matched novel rats, and novel rats that are smaller and younger than the experimental rats is warranted. Previous PET research has found that rats placed into a novel environment experience decreases in BGluM in brain areas associated with motor behavior and increases in areas associated with anxiety, the motor cortex and stria terminalis respectively [66]. While this contradicts prior research that has shown rats prefer novel environments, this is in line with our research finding no significant effect of social interaction when paired with a larger rat that may be treated as a threat [78].
Many publications on exercise and PET confirm a phenomenon referred to as exercise-induced metabolic transience (EIMT) [11, 54, 79]. Presently, we observed EIMT that was consistent with previous findings. Exercise-induced BGluM activation was observed in the Post, a hippocampal subregion that is functionally involved in head direction and cranial orientation [54, 80]. We also see activation of SimA and SimB, cerebellar regions receiving prefrontal and hippocampal inputs for spatial working memory and action decision-making [81]. The connections between the hippocampus and cerebellum can help establish a functional circuitry of exercise. Additionally, EIMT was observed in the Tz of the auditory pathway. This is also consistent with previous findings that reflect post-exercise metabolic activation of the temporal lobes and other auditory processing areas [11, 54]. However, unlike these previous findings by Hanna et al. [11], we did not see any changes in metabolic activity in highly dopaminergic regions of the basal ganglia and striatum.
Both exercise and social interaction may have played a role in observed BGluM increases. The PTG is a brainstem region connected to the striatum and may be involved in arousal, attention, and reward mechanisms as well as movement [82]. Olfactory stimulation included BGluM activation in the AOD, AOL, AOM, and anterior olfactory nucleus, ventral part (AOV). These results could be induced both from EIMT and the introduction of a novel rat. Heightened sensory responses are well documented after exercise. Using the same exercise protocol as this paper, exercise has been shown to increase BGluM in sensorimotor regions in female rats [54]. Exercise has been shown to ameliorate methamphetamine induce olfactory dysfunction in mice [83]. In humans, exercise can improve scores in auditory discrimination tasks and audio-cued labeling [84, 85]. In healthy young adults, acute exercise improves sensorimotor connectivity, which was shown to be sustained after exercise was completed [86]. Exercise can also preserve olfactory functioning in older adults [87].
As stated above, we believe the results of the social interaction test can best be explained by activation of the CnF and the Crus 2. The CnF is functionally involved in locomotion and defensive response to natural threats. Exposure to predator’s odor upregulates c-fos expression in this area, and previous research shows a strong correlation of c-foes signaling with BGluM and FDG PET signaling [15]. The CnF also shares connection and function with the periaqueductal gray matter area [75, 76]. It is possible that EIMT aided the ability to elicit a defensive response via olfactory sensory processing. The CnF also has shown involvement in stress-related cardiovascular responses in rats [77]. Lastly, a meta-analysis of emotional-social related fMRI tasks showed that the Crus2 is essential in the learning of social action [88].
The present study found that moderate-intensity aerobic exercise (MIAE) did not produce significant changes in TH levels across brain regions. Previous research on the effect of exercise on TH levels is largely mixed. While several studies have reported exercise induced increases in TH levels, these findings were primarily observed in diseased rodent models such as those with Parkinson’s Disease or attention-deficit/hyperactivity disorder (ADHD), where baseline TH levels were deficient [48, 51, 52, 53]. In contrast, analyses of healthy rodent models have generally shown that exercise does not significantly increase TH levels [42]. Furthermore, research directly comparing the effect of exercise on a healthy control versus a diseased Parkinsonian group found only significant modulation of TH, dopamine, and neurotrophic factors in the diseased group [53]. Our findings further support a previously described phenomenon suggesting an upper limit to neurotrophic and dopamine modulation. Healthy rats, already at neurochemical homeostasis, are much closer to an upper limit than rats of a diseased model with significantly impaired baseline dopamine signaling [42]. Therefore, healthy rodent models may not exhibit significant positive dopaminergic modulation when diseased models would because the increase from deficit to the upper limit in diseased models is much larger than the increase from homeostasis to the upper limit in healthy models.
D2R levels have been associated with the regulation of both active and passive defensive behaviors [89, 90, 91]. These findings support the role of D2R as of the primary mediators of defensive behavior, as reflected in our study through freezing behavior observed in Crawley’s three-chamber sociability test. However, we did not reveal any significant differences in D2R binding levels between the exercise and control groups. This is dissimilar from other research conducted that has found D2R levels to be significantly affected by exercise [35, 38, 39, 40, 41, 42]. Robison et al. [35] found that D2R binding levels were significantly increased in exercised rats. However, one reason for this difference in D2R may be due to the age differences between the animals at the time of euthanasia as the rats in this study were approximately two months older than those in the Robison study at the time of euthanasia. There is longitudinal evidence for individual and region-specific differences of dopamine receptor D2 (DRD2) decline in older age and support for the hypothesis that social and even cerebrovascular factors are linked to age-related dopaminergic decline [92]. Tyler et al. [42] found significant increases in D2R binding in the NAc Shell. However, this previous research was conducted using a High Intensity Interval Training (HIIT) protocol, which differs from the MIAE protocol used in this study. Current literature suggests that D2R are a mediator of defensive behavior; however, evidence on D1R suggests a positive correlation with social behavior.
D1R have been correlated to social conformity and food seeking but inversely correlated to aggression [93, 94]. Interestingly, our study identified increased D1R binding levels in several brain regions, including the DL CPU, VL CPU, VM CPU, NAc Core, and NAc Shell. Previous research on D1R binding is largely mixed with reports of insignificant following a HIIT protocol [42] and decreased D1R binding [35] following the same MIAE exercise regimen.
Changes in brain metabolic activity have been associated with changes in dopamine levels. The degradation of dopaminergic neurons is a hallmark of Parkinson’s disease, contributing to widespread disruptions in brain function. In parkinsonian rats, dopamine depletion alters brain metabolic connectivity, particularly in animals undergoing treadmill exercise [95]. FDG PET scans show that dopamine depletion via a chemical abbreviation for 6 hyrdoxy dopamine lesioning leads to differences in brain metabolic activity compared to scans completed pre-lesioning in exercised rats. Compared to pre-lesion scans, post-lesion scans showed region-specific increases and decreases in brain activity.
Increases in brain activity were seen in the thalamus and several regions of the striatum, while decreases were noted in the ipsilesional striatum [95]. This study measured brain activity levels in rats before and after treatment with a dopamine selective neurotoxin inducing Parkinsons disease like behavior, not directly testing dopamine signaling in response to exercise as was done in the current study. The rats used were also much older than those used in the current study and included males and females, whereas only males were used in the current study. We also did not induce disease as was done in Endepols et al. [95]. While we also found that exercised rats showed increases in BGluM and D1R levels, the increases were not found to overlap in any brain regions within our study. The observed increases in D1R levels were observed within brain regions of the striatum, while the increases in BGluM were located in regions of the brain stem, cerebellum, forebrain, hippocampus, motor cortex, and somatosensory cortex.
Overall, it is well established that dopamine plays an important role in cognitive performance, aging, reward motivation and neurodegenerative disease. A better understanding of how exercise can modulate this dopamine–cognition link is needed including effects on synaptic dopamine levels as well as receptor levels of D1–D5 following chronic exercise procedures. The neurobiological mechanism is unclear as are the precise exercise interventions to slow down this cognitive/behavioral decline. Furthermore, exercise largely is being described as a binary factor (exercise vs sedentary) and not using a dose response model. Such a dose response model of exercise would seek to dissect exercise type, intensity, duration, frequency etc. along with a quantitative assessment of sedentary behavior and sleep. This precision approach of exercise in medicine in future studies will be very valuable in better understanding exercise interventions aiming to improve cognitive function.
The present study showed a significant negative correlation between time spent with a social threat stimulus and D1R binding in the NAc Core. Prior research has found that the involvement of D1R signaling in social behavior is supported by findings showing that the infusion of a D1R antagonist into the NAc attenuated the pro-social effects of ventral tegmental area (VTA)-dopamine neuron stimulation, suggesting that dopamine signaling through D1 receptors in the NAc is critical for mediating increases in social behavior elicited by VTA stimulation [96]. However, the present study did not use a pharmacological approach inhibiting D1R levels. In contrast, the present study performed a quantitative assessment of absolute D1R levels. In contrast to our D1R findings, there was no significant correlation between D2R levels and time spent with a social threat stimulus. Previous research has shown that deletion of the D2R in mice is correlated to an increase in social behavior [97]. However, these findings were derived from a longitudinal study conducted over six days, and did not use the same methodology (Crawley’s three-chamber sociability test) employed in the present study. Other methodological differences also may explain the differences in results (the D2 ligand used, genetic knockout model versus wild type). Correlation of social interaction and Tyrosine Hydroxylase levels found no significant results. Previous research analyzed this potential link in the Balb/c and C57BL/6 strains through chronic treatment of mice with BC19, a noreburnamine previously known as RU24722. Cambon et al. [98] found a significant link between aggressive behavior during social interaction and TH modulation. In ADHD rodent models, rats that underwent treadmill exercise exhibited enhanced TH expression and decreased hyper-social behaviors [48]. However, it is important to note that neither of these studies utilized healthy rodent models. This distinction could explain our lack of significant effect as previously explained due to an upper limit phenomenon. Research investigating this correlation in healthy models remains scarce and further research is warranted.
Significance was found within the exercise group when correlating social interaction with BGluM for the pons. The pons is a brainstem structure connecting the medulla to the midbrain. The pons innervates functions including breath control, coordination of muscle movement, and equilibrium [99]. The brainstem has been shown to play a critical role in autism spectrum disorder (ASD) with symptomatology specifically ascribed to hypoplasia of the pons [100]. Additionally, brain areas closely connected to the pons, notably the amygdala, are directly affected both structurally and functionally by microstructural abnormalities in the pons [100]. These findings paired with our correlation highlight a potential connection between the pons and social interaction or in the case of ASD, social communication deficits. Through the locus coeruleus-noradrenaline (NA) system, the pons is also associated with arousal, attention, and decision-making, all involved processes of social interaction [101]. More research is needed to understand the link between social interaction and the pons.
Exercise significantly increased D1R binding in the rodent brain without a significant effect on social response. However, D1R binding levels were found to negatively correlate with social interaction. These results suggest that exercise may not have a pro-social effect in some situations, especially in response to an older, larger male rat that would be considered a social threat. This finding could have important implications of the potential of Exercise in response to social behavior and may attenuate social behavior towards a social threat or socially inappropriate behavior. Exercise can induce metabolic transience that may assist rats in detecting odors from larger predatory animals. Further investigation into this phenomenon, including repeated testing, is warranted. This includes testing with age and sex-matched novel rats and novel rats that are smaller and younger than the experimental rats. Future studies could look at repeated social interaction measures.
Data and materials are available on request.
CH and PT designed the research study. MB, CH, JT, PM, HL, APO, KB, DB, KL, IE, API, MG and PT performed the research, analyzed the data, and contributed to the writing of the manuscript. All authors read and approved the final manuscript. All authors have participated sufficiently in the work and agreed to be accountable for all aspects of the work.
This study was approved by the State University of New York at Buffalo Institutional Animal Care and Use Committee and conducted in accordance with all institutional requirements (IACUC # RIA13095Y). The University at Buffalo Institutional Animal Care and Use Committee approved all experimental procedures in accordance with the National Academy of Sciences Guide for the Care and Use of Laboratory Animals (1996).
Not applicable.
This research was supported by the New York State Research Foundation (RIAQ0940) and the Mark Diamond Research Fund (SU-22-03).
The authors have no conflicts of interest.
References
Publisher’s Note: IMR Press stays neutral with regard to jurisdictional claims in published maps and institutional affiliations.