


 , Xi Tan 3, Guozhi Tang 1,2, Yue Che 1,2, Shirui Song 1,2
1 School of Automation and Information Engineering, Sichuan University of Science and Engineering, 643002 Zigong, Sichuan, China
2 Artificial Intelligence Key Laboratory of Sichuan Province, 644000 Yibin, Sichuan, China
3 Zigong Institute of Brain Science, Zigong Mental Health Center, The Zigong Affiliated Hospital of Southwest Medical University, 643020 Zigong, Sichuan, China
Abstract
Schizophrenia (SCZ) is associated with abnormal neural activities and brain connectivity. Electroencephalography (EEG) microstate is a voltage topographical representation of temporary brain network activations. Most research on EEG microstates in SCZ has focused on differences between patients and healthy controls (HC). However, changes in EEG microstates among SCZ patients across various stages of physiological and cognitive development have not been thoroughly assessed. Consequently, we stratified patients with SCZ into four age-specific cohorts (20–29 years (brain maturation), 30–39 years (stabilization), 40–49 years (early aging), and 50–59 years (advanced aging)) to evaluate EEG microstate alterations. Additionally, we assessed changes in EEG microstates in first-episode psychosis (FEP) before and after an 8-week treatment period.
We acquired 19-channel resting-state EEG from 140 chronic SCZ patients, aged 20 to 59 years, as well as from 19 FEP and 20 healthy controls. FEP patients underwent an 8-week inpatient follow-up. After pre-processing, EEG data from different groups were subjected to microstate analysis, and the K-Means clustering algorithm was applied to classify the data into 4 microstates. Subsequently, templates of these microstates were used to fit EEG signals from each patient, and the collected microstate parameters were analyzed.
Patients with SCZ aged 20 to 29 years demonstrated an increased time coverage of microstate class D compared to other age cohorts. In individuals aged 30–39 years, the parameters of microstate class B—specifically time coverage and occurrence—exhibited significant reductions relative to those in the 40–49 and 50–59 years age groups. Compared to healthy controls, microstates class A parameters were significantly reduced in SCZ patients, while microstates class C parameters were prolonged; after 8 weeks of treatment, microstates class A parameters increased and microstates class C parameters decreased.
Alterations in microstate dynamics were observed among SCZ patients across developmental stages, suggesting potential changes in brain activity patterns. Changes in microstates A and C may serve as potential biomarkers for evaluating treatment efficacy, establishing a foundation for personalized therapeutic approaches.
Keywords
- EEG microstates
- schizophrenia
- resting state networks
- medication
- aging
Schizophrenia (SCZ) has been shown by the World Health Organization to be a critical mental disorder that affects approximately 24 million individuals worldwide. SCZ has a multifaceted etiology, with complex pathogenesis, involving a confluence of factors, including genetic predispositions, environmental influences, and neurobiological mechanisms. However, no single or definitive pathogenic factor has been identified to date [1]. Patients typically present with profound cognitive, affective, mnemonic, and perceptual impairments, imposing a significant burden on both the individual and their family. This poses a formidable challenge to public health and social resources [2]. In recent years, a study have indicated that the Electroencephalography (EEG) signals of patients with SCZ may contain the key pathological features of the disease [3]. EEG effectively captures the functional state of neurons by recording electrical signals from the cerebral cortex as a non-invasive method for assessing cerebral activity. While the spatial resolution of EEG does not match that of functional magnetic resonance imaging (fMRI), it offers ms-level temporal precision, thereby compensating for the limitations of fMRI in temporal resolution. Consequently, EEG has been extensively used in the diagnosis of Alzheimer’s disease [4], Parkinson’s [5], SCZ [6], and other psychiatric disorders [7, 8], presenting critical insights for examining the neurobiological markers associated with the etiology, diagnosis, and treatment.
EEG microstate analysis increasingly emerged as a pivotal tool for exploring altered brain activity patterns in SCZ, which is characterized by its high temporal and ability to capture transient brain states. It provides insights into the potential neural dynamics associated with the disorder. Microstates are defined as brief, stable topographical patterns of scalp electrical activity that represent the brain’s instantaneous functional state. These topographies, derived from multichannel EEG recordings, remain stable for approximately 60 to 120 milliseconds before transitioning into a new topographical configuration. EEG microstate analysis captures transient brain states by decomposing intricate EEG signals into a sequence of these spatiotemporal patterns, reflecting distributed neural network activity [9]. At present, the principal categories of microstates have been delineated into four predominant classes: A, B, C, and D. Diverse microstates are linked to distinct neurocognitive processes. Thus, these states must be analyzed comprehensively to elucidate the underlying pathological mechanisms of SCZ [7]. Although a study has suggested functional interpretations of EEG microstates, their exact roles remain ambiguous. This study proposes [10] that Class A microstates are associated with visual information processing, while Class B microstates may relate to auditory and language functions. Additionally, Class C microstates have been hypothesized to reflect processes linked to emotion regulation and internal cognition, while Class D microstates may be involved in attention and cognitive control. Patients with SCZ exhibit marked abnormalities in the dynamic characteristics of these microstates, particularly within classes C and D [11, 12, 13, 14]. da Cruz et al. [15] through their study comprising patients with SCZ and their unaffected siblings observed that both groups exhibited an increase in class C microstates with a decrease in class D microstates. They proposed that the differential temporal dynamics between classes C and D microstates may serve as potential endophenotypes for patients with SCZ. Sun et al. [16] conducted a study on EEG microstates in individuals experiencing first-episode psychosis (FEP). Their findings revealed that the mean duration, time coverage, and occurrence of class C microstates were significantly elevated in patients with FEP compared to healthy controls, whereas both the time coverage and occurrence of class D microstates were diminished. These alterations are believed to be linked to cognitive impairments.
SCZ has a multifaceted etiology, with the clinical manifestations exhibiting considerable variability among patients. A significant but frequently underexplored factor is the role of age-related physiological development in influencing the pathophysiological characteristics and progression of the disease. Research has demonstrated that SCZ involves both abnormalities in brain circuitry during early stages of the disorder and an accelerated brain aging mechanism, evidenced by estimated neural age exceeding chronological age [17, 18]. Aging exerts a significant impact both on the connectivity within functional networks and that between the distinct functional networks in the brain [19, 20, 21]. These findings suggest that age-related factors may influence both the symptoms and underlying neurophysiological characteristics of the disorder. Consequently, based on the physiological development stage, patients with SCZ must be grouped to disentangle the interaction between disease progression and age-related neural changes. Javed et al. [22] used empirical mode decomposition among healthy individuals to determine microstate alterations at diverse developmental stages and indicated that age-related disparities exist in resting-state EEG microstates, further emphasizing the dynamic modulation of brain function with age [23]. Sable and Jeste [24] found that older individuals with SCZ demonstrated more pronounced negative symptoms and milder positive symptoms compared with their younger counterparts. Furthermore, Lin et al. [25] identified significant differences in microstate parameters between elderly patients with SCZ and healthy controls. Although these findings imply age-related alterations in the function of the brain in SCZ disorders, these studies fail to adequately discriminate between the distinct developmental stages of patients with SCZ, restricting a comprehensive comprehension of how physiological development interacts with disease pathology. Therefore, based on physiological and cognitive developmental stages, age groups were defined in this study [26]: 20–29 years (brain maturation stage), 30–39 years (stabilization stage), 40–49 years (early aging stage), and 50–59 years (advanced aging stage). This classification is in accordance with developmental neuroscience literature [27, 28, 29], emphasizing key transitions in brain function and structure across the lifespan. Thus, we aim to elucidate the relationship between age-related neural changes and SCZ’s pathophysiology, offering novel insights into its progression by adopting this framework.
Concurrently, pharmacological interventions may simultaneously exert a substantial impact on the EEG microstate parameters in patients with SCZ. Mackintosh et al. [30], in their study of patients with first-episode SCZ, compared medicated individuals experiencing FEP (mFEP) to medication-naive individuals with FEP (uFEP), revealing an increase in the time coverage of class C microstates and a decrease in the mean duration of class B microstates. Andreou et al. [31] further demonstrated that antipsychotic medications diminish the occurrence of class A microstates while enhancing the occurrence of class B microstates in patients experiencing their first episode of SCZ. Additionally, antipsychotic agents such as Perospirone and Haloperidol can extend the mean duration of microstates [32] and alleviate abnormal alterations in microstate dynamics among patients with SCZ [12]. Consequently, when examining EEG microstate variations in SCZ, the impact of pharmacological treatment is a critical factor to consider. Nevertheless, most existing studies primarily focus on comparing patients experiencing first-episode SCZ with and without medication, lacking longitudinal comparative analyses of those before and after treatment. To address this gap, the present study aimed to systematically investigate the alterations in EEG microstates among the patients experiencing first-episode SCZ undergoing continuous pharmacotherapy. This study will offer a novel perspective enriching current literature and elucidating the specific dynamics of microstate changes in these patients.
This study employed resting state EEG microstate analysis to systematically investigate the alterations in EEG microstates among SCZ patients across different age groups, and the changes observed before and after pharmacological treatment. The specific contributions of this research are delineated in four key areas:
⚫ Differences in EEG microstates between first-episode SCZ patients and healthy individuals were assessed to elucidate the manifestation of microstate characteristics during the disorder’s early stages.
⚫ Changes in EEG microstates in chronic schizophrenia patients across different physiological developmental stages, focusing on distinctions among mature, stable, mild decline, and pronounced decline stages.
⚫ Differences in EEG microstates between drug-treated SCZ patients and healthy individuals were compared to further analyze the impact of pharmacological treatment on microstate characteristics.
⚫ EEG microstate changes in SCZ patients before and after antipsychotic treatment were explored to reveal the effects of pharmacological intervention on microstate dynamics.
A total of 140 patients with chronic SCZ, aged 20 to 59 years, were recruited for this study from the Department of Psychiatry, Zigong Mental Health Center. Additionally, 19 patients with FEP who were not receiving any form of pharmacological, psychological, or physical therapy were also recruited for this study and subsequently administered medication for a duration of 8 weeks. All patients were diagnosed with SCZ by a qualified psychiatrist using the Structured Clinical Interview for Diagnostic and Statistical Manual of Mental Disorders, Fourth Edition (DSM-IV) Disorders (SCID). Medications prescribed for patients with SCZ include risperidone tablets, amisulpride tablets, clozapine tablets, and quetiapine fumarate tablets, among others. The physician selects the suitable medication for each individual with SCZ. The healthy control group, consisting of individuals with no prior history of mental illness and abstaining from the use of sedatives, hypnotics, or central nervous system drugs within one month prior to enrollment, was recruited from both hospitals and the community, totaling 20 participants.
Recruited participants (including both patients and healthy individuals) were aged 18 years or older, right-handed, native Chinese speakers, and had normal or corrected visual acuity. The inclusion criteria for all subjects were as follows: (i) a minimum of four years of education, (ii) no history of head trauma or serious physical illness, (iii) no history of substance abuse (e.g., alcoholism), (iv) absence of significant auditory-visual impairment, and (v) negative results on female urine pregnancy test to exclude pregnancy or contraindications. Participants who had a history of other psychiatric disorders were excluded. The study received ethical approval from the Ethics Committee of Zigong Mental Health Center. All of the patients or their families/legal guardians either provided verbal consent or signed an informed consent form, and the study adhered to the guidelines of the Declaration of Helsinki. We collected sociodemographic information, including age and gender, from all participants. The severity of the disease and symptoms were assessed using the 18-item Brief Psychiatric Rating Scale (BPRS) scale, with judgments made by two specialized clinicians. The EEG processing flow is shown in Fig. 1.
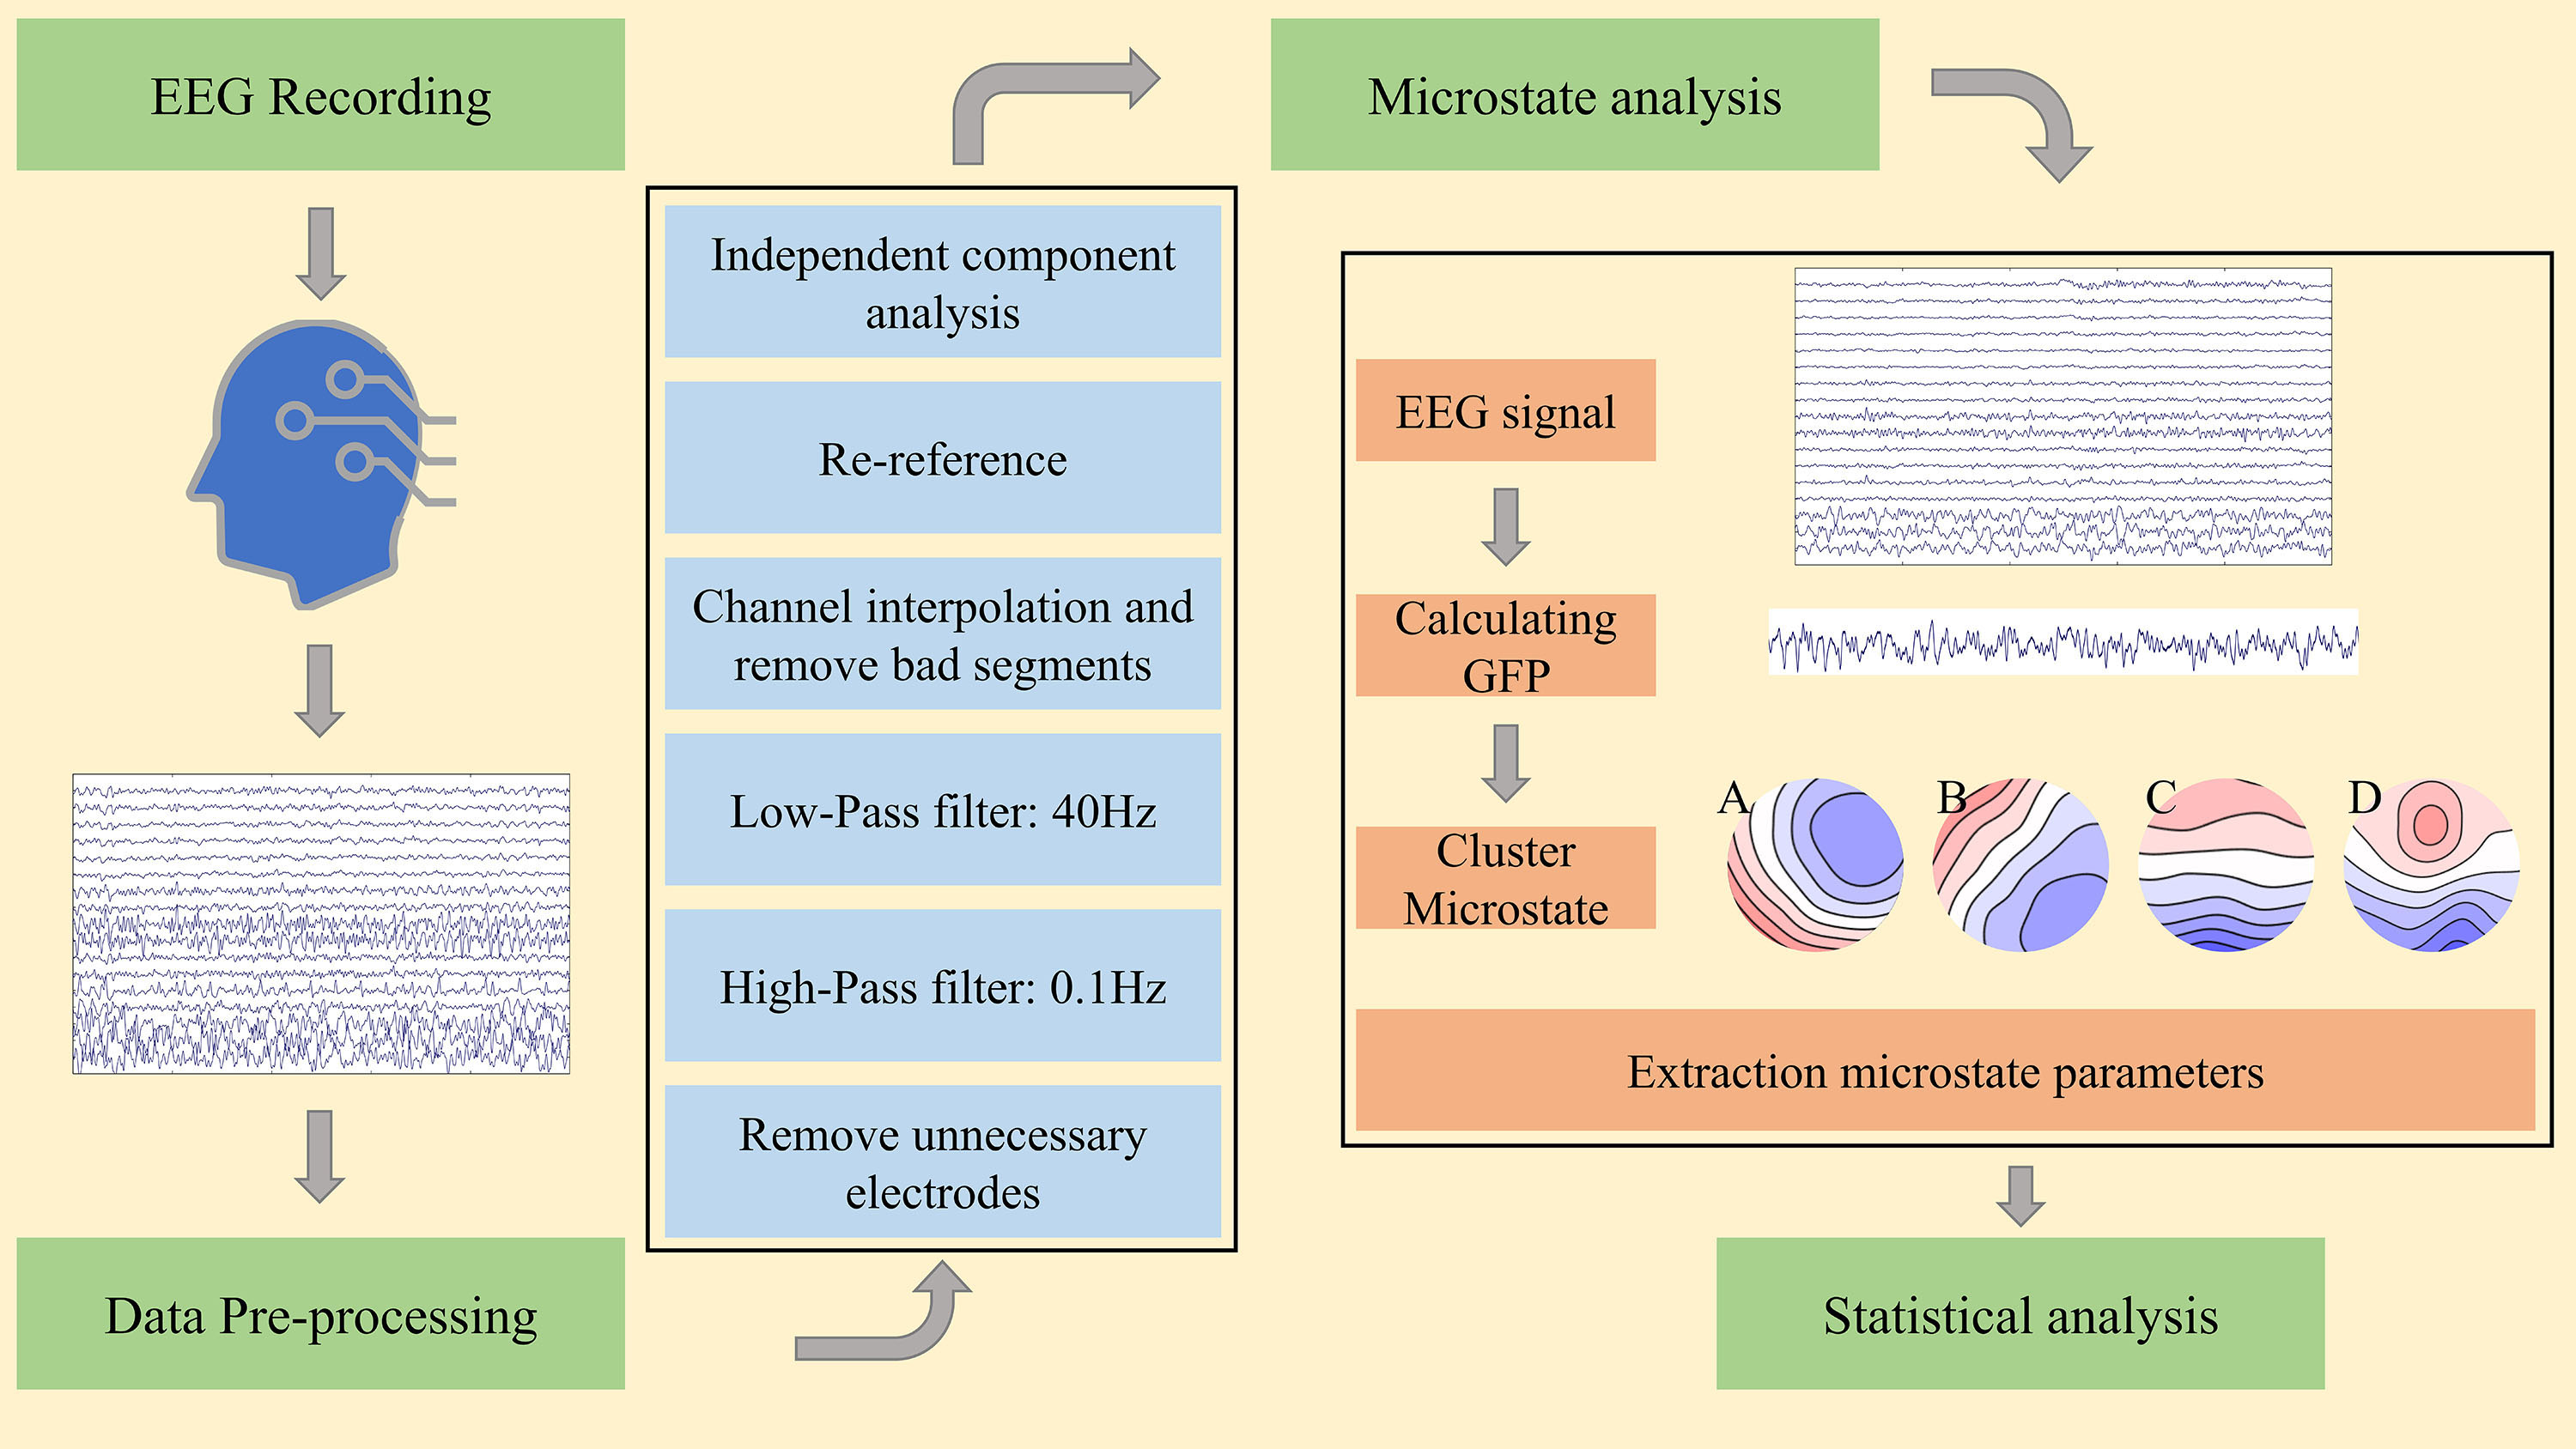 Fig. 1.
 Proposed methodology for microstate analysis in schizophrenia (SCZ). EEG, electroencephalography; GFP, global field power.
Resting-state scalp potential information was recorded from all participants using a SOLAR2848B quantitative digital video electroencephalograph (SOLAR2848B, Solar Electronic Technologies Co., Ltd., Beijing, China) in this study. The instrument utilized is a 24-channel, 16-lead system with a sampling frequency of 250 Hz. The impedance of all electrodes is maintained below 20 K
The offline data underwent preprocessing using the MATLAB-based software integration package EEGLAB (version 2023.0, Swartz Center for Computational Neuroscience, University of California San Diego, La Jolla, CA, USA) [33] for data preprocessing. The offline data was imported into EEGLAB, and the channel positioning was performed on the data according to the International 10–20 system. The redundant electrode channels (including X1, X2, RespRate, and additional channels) were then eliminated, leaving a total of 19 remaining channels. This was followed by band-pass filtering ranging from 0.1 to 40 Hz, manually identifying corrupted channels, and correcting them using a spline interpolation algorithm. Visual inspection was then performed to manually reject segments containing artifacts or ambiguous measurements. Independent component analysis (ICA) was performed to correct eye movement, blinking, and Electrocardiography (ECG) artifacts. Trials with unclear data were manually excluded. For subsequent microstate analysis, a binaural mastoid reference was reapplied to the EEG data of all trials.
EEG microstate analysis was conducted using the Microstate 1.0 plugins (version 1.0, EEGLAB toolbox, available at https://www.biorxiv.org/content/early/2018/03/27/289850 and MATLAB-based custom scripts) in EEGLAB toolbox and MATLAB-based custom scripts. Global field power (GFP) was calculated from the preprocessed EEG data of all participants. The data of 1000 GFP peaks were randomly sampled from each subject to form a template, which was then subjected to microstate clustering using the K-Means algorithm. Subsequently, the microstates derived from template clustering were utilized to assign each time point of individual subjects’ data to their respective microstate class. EEG microstate clustering was completed for all subjects. To ensure comparability with the previous study [14], the number of microstate clusters was set to four in this investigation. During microstate clustering, polarity can be disregarded; thus, microstates exhibiting different polarities (A and -A) can be considered equivalent.
All groups (healthy controls (HC) group, physiological development stage groups (SCZ-Age groups): Group_1, Group_2, Group_3, Group_4, and admission baseline (0-week medication group) and 8-week medication groups) in this study were analyzed using microstates. The global explained variance (GEV) of each group ranged from 70% and 84%. The four classes of microstate topographies clustered from the microstates were labeled as A, B, C, and D, consistent with previous studies. Class A and B microstates presented diagonally oriented topographies of right anterior-left posterior and left anterior-right posterior, respectively. Microstates class C had an anterior-posterior oriented topography, while microstates class D exhibited the topography of anterior-posterior midpoint positions.
For each subject, three index parameters were calculated for each of the four classes of microstates: mean duration, time coverage, and occurrences. Mean duration (ms) presents the average presence time of each type of stable microstate in the EEG signal; time coverage (%) indicates the percentage of total time occupied by the presence time of a given microstate; and occurrences (times/s) presents the average number of times each microstate occurred per second over the entire recording duration.
The statistical analysis was performed using SPSS (version 26.0, International Business Machines Corporation, Armonk, NY, USA) and RStudio (version 4.4.1, Public Benefit Corporation, Boston, MA, USA). To examine sociodemographic disparities among groups, distinct analytical approaches were employed for different variables, encompassing chi-squared tests for categorical variables, independent samples t-tests for continuous variables, and one-way ANOVA to compare multiple groups. The Scheirer-Ray-Hare test was employed to compare groups based on physiological developmental stages, while a simple effects analysis was conducted for microstate parameters exhibiting significant interaction effects between the Group and microstate class. In instances where the main effect of the group was found to be significant, the Kruskal-Wallis test was subsequently utilized to assess intergroup differences. For post hoc pairwise comparisons, Dunn’s test with Bonferroni correction was applied to address multiple testing concerns. The non-parametric paired-samples Wilcoxon signed-rank test was used to analyze the differences in EEG microstate dynamics between the baseline at admission and the 8-week medication groups in patients with FEP. The healthy control group was compared to the admission baseline group and the 8-week medication group using the Mann-Whitney U test for non-parametric independent samples. The statistical analyses were conducted using two-tailed tests, with a significance level set at 0.05.
In this section of the study, patients with schizophrenia were categorized into four groups based on physiological development stage, specifically Group_1 (20–29 years), Group_2 (30–39 years), Group_3 (40–49 years), and Group_4 (50–59 years). To mitigate potential confounding factors arising from age-related physiological decline or the presence of cardiovascular and cerebrovascular diseases, individuals aged 60 years and above were excluded from this study, with a specific focus on young and middle-aged participants. The four microstate classes for the SCZ-Age group are shown in Fig. 2. Aside from age, no significant differences in sociodemographic characteristics were observed among the four groups (Table 1).
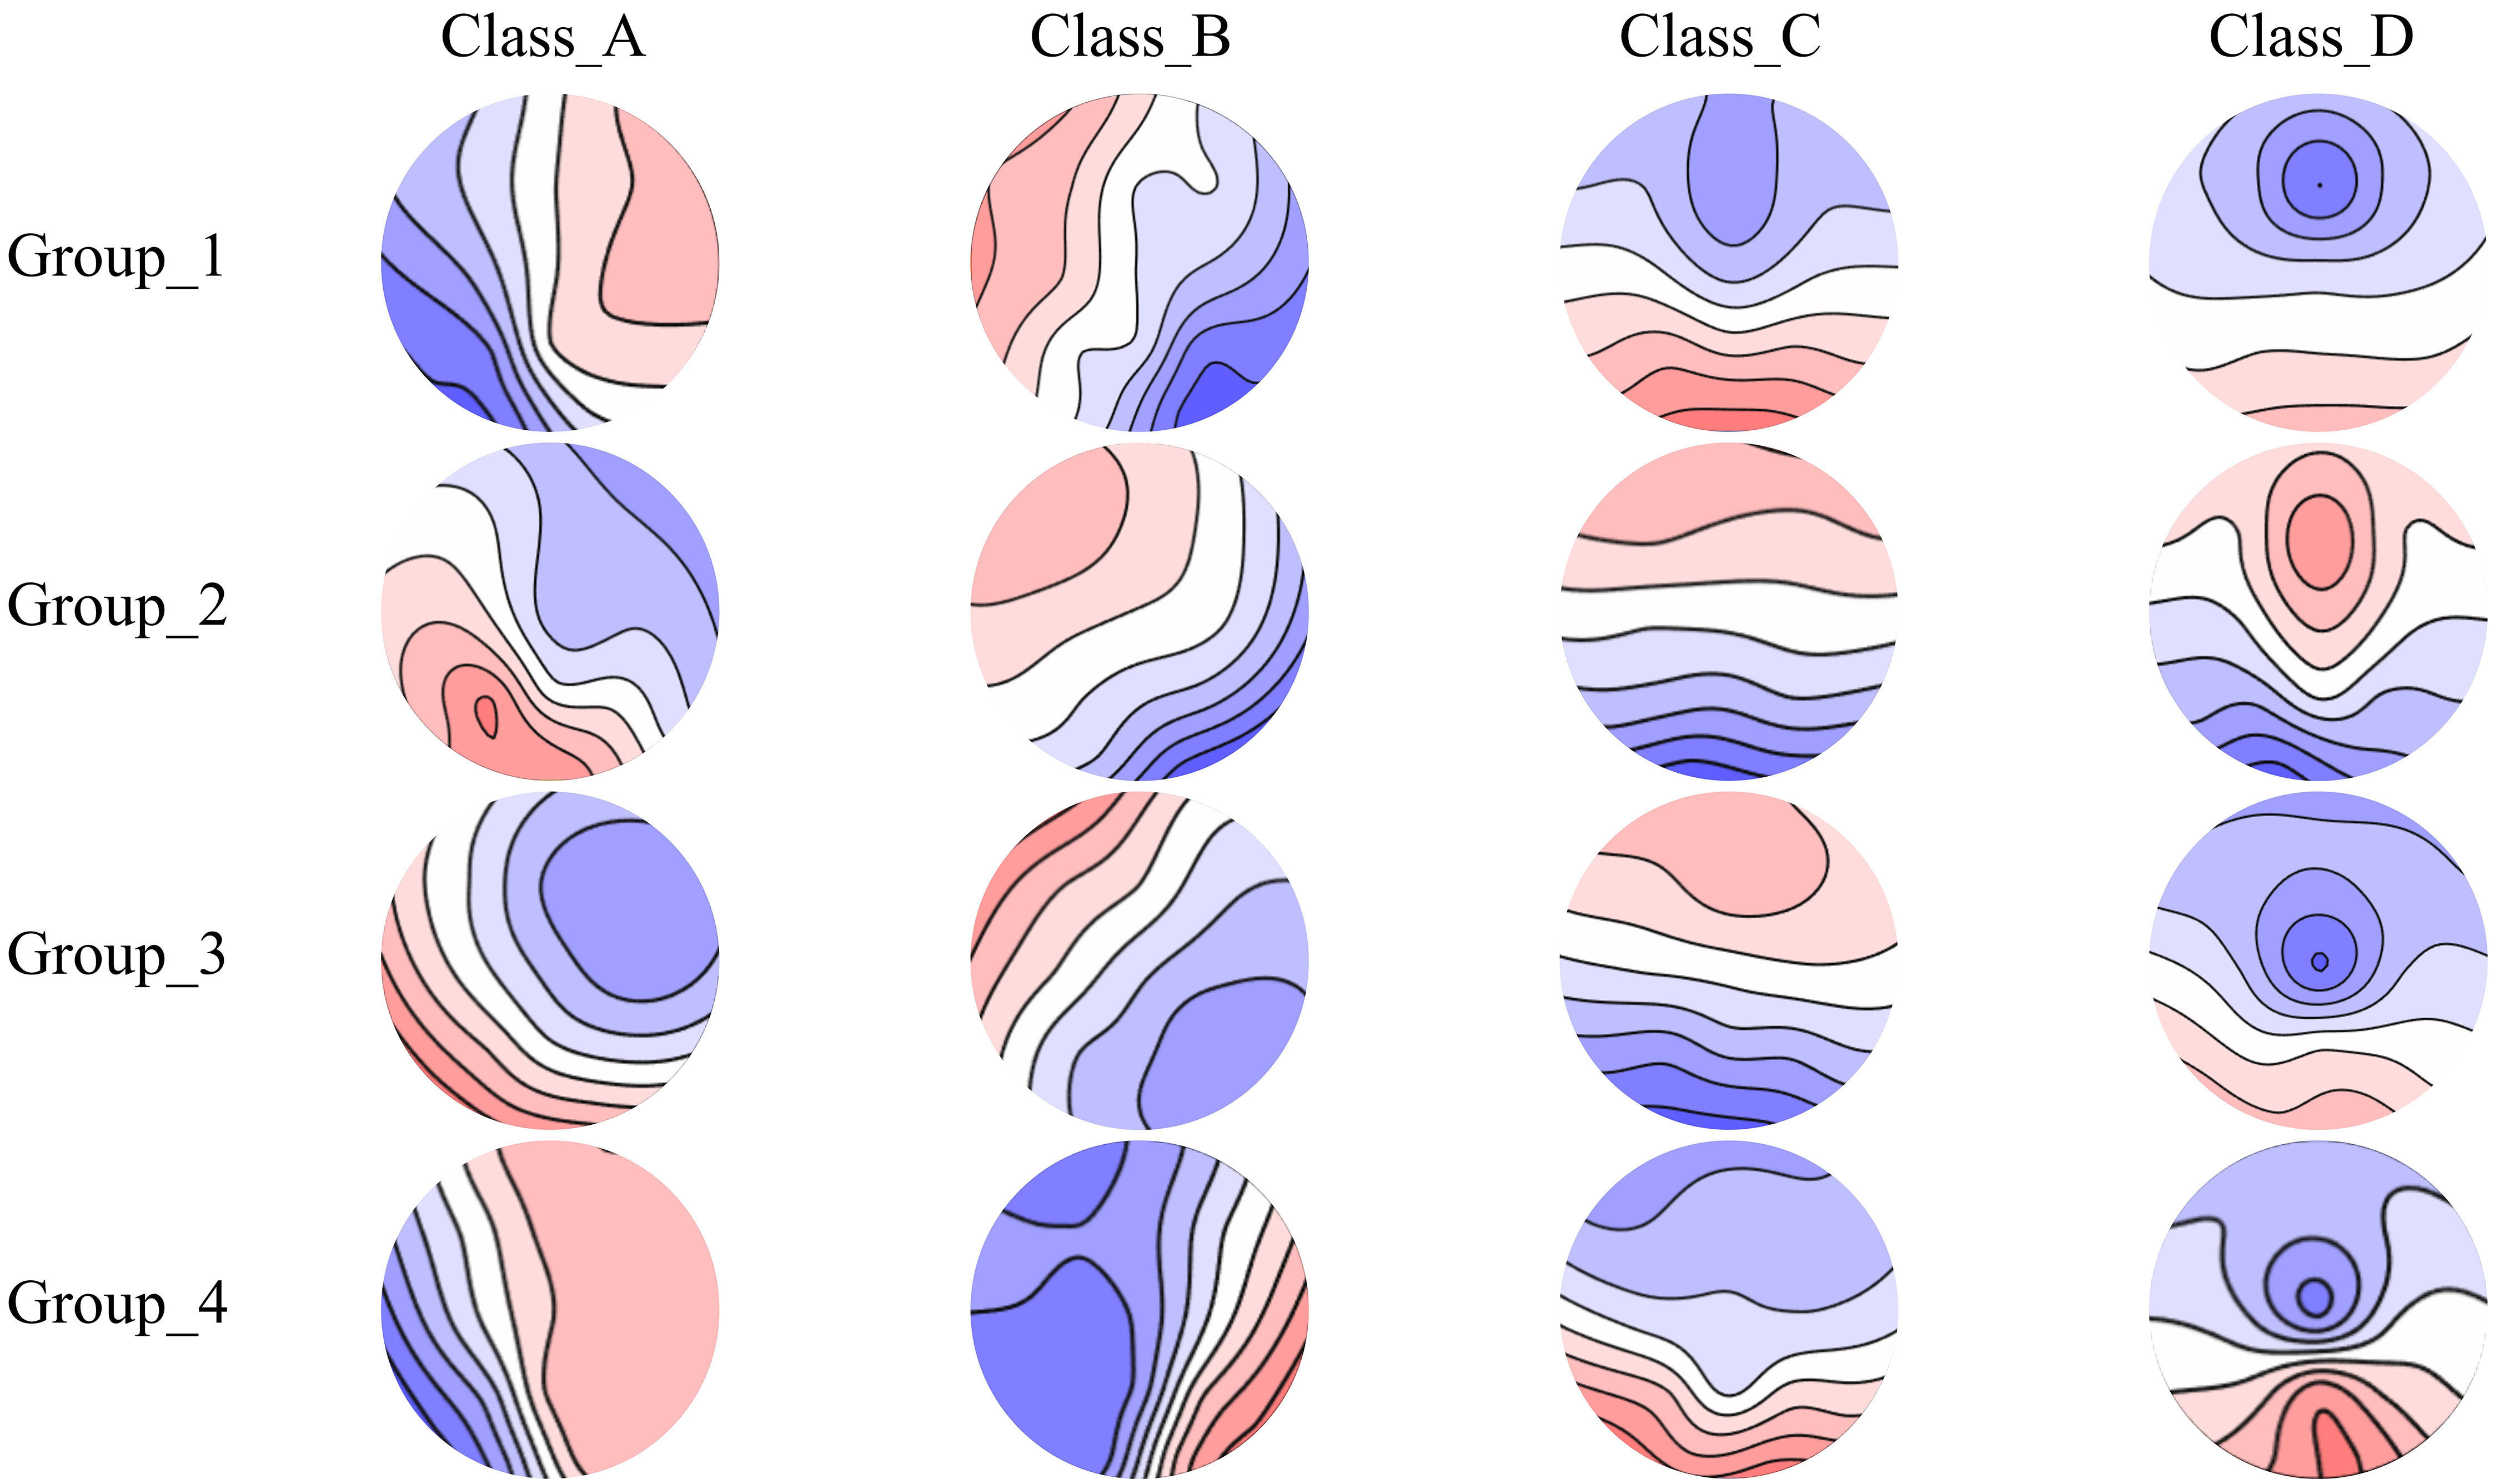 Fig. 2.
 Spatial configuration of the four microstate categories in the SCZ-Age groups. Spatial configuration of four microstate classes (A, B, C, and D) in four physiological development stage groups of SCZ patients. Group_1 (20–29 years), Group_2 (30–39 years), Group_3 (40–49 years), and Group_4 (50–59 years).
| SCZ-Age (n = 140) | F/χ2 | p | ||||
| Group_1 (n = 35) | Group_2 (n = 35) | Group_3 (n = 35) | Group_4 (n = 35) | |||
| Sex: n (M:F) | 24:11 | 14:21 | 17:18 | 17:18 | 6.18 | 0.103 |
| Age, years: mean (SD) | 24.37 (3.23) | 34.51 (2.83) | 44.26 (2.83) | 53.37 (2.65) | 651.81 | 0.000*** |
| BPRS: mean (SD) | 52.71 (1.86) | 52.54 (1.73) | 52.83 (1.87) | 52.71 (1.76) | 0.149 | 0.930 |
| EEG total analysis time: (seconds) mean (SD) | 1179.46 (41.02) | 1174.86 (12.93) | 1166.22 (40.39) | 1182.51 (11.34) | 1.955 | 0.124 |
| EEG explained variance (%): mean (SD) | 72.22 (2.43) | 71.13 (2.01) | 71.38 (1.75) | 70.96 (1.92) | 2.601 | 0.055 |
SCZ-Age, physiological development stage groups of schizophrenia patients; Group_1 (20–29 years), Group_2 (30–39 years), Group_3 (40–49 years), and Group_4 (50–59 years); BPRS, Brief Psychiatric Rating Scale; EEG, electroencephalography; SD, Standard Deviation. The F-value is the statistical value of the one-way ANOVA test while the
In this study, a total of 140 patients diagnosed with SCZ were selected and categorized by physiological development stage. Each physiological development stage group comprised 35 subjects. For the four physiological development stage groups, the two-way Scheirer-Ray-Hare analysis revealed a significant Group
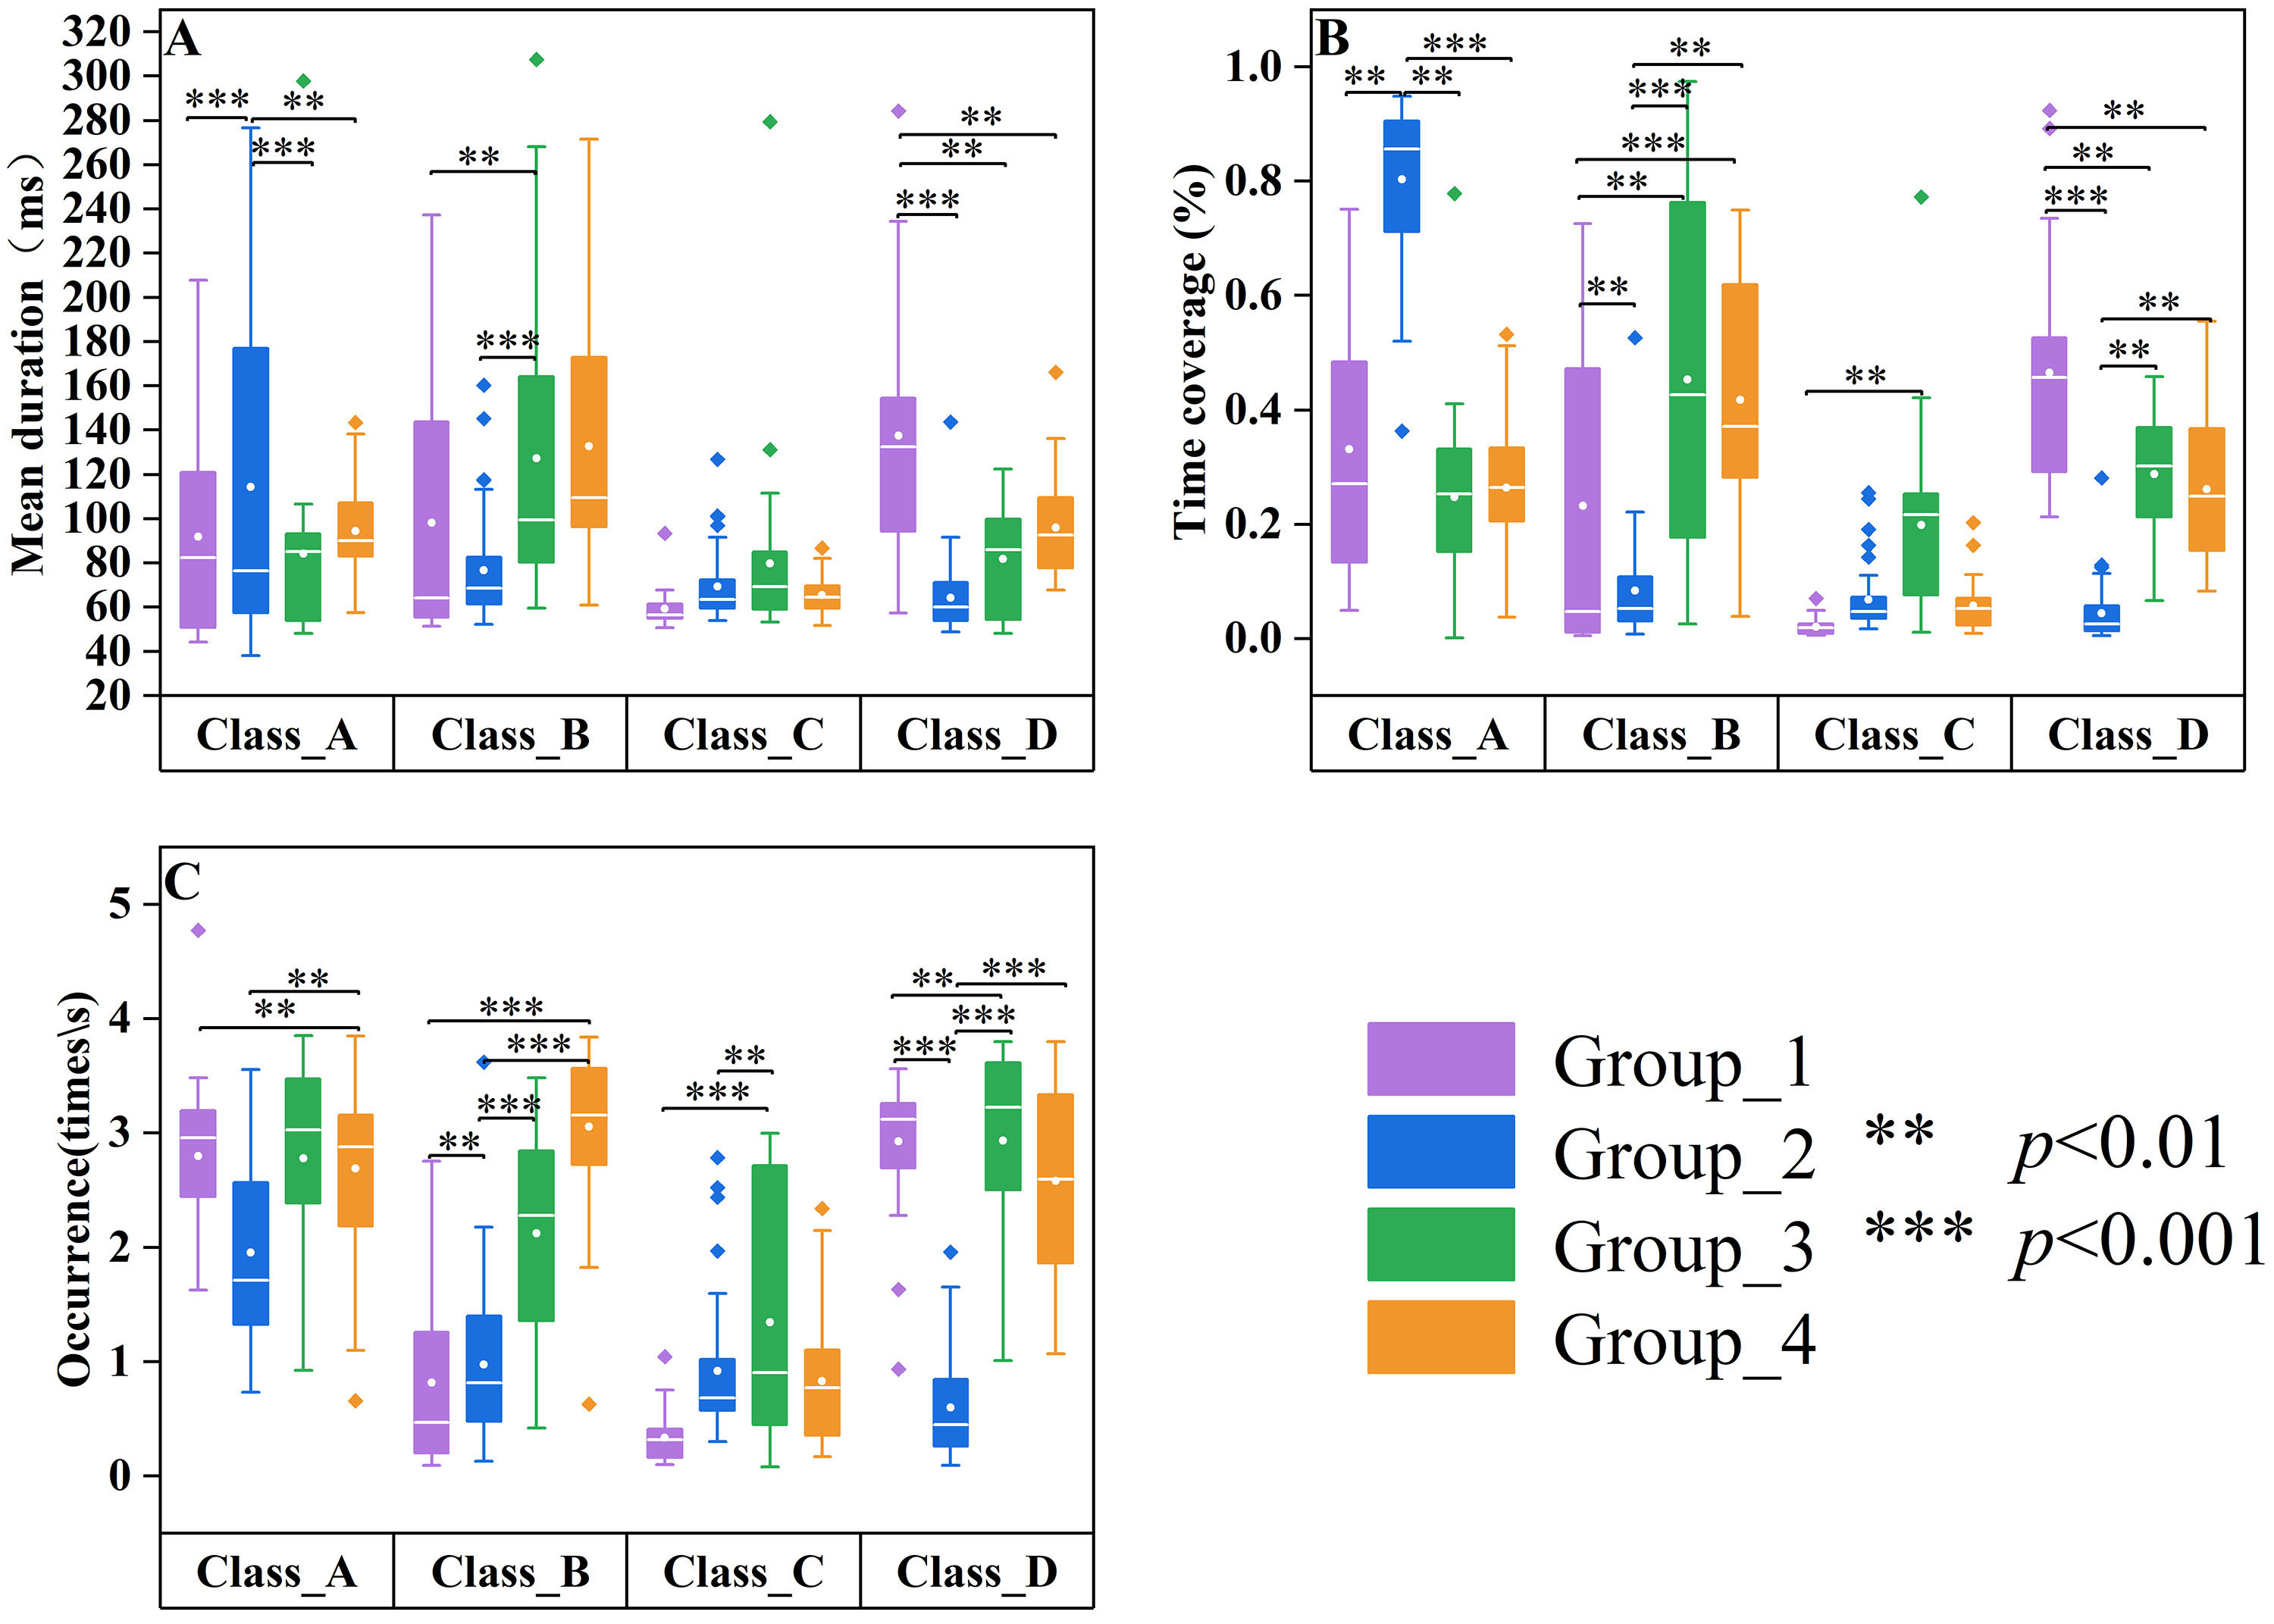 Fig. 3.
 Differences in microstate parameters among age groups of patients with SCZ. Group_1 (20–29 years, n = 35) data are displayed in purple, Group_2 (30–39 years, n = 35) data are displayed in blue, Group_3 (40–49 years, n = 35) data are displayed in green, and Group_4 (50–59 years, n = 35) data are displayed in orange. Group quartile statistics for temporal microstate parameters: (A) mean duration, (B) time coverage, and (C) occurrence.
To evaluate the impact of the group on microstate parameters—Mean Duration, Time Coverage, and Occurrence—a Scheirer-Ray-Hare test was performed. The Scheirer-Ray-Hare test for the mean duration indicated no significant main effect of group (
Post-hoc analysis revealed a statistically significant difference in time coverage between Group_2 and Group_4 (Z = –3.107, p = 0.0057), as well as between Group_1 and Group_4 (Z = –2.602, p = 0.0278). Nevertheless, no statistically significant differences were detected among the other group comparisons, specifically between Group_1 and Group_2 (Z = 0.226, p = 1.000), Group_1 and Group_3 (Z = –1.099, p = 0.814), Group_3 and Group_4 (Z = –1.594, p = 0.332), as well as between Group_2 and Group_3 (Z = –1.452, p = 0.439).
For the occurrence, post-hoc analysis indicated significant differences between Group_1 and Group_2 (Z = 2.72, p = 0.0195), Group_2 and Group_3 (Z = –4.80, p
In this part of the study, a cohort of 19 unmedicated patients with first-episode SCZ underwent an 8-week medication treatment, during which resting-state EEGs were recorded upon their initial hospital admission (0-weeks medication group) and after completion of the 8-week medication regimen (8-weeks medication group). Additionally, a control group comprising eighteen healthy individuals was recruited from both the community and hospital settings based on demographic and sociological characteristics (Table 2). The four microstate classes for the three groups (HC, 0-week medication, and 8-week medication) are shown in Fig. 4.
| HC (n = 18) | m-SCZ (n = 19) | F(T)/χ2 | p | ||
| 0 week | 8 week | ||||
| Sex: n (M:F) | 11:7 | 9:10 | 0.703 | 0.402 | |
| Age, years: mean (SD) | 22.06 (1.76) | 21.95 (0.85) | 0.240 | 0.812 | |
| BPRS: mean (SD) | - | 53.00 (1.75) | 47.56 (1.95) | 21.229 | 0.000*** |
| EEG total analysis time: (seconds) mean (SD) | 599.19 (11.05) | 606.26 (12.14) | 601.20 (9.78) | 2.033 | 0.141 |
| EEG explained variance (%): mean (SD) | 74.08 (2.92) | 73.31 (2.53) | 73.71 (2.20) | 0.418 | 0.660 |
HC, healthy controls; m-SCZ, medicated SCZ patients; 0 week, SCZ patients treated at week 0; 8 weeks, SCZ patients treated at week 8; The F-value is the statistical value of the one-way ANOVA test while the
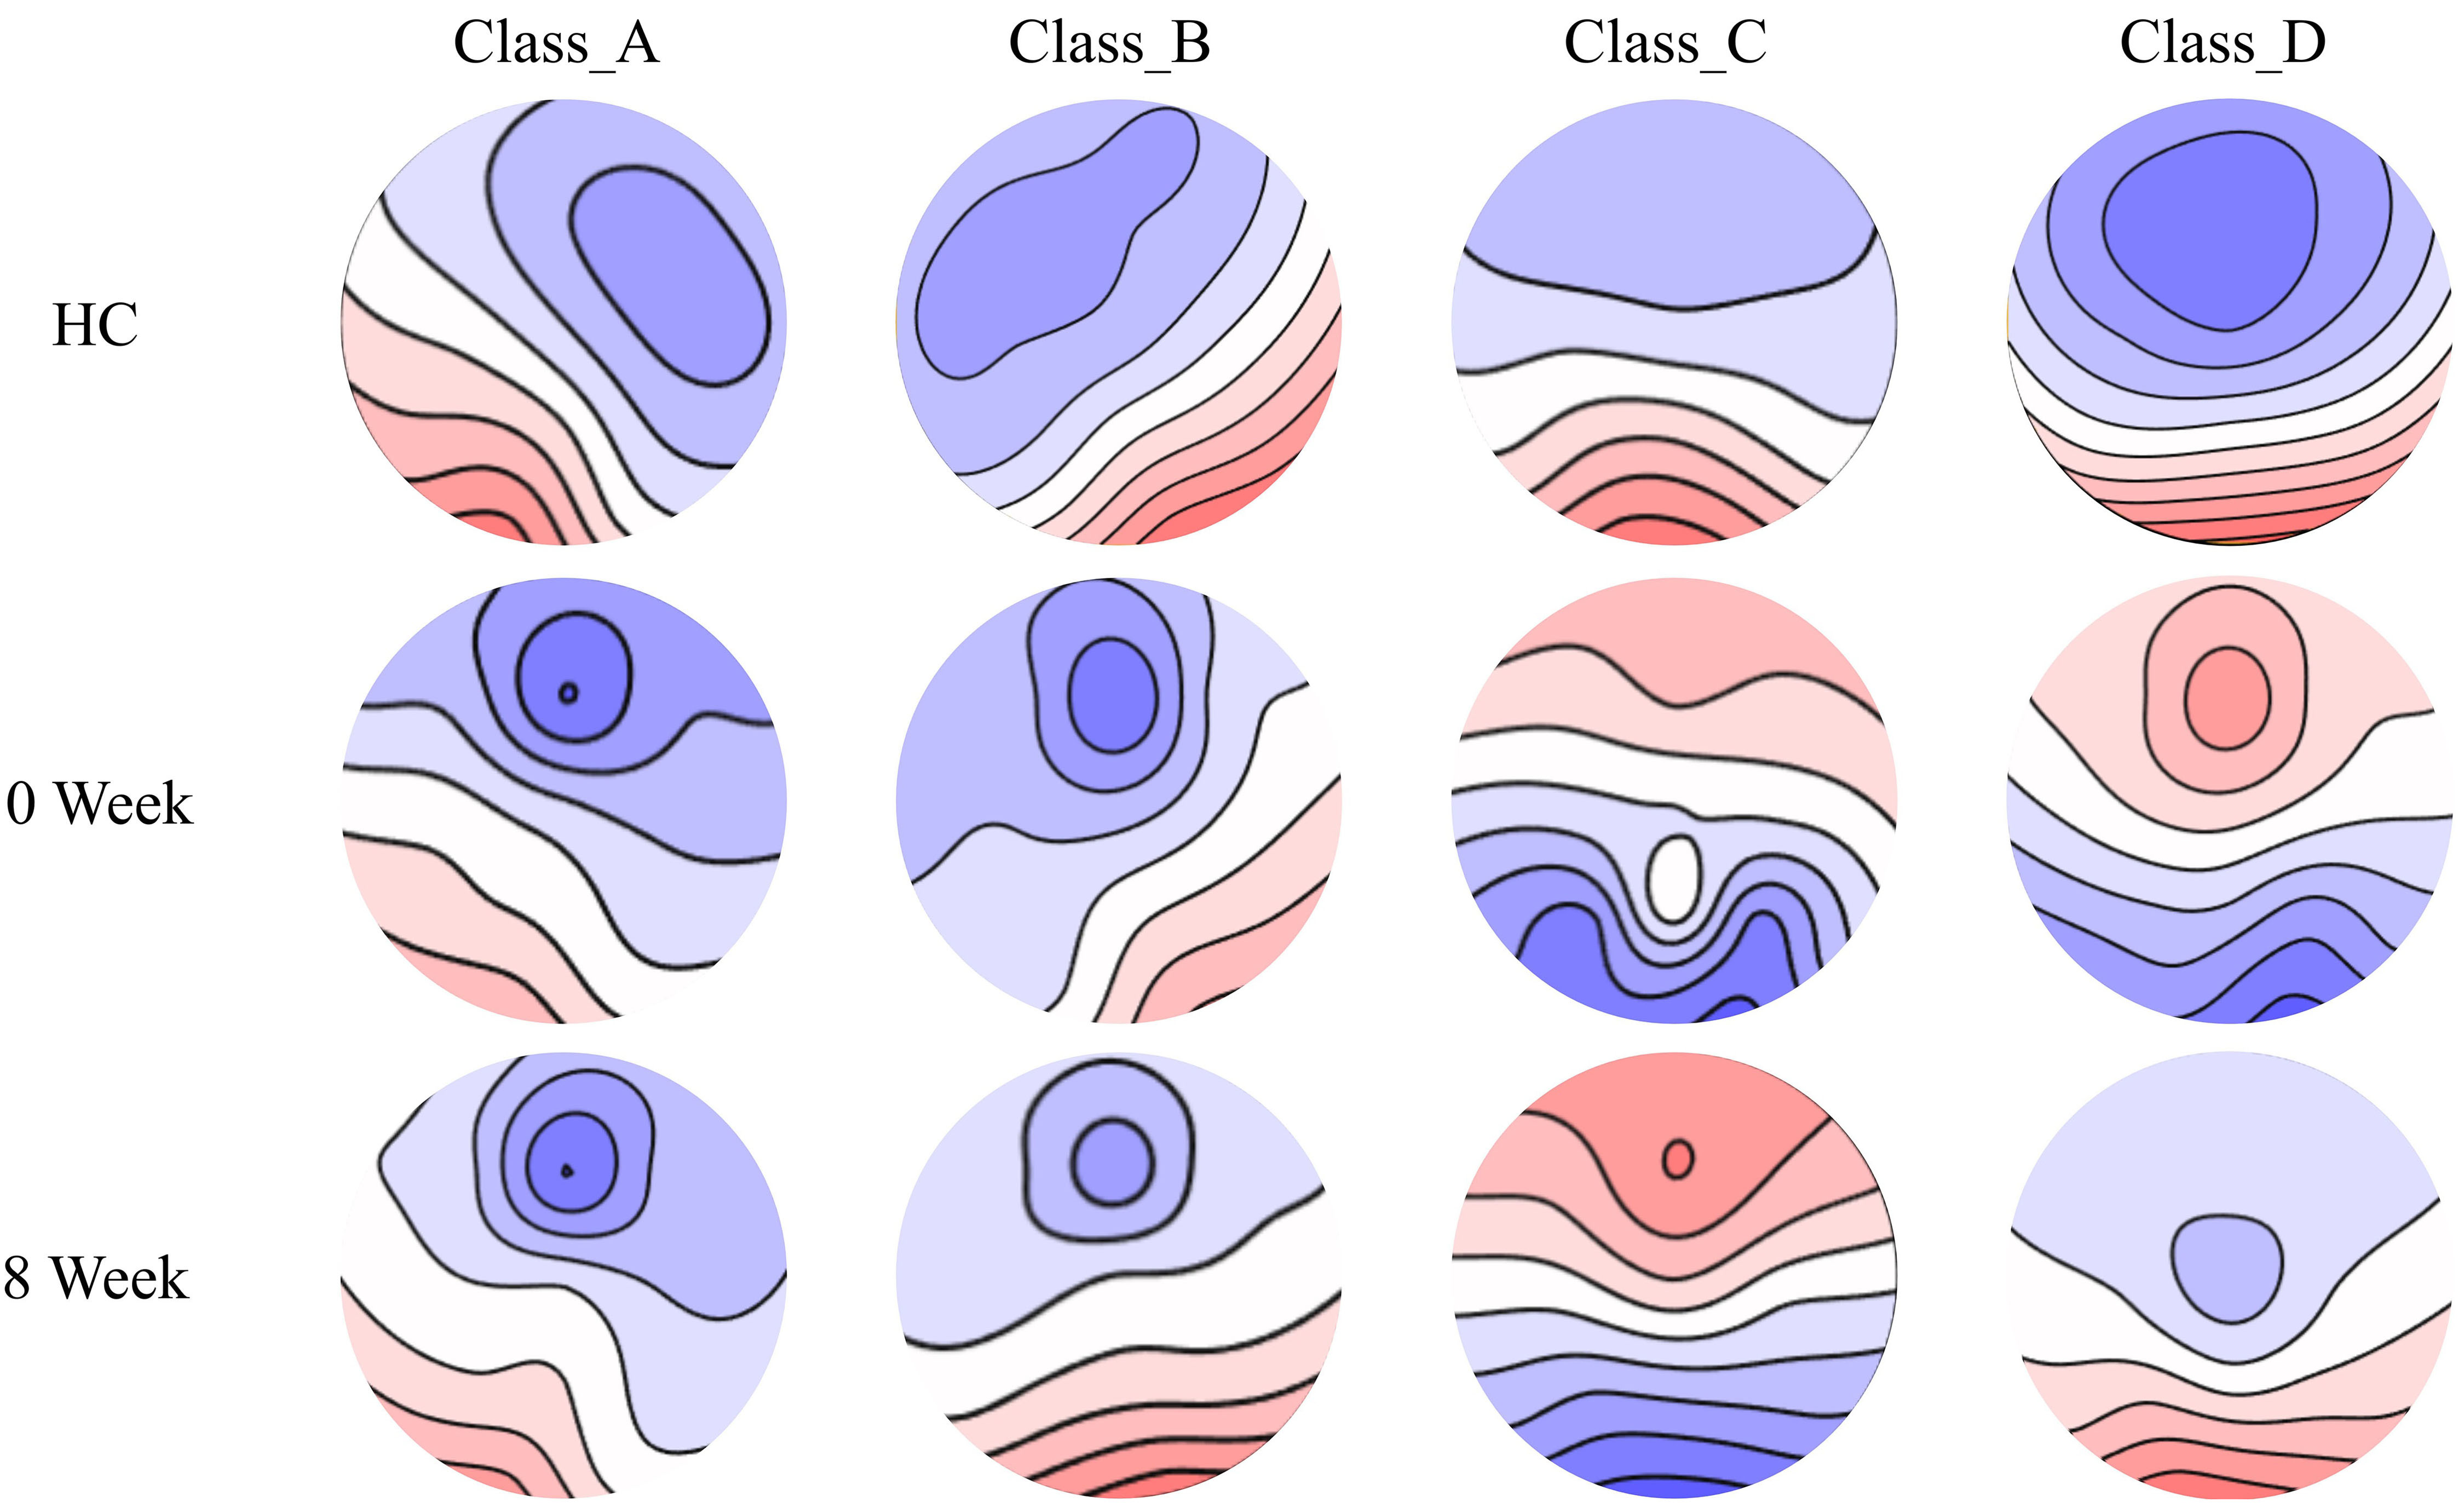 Fig. 4.
 Tracking the spatial configuration of the four microstate classes of the medication and health group. The spatial configuration of four microstates (A, B, C, and D) was tracked in drug-treated SCZ patients and healthy controls. 0 week, SCZ patients treated at week 0; 8 weeks, SCZ patients treated at week 8.
Compared to the healthy control group (Fig. 5), significant differences were observed in the mean duration (Z = –3.16, p = 0.00158), time coverage (Z = –4.133, p
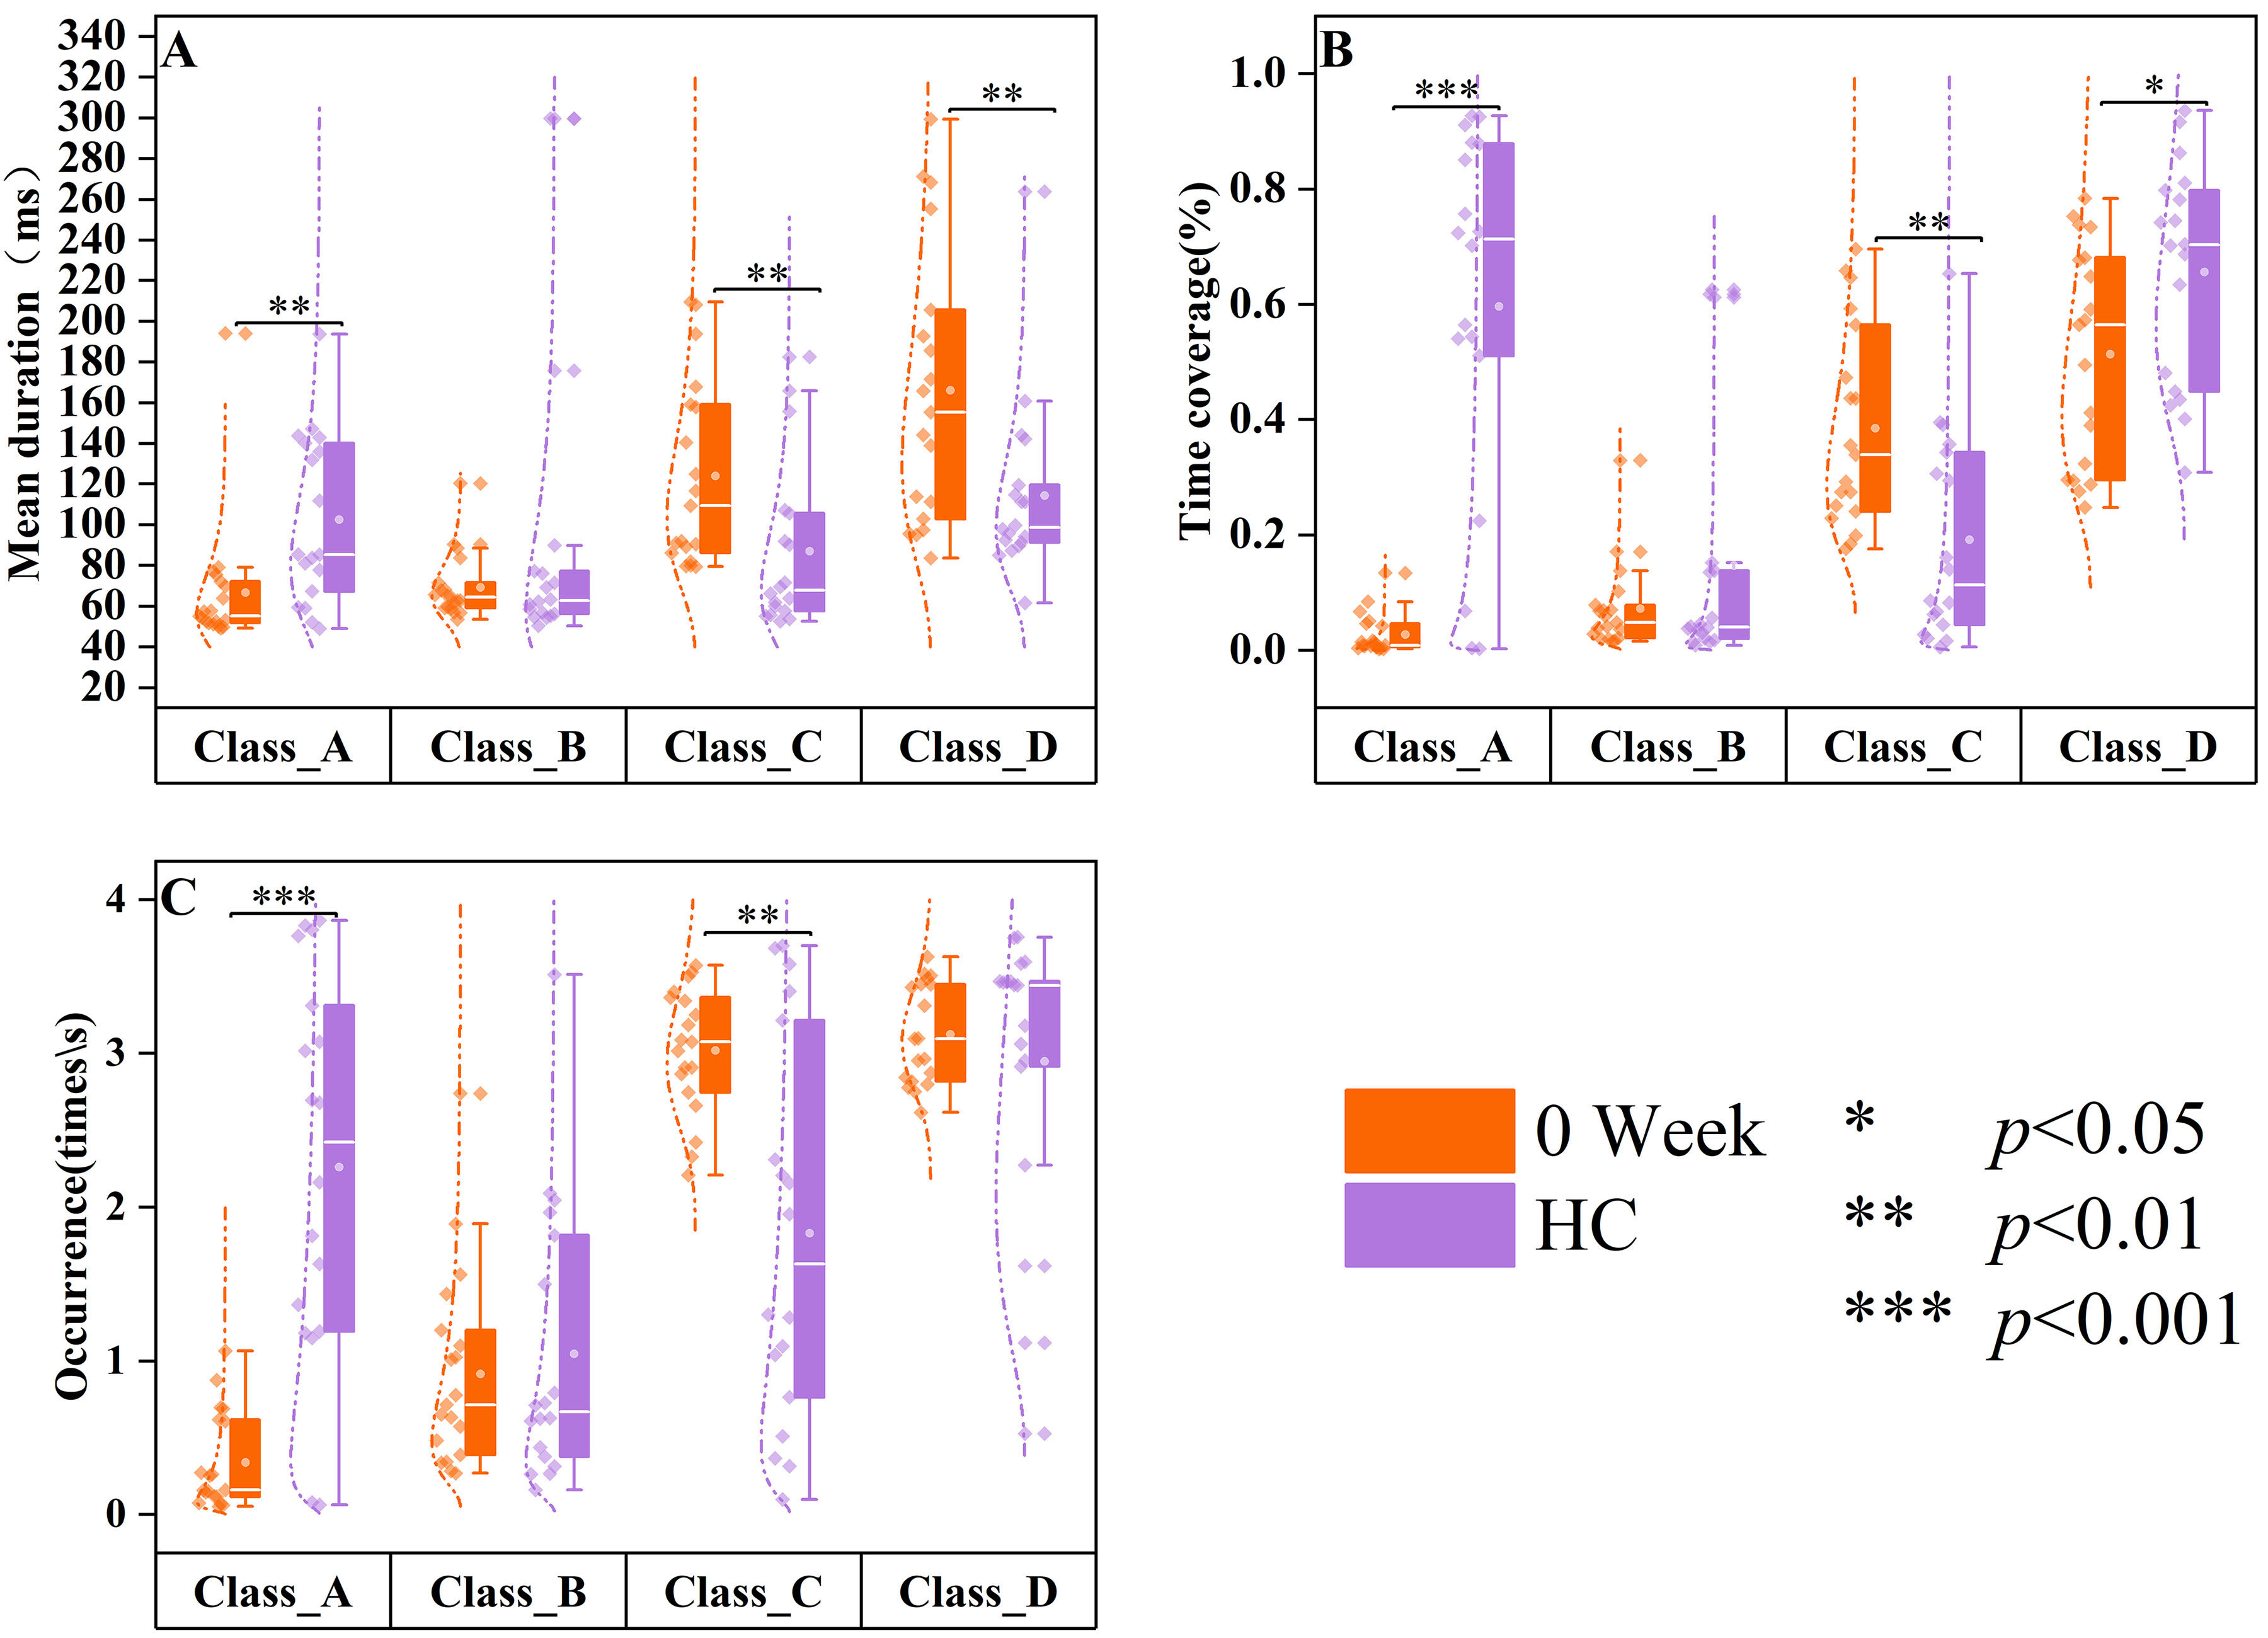 Fig. 5.
 Differences in resting-state microstates in HC and 0-week medication groups. The data of healthy controls (HC, n = 18) are displayed in purple, and the data of SCZ patients treated at week 0 (0 week, n = 19) are displayed in orange. Group quartile statistics for temporal microstate parameters: (A) mean duration, (B) time coverage, and (C) occurrence.
Compared to healthy controls (Fig. 6), patients with SCZ who underwent eight weeks of drug treatment exhibited significant differences in mean duration (Z = –2.066, p = 0.039) and time coverage (Z = –3.434, p
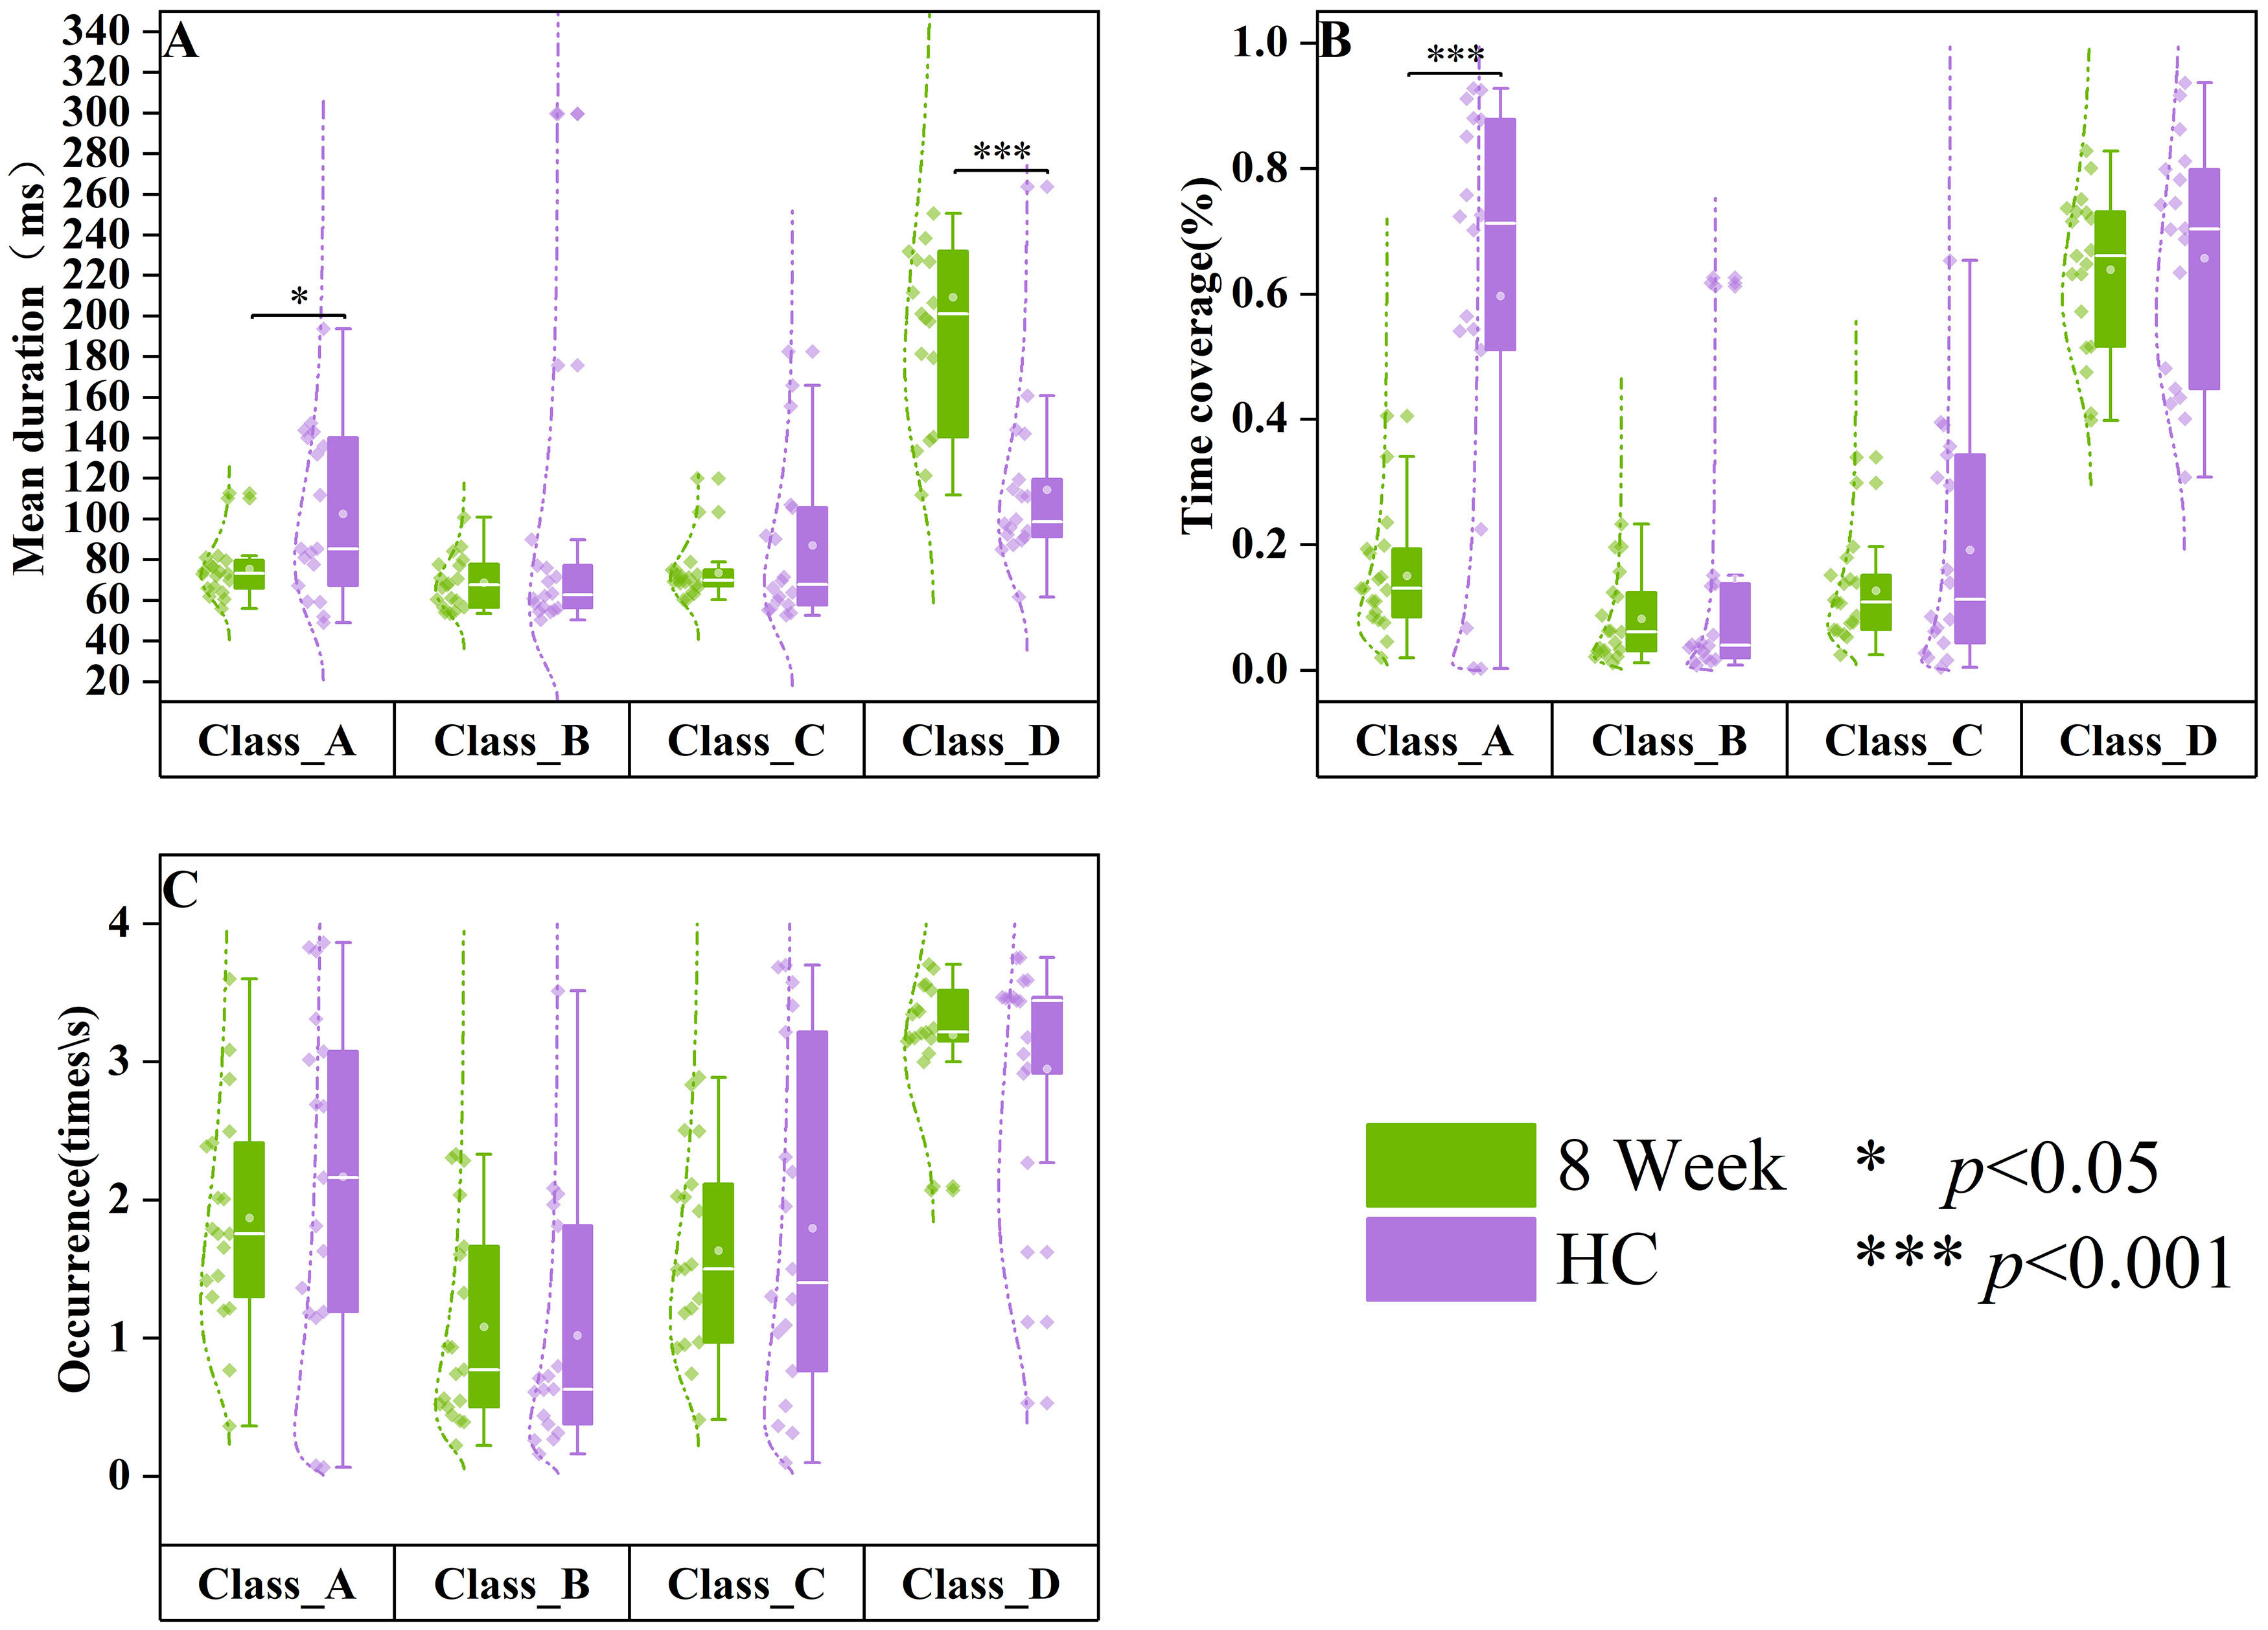 Fig. 6.
 Differences in resting-state microstates in HC and 8-week medication groups. The data of healthy controls (HC, n = 18) are displayed in purple, and the data of SCZ patients treated at week 8 (8 weeks, n = 19) are displayed in green. Group quartile statistics for temporal microstate parameters: (A) mean duration, (B) time coverage, and (C) occurrence.
In comparison to the 0-week medication group (Fig. 7), patients with SCZ who received eight weeks of medication exhibited significantly higher mean duration (Z = 2.374, p = 0.018), time coverage (Z = 3.582, p
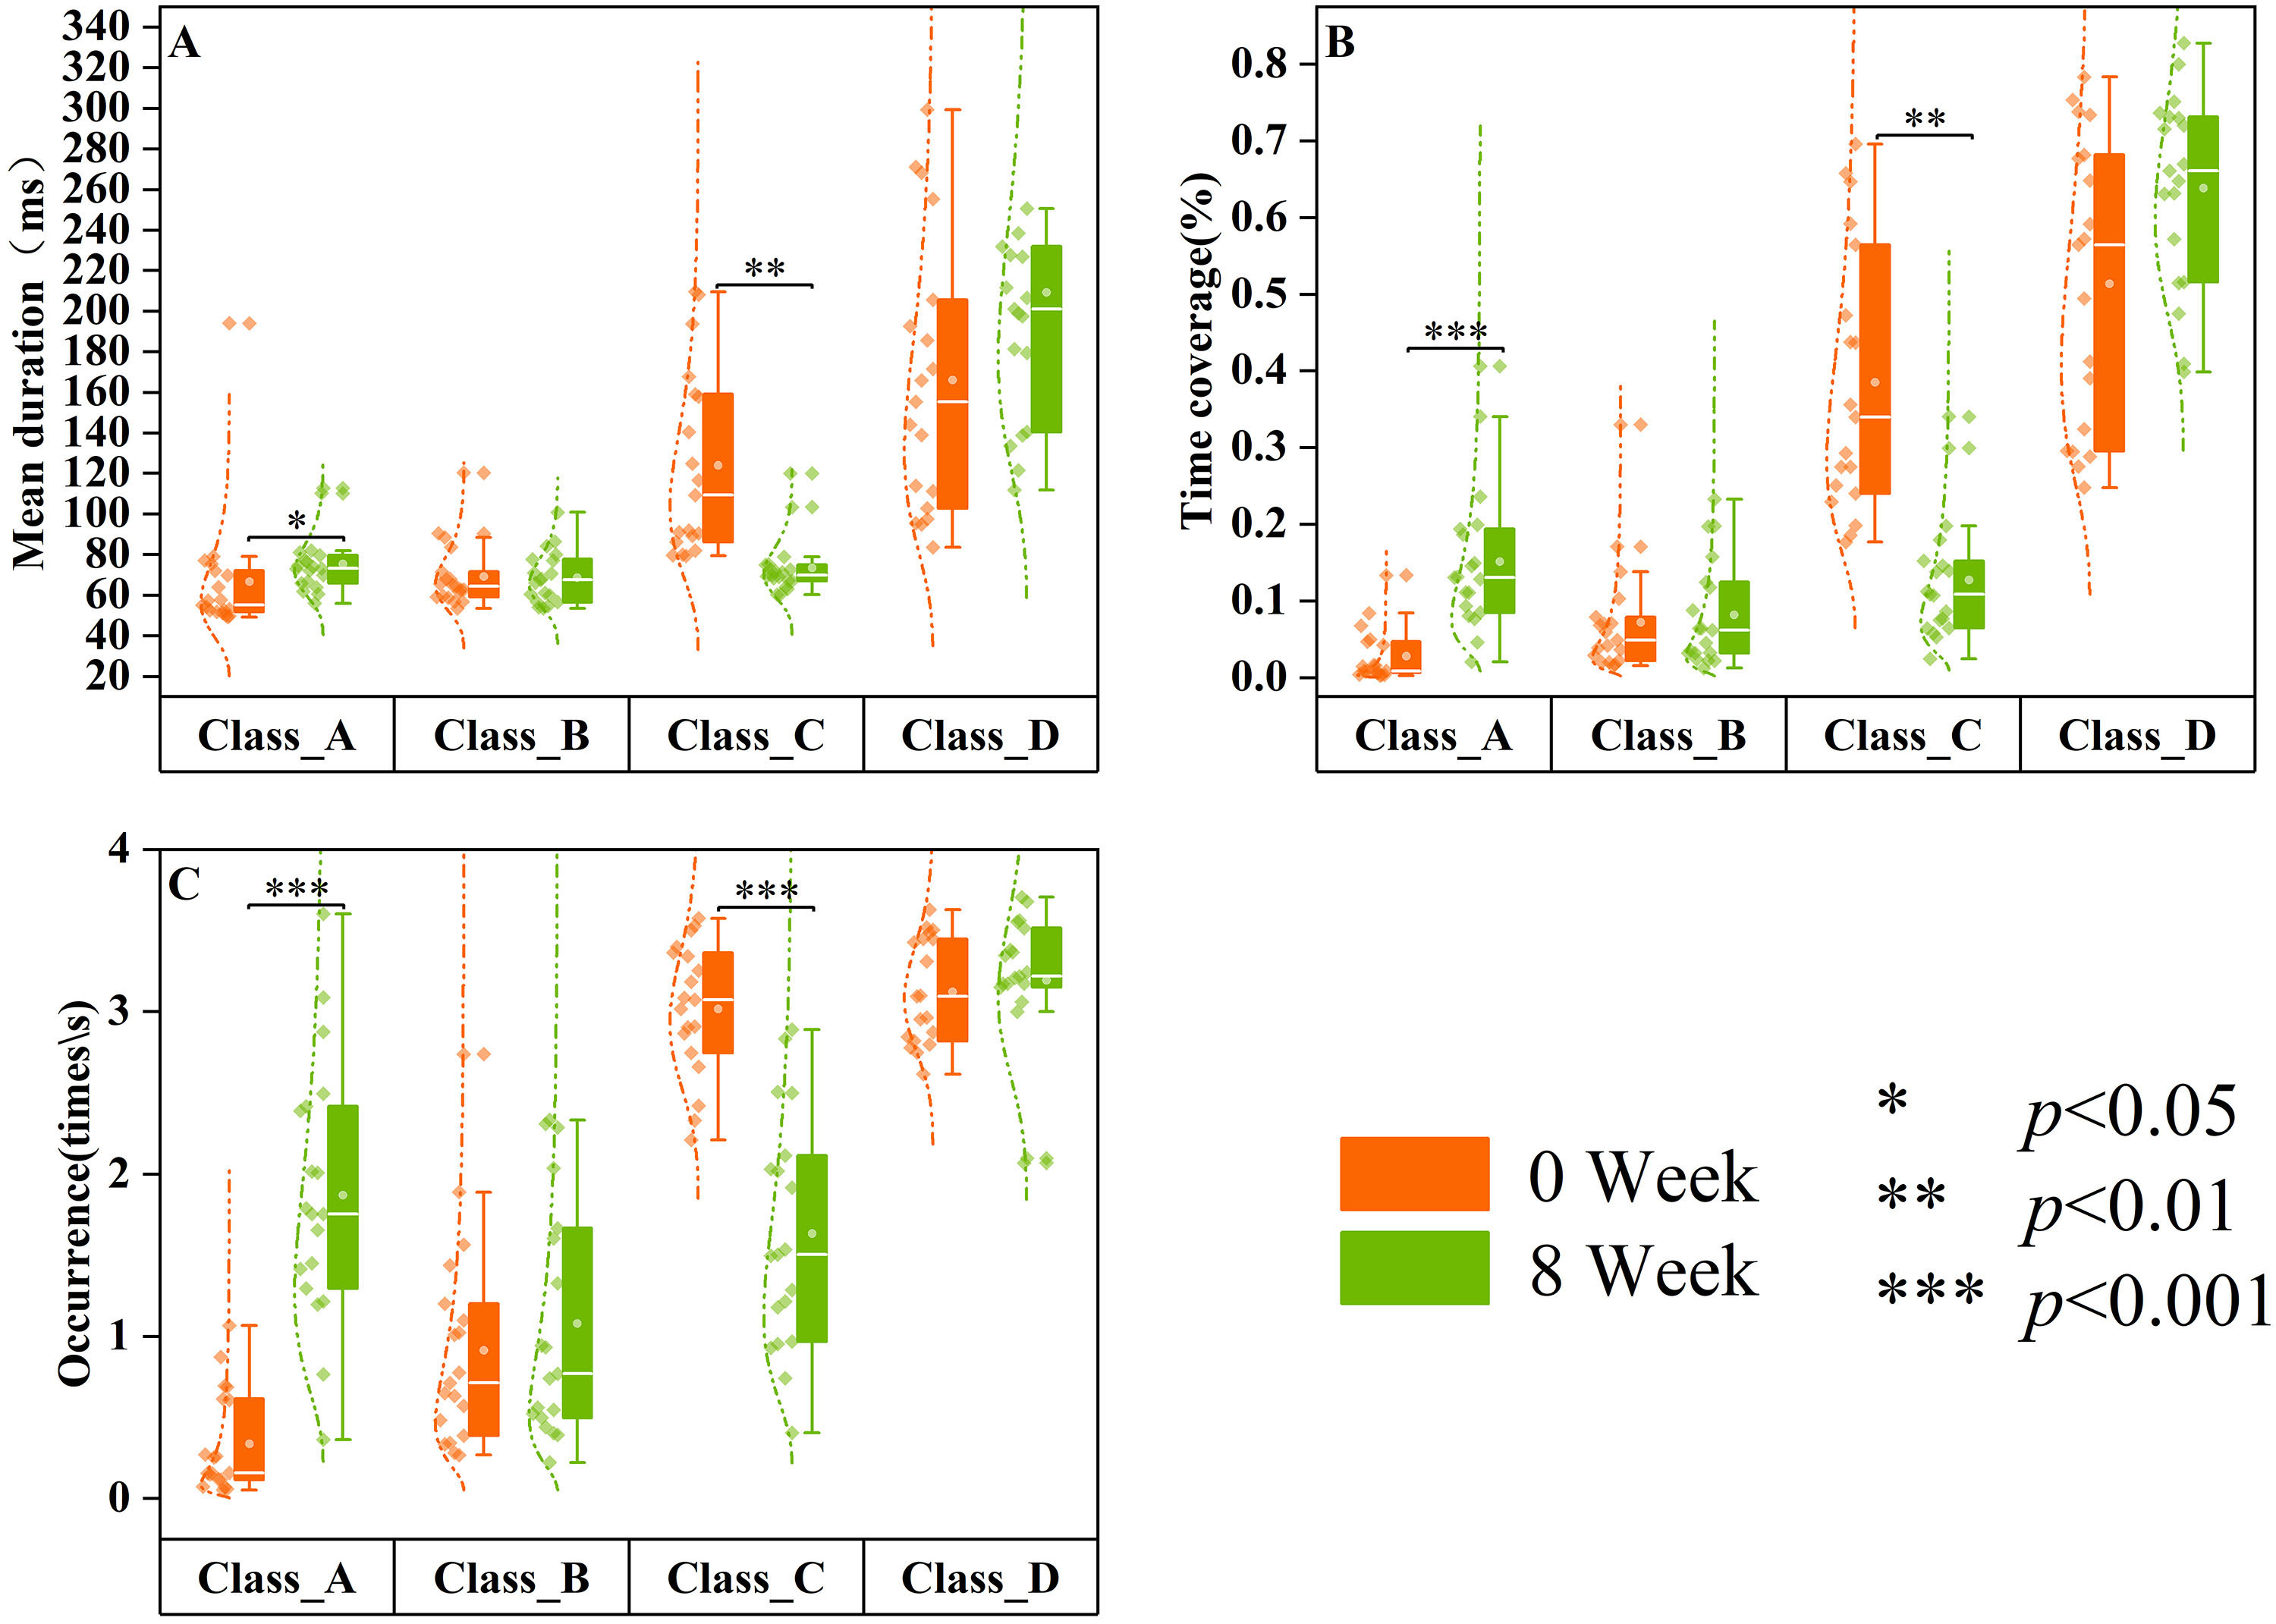 Fig. 7.
 Differences in resting-state microstates in 0-week and 8-week medication groups. The data of SCZ patients treated at week 0 (0 week, n = 19) are displayed in orange, and the data of SCZ patients treated at week 8 (8 weeks, n = 19) are displayed in green. Group quartile statistics for temporal microstate parameters: (A) mean duration, (B) time coverage, and (C) occurrence.
This study aimed to investigate physiological development stage differences in resting-state EEG microstates among patients with SCZ and the objective changes that occur in the EEG microstates of patients before and after pharmacological intervention. In Section 3.1 of the Results, patients with chronic SCZ were first classified into age-specific cohorts, and subsequent analysis was performed on these groups. In Part 3.2 of the Results, patients exhibiting FEP received medication 8 weeks to examine the changes in EEG microstates before and after treatment. Furthermore, this study examines the disparities in EEG microstates between the healthy control group and patients both pre- and post-administration of medication.
This study revealed that patients with SCZ aged 20–29 years demonstrated a shorter time coverage of microstates class C while demonstrating a significantly higher time coverage of microstates class D than that in those in the remaining three age cohorts. This indicates that patients with SCZ aged between 20 and 29 years might exhibit distinct brain function characteristics, related to the early stages of the disorder. Therefore, increasing age could also be one of the causes of microstate parameter alteration in SCZ.
The microstate D has been revealed by combined fMRI studies to predominantly activate brain networks within the temporal and parietal lobes, integral to functions such as language processing, auditory perception, emotional regulation, and self-reflection, while also exhibiting sensitivity to age-related changes [23, 34]. The time coverage of microstate class D in Group_1 is significantly greater than that observed in Groups 2, 3, and 4, as illustrated in Fig. 3. Conversely, both the time coverage and occurrence of microstate Class B are notably reduced. This indicates that SCZ may impair the connectivity of neural networks, resulting in diminished efficiency in information processing or abnormal activation of perceptual systems during critical stages of brain development. Microstates class D are associated with default mode networks (DMN), as demonstrated by Custo et al. [35] and Michel and Koenig [36] through their resting-state brain network studies. Furthermore, Klaassens et al. [37] revealed that the functional connectivity between the precuneus and posterior cingulate cortex within the DMN tends to decrease with age. In this research, the heightened microstate Class D parameters detected in patients with SCZ aged from 20 to 29 years might signify age-related modifications in functional connectivity within the DMN.
These younger patients exhibit distinct microstate parameter changes than older patients, suggesting different pathophysiological patterns during the early stages of SCZ. With the progression of SCZ, particularly in older patients, the boundary between internal and external realities becomes more difficult to maintain [38], possibly contributing to age-related disparities in microstate dynamics [22]. The observed variations in microstate class D parameters might be linked to the plasticity of the brain and the early development of the disease in this age group. Therefore, changes in microstate class D parameters could serve as neurophysiological markers for early diagnosis or monitoring of the progression of the disease, especially in patients undergoing brain maturation.
The results depicted in Fig. 3 exhibited that patients aged 30 to 39 years with SCZ demonstrated significantly lower time coverage, and occurrences of microstate class B and D than that both older patient cohorts. The observed decline in microstate class B, which is commonly linked to sensory integration and external stimuli processing, suggests that patients within this age range may experience deficits in perceptual processing or responsiveness to environmental cues, potentially resulting in diminished efficiency in their interactions with the surroundings. Additionally, the temporal dynamics of microstates, including class B, demonstrate complex age-related changes, with notable differences observed during both adolescence and later stages of life. Microstate class B shows a pattern of decreased mean duration and occurrence as age progresses in healthy individuals, consistent with developmental transitions from adolescence to adulthood [39]. Similarly, in patients with SCZ aged 30 to 39 years, the time coverage and occurrence of microstate class B were lower than those observed in older cohorts, suggesting the critical transition between the maturation and stabilization phases of neurophysiological development.
The time coverage and occurrence of microstate class B reached their lowest point in patients aged 20 to 29 years, a finding that deviates from the trends witnessed in healthy populations, where these parameters are typically stable from early adulthood. This suggests that microstate class B parameters in patients with SCZ may be particularly sensitive to disruptions during the transition from the maturation to stabilization phases of neurophysiological development. These age-related alterations in microstate dynamics might suggest the underlying neurodevelopmental processes and continuous adjustments in brain function that are characteristics of SCZ. The results from the previous study [40], which showed a lawful evolution of microstate variables across the lifespan in healthy individuals, suggested that such age-related changes might be biologically pre-determined processes influencing age-specific cognitive functions and behaviors. However, these processes appear to be disrupted in SCZ, leading to distinct patterns of microstate dynamics.
Furthermore, this study demonstrated that individuals within this age group exhibited significantly lower parameters (time coverage and occurrence) for microstate class D than other age cohorts. Similar decrements in microstate class D have been noted in psychosis spectrum patients, irrespective of age [41]. In the context of SCZ, the observed diminution in microstate class D among individuals in this age group might reflect modifications in the attentional network, which is in line with the findings from the broader psychosis literature [42]. Therefore, consistency among different studies reinforces the concept that a decline in microstate class D is specific to psychosis, potentially functioning as an early biomarker for the onset of psychosis.
In the medication follow-up studies, patients with first-episode SCZ who were not receiving medication exhibited higher microstate class C parameters (mean duration, time coverage, and occurrence) and lower time coverage of microstates class D than healthy controls, in accordance with previous study findings [14, 43]. da Cruz et al. [15] proposed that the dynamics of microstate classes C and D are a candidate endophenotype for SCZ. Consistently, this study validates the specific alterations witnessed in EEG microstates among patients with SCZ, suggesting that abnormalities in microstate classes C and D might be one of the important features of SCZ.
Previous literature has demonstrated [32, 44] that pharmacological interventions for neuropsychiatric disorders can induce changes in EEG topography or EEG microstate parameters. Untreated patients with FEP exhibited significantly lower microstate class A parameters than healthy controls, as illustrated in Fig. 5, indicating a potential attenuation of neural activity associated with perception and the processing of external information. Conversely, microstate class C parameters were increased, possibly reflecting heightened self-awareness or internal thought processes, consistent with the symptoms of SCZ. Patients with SCZ demonstrated significant enhancements in microstate parameters following an 8-week inpatient treatment period. Moreover, all parameters of microstate class C and certain parameters of microstate class A demonstrated no significant differences between patients treated for 8 weeks and healthy controls, suggesting that the microstate dynamics to levels comparable to those of healthy individuals were effectively restored by treatment. The findings are further corroborated by Kikuchi et al. [12], who reported that patients exhibiting a positive response to antipsychotic medication demonstrated elevated microstate class A parameters post-treatment. This suggests that antipsychotic medications may play a pivotal role in modulating microstate dynamics in patients with SCZ. The results illustrated in Fig. 7 highlight these observations, revealing that patients subjected to an 8-week pharmacological regimen experienced significant alterations in both microstate classes A and C parameters compared to their pre-treatment baseline. Thus, these findings provide critical insights into the neurophysiological changes occurring during the treatment of first-episode SCZ, offering valuable references for clinical interventions.
This study had some limitations. Firstly, a healthy controls comprehensive comparison between the microstates of patients with SCZ across different physiological development stages could not be performed owing to the restricted age range of healthy controls. Secondly, because of the absence of a specific drug selected by the physician for treatment among the therapeutic drugs administered to the patient, namely risperidone, amisulpride, clozapine, and quetiapine fumarate, it remains uncertain which drug would exert an impact on the microstate parameters and consequently yield discernible results. Finally, a recent study [45] has underscored the robust retest reliability of microstate analysis, irrespective of the clustering algorithm used and the number of electrodes utilized for measurement and recording. However, the outcomes of microstate analysis may be influenced by factors such as EEG preprocessing techniques and the selection of time-smoothing parameters. Hence, a standardized protocol for microstate analysis must be established, and comprehensive details on EEG preprocessing must be provided to ensure the reproducibility of future studies.
In this paper, for the first time, schizophrenic patients are divided into four groups based on physiological developmental stages, and the changes in EEG microstates are explored. Our results demonstrate significant variations in resting-state EEG microstates among patients, contingent upon their developmental stage, particularly concerning microstate classes B and D. Specifically, individuals in the brain maturation phase (ages 20 to 29) demonstrate an increase in class D parameters, thereby reflecting unique neurophysiological patterns characteristic of this critical stage of brain development. Patients in the stabilization phase (ages 30 to 39) demonstrate reductions in class B parameters, suggesting that the parameters of patient microstate class B might be particularly sensitive during the transition of neurophysiological development. We speculated that microstate classes B and D could act as biomarkers for discriminating differences between patients at various stages of physiological development, suggesting valuable perceptions for individualized precision treatments. Furthermore, our 8-week follow-up treatment exhibits that EEG microstates, particularly class A and C, can effectively exemplify heterogeneous differences pre- and post-treatment. This suggests their potential utility as objective diagnostic markers to evaluate the efficacy of clinical rehabilitation.
The dataset we possess contains sensitive information, such as the fundamental demographic details of patients diagnosed with schizophrenia. In accordance with the ethical agreement established with the hospital, please contact the corresponding author to request access to the dataset.
Data curation: XT, LD, SS. Software: SL, YC, SS. Formal analysis: SL, GT, YC. Writing original draft: SL, LD, and XT. All authors contributed to editorial changes in the manuscript. All authors read and approved the final manuscript. All authors have participated sufficiently in the work and agreed to be accountable for all aspects of the work.
The study was carried out in accordance with the guidelines of the Declaration of Helsinki and approved by the Ethics Committee of Zigong Mental Health Center (Ethic Approval Number: 2023016), and all of the patients or their families/legal guardians provided signed informed consent.
Not applicable.
Funding for this study was provided by the National Natural Science Youth Foundation of China (Grant No. 12304469) and the Science and Technology Bureau of Zigong City (Grant No. 2022-NKY-03-06); Neither organization had any further role in the design, data collection, analysis and interpretation, report writing, or decision to submit the paper for publication.
The authors declare no conflict of interest.
References
Publisher’s Note: IMR Press stays neutral with regard to jurisdictional claims in published maps and institutional affiliations.