


 , Chenyu Fan 1,2,†, Haozheng Li 1,2,†, Yu Tong 1,2, Shuang Lin 1,2, Yashuo Feng 1,2,3, Fengzhi Liu 1,2, Chunrong Bao 4, Hongyu Xie 1,2,*
 , Yi Wu 1,2,*
1 Department of Rehabilitation Medicine, Huashan Hospital, Fudan University, 200040 Shanghai, China
2 National Center for Neurological Disorders, Huashan Hospital, Fudan University, 200040 Shanghai, China
3 School of Rehabilitation Science, Shanghai University of Traditional Chinese Medicine, 201203 Shanghai, China
4 Shanghai Mental Health Center, Shanghai Jiao Tong University School of Medicine, 200030 Shanghai, China
†These authors contributed equally.
Abstract
This study investigates the reliability of functional near-infrared spectroscopy (fNIRS) in detecting resting-state brain network characteristics in patients with mild cognitive impairment (MCI), focusing on static resting-state functional connectivity (sRSFC) and dynamic resting-state functional connectivity (dRSFC) patterns in MCI patients and healthy controls (HCs) without cognitive impairment.
A total of 89 MCI patients and 83 HCs were characterized using neuropsychological scales. Subject sRSFC strength and dRSFC variability coefficients were evaluated via fNIRS. The study evaluated the feasibility of using fNIRS to measure these connectivity metrics and compared resting-state brain network characteristics between the two groups. Correlations with Montreal Cognitive Assessment (MoCA) scores were also explored.
sRSFC strength in homologous brain networks was significantly lower than in heterologous networks (p < 0.05). A significant negative correlation was also observed between sRSFC strength and dRSFC variability at both the group and individual levels (p < 0.001). While sRSFC strength did not differentiate between MCI patients and HCs, the dRSFC variability between the dorsal attention network (DAN) and default mode network (DMN), and between the ventral attention network (VAN) and visual network (VIS), emerged as sensitive biomarkers after false discovery rate correction (p < 0.05). No significant correlation was found between MoCA scores and connectivity measures.
fNIRS can be used to study resting-state brain networks, with dRSFC variability being more sensitive than sRSFC strength for discriminating between MCI patients and HCs. The DAN-DMN and VAN-VIS regions were found to be particularly useful for the identification of dRSFC differences between the two groups.
ChiCTR2200057281, registered on 6 March, 2022; https://www.chictr.org.cn/showproj.html?proj=133808.
Keywords
- functional near-infrared spectroscopy
- mild cognitive impairment
- resting state
- brain network
The human brain is a highly complex network with dynamic and interdependent coordination among different groups of neurons. Mild cognitive impairment (MCI) is a common cognitive disorder among the elderly, with a prevalence ranging between 9.7% and 23.3% in the Chinese elderly population. The incidence is higher among women than men and more prevalent in rural areas than when compared to urban regions [1]. MCI primarily affects key cognitive domains, including memory, attention, language, executive function and spatial cognition, often accompanied by a decline in motor functions [2, 3, 4]. Early identification of MCI is critical for preventing further cognitive decline and reducing the risk of progression to dementia.
Many studies in the field of neuroimaging use functional magnetic resonance imaging (fMRI) as a brain imaging tool to explore the characteristics of resting-state brain networks associated with MCI [5, 6, 7]. Study has suggested that the brain network characteristics of resting-state functional near-infrared spectroscopy (fNIRS) in MCI patients are closely related to the degree of cognitive impairment [8], potentially serving as a sensitive indicator of cognitive state. The biological principle of fNIRS detection is based on neurovascular coupling [9], which is an important physiological mechanism in the human brain and anomalous neurovascular coupling has been associated with the development of cognitive deficits and clinical symptoms in neurodegenerative diseases such as Alzheimer’s disease (AD) [10, 11]. fNIRS uses near-infrared light (600–900 nm), which penetrates the scalp and skull to measure concentration changes in oxyhemoglobin (HbO) and deoxyhemoglobin (HbR) in the cortex, reflecting neural activity. When patients engage in cognitive tasks, neurons in specific brain regions become active, consuming local HbO, which is converted into HbR. To compensate for oxygen consumption, cerebral blood vessels dilate, increasing blood flow to the area, resulting in an overcompensation phenomenon, where HbO levels increase, and HbR levels decrease [12]. Compared to fMRI, fNIRS offers higher temporal resolution, lower cost, portability and good tolerance to artifacts [12, 13, 14, 15]. These features make it particularly suitable for clinical assessment scenarios.
Functional connectivity (FC) is a commonly used indicator representing the collaborative activity of different brain regions in terms of function, that is, their consistency exhibited over time. The FC characteristics in MCI patients are significantly influenced by statistical models, and there is heterogeneity in the study [16]. Most studies support the notion that MCI patients exhibit abnormal FC patterns mainly in the default mode network (DMN) related regions [16, 17].
Recent study has found that the characteristics of resting-state fNIRS are closely related to cognitive function [8]. Static resting-state functional connectivity (sRSFC) refers to the correlation of intrinsic, spontaneous neural activity in the time series when subjects are not performing specific tasks, reflecting the information exchange between different brain networks. Nguyen et al. [18] found that MCI patients exhibited abnormal patterns with higher sRSFC strength within the right hemisphere and between hemispheres compared to healthy controls (HCs). Zhang et al. [19] identified that long-range sRSFC abnormalities from the prefrontal cortex to the occipital lobe are sensitive features for distinguishing MCI patients from HCs, with MCI patients showing reduced sRSFC between the bilateral prefrontal cortex, right temporal lobe, parietal lobe and occipital lobe. Yang et al. [20] found that rehabilitation training alters the sRSFC patterns in MCI patients, thereby improving their cognitive function. Research related to sRSFC assume that the interaction strength between brain regions is constant and static during the measurement period [21]. However, sRSFC is highly non-stationary across different time windows and dynamic resting-state functional connectivity (dRSFC) can reveal the flexibility of dynamic functional coordination between different brain networks [22]. The results of Niu et al. [23] suggested that the coefficient of variation (CV) of dRSFC in MCI patients was higher than that in HCs.
Despite these insights, studies using fNIRS to analyze both sRSFC and dRSFC in MCI patients remain limited and yield inconsistent results. This study addresses that gap by employing a custom-designed 70-channel fNIRS cap for enhanced spatial resolution, with a custom-designed probe arrangement optimized for cognitively related cortical regions, including MCI patients and HCs. This enabled a detailed analysis of brain networks and examination of interactions among six specific functional networks, including the sensorimotor network (SEN), default mode network (DMN), ventral attention network (VAN), dorsal attention network (DAN), frontoparietal network (FPN), and visual network (VIS). This network-oriented analysis enables more detailed insights into network-specific alterations compared to traditional connectivity approaches. Additionally, both sRSFC and dRSFC metrics were integrated to assess their relative sensitivity in distinguishing MCI patients from HCs. To capture the temporal dynamics of connectivity, a variability coefficient was introduced for dRSFC, offering deeper insights into how network interactions fluctuate over time.
This study advances previous research by combining static and dynamic connectivity analysis, expanding spatial coverage through a 70-channel fNIRS system, and introducing network-specific analyses. These contributions enhance the understanding of MCI-related brain network changes and demonstrate the potential of fNIRS for practical, early-stage cognitive assessments.
89 MCI patients who met the inclusion criteria were selected from Shanghai. Additionally, 83 HCs were individually matched with MCI patients in gender, age, height, weight and other basic information were recruited.
The criteria for diagnosing MCI, as established by Petersen et al. in 1999 [24], are as follows: (1) Subjective memory complaints reported by either the individual or an informant; (2) Measurable deficits in memory or other cognitive functions that are 1–2 standard deviations (SDs) below the average for the person’s age and education level; (3) Daily living activities not significantly impacted; (4) The individual does not meet the criteria for dementia. Participants were aged between 60 and 85 years, had an education level of more than six years and had no significant visual or auditory impairments. They completed a neuropsychological assessment and were diagnosed as MCI patients by a neurologist according to the diagnostic standards of the Petersen research team. Their vital signs were stable. Prior to commencing the experiment, all participants were thoroughly informed about the study research objectives and procedures, agreed to participate in the study and signed an informed consent form.
Neuropsychological scale assessments were conducted on MCI patients and HCs, including screening and diagnostic scales. The screening scale included the Montreal Cognitive Assessment Scale (MoCA). Diagnostic scales included the Hopkins Verbal Learning Test-Revised (HVLT-R), Visual Discrimination Test (VDT), Digital Span Test (DST) and Verbal Fluency Test (VFT). The results of the screening scales were included in the statistical analysis as cognitive scores. All scale assessments were completed by uniformly trained neuropsychological testers and subjects cooperated well during the assessments. The ethics committee at Huashan Hospital, Fudan University [approval number: HIRB-2021-653], granted approval for this study. This clinical trial was approved by the Clinical Research Information Service of China, a publicly accessible primary registry that is part of the WHO International Clinical Trial Registry Platform. The trial was officially registered on March 6, 2022, and assigned the registration number ChiCTR2200057281.
A multi-channel fNIRS imaging system (NirScan-8000, Danyang Huichuang Medical Equipment Co., Ltd., Danyang, Jiangsu, China) was employed to acquire oxygenated blood signals from the cerebral cortex of subjects in a resting state. The sampling rate for all channels was set at 11 Hz, utilizing near-infrared light at wavelengths of 760 nm and 850 nm. A customized fNIRS headcap was developed to meet the experimental requirements, designed in accordance with the 10/20 electrode placement system and adjusted for the specific characteristics of each subject. The cap featured 48 probes (24 emitters and 24 detectors) strategically placed across the cortex, with 30 mm inter-probe spacing, creating a 70-channel network as illustrated in Fig. 1A. This arrangement was specifically designed to cover key regions of interest including the prefrontal cortex, temporoparietal junction and parietal cortex, which are significant areas for cognitive function and potentially affected in MCI. Channel locations were determined using a three dimensional (3D) magnetic digitizer (Patriot Digitizer, Polhemus Inc., Colchester, VT, USA) on a standard head model and subsequently normalized to the Montreal Neurological Institute (MNI) space. The MNI coordinates were then visualized using MATLAB’s BrainNet Viewer toolbox (version 2022B; The MathWorks Inc., Natick, MA, USA) with the BrainMesh_ICBM 152 template (version 2009a, International Consortium for Brain Mapping, MNI, McGill University, Montreal, QC, Canada) (Fig. 1B). Finally, each channel’s MNI coordinate was mapped to specific brain regions using the Broadmann Talairach template [25].
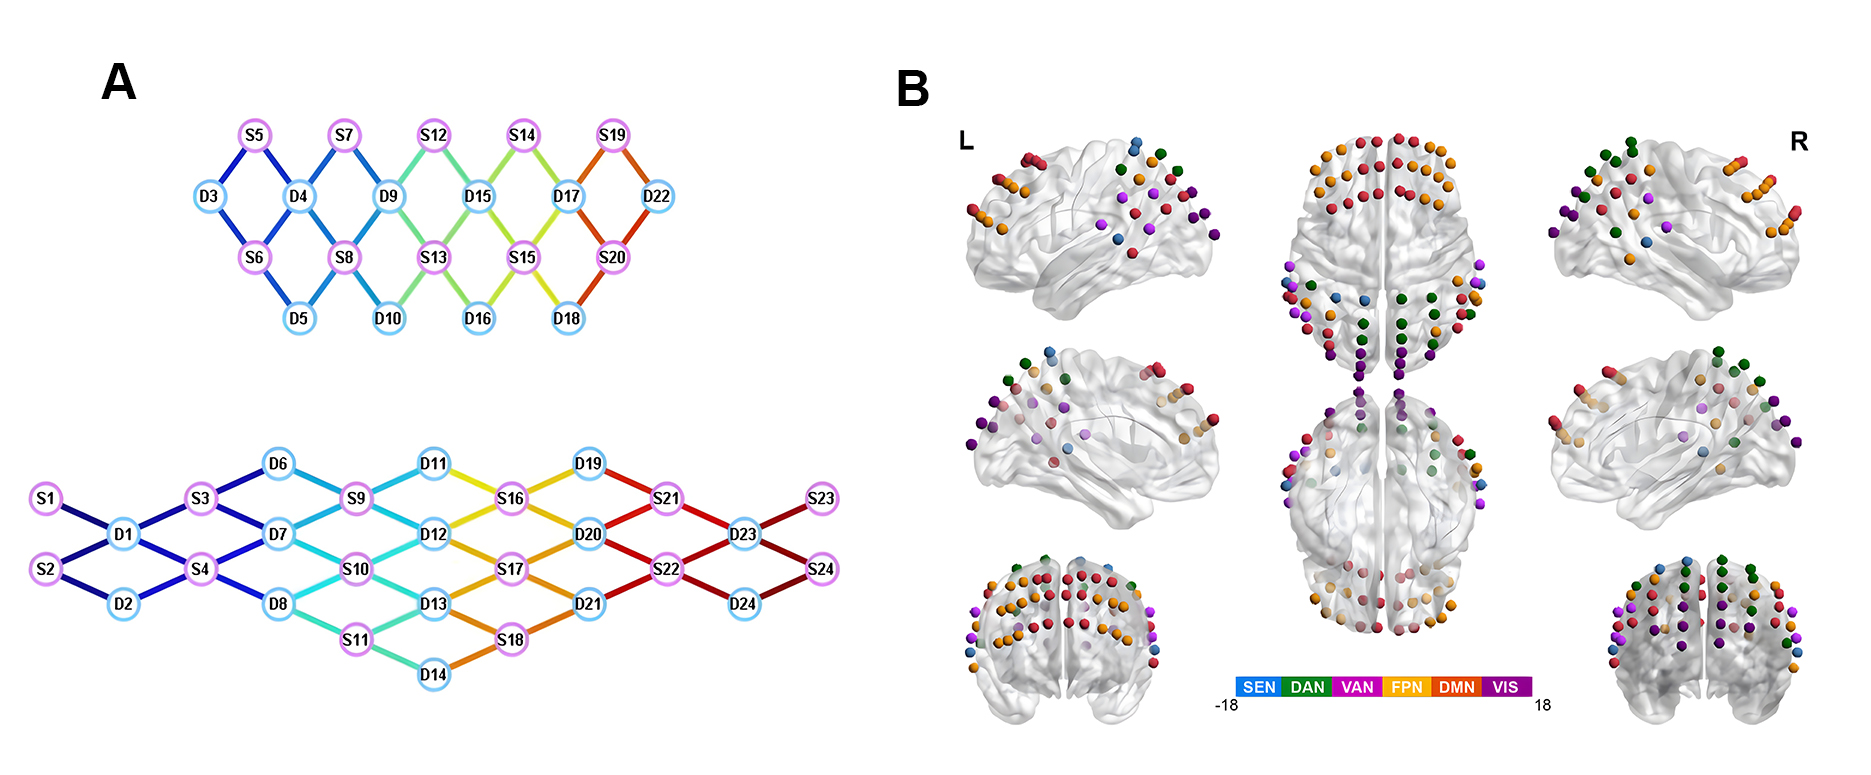 Fig. 1.
fNIRS head cap diagram. (A) Topology of fNIRS sensors. (B) Spatial distribution of the 70 channels on the cerebral cortex. fNIRS, functional near-infrared spectroscopy; SEN, sensorimotor network; DAN, dorsal attention network; VAN, ventral attention network; FPN, frontoparietal network; DMN, default mode network; VIS, visual network.
Channels were divided into six regions of interest (ROIs) according to the cortical brain network partitioning method proposed by Yeo et al. [26], including SEN, DMN, VAN, DAN, FPN, and VIS networks. The schematic diagram of cortical brain network ROI is shown in Fig. 1B.
After entering the assessment room, subjects were seated quietly for three minutes. This acclimation period allowed participants to adapt to both the fNIRS cap and the environment, which helped minimize the impact of environmental adaptation on subsequent data collection. After the adaptation period, the fNIRS device commenced formal data acquisition. Subjects were instructed to close their eyes, avoid rhythmic thinking and remain still throughout the eight-minute resting-state fNIRS recording. The total experimental session lasted 11 minutes.
Preprocessing was employed to remove various noise sources from the fNIRS signals. The light intensity signal data collected by fNIRS were first converted into optical density (OD) signals as follows:
The OD signals were then converted into concentrations of HbO and HbR using the
modified Beer-Lambert law [27] and the change in OD
(
This study used a band-pass filter with a frequency range of 0.01–0.1 Hz to denoising hemoglobin signals by removing long-term baseline drift and systematic physiological noises, such as pulse and respiration, while preserving task-related neural activity signals [19, 23, 29]. This approach enabled the extraction of low frequency hemodynamic fluctuations [30]. Previous study has shown that in near-infrared light detection at wavelengths of 700–900 nm, the signal-to-noise ratio of HbO is higher than that of HbR [27]. Therefore, HbO was selected in this study for the calculation of resting-state brain network-related indicators.
The Pearson correlation coefficient between any two channels over the entire time series for each subject was calculated and defined as the sRSFC strength.
A sliding window method was used to estimate the dRSFC between any two measurement channels for each subject. The time window was defined as 60 seconds, moving along the entire time course at 1-second intervals. In each time window, the Pearson correlation was calculated for each pair of measurement channels. With eight minutes of resting-state measurement time and a 60-second time window, there were 480 sliding time windows, resulting in 480 dRSFC maps.
The methods for calculating sRSFC and dRSFC are illustrated in Fig. 2. To quantify the degree of dynamic fluctuations in dRSFC correlation maps over different time windows, the CV of dRSFC was introduced and calculated as follows:
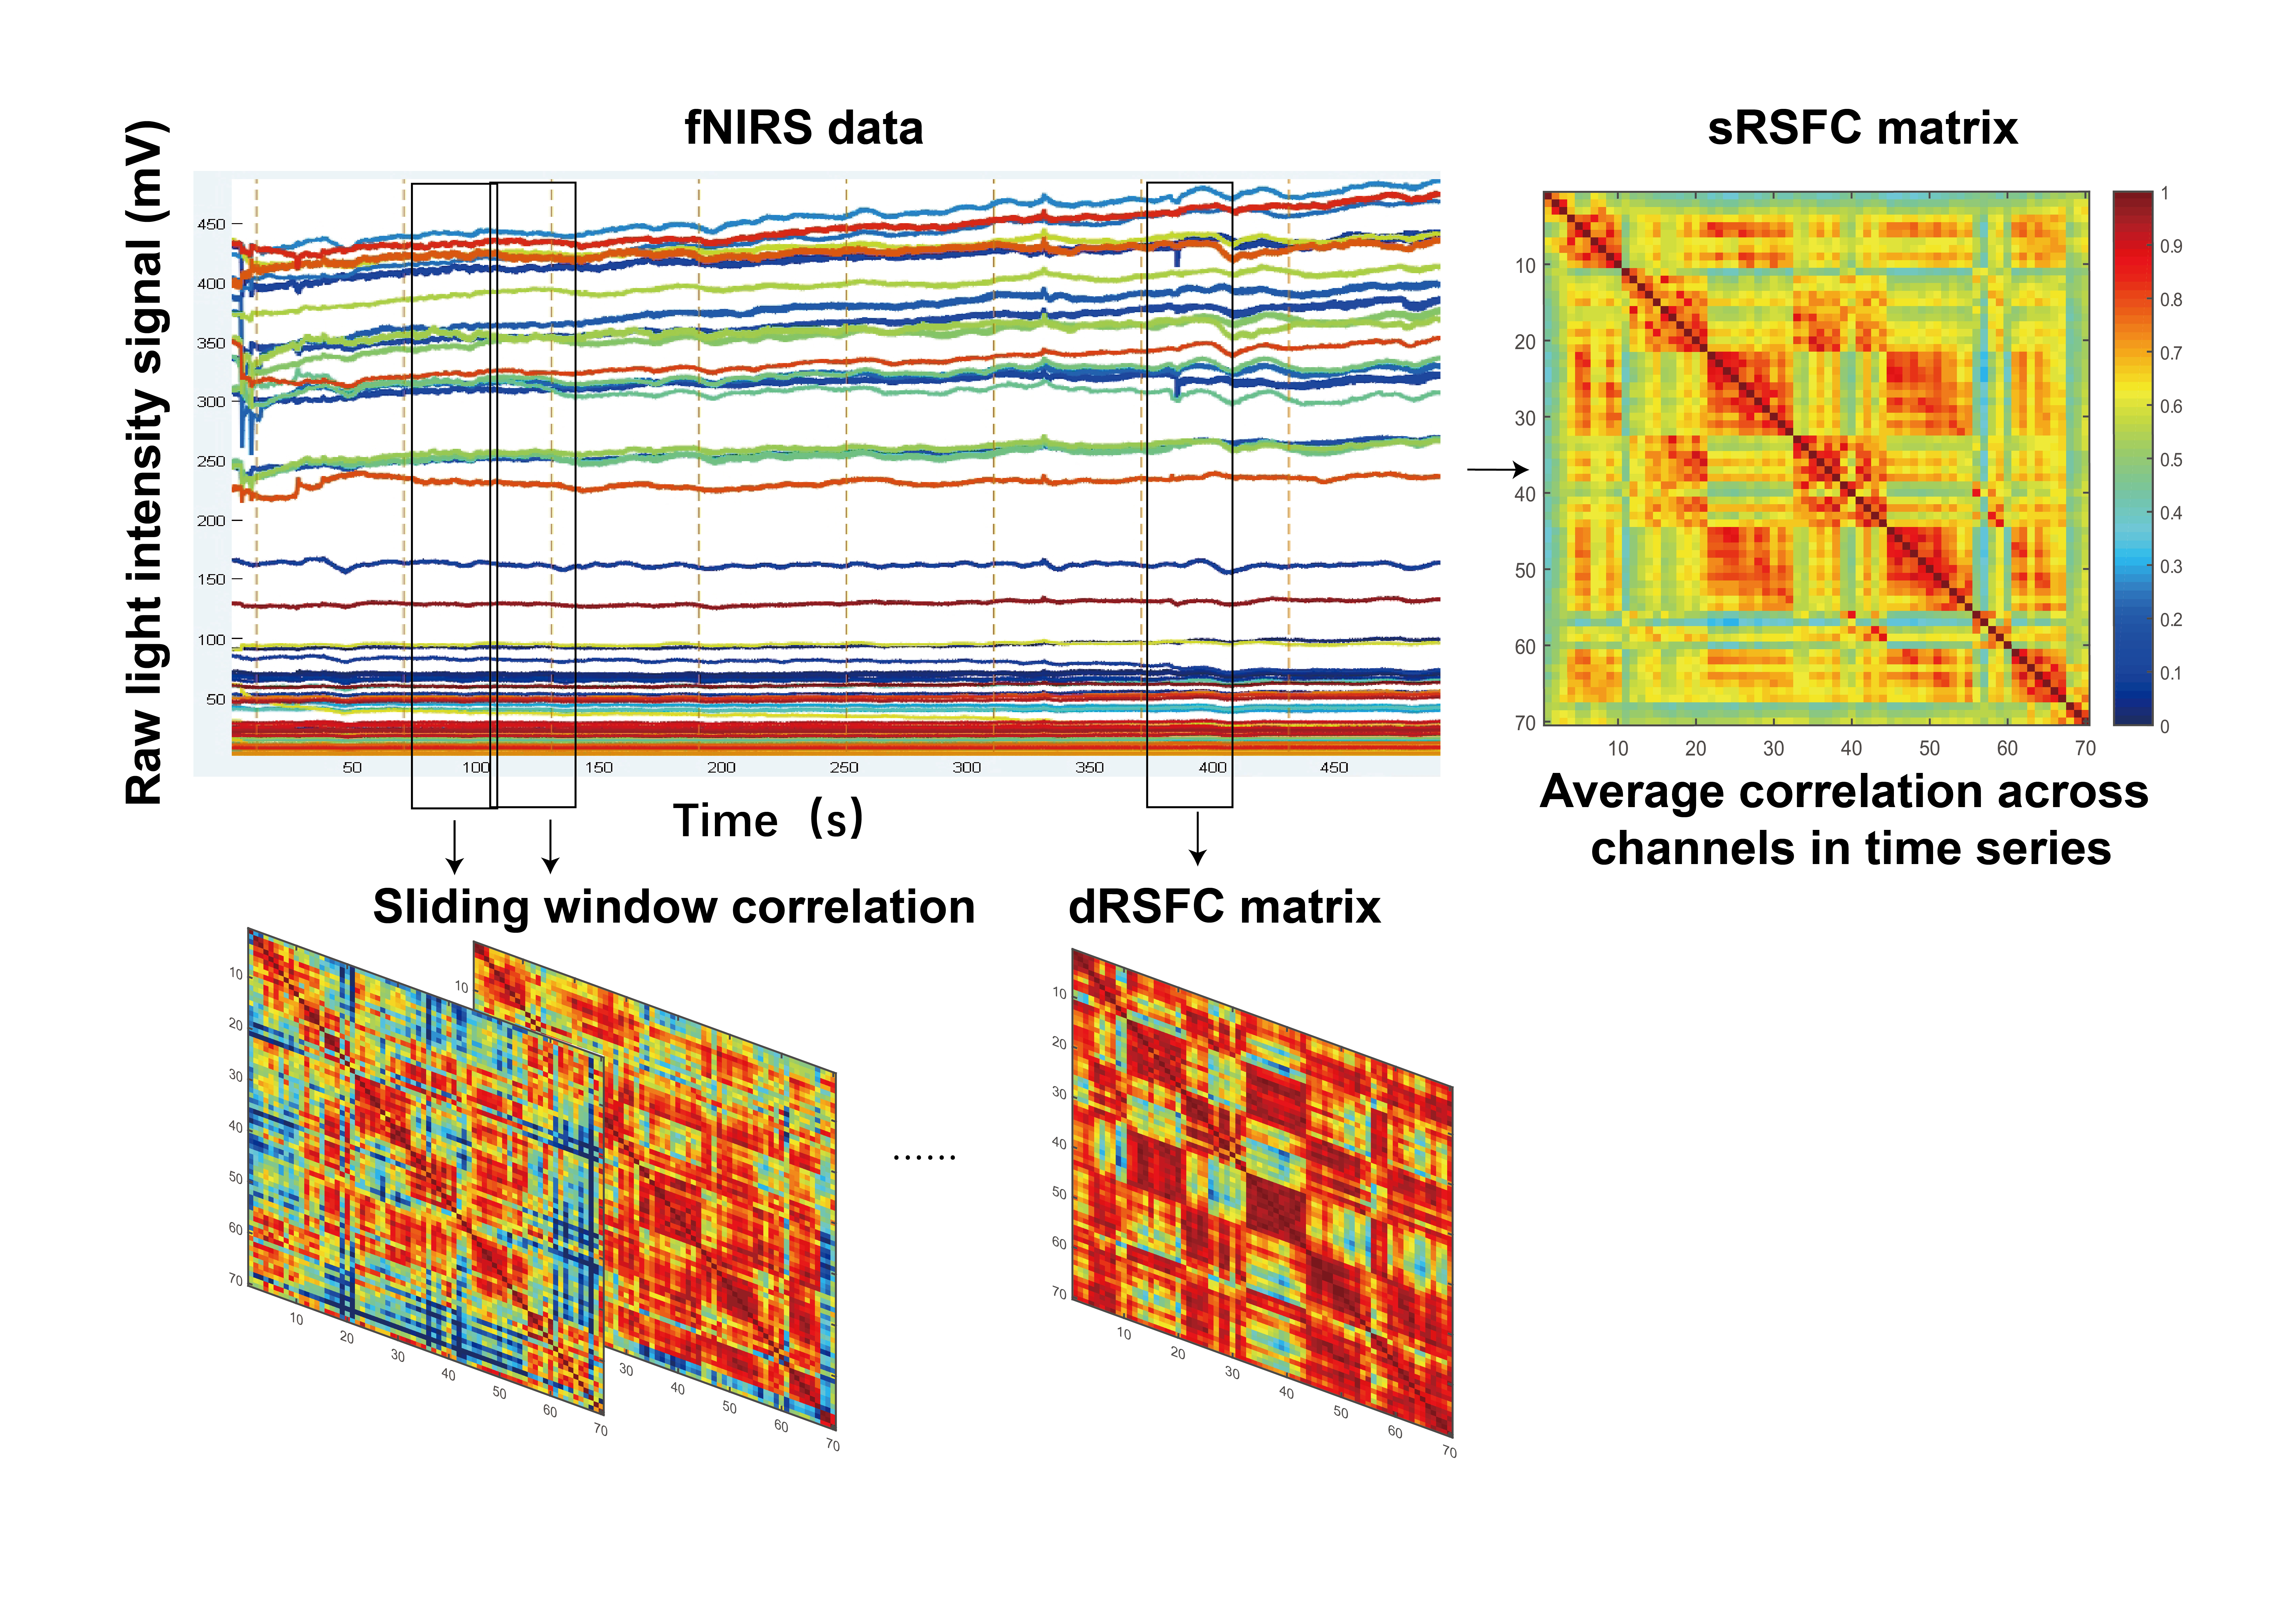 Fig. 2.
Schematic diagram of sRSFC and dRSFC calculation methods. sRSFC, static resting-state functional connectivity; dRSFC, dynamic resting-state functional connectivity.
A higher CV value indicates greater variability in dRSFC, while a lower CV value suggests less variability in dRSFC.
The baseline demographic and clinical characteristics of the two groups were balanced and comparable. Statistical analyses of basic information and behavioral indicators were conducted using independent sample t-tests, Mann-Whitney U tests and chi-square tests. The Shapiro-Wilk test assessed the normality of all continuous variables. Independent sample t-tests were performed for normally distributed data, while Mann-Whitney U tests were applied for non-normally distributed data. Chi-square tests analyzed gender, a categorical variable.
Independent sample t-tests assessed the sRSFC strength and dRSFC CV
between the two groups, with significance set at p
Pearson correlation analysis examined the relationship between cognitive scores and resting-state brain network characteristics in both groups. Cognitive scores were based on MoCA scale scores and resting-state brain network characteristics included sRSFC strength and dRSFC CV within and between ROIs.
Based on the demographic data, the MCI group consisted of 89 subjects with an
average age of 74.43 years (SD: 6.75), while the HC group included 83 subjects
with an average age of 73.48 years (SD: 6.11). Gender distribution was similar
between the groups, with the MCI group comprising 32 males and 57 females and the
HC group comprising 32 males and 51 females. There were no significant
differences between the MCI and HC groups in terms of the baseline
characteristics of height (MCI: 161.78
Neuropsychological assessment revealed that the cognitive function of the MCI
group was significantly lower than that of the HC group. The MCI group scored
significantly lower on the MoCA total score compared to the HC group (p
| Scales | MCI (n = 89) | HC (n = 83) | p-value | |
| MoCA | 20.54 |
25.83 |
||
| HVLT-R | ||||
| Learning (1–3) | 13.52 |
17.62 |
||
| Delayed Recall (5 min) | 2.83 |
5.65 |
||
| The Visual Discrimination Test (VDT) | ||||
| Functional Association | 3.39 |
3.67 |
0.004 | |
| Semantic Association | 2.99 |
3.29 |
0.118 | |
| Visual Recognition | 5.52 |
5.72 |
0.481 | |
| Visual Reasoning | 4.44 |
6.44 |
||
| DST | ||||
| Forward | 6.04 |
7.44 |
0.034 | |
| Backward | 3.63 |
4.96 |
0.003 | |
| VFT | ||||
| Vegetables | 13.55 |
14.60 |
0.368 | |
| Fruits | 9.27 |
10.97 |
||
| Idiom | 3.08 |
5.68 |
||
MCI, mild cognitive impairment; HC, healthy controls; MoCA, Montreal Cognitive Assessment; HVLT-R, Hopkins Verbal Learning Test-Revised; DST, Digital Span Test; VFT, Verbal Fluency Test.
The sRSFC strength for the MCI group was 0.598
Further analysis indicated that there were no significant differences in sRSFC strength within SEN, DAN, VAN, DMN, FPN and VIS homologous brain networks or between heterogeneous brain networks in both groups (Supplementary Fig. 2).
Statistical analysis revealed that the sRSFC strength within homologous brain
networks was significantly greater than the average strength between
heterogeneous brain networks in both groups (p
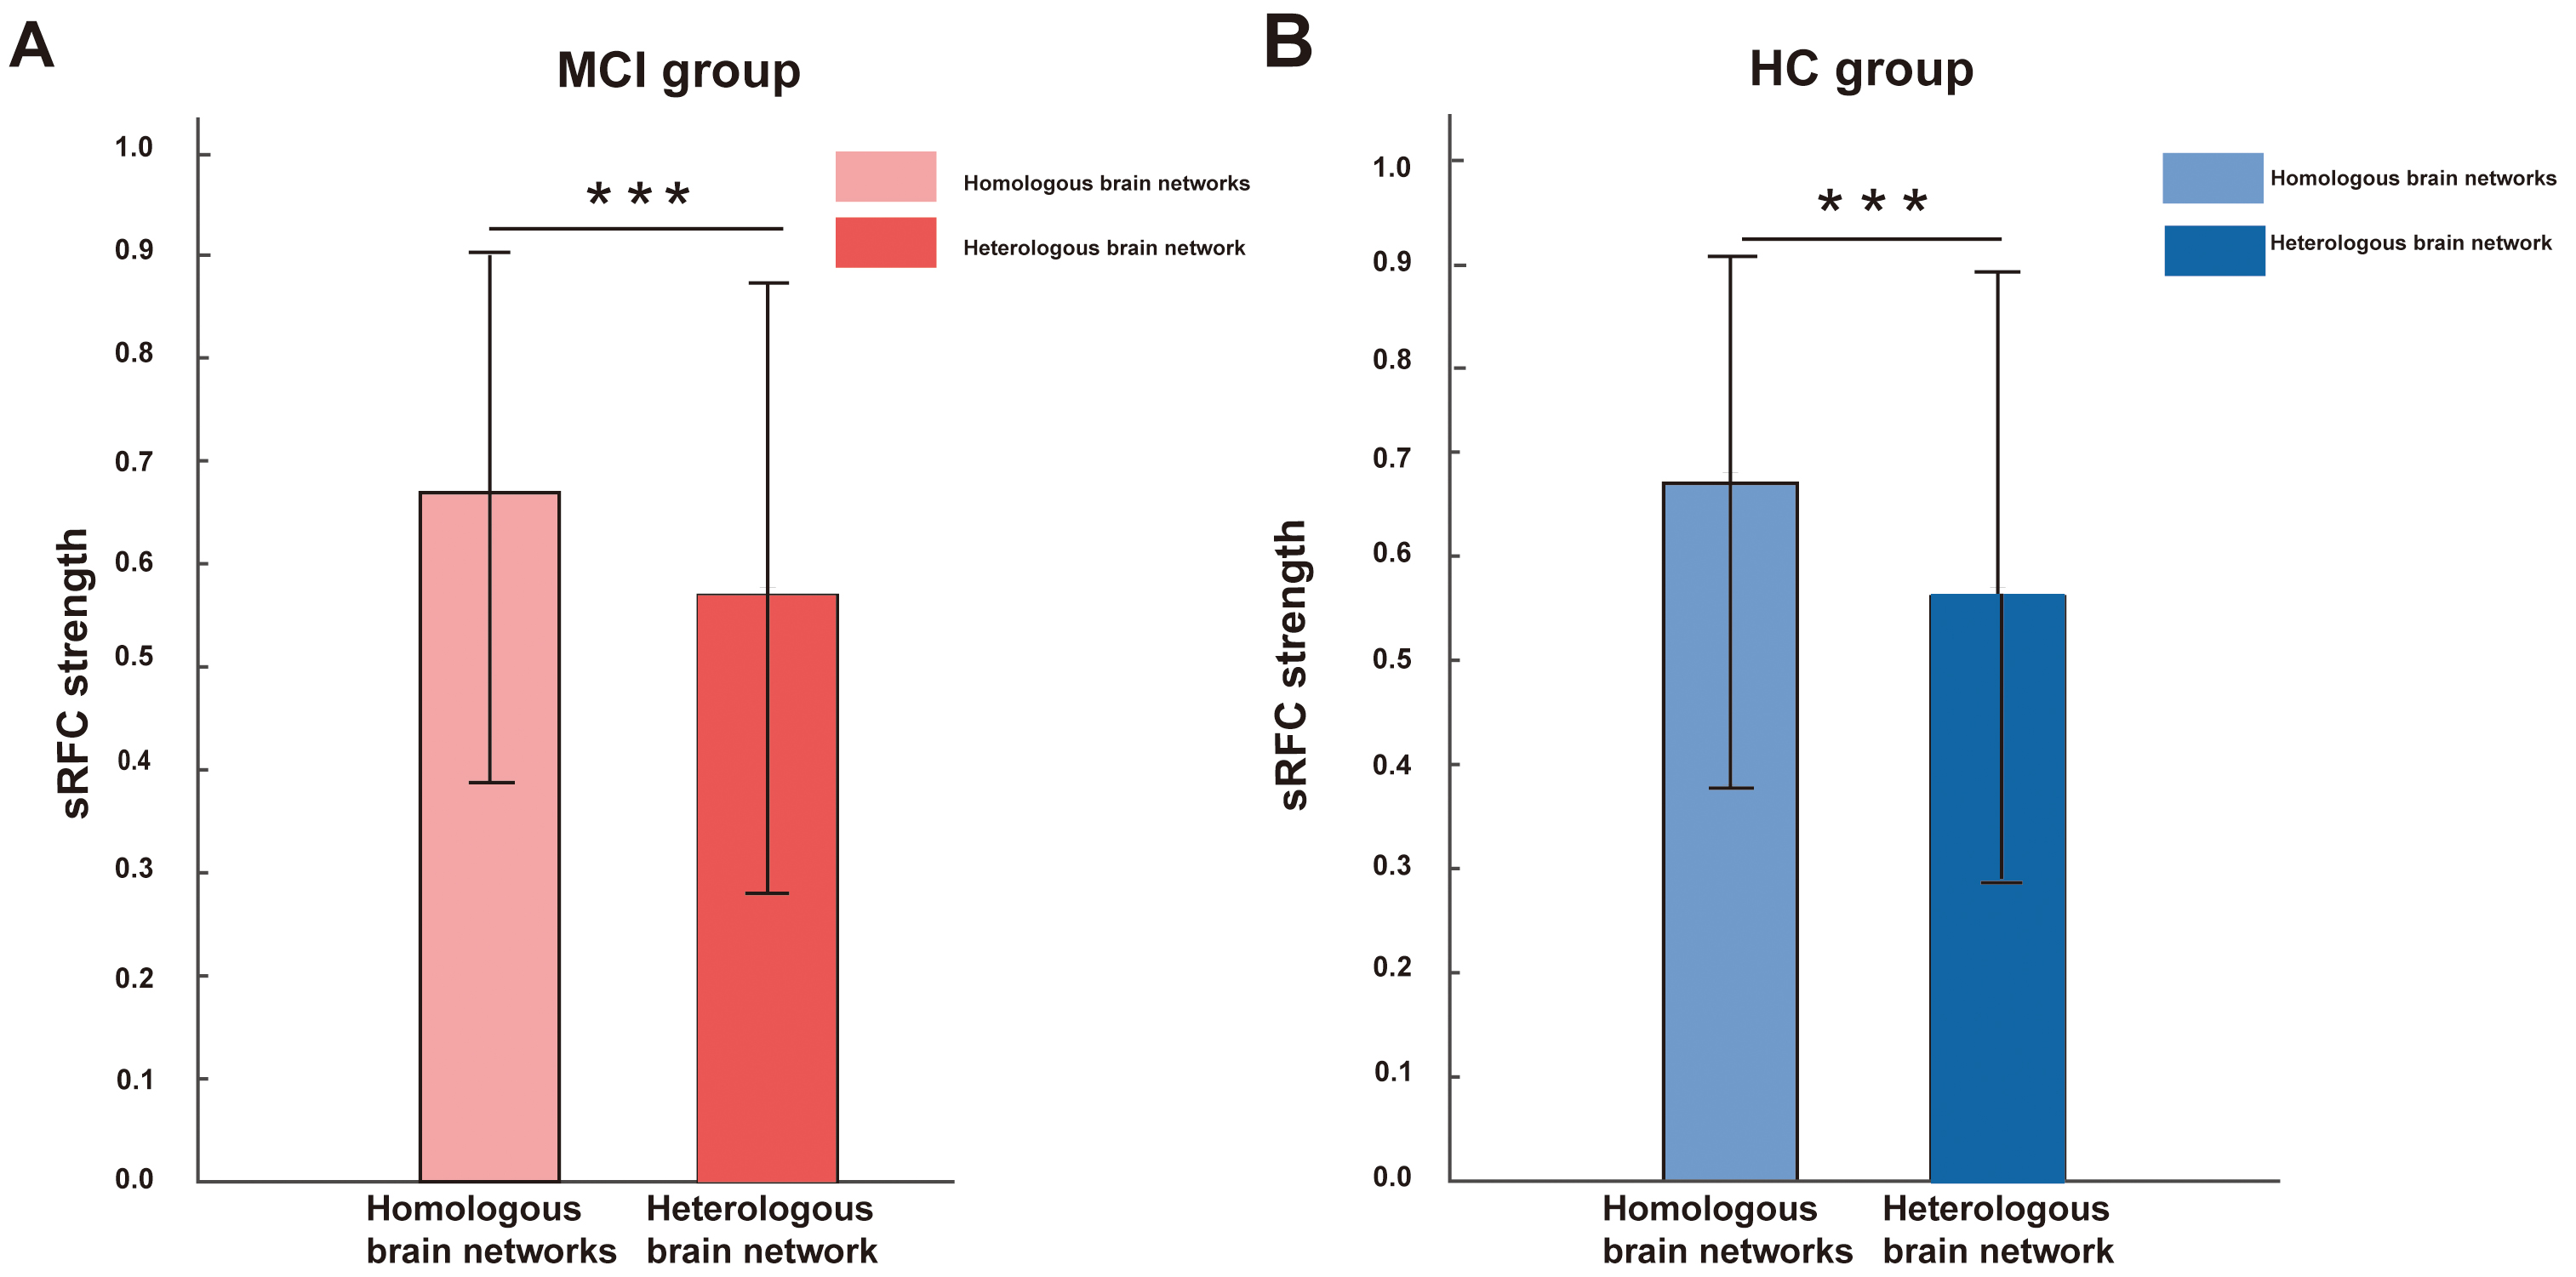 Fig. 3.
Comparison of sRSFC
characteristics within homologous brain networks and between heterologous brain
networks. (A) MCI group; (B) HC group. sRSFC
refers to the Pearson correlation coefficient between any two channels over the
entire time series for each subject. “***” indicates p
The dRSFC CV for the MCI group was 0.522
At the brain network level, differences in dRSFC variability were analyzed
between the two groups. Statistical results revealed that the dRSFC CV between
DAN-DMN and VAN-VIS brain networks in the MCI group was significantly lower than
that of the HC group (p
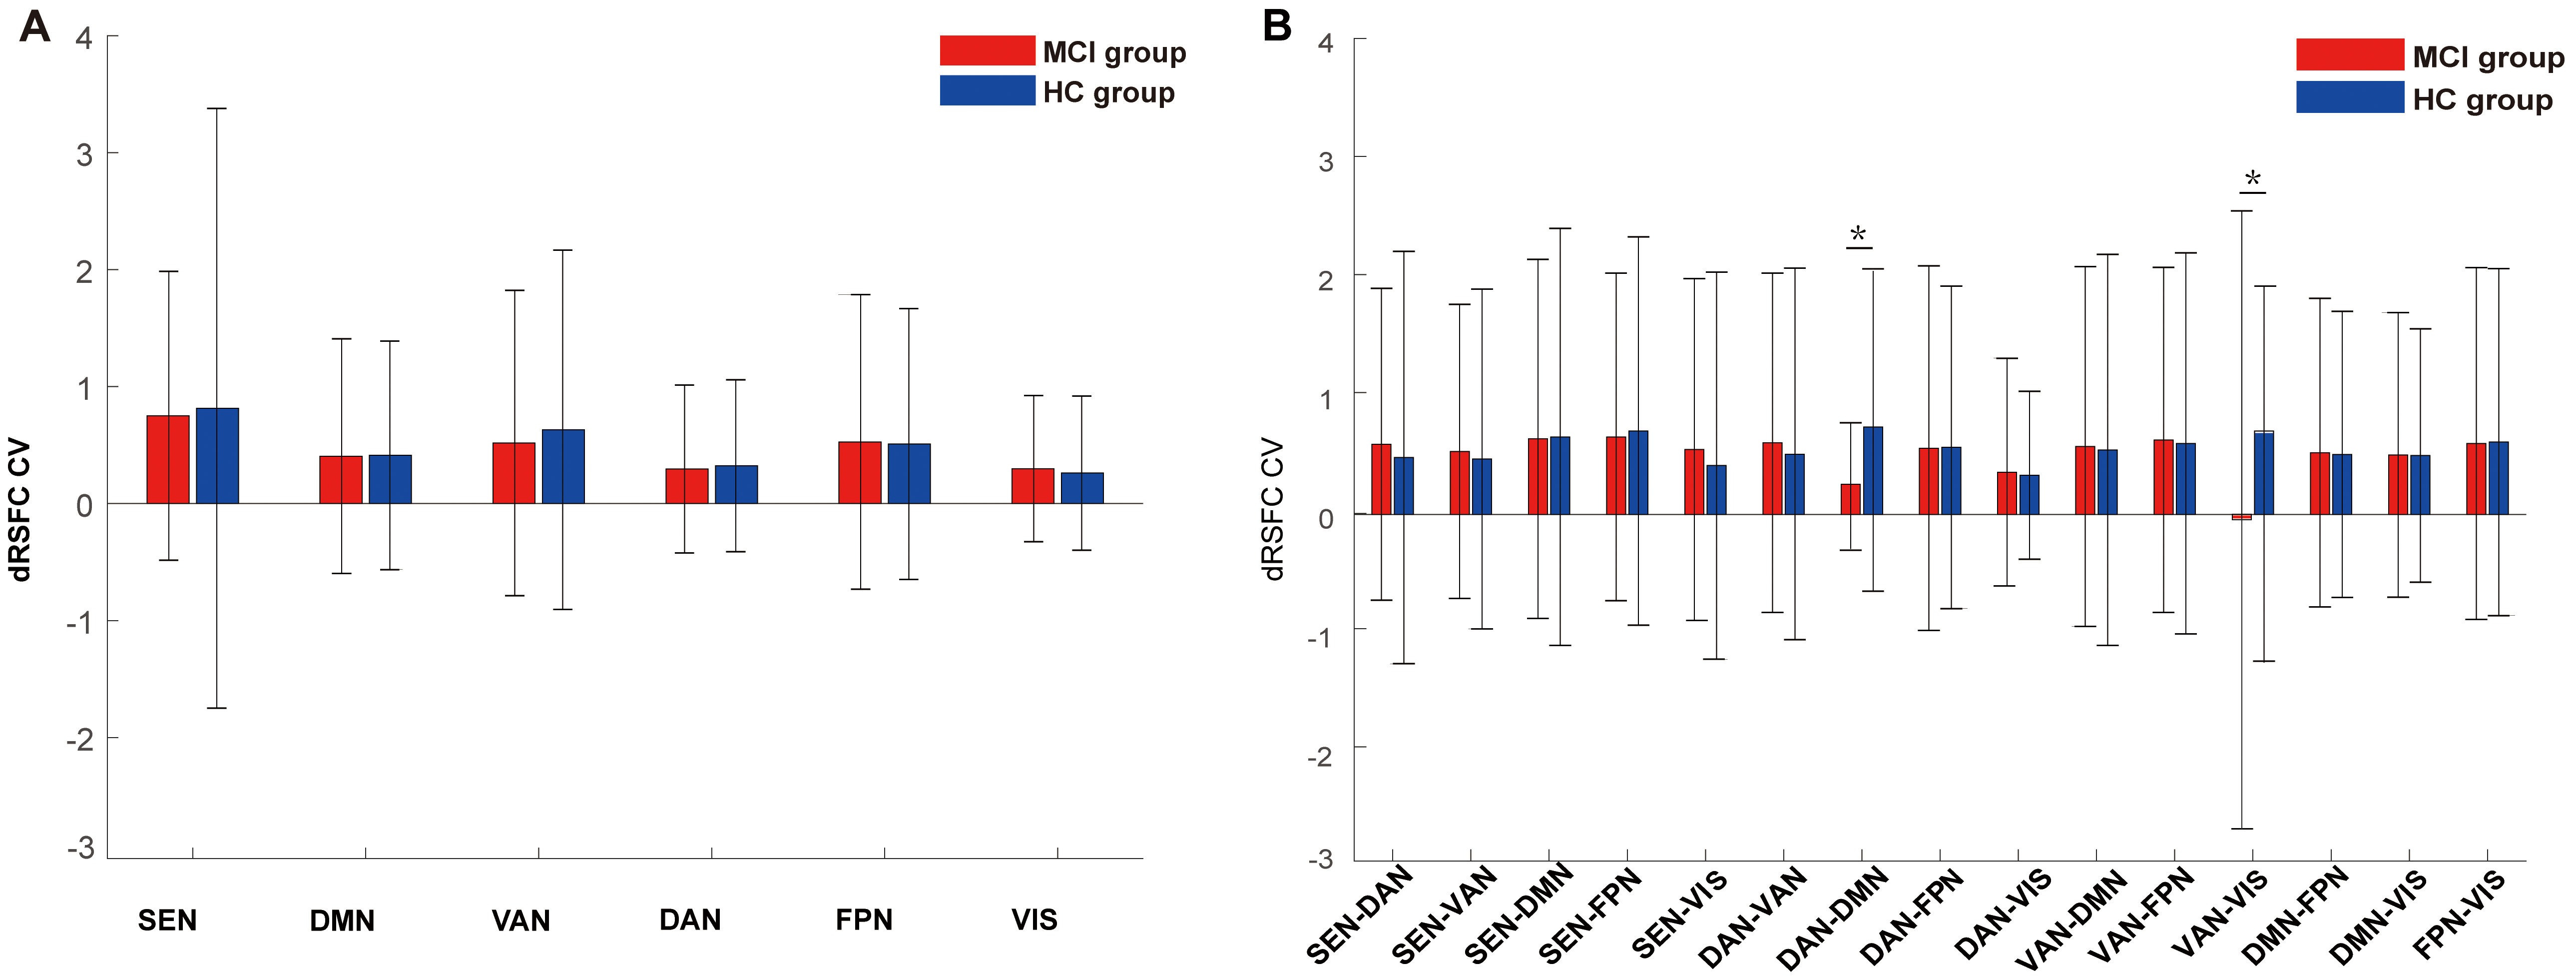 Fig. 4.
The dRSFC CV in brain networks. (A) dRSFC CV within homologous
brain networks; (B) dRSFC CV between heterologous brain networks. CV, coefficient
of variation. “*” indicates p
Visualization of the sRSFC strength, dRSFC CV and their correlation for the two
groups of subjects is shown in Fig. 5. Visually, the sRSFC strength and dRSFC CV
in the MCI and HC groups showed opposite trends, with higher sRSFC strength
accompanied by lower dRSFC CV. Correlation results indicated a strong and
significant negative correlation between sRSFC strength and dRSFC CV in the MCI
group (r = 0.757, p
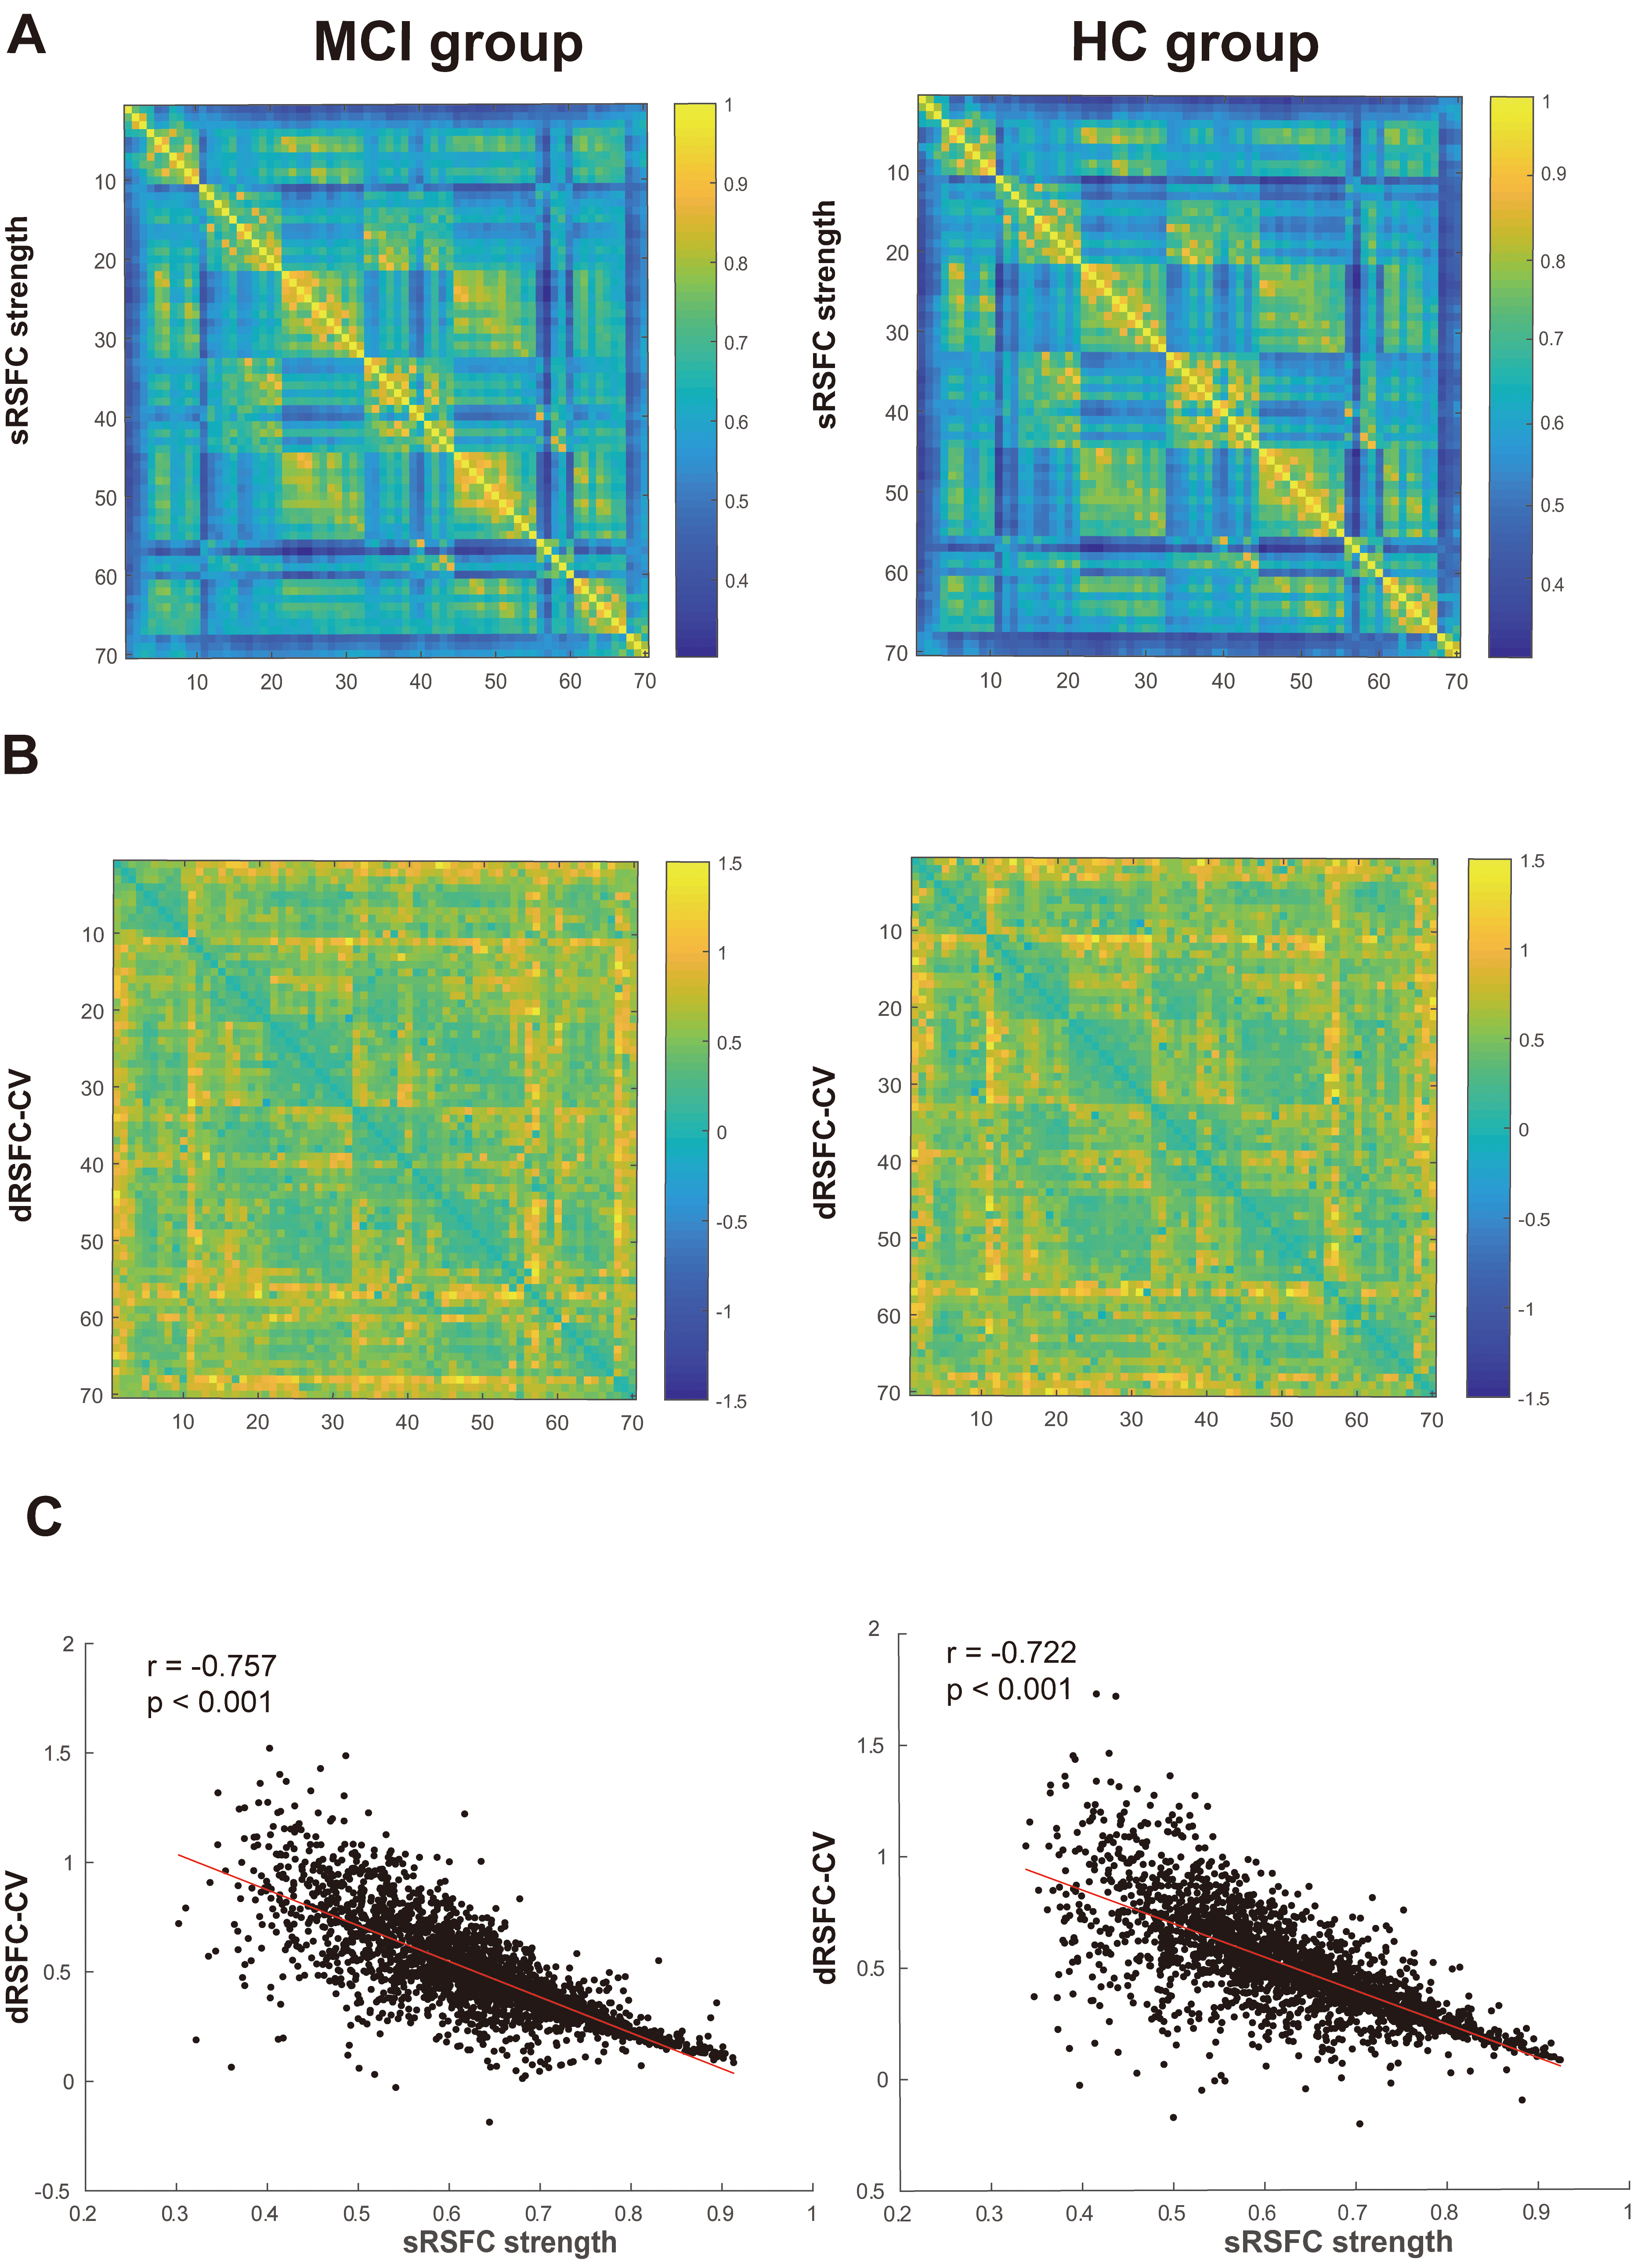 Fig. 5.
Characteristics and correlation of sRSFC and dRSFC in two groups of subjects. (A) sRSFC strength matrix diagram. The X and Y axes represent the 70 measurement channels covering different brain regions, each element in the matrix reflects the sRSFC strength between two channels. The color bar on the right side of the heat map ranges from 0 to 1, where higher values (closer to yellow) represent stronger FC between channels and lower values (closer to blue) represent weaker connectivity. (B) dRSFC coefficient of variation matrix diagram. The X and Y axes represent the 70 measurement channels covering different brain regions, the matrix in this figure reflects the dRSFC CV between channels. The color bar ranges from –1.5 to 1.5, with positive values (closer to yellow) indicating higher variability in dRSFC across time and negative values (closer to blue) indicating lower variability. This representation helps capture the dynamic nature of brain connectivity, highlighting fluctuations in the temporal coordination between brain regions. (C) Scatter plot of the correlation between dRSFC CV and sRSFC strength. FC, functional connectivity.
Individual-level correlation analysis results for 172 subjects also showed a
significant positive correlation between sRSFC strength and dRSFC CV (p
Pearson correlation analysis results showed no correlation between sRSFC
strength, dRSFC CV within homologous brain networks or between heterologous brain
networks and MoCA total scores in the two groups of subjects (p
This study demonstrated that fNIRS is can be used to evaluate RSFC characteristics in MCI. With regard to sRSFC strength and the dRSFC CV, it explored the differences in resting-state brain network characteristics between MCI and HC subjects. Analysis showed that the average sRSFC strength of the two groups exhibited higher values within homologous brain networks than between heterologous brain networks. Both group-level and individual-level analyses showed a significant negative correlation between the dRSFC CV and sRSFC strength. This confirms the feasibility of using fNIRS to detect resting-state brain network characteristics. The analysis of resting-state brain network characteristics between the MCI and HC groups found that, compared to sRSFC, dRSFC was more sensitive in revealing differences between the two groups, particularly between the DAN-DMN and VAN-VIS brain networks.
Currently, MCI-related brain network characteristics mainly result from fMRI-related studies [32, 33]. However, MCI has a high incidence rate and patients often have MCI that does not prompt them to seek medical attention. fNIRS, with its small size, ease of operation and lack of noise interference during detection, is well suited to the assessment of MCI in community settings. When compared to fMRI, the application of fNIRS in the resting state is still at an early stage. Zhang et al. [34] found that the seed point correlation method under fNIRS achieved good test-retest reliability for sRSFC data. Li et al. [35] were the first to validate the feasibility of dRSFC-related indicators using whole-cortex fNIRS time series and sliding window correlation methods. That study verified the feasibility of exploring resting-state brain network characteristics based on fNIRS. The results of the current study were consistent with previous reports [22], finding that the average sRSFC strength within ROIs was significantly lower than between ROIs, a result verified in both groups of subjects.
This study used the sliding window method to explore the temporal characteristics of dRSFC based on fNIRS and found that dRSFC exhibited large dynamic fluctuations over time. Further analysis confirmed a significant negative correlation between the dRSFC CV and sRSFC strength at both group and individual levels. This result was consistent with previous findings, where Li et al. [35] observed a significant negative correlation between the CV of dRSFC and sRSFC strength when validating the use of fNIRS for dRSFC detection, and this conclusion was verified at both group and individual levels. These results indicate that the dynamic features observed in the resting-state brain are caused by actual brain fluctuations rather than physiological noise or artifacts. Overall, this study confirmed that fNIRS can be used to evaluate RSFC characteristics in MCI.
In recent years, the integration of fNIRS with machine learning and deep learning approaches has witnessed a growing application in the detection of MCI, with multiple studies exploring its effectiveness and potential as a novel biomarker for MCI [36, 37]. Notably, compared to traditional statistical analyses, machine learning and deep learning approaches can better capture changes in brain functional characteristics of MCI patients. For instance, Yang and Hong [38] employed fNIRS combined with machine learning approaches to quantitatively assess brain function during resting state. Their results demonstrated that a mere 30 s measurement of the resting-state with fNIRS could be used to detect MCI, achieving a high accuracy of 95.81% through a representation and classification-based transfer learning methods using pre-trained convolutional neural network models. This finding provides strong evidence for the potential application of fNIRS in rapid community-based screening.
Building on these advances, multiple research groups have further explored various machine learning and deep learning architectures, including t-maps, linear discriminant analysis, and support vector machines [39, 40, 41, 42]. These studies have not only improved diagnostic accuracy but also revealed the significant value of temporal dynamic features and region-specific analysis in MCI detection. Future research should further explore the application of these methods in clinical practice and expand their potential in treatment monitoring and efficacy evaluation, thereby developing fNIRS-based machine learning approaches into effective tools for screening and clinical intervention assessment.
This study extracted sRSFC strength and dRSFC CV data from resting-state brain networks based on fNIRS as characteristic values to describe the brain network activities of the two groups of subjects. Previous studies have found that cognitive impairment in AD may be related to damage to anatomical integrity and abnormal FC between brain networks, described as disconnection syndrome [43, 44]. As an intermediate state between normal aging and AD, MCI also has the characteristics of disconnection syndrome [45]. The results of this study found that sRSFC strength could not be used as an indicator to distinguish MCI patients from HC individuals, as there were no significant differences in average sRSFC strength at the whole brain level, within homologous brain networks and between heterologous brain networks levels. Further analysis found that the dRSFC CV was more sensitive in distinguishing MCI patients from HC individuals than the sRSFC strength. This part of the study found that the dRSFC CV between DAN-DMN and VAN-VIS brain networks was significantly lower in MCI patients than in HC individuals. Similar to previous studies, Fu et al. [46] did not observe abnormalities in sRSFC in AD patients but found evidence of disrupted dynamic characteristics in dRSFC. Niu et al. [23] found that MCI and AD patients had significantly increased dRSFC coefficients of variation when compared to HC individuals and the dRSFC CV had good classification performance in distinguishing MCI patients from HC individuals. These findings support the proposition that dRSFC is more sensitive than sRSFC for the description of resting-state brain network characteristics in cognitively impaired populations. Currently, there is limited evidence about dRSFC based on fNIRS and future studies could explore this in more detail.
The lack of significant differences in sRSFC characteristics between HCs and MCI subjects may relate to brain network-based analytic methods. Previous studies have used various fNIRS resting-state analysis methodologies to distinguish between the two groups. Nguyen et al. [18] found that interhemispheric and intrahemispheric connections in the right hemisphere were significantly higher in the MCI group than in HCs. Zhang et al. [19] found that long-range connections from the prefrontal cortex to the occipital lobe effectively distinguished MCI subjects from HCs, with the MCI group having significantly reduced long-range connectivity in this area. Zeller et al. [47] found that spontaneous low-frequency oscillations in the parietal lobe were significantly lower in the MCI group than in HCs. Bu et al. [48] found that reduced levels of effective connectivity might be a marker for cognitive impairment in the MCI group. The heterogeneity of these studies suggests that differences in sRSFC strength and dRSFC CV in the MCI population may be related to ROI division, analytical methods, the number of subjects and the degree of cognitive impairment. In early studies of the dRSFC CV, homologous, heterologous and both long and short-range intrahemispheric connections were often used to distinguish subject characteristics [23, 26]. Therefore, future studies could further standardize the characteristics of the enrolled population and data analysis methods, compare the differences in results across the various ROI divisions and accumulate more evidence for the use of resting-state fNIRS in the diagnosis of MCI patients.
Differences in dRSFC CVs between MCI subjects and HCs were mainly observed between the DAN-DMN and VAN-VIS brain networks. The DAN, also referred to as the task-positive network, is characterized by activation in its central regions during attention-demanding tasks [49] and mediates external processing and attention-demanding cognitive functions [50, 51]. It primarily involves attention orientation and task execution and is closely related to the FPN and VIS, with an antagonistic relationship to the DMN and jointly maintaining the brain’s dynamic balance. This property makes it a sensitive brain network for distinguishing HCs from MCI subjects [52, 53]. The DMN is a task-negative network associated with deactivating arduous tasks during attention execution [52] and is engaged during internal processing [50, 53]. It is highly active in the resting state and participates in various cognitive processes such as memory, recall, emotion regulation and social cognition [54]. Previous studies have often identified the DMN as a sensitive brain region for distinguishing MCI subjects from HCs, closely related to the dementia process [17, 55]. The reduced anticorrelated activity between DMN and DAN has been observed as part of the normal aging process, this anticorrelation seems to reflect the brain’s network interactions and may serve as an essential neural substrate for flexibly allocating attentional resources, which is important for normal cognitive function [56]. Studies have also demonstrated that the anticorrelation between the DMN and DAN was decreased in MCI and AD participants. Moreover, dysconnectivity between the DMN and DAN might be potential predictors of AD progression [49, 57, 58]. The observed decrease in dRSFC variability between DAN and DMN in MCI patients may reflect impaired dynamic rebalancing between internally and externally directed attention, leading to a poor modulation of attentional processes in response to shifting cognitive demands and inefficiency in processing cognitive resources. This alteration is associated with the gradual decline of cognitive function. Similarly, the VAN is involved in orienting attention to unexpected stimuli [59]. It has been highlighted as one of the most important functional networks of interest for cognition and the temporal dynamics of VAN was correlated with global cognition in AD [60]. The VIS brain network, located in the occipital lobe in the posterior brain, plays an essential role in visual cognitive tasks by facilitating the perception and processing of visual stimuli [61]. Zhang et al. [19] have also suggested that long-range connections from the prefrontal cortex to the occipital lobe are sensitive biomarkers for distinguishing MCI subjects from HCs. Yener et al. [62] found that amnesiac MCI affects the visual cognitive network but not the visual sensory network. Collectively, higher resting-state VAN-VIS connectivity may indicate a more alerting state in preparation for upcoming stimuli. In contrast, lower connectivity may be insufficient to offset brain damage and gradually lead to cognitive dysfunction [63].
Previous studies have rarely involved the mechanisms of the VIS brain network in the cognitive impairment process of MCI patients. Future studies could further explore the correlation and causal relationship between neuropsychological scale scores in various cognitive domains and the dRSFC CV in brain networks and introduce state identification methods such as k-means clustering to further explore related mechanisms. These findings suggest that cognitive impairment in MCI patients is related to disruptions in dRSFC patterns and the related mechanisms need further exploration.
The MoCA is a widely recognized brief cognitive screening tool used to assess the following cognitive domains: memory, executive functioning, attention, language, visuospatial and orientation [64]. The absence of a significant correlation between MoCA scores and RSFC metrics could be due to several factors. First, sRSFC and dRSFC metrics reflect FC patterns during rest, which may not align precisely with the cognitive domains assessed by the MoCA. Increasing evidence suggests that both structural and functional changes occur in the brains of MCI patients [65], and these changes may not be fully captured by resting-state connectivity alone.
Another important consideration is the functional network connectivity patterns are highly complex. While reduced FC is commonly reported in healthy aging and AD, MCI is characterized by more intricate and heterogeneous changes in network connectivity, with myriad and often conflicting reports of both increases and decreases in network connectivity [58, 66, 67]. Therefore, a single composite MoCA score may not comprehensively reflect the relationship between the complex FC patterns and cognitive function, which may explain the lack of significant correlation with RSFC strength and CV.
Additionally, three canonical large-scale networks—the default network (DN), DAN and frontoparietal control network (FPCN)—have been established as stable features of brain functional architecture during both task engagement and resting states [68]. The FC within the DN, DAN and FPCN declines in typical aging [69, 70, 71, 72] and changes are accelerated in AD [58, 73, 74]. These within-network declines co-occur with changes in between network connectivity and this shifting network architecture may be compensatory in MCI [58, 74]. Failure of this system may mark the transition to the clinical phase of the disease. Whether this compensatory-like pattern of network dynamics is preserved or disrupted in MCI remains uncertain. These contributing factors were not fully accounted for in the current analyses, thereby potentially attenuating the associations between RSFC metrics and global cognitive scores like the MoCA.
This study has several limitations. First, using fNIRS to detect resting-state brain network dRSFC characteristics is a relatively new area and the accurate mapping of dynamic brain FC patterns remains an empirical challenge. Various methods exist for calculating dRSFC; this study employed a classic sliding window method. Future research could use time-frequency coherence analysis methods, such as wavelet transform, to provide more detailed descriptions of the temporal specificity of dynamic brain activity. Second, compared to fMRI, fNIRS allows for longer multiple data collections. This study’s cross-sectional design may have introduced inter-individual differences. Future studies could conduct repeated measures on the same subjects, calculating dRSFC characteristics across multiple time windows to further assess the feasibility of the methods. Additionally, while this study supports a neurophysiological basis for the observed negative correlation between sRSFC intensity and dRSFC CV, the potential influence of other factors, including mathematical properties, cannot be entirely ruled out, and future research should consider these aspects in interpretation. Third, the lack of significant correlations between neuropsychological assessment scores and sRSFC strength or dRSFC CV in this study may be attributed to limitations in the comprehensiveness of the assessment scales used or insufficient granularity in brain network parcellation. Future research should consider employing a more comprehensive set of cognitive evaluation tools and finer-grained brain network parcellation methods to better capture the relationships between cognitive domains and brain network characteristics. Lastly, fNIRS is limited to cortical evaluations and cannot assess deep brain structures such as the hippocampus and medial temporal lobe, thus limiting the comprehensive exploration of MCI patients’ pathological mechanisms.
Future research should incorporate appropriate cognitive tasks to further evaluate MCI subjects and HCs, to reveal characteristics of brain activity under task conditions. Resting-state fNIRS provides insight into basic brain activity in a natural state, reflecting dynamic connectivity patterns of intrinsic networks. Task-state fNIRS reveals cortical activation patterns during specific tasks, assessing cognitive performance and brain activation mechanisms in MCI subjects. Integrating resting-state and task-state fNIRS data is a potential direction of study, to aid in a more comprehensive understanding of brain function and dynamic regulation mechanisms. It is an approach that could provide new perspectives and methods for fNIRS-related neuroimaging and cognitive science research.
This study confirms the feasibility of using fNIRS to investigate resting-state brain network characteristics. The findings indicate that dRSFC is more effective than sRSFC in distinguishing MCI subjects from HCs. Specifically, alterations in dRSFC patterns between the DAN-DMN and VAN-VIS brain networks in MCI subjects serve as sensitive biomarkers, suggesting that cognitive impairment is associated with disruptions in dRSFC patterns.
The original findings and data from this research are fully documented within the article; any additional questions can be directed to the corresponding authors for further elucidation.
CYF, HYX and YW designed the study. GHY, CYF and HZL performed experiments, YT, SL, YSF, FZL and CRB provided assistance in data acquization. CYF and HZL analyzed the fNIRS data and completed visualization. GHY, CYF and HZL drafted the manuscript. GHY revised the manuscript. HYX and YW acquired funding, supervised and reviewed the manuscript. All authors contributed to editorial changes in the manuscript. All authors read and approved the final manuscript. All authors have participated sufficiently in the work and agreed to be accountable for all aspects of the work.
This study was carried out in accordance with the guidelines of the Declaration of Helsinki and approved by the Ethics Committee of the Huashan Hospital, Fudan University (approval number: HIRB-2021-653). All participants provided written informed consent prior to their involvement in the study. Furthermore, written consent was obtained from each individual to publish any potentially identifiable images or data featured in this article.
The authors thanks to Dr. Jing Wei, Dr. Yuanyuan Song, Professor Daifa Wang, Engineer Hang Liang, Engineer Deyu Ji, Professor Meng Li, Ms. Hanfei Li and Dr. Ke Chen for their assistance.
This work was also supported by grants from the National Key R&D Program of China (2018YFC2001700), the Shanghai Science and Technology Innovation Action Plan (No. 20412420200), the Shanghai Municipal Key Clinical Specialty (No. shslczdzk02702), the Fudan University Medical Engineering Integration Project (IDH2310111), the Shanghai 2022 “Science and Technology Innovation Action Plan” medical innovation research special project (22Y31900202), Shanghai Hospital Development Center Foundation—Shanghai Municipal Hospital Rehabilitation Medicine Specialty Alliance (SHDC22023304), Shanghai Municipal Health Commission (20214Y0508), Shanghai Zhou Liangfu Medical Development Foundation “Brain Science and Brain Diseases Youth Innovation Program”.
The authors declare no conflict of interest.
Supplementary material associated with this article can be found, in the online version, at https://doi.org/10.31083/JIN26406.
References
Publisher’s Note: IMR Press stays neutral with regard to jurisdictional claims in published maps and institutional affiliations.