


 , Caiting Gan 1,†, Jiaxin Shi 1, Shiyang Yu 1, Xingyue Cao 1, Huimin Sun 1, Xufeng Wang 1, Xinping Wang 1, Guanqun Wang 1, Yongsheng Yuan 1,*
 , Kezhong Zhang 1,*
1 Department of Neurology, The First Affiliated Hospital with Nanjing Medical University, 210029 Nanjing, Jiangsu, China
†These authors contributed equally.
Abstract
In Parkinson’s disease (PD), levodopa-induced dyskinesia (LID) represents a common motor complication of long-term dopaminergic therapy. Although levodopa remains the most effective treatment for PD, the neurological mechanisms underlying the LID remain incompletely understood. This study aimed to investigate the pattern of cortical morphological and subcortical structural alterations associated with LID in PD.
Clinical data and T1-weighted structural brain images were obtained for 62 patients with PD, including 30 with LID and 32 without LID, along with 30 healthy controls (HCs). Regional sulcal depth (SD) and subcortical volumes were quantified to assess alterations in cortical surface morphology and subcortical structures. The study further aimed to evaluate the association between structural indicators and the severity of LID, as well as to determine their potential diagnostic ability.
PD patients with LID demonstrated reduced regional SD in the right inferior parietal and insula cortices, compared with PD patients without LID and HCs (after Bonferroni correction). The right putamen volume in both PD subtypes was lower than that of HCs (after Bonferroni correction). In particular, the level of right inferior parietal SD was negatively associated with the severity of LID (r = –0.494, p = 0.017). Receiver operating characteristic (ROC) curve analyses further revealed that the combination of cortical SD values demonstrated excellent performance in distinguishing PD-LID from PD-non-levodopa-induced dyskinesia (NLID) (area under the curve [AUC] = 0.913).
Our main findings show that structural alterations associated with LID extend from the frontal to the parietal and insula cortices, suggesting that decreased cortical SD values in these regions may contribute to a better understanding of the neurological underpinnings of LID in PD.
Keywords
- Parkinson’s disease
- dyskinesia
- drug-induced
- cerebral cortex
- putamen
Progressive loss of dopaminergic neurons within the nigrostriatal pathway is an essential characteristic of Parkinson’s disease (PD). With disease progression and prolonged levodopa (L-DOPA) replacement therapy, approximately 40% of patients develop levodopa-induced dyskinesia (LID) within five years of treatment initiation [1]. Peak-dose LID, representing the most prevalent subtype, manifests during peak plasma concentrations of L-DOPA, characterized by non-purposeful choreiform motions [2]. This medication-induced complication has become a principal determinant of disability in late-stage PD, profoundly impairing both functional capacity and quality of life. Despite its clinical significance, the precise pathophysiological mechanisms underlying LID remain incompletely understood [3].
Lewy body pathology progressively spreads from the lower brainstem to the extensive cerebral cortex, resulting in cell death [4]. There is convincing evidence indicating that LID is primarily related to underlying neuropathological processes rather than merely the use of dopaminergic drugs. The advancement of neuroimaging techniques has provided valuable tools for exploring the neural mechanisms of LID. Cerasa et al. [5] utilized voxel-based morphometry (VBM) analysis and found that the volume of the inferior frontal cortex (IFC) was larger in PD patients with LID than in those without it. Cortical thickness (CT) analysis indicated that the right IFC was thicker in PD patients with LID compared to those without [6], leading to the speculation that changes in neuroplasticity of the LID-associated dopaminergic pathway may have triggered the morphological remodeling of the prefrontal cortex [5, 6]. However, the patterns of cortical surface shape in LID remain unknown, and VBM and CT analyses could only reveal information regarding grey matter size.
The human brain has a complex folded structure, and neuroimaging research has examined various cortical surface shape features, including mean curvature, gyrification index, and sulcal depth (SD) [7, 8, 9]. SD is a sensitive structural indicator used to assess cortical folding morphology, defined as the Euclidean distance between the convex hull and the central surface [10]. Previous studies reported that SD gradually decreases with brain aging and is sensitive to cortical atrophy [11]. Cortical atrophy has been mechanistically linked to reductions in CT, volume of gyral white matter, and tension within cortico-cortical links located in subcortical white matter [12, 13]. Abnormal SD changes have been documented across multiple neurological conditions, including Alzheimer’s disease (AD) [10], multiple sclerosis (MS) [14], and PD [15]. These investigations suggested that generally shallower SD is associated with cortical atrophy and disease progression. Notably, Wang et al. [15] found that compared to healthy controls (HCs), PD patients displayed reduced SD in a variety of areas, such as the temporal, insula, frontal, parietal, and occipital lobes, in keeping with Braak’s hypothesis of PD progression. In contrast, only relatively localized reductions in CT were observed in PD patients. They concluded that SD may be primarily affected by white matter injury and appears to be more sensitive than CT to alterations in the brain structure [15]. However, patterns of SD in relation to LID have not yet been examined, even though it is a crucial structural characteristic that conveys distinct morphological information of the cerebral cortex. Additionally, subcortical volumes among LID have not been thoroughly investigated.
This study aims to explore the SD patterns in PD patients with LID compared with those without LID and HCs. We also investigated the specific changes in subcortical volumes. Based on existing literature, we hypothesized that PD patients with LID would exhibit significant alterations in SD compared to those without LID.
Idiopathic PD patients were consecutively enrolled based on the clinical
diagnostic standards set by the Movement Disorder Society [16]. Inclusion
criteria were as follows [17]: (1) right-handed; (2) stable dosage of L-DOPA
drugs for one month; (3) at least six months of L-DOPA therapy;
(4) presence or absence of peak-dose LID following an acute L-DOPA test confirmed
by two experienced movement disorder neurologist; (5) no indication of cognitive
impairment (with Mini-Mental State Examination [MMSE] score
The ethics committee of the First Affiliated Hospital with Nanjing Medical University approved this research protocol, and was conducted by following the Declaration of Helsinki. Written informed consent was obtained from each participant.
Clinical disease information was collected for PD, including disease duration and age at onset. The severity of movement problems in PD was assessed both in the off-phase (after stopping L-DOPA for at least 12 hours) and during the on-phase when the medication was effective. This was measured using the Hoehn and Yahr (H-Y) stage scale and the Unified Parkinson’s Disease Rating Scale III (UPDRS III). For each patient with PD, the total levodopa equivalent daily dosage (LEDD) was calculated [17, 18]. The severity of dyskinetic symptoms in PD-LID during the on-phase was evaluated using the Unified Dyskinesia Rating Scale (UDysRS) [19]. Moreover, an initial assessment of global cognitive function was conducted using the MMSE scale.
MRI images were acquired on a 3.0 T Siemens MRI scanner (Siemens Medical
Solutions, Erlangen, Germany) with an eight-channel head coil [20]. All PD
patients were scanned during the off-phase and a resting state. Parameters for
obtaining structural 3D T1-weighted high-resolution images were as follows:
repetition time was 1900 ms, echo time was 2.95 ms, acquisition matrix was 256
The initial preprocessing and reconstruction of T1 images using the FreeSurfer 7.2 software package (Laboratory for Computational Neuroimaging, Athinoula A. Martinos Center for Biomedical Imaging, Boston, MA, USA; https://surfer.nmr.mgh.harvard.edu/fswiki) included: motion correction, normalization of intensity inhomogeneity, elimination of non-brain tissues, spatial normalization, Talairach transformation, and segmentation of cortical grey-white matter boundaries. The FreeSurfer documentation provides a detailed explanation of the SD measurement (https://surfer.nmr.mgh.harvard.edu/fswiki/sulc). SD was calculated by the distance of a specific vertex point on a surface from a hypothetical intermediate surface situated between the gyri and sulci in each parcellated cortical region. The SD then serves as an indicator of the linear distance and displacements, signifying how high or deep the brain’s gyri or sulci are. The cerebral cortex was divided into 68 regional areas using the Desikan-Killiany (DK) atlas to extract SD [21]. The ensuing inter-group analyses computed and compared the average SD of these regions.
Subcortical structures were automatically segmented from each hemisphere using
FreeSurfer. These included globus pallidus, thalamus, amygdala, caudate, putamen,
hippocampus, and nucleus accumbens [22]. Additionally, tissue volumes of grey
matter, white matter, and cerebrospinal fluid were summed to determine the total
intracranial volume (TIV) [23]. To eliminate the impact of head size, we
calculated volume ratios ([volume/TIV]
Two-sample t-tests, one-way analyses of variance (ANOVA), Mann-Whitney
U, or Kruskal-Wallis to compare clinical quantitative data. The Chi-squared test
was employed to compare clinical categorical data. After controlling for age,
sex, educational attainment, MMSE scores, and TIV, the regional SD and
subcortical volumes were compared using analysis of covariance (ANCOVA). The
assumptions of ANCOVA were tested and met, including the homogeneity of
regression slopes, normality of residuals, and homogeneity of variances. A
Bonferroni correction for multiple comparisons was applied, setting the
significance threshold at p
Age, sex, and years of education did not significantly differ among PD-LID, PD-NLID, and HCs groups. There were no significant differences in disease duration, age at onset, and LEDD between PD subgroups, as well as H-Y stage and UPDRS III during off-phase or on-phase. While the group difference of MMSE among the three groups was significant (p = 0.004), post hoc analysis by Bonferroni correction showed that both PD-LID and PD-NLID had lower scores than those of HCs (p = 0.031; p = 0.006). The comprehensive demographic and clinical characteristics are shown in Table 1.
| PD-LID (n = 30) | PD-NLID (n = 32) | HCs (n = 30) | p value | Post hoc (Bonferroni) | |
| Age, y | 61.83 |
60.13 |
61.73 |
0.598a | - |
| Sex (M/F) | 16/14 | 19/13 | 19/11 | 0.749b | - |
| Education, y | 10.43 |
9.72 |
11.20 |
0.263c | - |
| Age at onset, y | 54.63 |
54.78 |
- | 0.940d | - |
| Disease duration, y | 7.20 |
5.34 |
- | 0.103e | - |
| H-Y stage (off-phase) | 2.35 |
2.14 |
- | 0.182e | - |
| H-Y stage (on-phase) | 2.03 |
1.83 |
- | 0.134e | - |
| UPDRS III (off-phase) | 33.83 |
33.06 |
- | 0.751e | - |
| UPDRS III (on-phase) | 21.37 |
20.91 |
- | 0.494e | - |
| LEDD, mg | 801.12 |
749.12 |
- | 0.349e | - |
| UDysRS | 28.50 |
- | - | - | - |
| MMSE | 28.00 |
27.94 |
29.03 |
0.004c,* | PD-LID |
| PD-NLID | |||||
| PD-NLID |
Variables were expressed as mean
Abbreviations: PD, Parkinson’s Disease; LID, levodopa-induced dyskinesia; NLID, non-levodopa-induced dyskinesia; HCs, healthy controls; y, year; M, male; F, female; H-Y stage, Hoehn and Yahr rating scale; UPDRS, Unified Parkinson’s disease rating scale; LEDD, levodopa equivalent daily dose; UDysRS, Unified Dyskinesia Rating Scale; MMSE, Mini-Mental State Examination; n, number.
a One-way analysis of variance.
b Chi-squared test.
c Kruskal-Wallis.
d Two-sample t-test.
e Mann-Whitney U.
*p
There were notable SD changes in the right inferior parietal (F =
15.532, p = 2.00
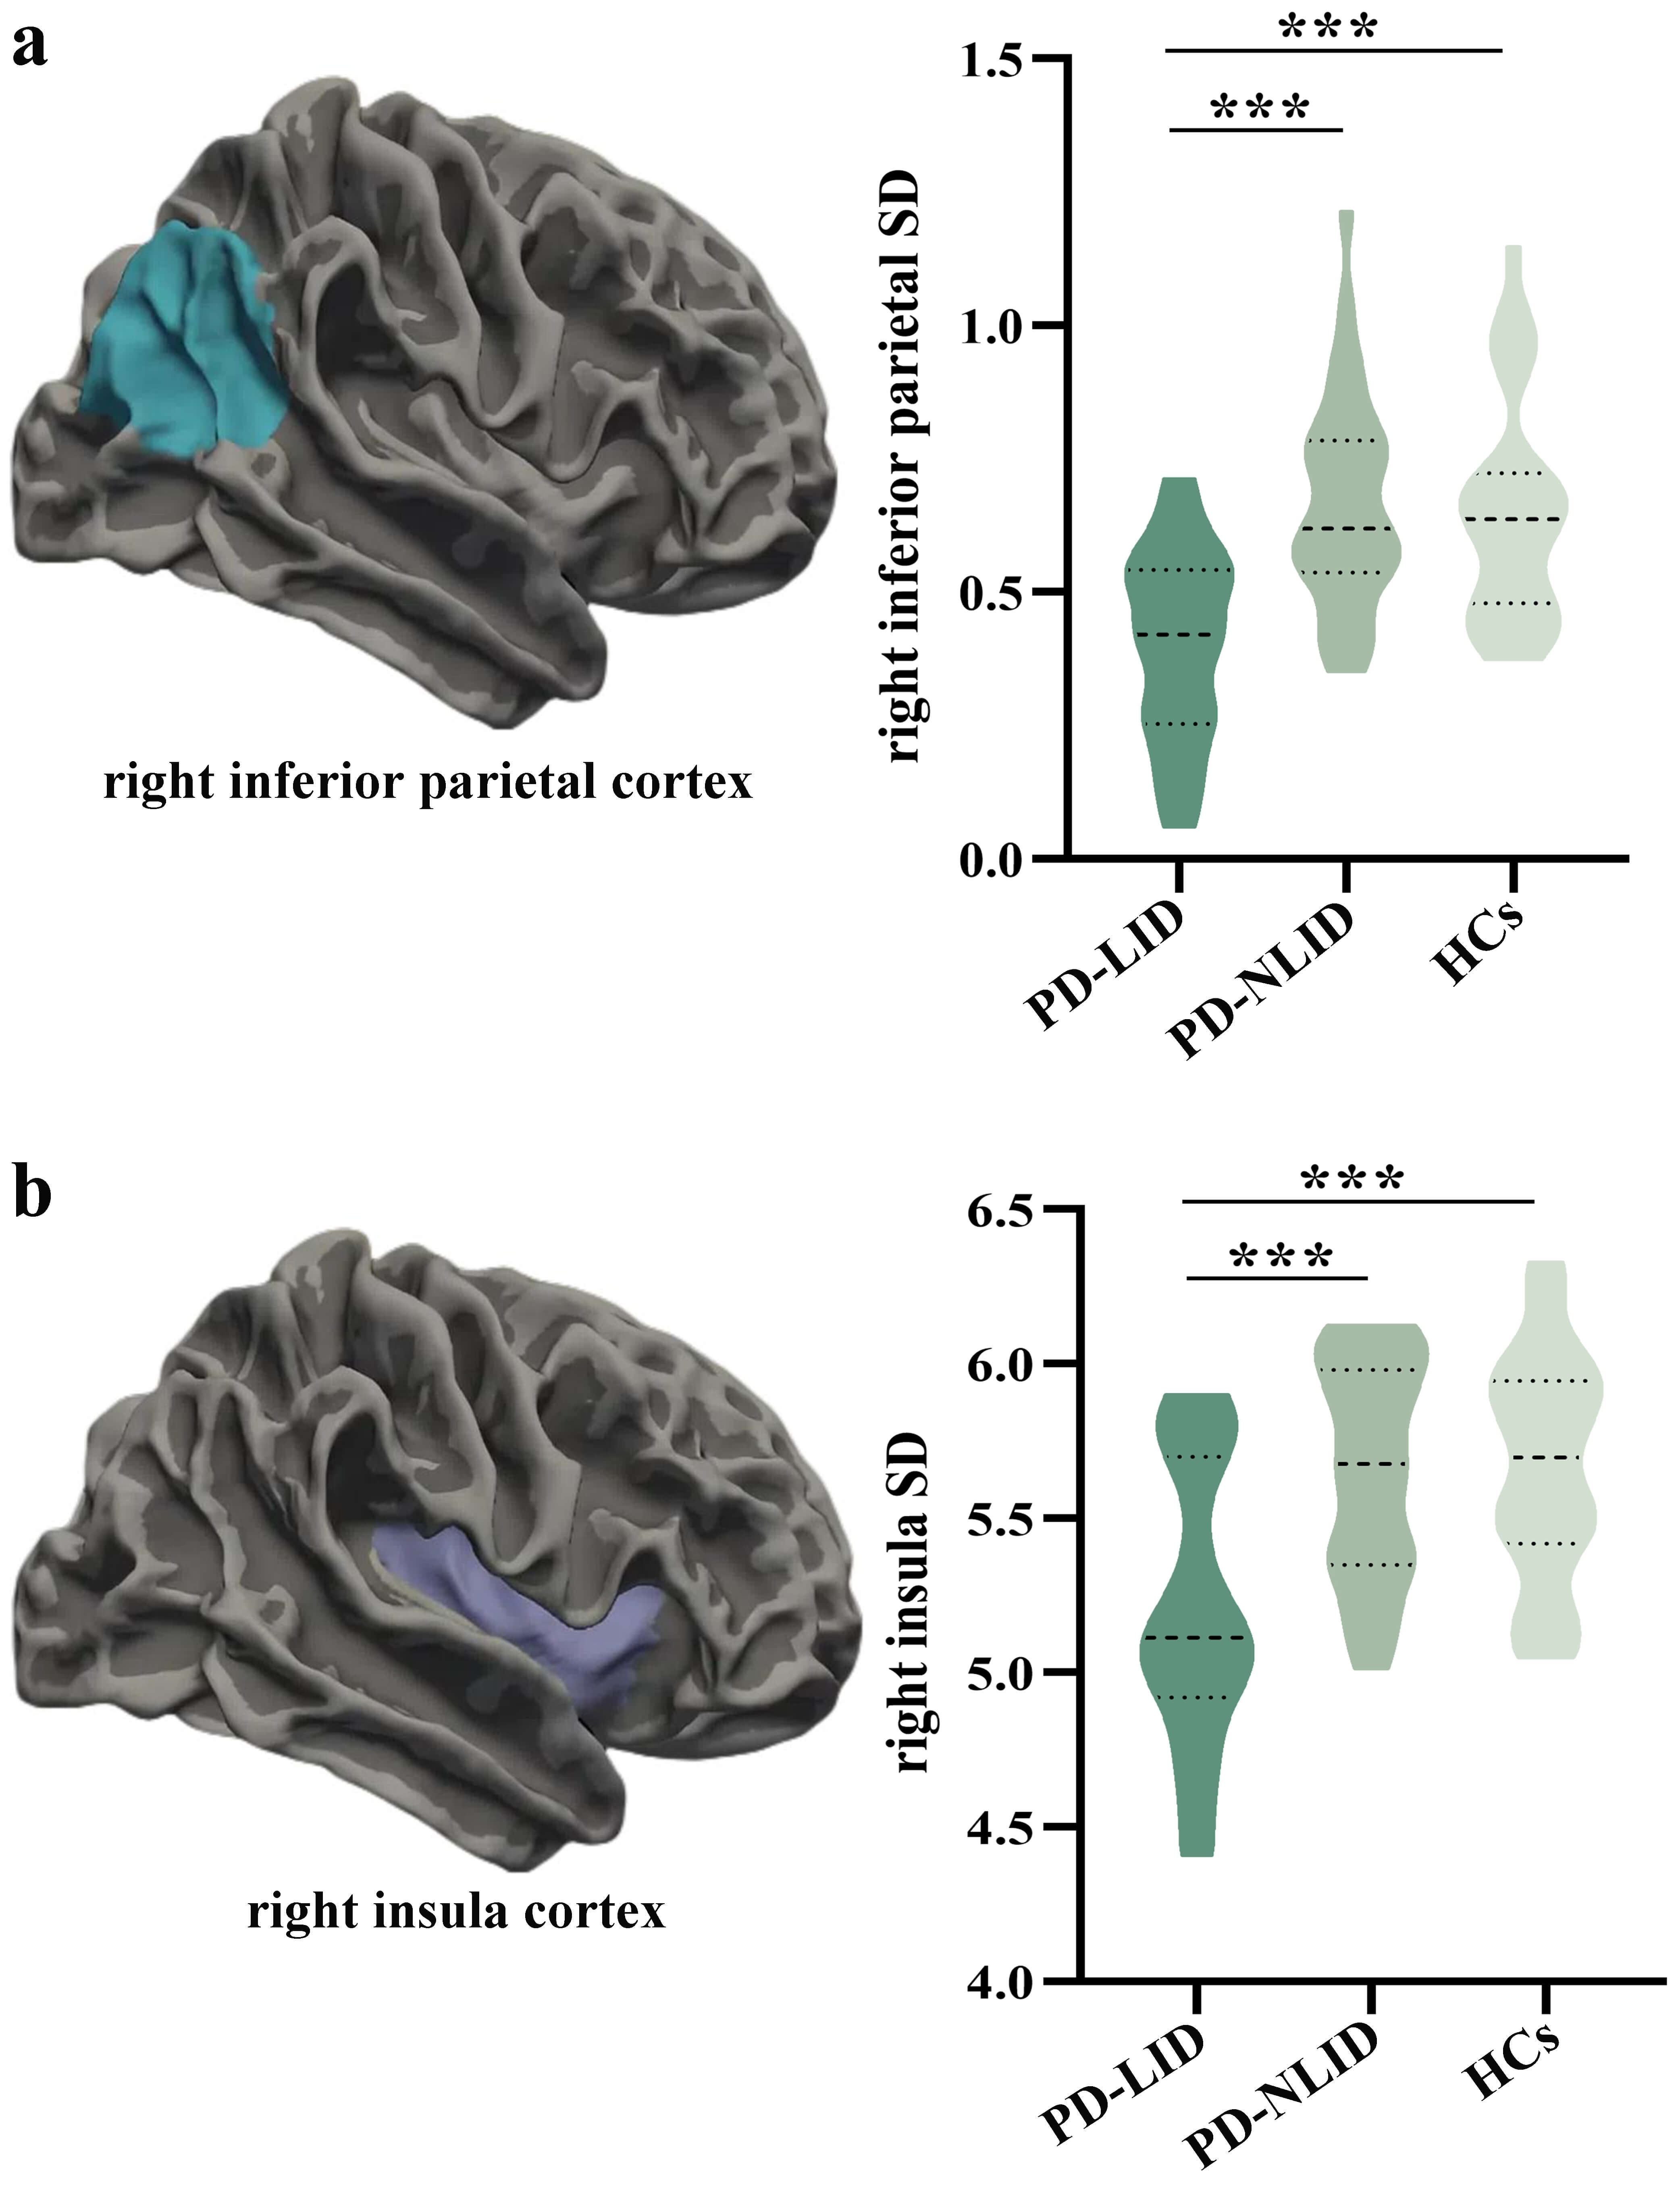 Fig. 1.
Comparison of regional sulcal depth among groups. (a) The right
inferior parietal cortex showed significant regional SD differences among the
PD-LID, PD-NLID, and HCs groups (F = 15.532, p = 2.00
The right putamen showed a significant group difference among PD-LID, PD-NLID,
and HCs groups (F = 12.133, p = 2.30
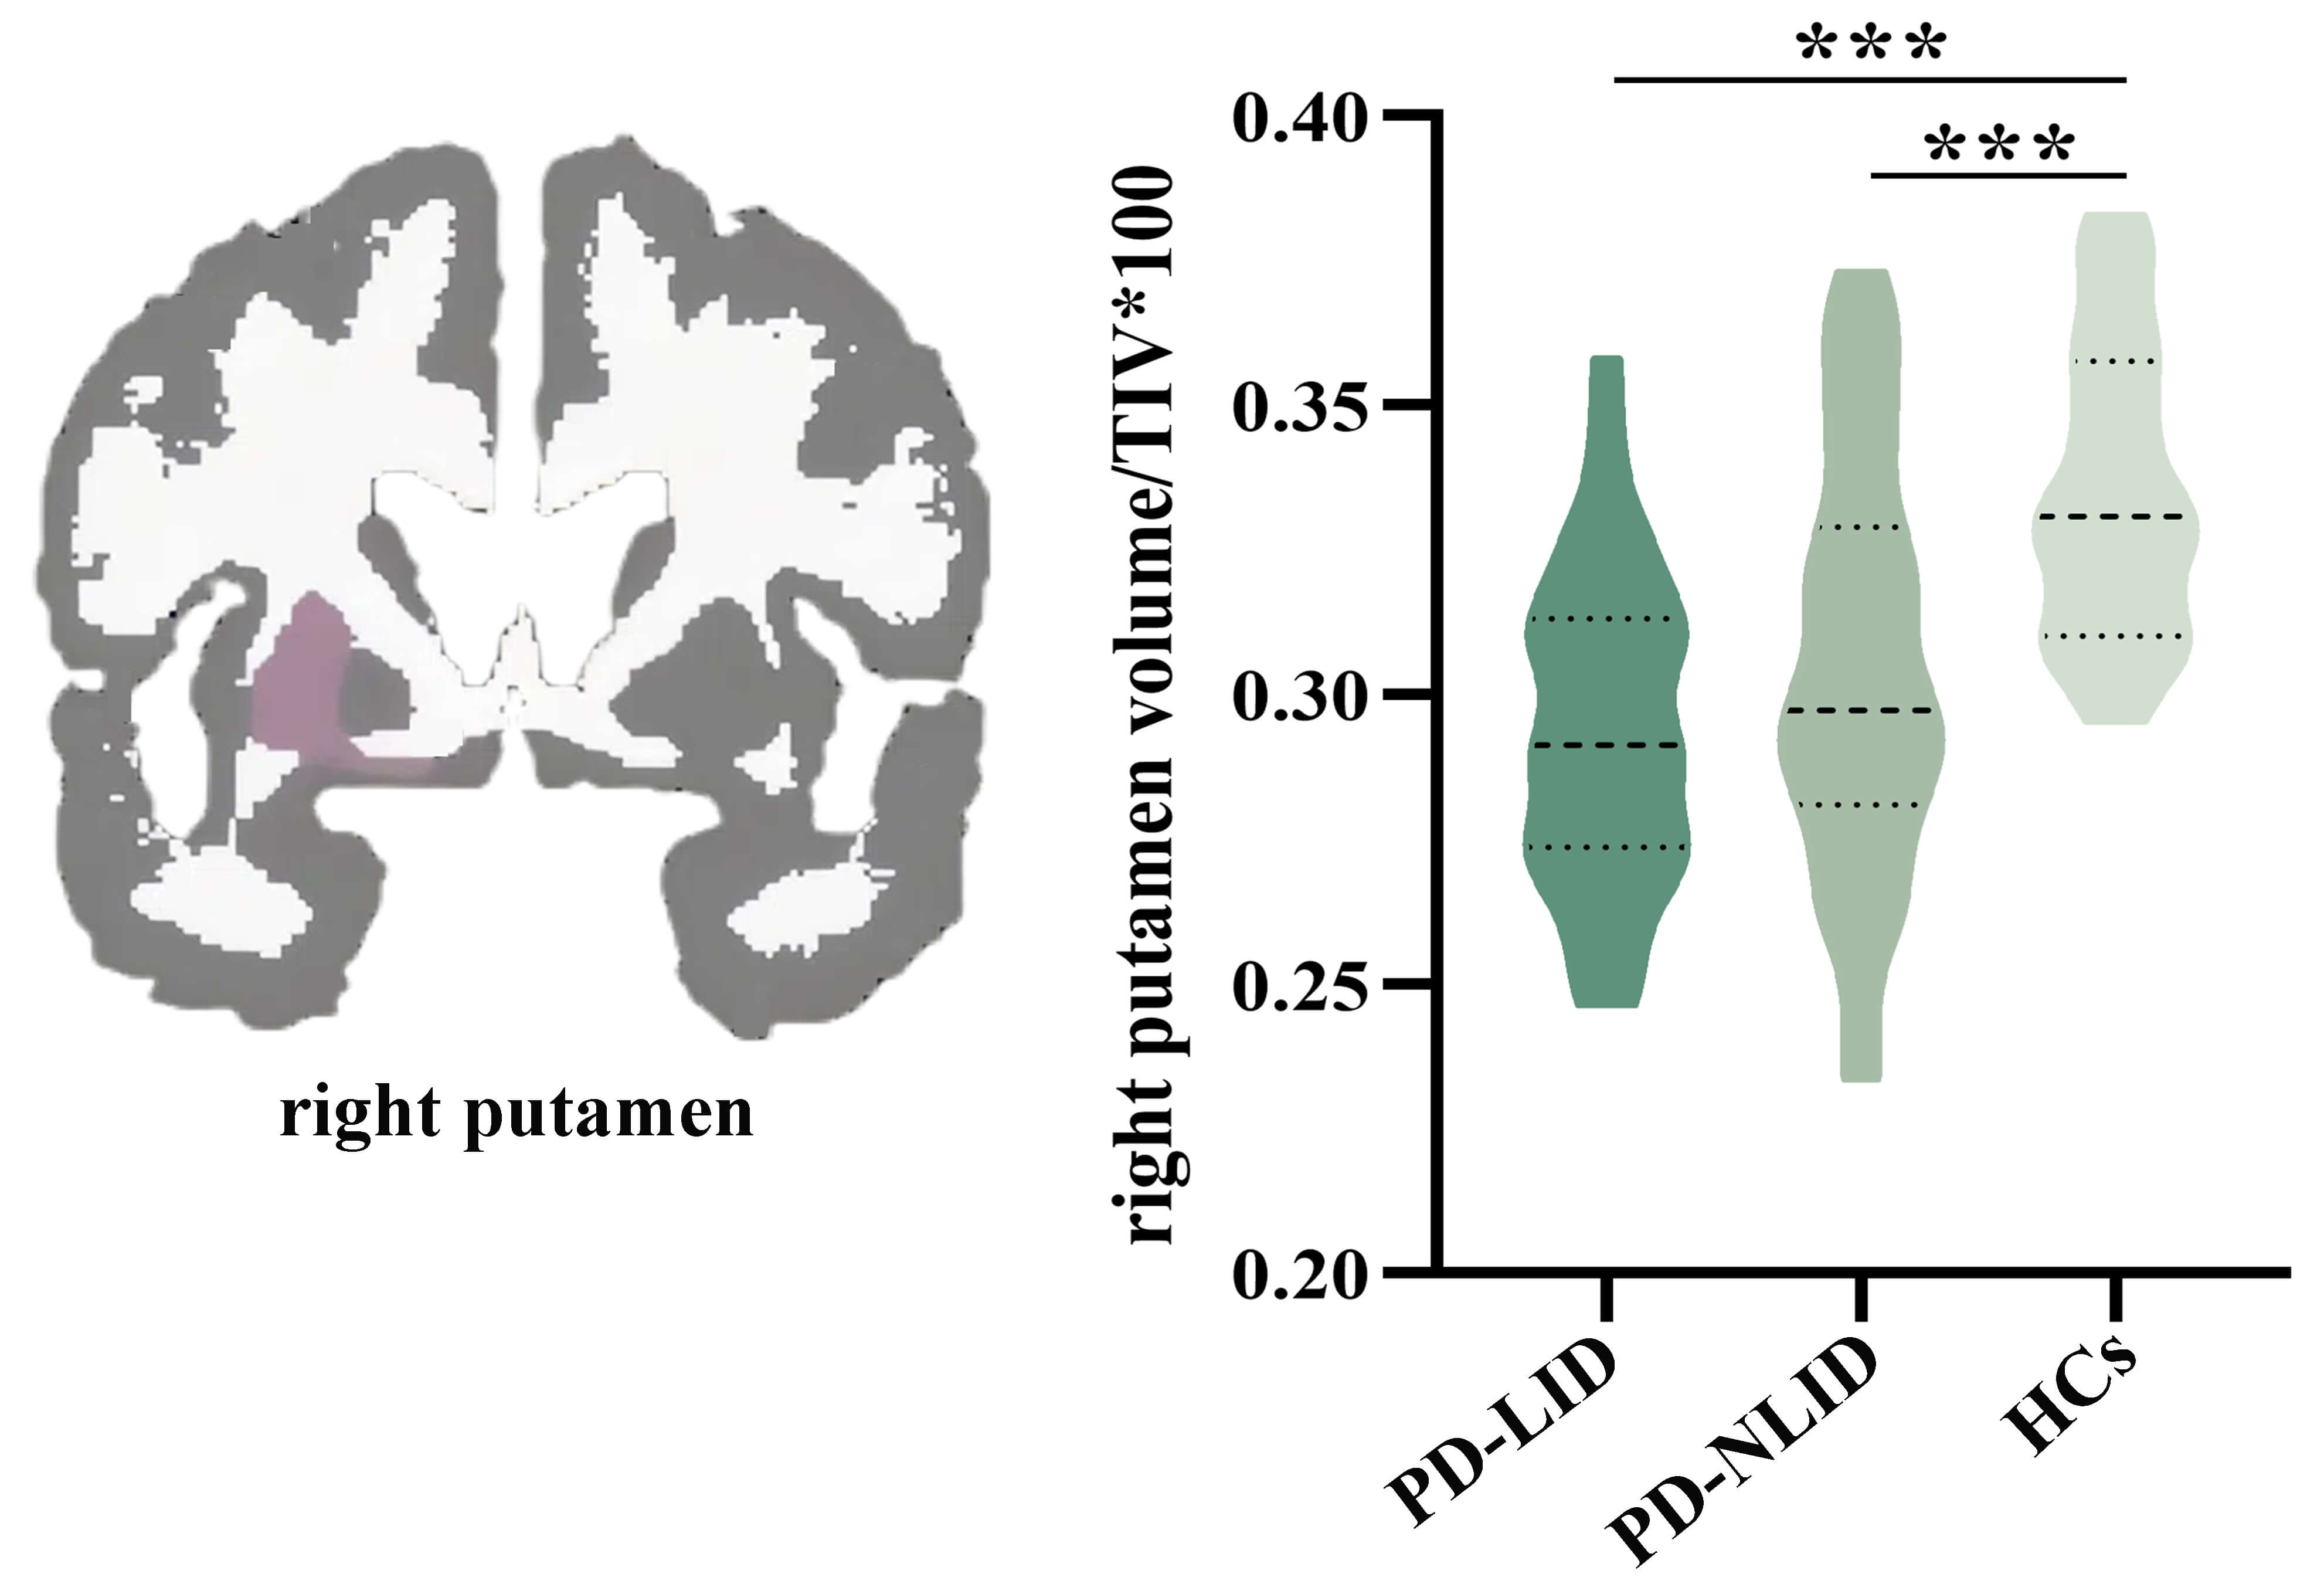 Fig. 2.
Comparison of subcortical volumes among groups. The right
putamen showed a significant group difference among the PD-LID, PD-NLID, and HCs
groups (F = 12.133, p = 2.30
Partial correlation analysis suggested that the level of right inferior parietal SD was negatively related to the UDysRS scores in PD-LID group (r = –0.494, p = 0.017, Fig. 3a). We did not observe the relationship between the level of right insula SD or adjusted putamen volume value and the UDysRS scores in PD-LID group (r = 0.216, p = 0.300; r = –0.010, p = 0.964). ROC analyses further showed that both right inferior parietal SD and right insula SD could separate PD-LID from PD-NLID (area under the curve [AUC] = 0.833, 95% confidence interval [CI] = 0.735–0.930; AUC = 0.791, 95% CI = 0.679–0.903); combining right inferior parietal and insula SD could better distinguish PD-LID from PD-NLID patients (AUC = 0.913, 95% CI = 0.839–0.986) (Fig. 3b, Table 2). The adjusted putamen volume failed to demonstrate significant discriminative power in distinguishing between PD-LID and PD-NLID (AUC = 0.585, 95% CI = 0.442–0.728, p = 0.248).
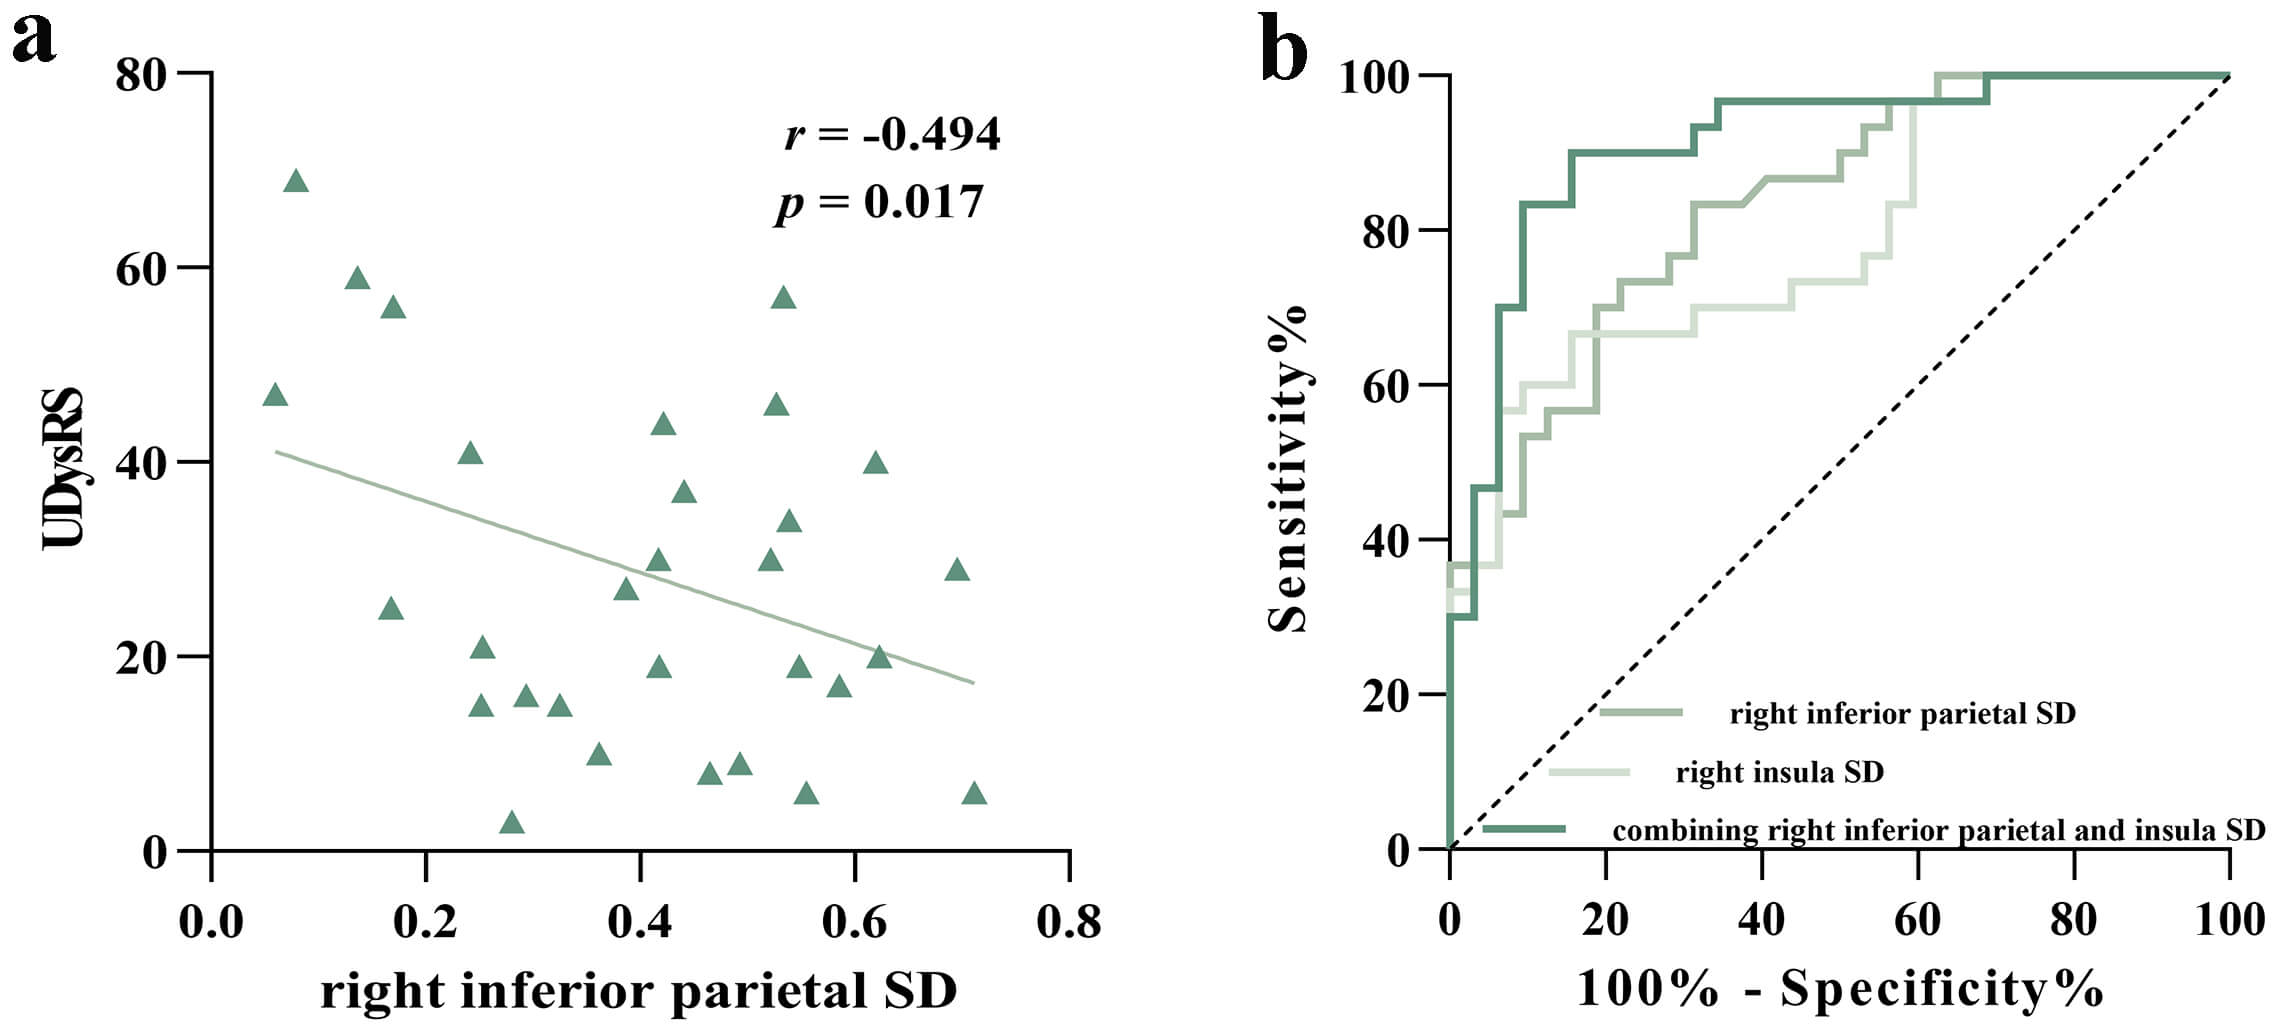 Fig. 3.
Correlation analysis and ROC analysis. (a) The scatterplot displayed a negative correlation between UDysRS scores and right inferior parietal SD in the PD-LID group. (b) ROC analyses further revealed that both right inferior parietal SD and right insula SD showed good performance in identifying PD-LID patients, and the combined indicators showed a better identification effect.
| MRI findings | AUC | p value | 95% CI | Sensitivity | Specificity | Cut-off point |
| Separating PD-LID from PD-NLID | ||||||
| Right inferior parietal SD | 0.833 | 0.735–0.930 | 0.833 | 0.687 | 0.558 | |
| Right insula SD | 0.791 | 0.679–0.903 | 0.667 | 0.844 | 5.313 | |
| Combining the right inferior parietal and insula SD | 0.913 | 0.839–0.986 | 0.900 | 0.844 | 0.535 | |
Abbreviations: ROC, receiver operating characteristic; AUC, area under the
curve; CI, confidence interval; PD, Parkinson’s disease; LID, Levodopa-induced
dyskinesia; NLID, non-levodopa-induced dyskinesia; SD, sulcal depth.
***p
This study examined changes in cortical morphological and subcortical structures in PD patients with and without LID and in HCs. We found reduced regional SD in the right inferior parietal and insula cortices in PD-LID compared to PD-NLID and HCs. Subcortically, both PD-LID and PD-NLID groups had a smaller volume in the right putamen, compared to the HCs. Notably, in the PD-LID group, there was a significant negative correlation between the SD values of the right inferior parietal cortex and the UDysRS scores. Additionally, both the right inferior parietal and right insula cortices SD measurements were effective in distinguishing PD-LID from PD-NLID, with combined indicators showing an even better identification capability. These findings suggest that the structural alterations with LID may extend from the frontal to the parietal and insula cortices, enhancing our understanding of the neurological underpinnings of LID in PD.
We observed that dyskinetic PD patients had a significantly shallower SD in the right inferior parietal and insula cortices compared to nondyskinetic PD patients and HCs. As previously mentioned, the SD reflects the morphology of the cortical folding and is sensitive to cortical atrophy and white matter damage [11, 15]. Furthermore, this process of SD shallowing might relate to the regional vulnerability proposed by Braak’s hypothesis [15], which posits that alpha-synuclein accumulates in the inferior parietal and insula cortices during stages 5–6 of the disease [25]. Although our PD cohorts were at a moderate clinical stage (H-Y stages 2–3), the observed structural changes in LID patients within these specific regions suggest that the pathological burden, particularly alpha-synuclein aggregation, might be more severe or have a greater impact in these vulnerable areas within the LID subgroup. This buildup of alpha-synuclein may alter receptor function and affect synaptic activity in these neurons. Consequently, these areas may be particularly vulnerable to structural changes, such as grey matter loss and white matter damage, either directly from alpha-synuclein aggregation or indirectly due to loss of synaptic input [26]. This could, in part, explain the shallower SD observed in the parietal and insula cortices of dyskinetic PD patients in this study. It is well known that dyskinetic PD patients often exhibit impairments in executive control and motor inhibition [27, 28, 29]. Previous work has shown that, unlike the traditional focus on frontal regions, inhibitory control involves a distributed right-lateralized cortical network that includes the inferior parietal lobe and anterior insula [30]. Our results indicate distinct structural alterations in neural circuits related to inhibitory control in LID, thereby improving our understanding of the neural substrates of LID in PD.
Our findings also showed that the dyskinesia worsened as the SD of the right inferior parietal cortex decreased. Previous studies have documented that the functional asymmetry of left and right inferior parietal lobule (IPL) is attributed to its asymmetric topographical architecture and the different roles in language and visuospatial attention processing [31, 32]. In particular, the functional organization of the right IPL at the subregional level indicates that the supramarginal gyrus is involved in interoception, execution, attention, and action inhibition, while the angular gyrus is involved in social cognition and spatial cognition [31]. This supports the critical role of right IPL in several functions, especially execution, attention, and action inhibition, which are known to be impaired in dyskinetic PD patients [28, 33, 34]. Structural changes and dysfunction in the frontal and motor cortices related to LID in PD have been documented previously [5, 6, 35, 36, 37]. Movement inhibition issues in PD patients with LID may primarily stem from impairments in the frontoparietal regions, as the IPL, frontal areas, and motor regions exhibit a specific activation pattern in a neural inhibitory-attentional network [38]. Moreover, the IPL functions as a sensorimotor interface that is critical for guiding movement through the integration of sensory feedback, particularly visual and proprioceptive inputs into motor planning and execution [39, 40, 41]. The basal ganglia contribute by regulating sensory inputs from somatosensory cortices to motor regions, which is essential for executing movements appropriately [42]. An increase in the intrinsic activity within the IPL may act as a compensatory strategy to address disrupted somatosensory processing through basal ganglia-motor cortical pathways [43]. Previous studies have indicated that the hypoactivation of the IPL was associated with difficulties in impulse control [44]. Therefore, the changes observed in the right IPL morphological structural parameter as observed in our study might induce the intrinsic hypofunction within the right IPL and disrupt functionally connected areas, causing the related inhibition function and sensorimotor compensatory mechanism breakdown, ultimately leading to the impairment of the movement inhibition and execution system, which may contribute to the pathogenesis of dyskinesia.
While the prefrontal cortex is well-known for its central role in executive control [27], a recent study by Molnar-Szakacs and Uddin [45] has highlighted the insula’s often overlooked contribution. Located within the lateral sulcus, the insula is closely connected to the basal ganglia and numerous other cortical areas, such as the frontoparietal cortices [45, 46]. Its unique microanatomy and extensive connections enable the insular cortex to communicate with various brain networks, and it is diverse in its engagement in a broad spectrum of cognitive-affective, somatosensory, and autonomic as well as executive control processes [26, 45]. Additionally, a study by Cai et al. [47] identified the right anterior insula as the most active node during inhibitory control tasks, validating its strong structural connection to the subthalamic nucleus (STN). This cortico-STN pathway facilitates the termination of quick action, where dysfunction could contribute to motor hyperactivity and dyskinesia [48]. Moreover, executive skills were found to have a direct correlation with the availability of the D2 receptor in the right anterior insula [49]. Thus, the right anterior insula acts as a critical integration hub and network switch, connecting frontal and other regions to support executive control [45]. The observed shallower SD in the right insula cortex of this study may disrupt the executive control circuits, potentially contributing to the pathogenesis of LID in PD. There is also hemispheric asymmetry in insular microstructural organization, including von Economo neurons distribution, which may underlie functional lateralization, as the right insula exhibits broader connections than the left [45, 50, 51]. Further investigation is needed to clarify lateralized connectivity patterns across the insular subdivisions.
Additionally, we found that the right putamen volume was smaller in dyskinetic PD patients than in HCs, but similar to nondyskinetic subjects. Consistent with our results, previous works also documented a significant volume loss in the right putamen between PD patients and HCs, but there was no change in the left putamen [52, 53, 54]. The putamen is known to be particularly affected by dopamine denervation in the striatum [55]. The absence of dopamine-binding transporters in the putamen of PD patients has been discovered, and neuropathology has confirmed the existence of microstructure changes, such as Lewy body deposition and neurofibrillary accumulation [56]. Regarding the rightward asymmetry in putamen atrophy, Fioravanti et al. [52] highlighted that nigrostriatal degeneration, which is typically denser contralaterally to the more affected side, is not the only contributing factor, and intricate bilateral connections of the motor system may also be the source of this asymmetry.
However, some limitations must be acknowledged in this study. First, even though we included individuals who did not appear to have cognitive impairment, the scores on the MMSE scale between the PD subgroups and the HCs were not matched. To mitigate cognitive interference with the findings, the MMSE scores had been included as covariates in the subsequent studies. Second, the UDysRS was not administered to the PD-NLID group, and the UPDRS-III and H-Y stage were not collected for the HCs group [5, 19], which could limit the direct comparability of baseline characteristics for these measures. Third, while the ROC analysis showed excellent discriminatory power, the risk of model overfitting cannot be ruled out due to the relatively small sample size and the number of features examined. Thus, findings require validation in a larger, independent cohort to confirm their generalizability. Finally, further studies focused on long-term MRI evaluations of clinical cohorts are needed to substantiate our results.
In conclusion, our primary results revealed distinct patterns of cortical SD changes but a consistent pattern of right putamen atrophy in PD patients with and without LID compared to HCs. Additionally, our results supported that the shallower SD in the right inferior parietal and insula cortices, indicative of cortical atrophy, may be involved in the pathophysiology of LID in PD. A lower SD value in the right inferior parietal cortex was associated with more severe LID. This research extends our understanding of the structural alterations from the frontal to the parietal and insula cortices, enhancing our comprehension of the neurological underpinnings of LID.
The data presented in this study are available on request from the corresponding author.
QQS, YSY, and KZZ contributed to the study conception and design. QQS and CTG contributed to the methodology. QQS and JXS were responsible for formal analysis and investigation. SYY, XYC, HMS, XFW, XPW, and GQW provided data acquisition. QQS drafted the original manuscript. QQS and KZZ acquired the funding. YSY and KZZ supervised. All authors contributed to editorial changes in the manuscript. All authors read and approved the final manuscript. All authors have participated sufficiently in the work and agreed to be accountable for all aspects of the work
This study was conducted in accordance with the Declaration of Helsinki (as revised in 2013) and was approved by the Ethics Committee of The First Affiliated Hospital with Nanjing Medical University (No.2016-SRFA-094). All participants provided written informed consent prior to participating in the study and undergoing MRI procedures.
We are grateful to all of the participants for their cooperation and support in our study.
This work was supported by the Young Scholars Fostering Fund of the First Affiliated Hospital of Nanjing Medical University (grant number PY202418) and the National Natural Science Foundation of China (grant numbers 81671258 and 81901297).
The authors declare no conflict of interest.
References
Publisher’s Note: IMR Press stays neutral with regard to jurisdictional claims in published maps and institutional affiliations.