


 , Pierre-Henri Cornuault 3, Jenny Faucheu 4, Arnaud Witt 5, Chloé Sutter 1, Benjamin Weiland 6, Jean Blouin 1, Francesco Massi 7, Eric Chatelet 8, Jérémy Danna 9
1 Aix-Marseille Université CNRS, CRPN, 13284 Marseille, France
2 Institut Universitaire de France, 75005 Paris, France
3 Université Marie et Louis Pasteur, UFR-ST/Institut FEMTO ST, F-25000 Besançon, France
4 Ecole des Mines de Saint-Etienne, Institut Mines-Télécom, 158 Cr Fauriel, 42100 Saint-Etienne, France
5 Université de Bourgogne/Laboratoire d’Etude de l’Apprentissage et du Développement, 21078 Dijon, France
6 Université de Bourgogne Europe, Département de Recherche en Ingénierie des Véhicules pour l’Environnement UR 1859, 89000 Auxerre, France
7 Department of Mechanical and Aerospace Engineering, Sapienza University of Rome, 00184 Rome, Italy
8 Univ. Lyon, INSA Lyon, CNRS, LAMCOS, UMR5259, 69621 Villeurbanne, France
9 Cognition, Langues, Langage, Ergonomie, Université de Toulouse, CNRS, 31062 Toulouse, France
Abstract
Adding movement sonification to haptic exploration can change the perceptual outcome of a textured surface through multisensory processing. We hypothesized that auditory-evoked emotions influence the appraisal of textured surfaces, with corresponding changes reflected in cortical excitability.
Twelve participants actively rubbed two different textured surfaces (slippery and rough) either without movement sonification, or with pleasant or disagreeable movement sonification.
We found that sounds, whether agreeable or disagreeable, did not change the texture appraisal. However, the less pleasant surface was associated with a stronger negative hedonic valence, particularly when paired with disagreeable movement sonification. Time frequency analyses of electroencephalography (EEG) activities revealed a significant reduction in beta-band power [15–25 Hz] within the source-estimated sensorimotor and superior posterior parietal cortices when contrasting both pleasant and unpleasant sounds with the silent touch. This suggests that the primary somatosensory cortices together with the superior parietal regions participated in the audio-tactile binding, with both pleasant and unpleasant sounds. In addition, we observed a significant increase in beta-band power in medial visual areas, specifically when disagreeable movement sonification was paired with tactile exploration. This may reflect a disengagement of visual cortical processing, potentially amplifying auditory-driven emotional responses and intensifying the perceived unpleasantness of the explored surfaces.
Our results offer new insights into the neural mechanisms by which hedonic valence of auditory signals modulates emotional processing, without disrupting the perceptual analysis of texture properties.
Keywords
- movement sonification
- EEG
- audio-tactile processes
- emotion
Haptic exploration for extracting information about objects is generally considered a silent process. When vision is absent, the texture of an object is thus perceived through multisensory processing of tactile and proprioceptive information (i.e., haptic information). Interestingly, when haptic exploration becomes audible, the perception of texture can change. One of the most compelling demonstrations of tactile-auditory integration altering texture perception is the so-called parchment-skin illusion [1, 2]. Specifically, people experiencing this illusion perceive the palms of their hands as becoming either dry or moist, depending on the spectral content of the hand-friction sound played while rubbing hands together. Thus, adding movement-related sounds, a technique called movement sonification, can significantly alter the perceived texture, even though the tactile and proprioceptive inputs evoked during surface exploration remain unchanged. The primary objective of this technique, which is conceptually like the Foley effect in cinema, is to convey movement-related information and enhance both the perception and control of movement [3]. Movement sonification may compensate for the absence or reduction of sensory input, supporting hypotheses of auditory-proprioception substitution [4] and auditory-visual substitution [5]. Potential clinical applications for motor rehabilitation are therefore numerous: for example, individuals who are blind, use a limb prosthesis, have suffered a stroke, or present peripheral nerve injuries may benefit. Applied to pen movements, movement sonification has already been successfully used to improve handwriting performance [6, 7]. In texture discrimination tasks, haptic exploration has been shown to change in the presence of textured sounds compared to non-textured sounds, notably by increasing movement velocity [8].
A fundamental property of sound is its capacity to evoke a wide range of emotions [9, 10]. Despite this, little is known about how auditory-evoked emotions influence the appraisal of textured surfaces scanned by a finger. This gap persists although there is well-established evidence that our appreciation of objects is strongly influenced by the tactile sensations and emotions elicited when touching them. The present study aims to determine whether movement sonification during tactile exploration of a surface alters both the perceptual appraisal of the texture and, its emotional valence (ranging from “positive, pleasure” to “negative, displeasure”).
Changes in the perceptual and emotional appraisal of a texture can result from bottom-up and top-down mechanisms. From a bottom-up perspective, the Bayesian approach proposes that the central nervous system integrates information from different sensory modalities based on the estimated probability that it originates from a common or independent source [11]. The mechanisms underlying cross-modal interactions in the human brain remain largely unknown. This is particularly the case for audio-tactile interactions, despite their frequent occurrence in everyday life, for example, when hearing footsteps on a gravel path. This example complies with the “temporal principle” of multisensory integration stating that an interaction is most likely to be maximally effective when stimuli overlap in time [12]. Sound and touch are likely to respond to this principle as they are deeply entangled. Mechanical forces generated by physical contact not only activate somatosensory mechanoreceptors but also generate acoustic waves detectable by the auditory system [13]. To date, neurons responsive to both audio and tactile stimuli have been found in primates in the ventral premotor cortex, the ventral intraparietal region and the superior temporal sulcus [14, 15]. Further evidence indicates that audio-tactile interactions occur already at early stages of sensory processing. Notably, the somatosensory (S1) and auditory (A1) cortical regions, presumptive unimodal sensory areas, exhibit enhanced responses to bimodal stimuli relative to unimodal inputs [16]. This has been evidenced in animal studies by Lakatos et al. [17] showing that somatosensory inputs reset the phase of ongoing neuronal oscillations, so that accompanying auditory inputs arrive during an ideal, high-excitability phase, and produce amplified neuronal responses. In contrast, responses to auditory inputs arriving during the opposing low-excitability phase tend to be suppressed. Zhang et al. [18] extended these findings from primary cortical areas to secondary somatosensory cortice (S2). They showed in the mouse neocortex that, pairing sound with whisker stimulation modulates tactile responses in both S1 and S2. Sound responses of many sound-selective neurons in S2 neurons were spatially colocalized with S2 touch-selective neurons.
Complementing these bottom-up mechanisms, other approaches propose that the perception of a texture under our skin is not driven solely by somatosensory stimulation [19]. Rather, somatosensory processing would be under the influence of top-down control, which actively modulates, and routes sensory inputs based on expectation, attention, and the perceptual task [20, 21]. For example, pleasure induced by listening to pleasant music has been shown to require higher levels of attention compared to neutral music, thereby reducing the attentional resources available for other tasks [22]. This relationship between attention and the experience of pleasurable sounds can influence how sensory information is processed and integrated, as attentional states have been shown to modulate somatosensory processing [23].
Through top-down and bottom-up mechanisms, movement sonification may then modulate the hedonic valence of textures during haptic exploration, particularly when the associated sounds convey emotional attributes. In the present study, we hypothesized that texture exploration producing pleasant sounds through movement sonification would be rated as more pleasant, while textures associated with unpleasant sounds would be perceived as less pleasant. These perceptual effects of movement sonification may be linked to changes in beta power within cortical areas involved in processing somatosensory inputs (e.g., S1, Posterior Parietal Cortex (PPC)) as well as in regions engaged in evaluating emotional valence, such as the cingulate cortex. This hypothesis is consistent with previous work showing that beta-band (15–25 Hz) oscillations can be used to probe the relationship between cortical functioning and emotional dimension [24]. In line with this, studies have reported stronger beta response to unpleasant materials (e.g., pictures [25] or video [26, 27]). For example, using video, Mishra et al. [26] found higher fronto-temporo-parietal connectivity pattern that captured emotion specifically in the beta band, compared to other frequency bands.
Twelve right-handed adults (6 women, 6 men, mean age 26
Before the experiment, participants washed and dried their hands, then sat at a
table where the experimental setup was positioned (Fig. 1). Prior to the
recording session, they practiced sliding finger movements with their eyes closed
on a 60
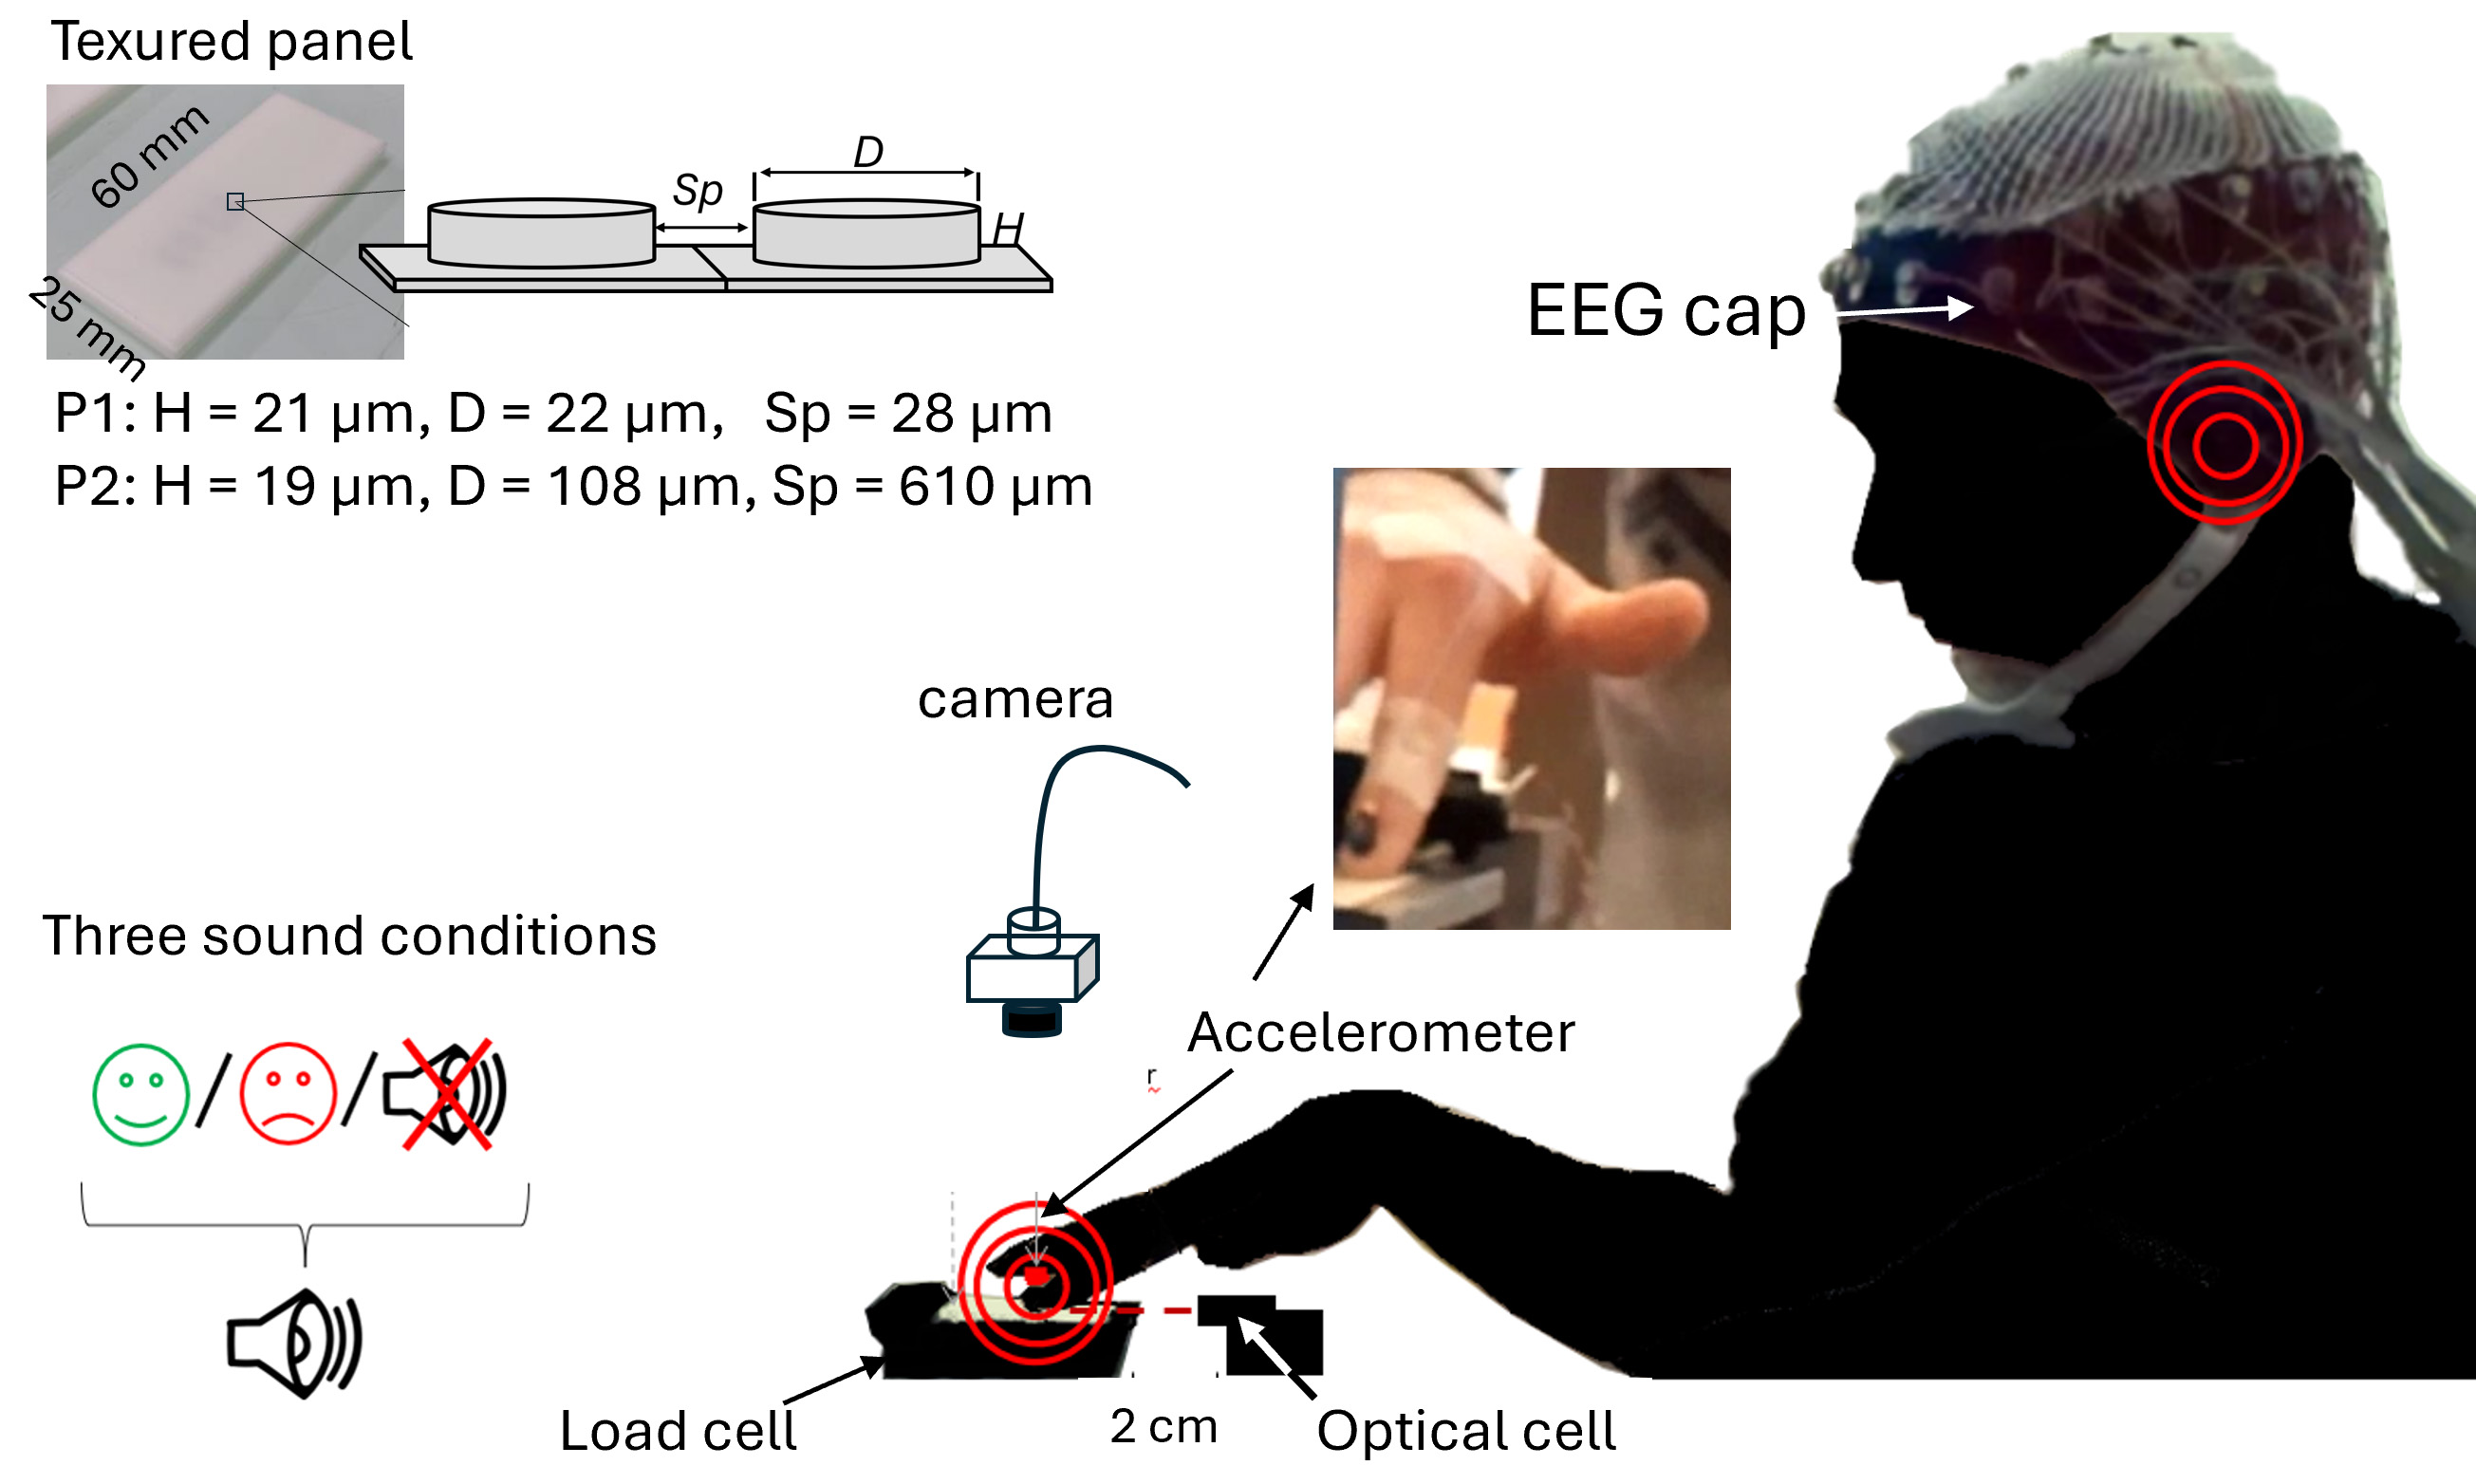 Fig. 1.
Experimental setup and participant positioning with EEG electrodes. The textured surface was mounted on a three-axis load cell. Vertical acceleration of the right index finger was measured with an accelerometer glued on the fingernail (see photo). Finger position was monitored with an optical cell for real-time movement sonification. A video camera was installed about 10 cm above the finger to record the movements for offline kinematic analyses. At the top of the figure: picture of one panel consisting of cylindrical dots. The texture of each panel is defined by the dot diameter (D) and height (H) and inter-dot spacing (Sp). EEG, electroencephalography.
After completing the series of strokes, participants indicated whether they felt the texture they just explored as slippery/vibrating/rough (perceptual outcome) and rated their liking of the texture using a 4-levels hedonic scale (emotional outcome): I like it a lot/I like it/I don’t like it/I really don’t like it.
Two textured panels made of polyurethane resin (P1 and P2, 60
| P1 and P2 Panels | Height (µm) | Diameter (µm) | Inter-dot spacing (µm) |
| P1 | 19 | 22 | 28 |
| P2 | 18 | 106 | 610 |
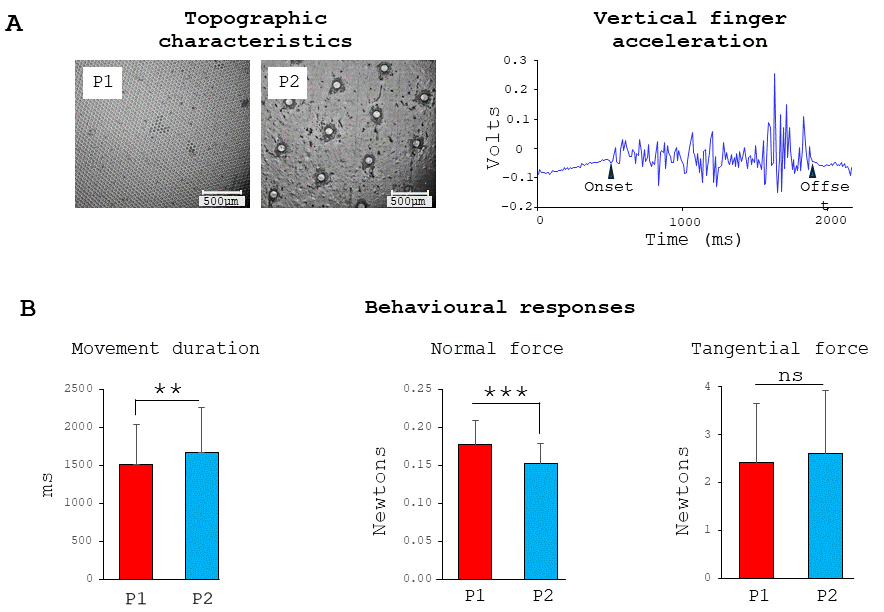
 Fig. 2.
Surfaces and behavior. Microscale topographic views of the
slippery and rough surfaces (left panel) and example of vertical acceleration
recorded during a single sliding finger movement across the P2 rough surface
(right panel) (A) and behavioral data: movement duration, normal and tangential
forces exerted on the surfaces (respectively left, middle and right panels) (B).
**, p
In a pilot study, 15 participants who had not participated in the main experiment, were asked to listen to two 1-sec musical chords and rate their hedonic valence, specifically whether they perceived the music as agreeable or disagreeable. Several listens were sometimes required for participants to form an opinion. The sonification without false notes was generally rated as agreeable, whereas the sonification containing false notes was considered disagreeable by most participants.
Real-time sonification of the finger movement was ensured by an optical motion tracking system (sampling frequency: 100 Hz), using a Max/MSP® program (Cycling’74, San Francisco, CA, USA). The musical sonification was based on a mapping between the fingers’ positions and musical chords with or without the presence of false notes (e.g., audio recordings of the false notes are available at: https://www.gdr.tact.uha.fr/groupes-de-travail/comprendre-et-caracteriser/). The sonified movement was revealed by loudspeakers placed in front of the finger as it moved across the surface.
To record normal and tangential (shear) force data from the finger/surface interaction, the textured surface is mounted on the top of a home-made multi-sensors box comprising three resistive normal load sensors and one piezoelectric force sensor (Kistler 9217A, type 5011, Vienna, Austria). Data are acquired through a National Instrument data acquisition system (NI PCIe-6321, Austin, TX, USA) using a 10 kHz sampling frequency and recorded with Labview software (V. 19.0, National Instruments, Austin, TX, USA).
The vertical acceleration of the right index finger was recorded at 1000 Hz with
a small and light (5 mm
Fingertip movement kinematics were recorded at 22 Hz using a video camera (GV-5040CP-C-HQb, IDS, Obersulm, Germany) positioned above the participant’s hand. This enabled us to compare mean movement velocity across different surface and sonification conditions. To ensure that this mean value was representative, we verified whether finger velocity remained relatively constant throughout each stroking movement. For each stroke, finger coordinates were captured at every 10% of the movement trajectory. We found a linear increase in position across the 10 different points, with mean value of R2 for each participant ranging from 0.982 to 0.997. Given these values were very close to 1, finger velocity can be considered constant across the movement for all conditions.
Electroencephalography (EEG) activity was continuously recorded from 64 Ag/AgCl surface electrodes embedded in an elastic cap (BioSemi ActiveTwo system: BioSemi, Amsterdam, Netherlands). Specific to the BioSemi system, “ground” electrodes were replaced by Common Mode Sense active (CMS) and Driven Right Leg (DRL) passive electrodes. Unlike a standard ground electrode, which simply provides a single reference point, the CMS and DRL electrodes (positioned near Pz and POz electrodes, respectively), act as an active reference system that reduces overall noise signal that accumulates in the system. This results in cleaner, more reliable EEG recording, and improved signal-to-noise ratio.
The signals were pre-amplified at the electrode sites, post amplified with DC
amplifiers, and digitized at a sampling rate of 1024 Hz (Actiview acquisition
program, BioSemi, Netherlands). The signals of each electrode were referenced to
the mean signal of all electrodes. The continuous EEG signal was segmented into
epochs aligned with the onset of the monotonic increase in shear forces generated
by the finger on the surface. The average amplitude computed 100 ms prior to the
force onset served as baseline. Three external Ag/AgCl electrodes (positioned
next to the right and left external canthus and under the left eye orbit) and one
from the cap (FP1) allowed controlling for ocular movements and blinks eventhough
the participants had their eyes closed. After artifact rejection based on visual
inspection, a mean of 35 trials for P1 and 32 trials for P2 were included in the
analyses; the number of trials did not significantly differ between the 3
conditions of sonification (F2,18 = 3.1; p
Neural sources were estimated with the dynamical Statistical Parametric Mapping (dSPM) [29] implemented in the Brainstorm software. A boundary element model (BEM) with three realistic layers (scalp, inner skull, and outer skull) was used to compute the forward model on the anatomical magnetic resonance imaging (MRI) brain template from the Montreal Neurological Institute (MNI Colin27). Using a realistic model has been shown to provide more accurate solution than a simple three concentric spheres model [30]. We used of a high number of vertices (i.e., 15002 vertices) to enhance the spatial resolution of the brain template. Such EEG source reconstruction has proved to be suited for investigating the activity of outer and inner cortical surfaces with 64 sensors [31, 32]. Measuring and modelling the noise contaminating the data is beneficial to source estimation. Noise covariance matrices were computed using the trials recorded while the index finger stayed stationary on the surface.
EEG data in source space were transformed into the time-frequency domain using the Hilbert transform in Brainstorm software [33]. The amplitude envelope (i.e., power) of beta band (mean 15–25 Hz, steps of 1 Hz) was extracted for each condition. Beta band event-related synchronization/desynchronization (ERS/ERD) was computed relative to a baseline window from –500 to –50 ms prior to finger movements and then averaged over 1000 ms interval starting at the onset of the strokes. This approach ensured that our ERS/ERD analyses captured most of the exploratory movement, encompassing approximately two-thirds of its total duration. Two participants performed very slow stroking movements and were excluded from EEG analysis, as the number of trials collected over the four 25-second series was insufficient for reliable EEG assessment.
The normal distribution of data sets was assessed using the Kolmogorov–Smirnov
test to validate the use of parametric tests. For the behavioral data, analyses
of variance (ANOVAs) were conducted on movement duration, normal force,
tangential force and mean movement velocity using the following design: Surface
(2 types of surfaces: P1 and P2)
The interactions between Surface and Sonification were not significant for any of the behavioral variables: stroke duration (F2,22 = 0.39; p = 0.67); normal forces (F2,22 = 1.80; p = 0.18) and tangential forces (F2,22 = 1.37; p = 0.27) (Fig. 2B) and stroke velocity (F2,22 = 1.34; p = 0.28). For simplicity and consistency, subsequent analyses were presented separately for the factors Surface and Sonification.
Although no specific instructions were given regarding the finger movement,
stroke durations were slightly but significantly shorter on the slippery surface
(P1: 1512
The forces (normal or tangential) exerted by the finger while rubbing the surfaces were not significantly affected by the movement sonification (F2,22= 3.18; p = 0.061 and F2,22 = 3.13; p = 0.063, for the normal and tangential forces, respectively).
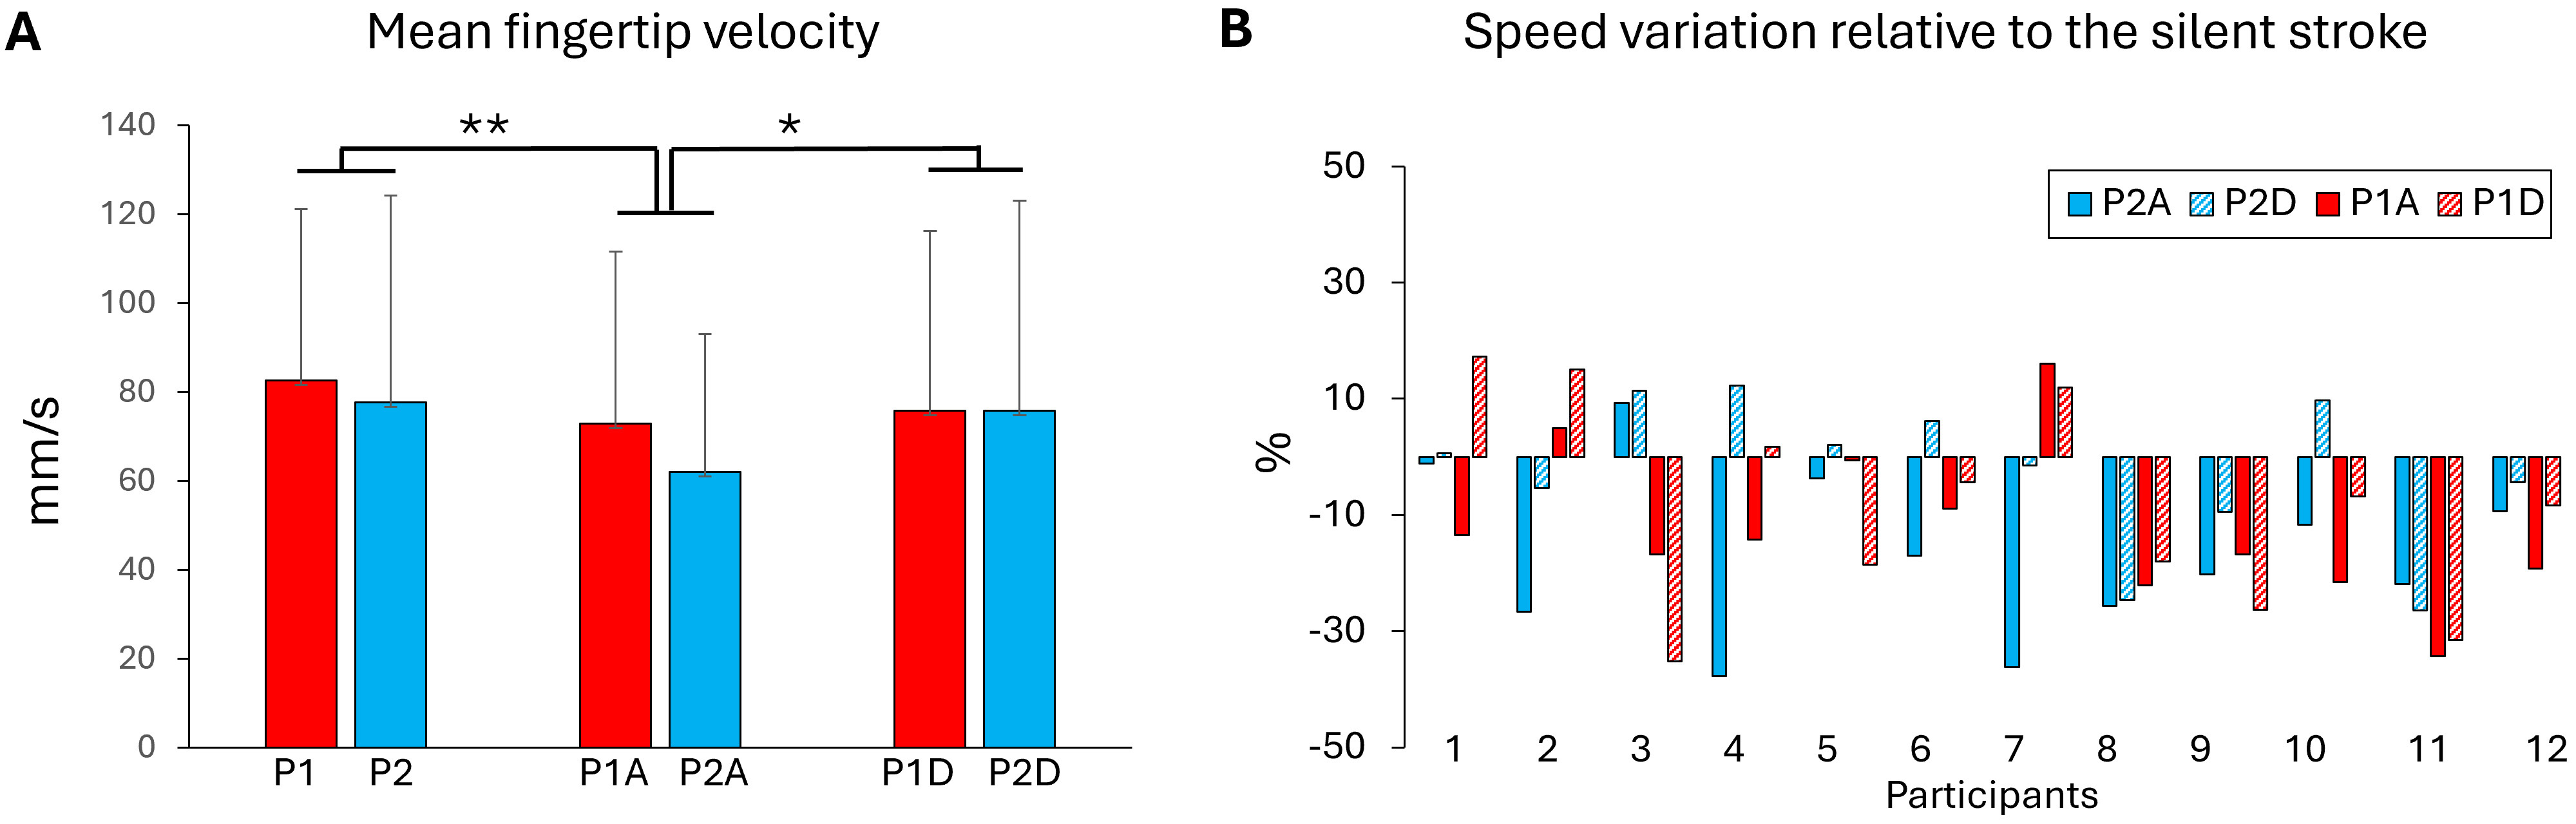
The kinematics of the stroke movement was analysed to determine whether the textured panel or the movement sonification altered the fingertip velocity (Fig. 3A). The results showed that fingertip velocity was not significantly affected by the type of panel’s texture (P1, P2) (F1,11 = 3.19; p = 0.10). Interestingly, the participants produced significantly slower movement on the P1 slippery surface for the agreeable sonification than for both silent (p = 0.001) and disagreeable (p = 0.029) stroke movements (F2,22 = 9.16; p = 0.0012). Fig. 3B shows fingertip movement velocity expressed as a percentage relative to the silent strokes. When sonification was present, the velocity decreased by about 10%.
 Fig. 3.
Fingertip velocity. (A) Fingertip velocity computed from the 10
positions recorded during the stroke movements for each textured manels and
sonification conditions (A, agreeable and D, disagreeable). (B) Fingertip
velocity for each participant in all surfaces and sonification conditions
expressed as a percentage relative to the silent stroke movement. Negative values
indicate a decrease in movement speed. *, p
Non-parametric (
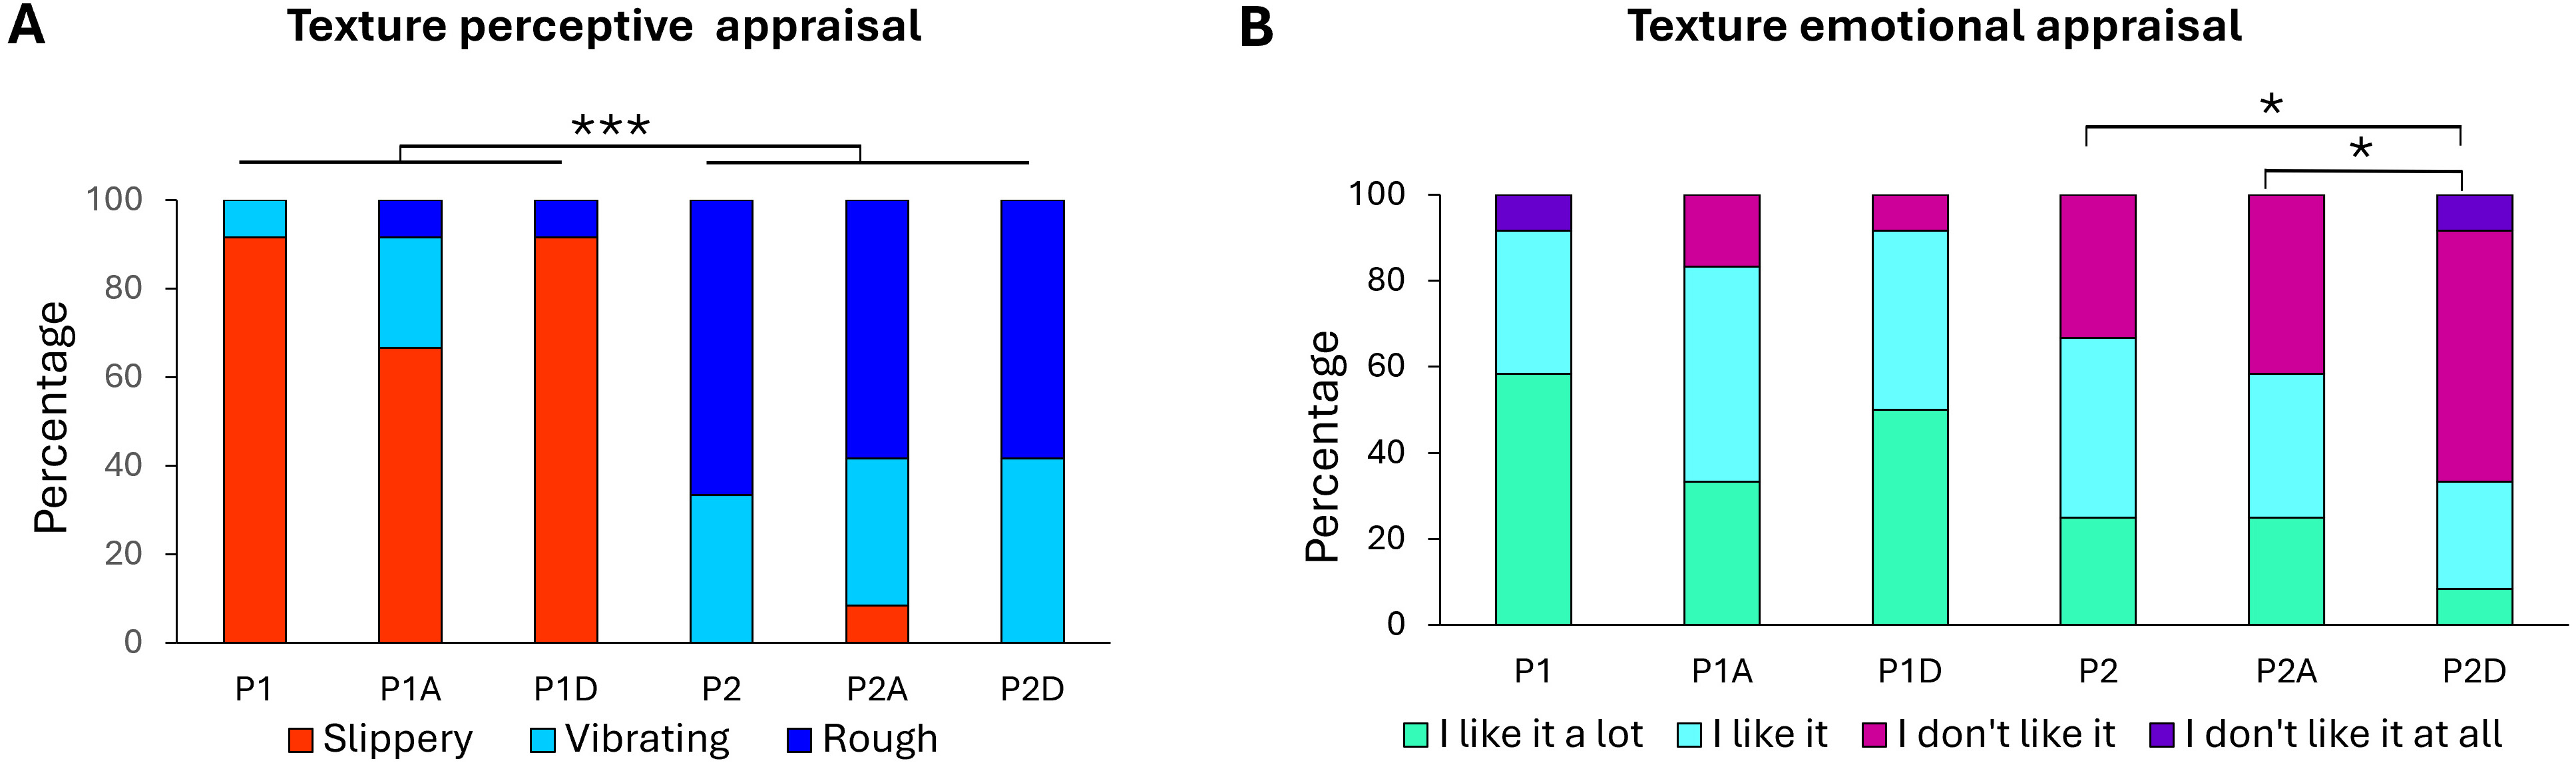
 Fig. 4.
Texture appraisal. Percentages of participant responses for (A)
texture perceptual appraisal and (B) texture emotional appraisal of the P1
slippery and P2 rough surfaces, either without sonification (P1, P2), or with
agreeable (P1A, P2A) or disagreeable (P1D, P2D) sonification. 100% indicated
that all participants gave the same response (*, p
To examine the relationship between movement sonification conditions and surface
hedonic judgement, emotional appraisal was evaluated using a 4-point Likert scale
(as in Faucheu et al. [28], who used the same materials). Importantly,
given our relatively small sample size (n = 12), a 4-point scale enhances
response reliability compared to scales with more categories. By limiting the
number of choices, it simplifies responses, reduces noise, avoids neutral ‘safe’
answers, and ensures clearer judgments, thereby yielding more interpretable data.
For the slippery. P1, adding either a pleasant or unpleasant sound did not change
the hedonic perception of the surface (p = 0.67). A striking finding is
that only the rough, and less pleasant P2 surface showed a change in its hedonic
valence depending on the sonification conditions (
Given that the power of beta-band neural oscillations is inversely correlated with cortical processing [34, 35], contrasting the topographical distribution of beta power between both sonification conditions and the silent stroke condition can provide reliable estimate of the effect of movement sonification on cortical processing. For the P2 rough surface, the contrasts revealed a significant reduction in beta-band power within the source-estimated sensorimotor and superior parietal cortices during stroking under both sonification conditions, relative to the silent stroke condition (Fig. 5A, cold blue color). This decreased beta-band power (ERD) suggests amplified neuronal responses when the somatosensory inputs, particularly of tactile origin from the stroking movement, are paired with auditory inputs. However, in other cortical regions, beta-band power varied depending on the valence of the sonification.
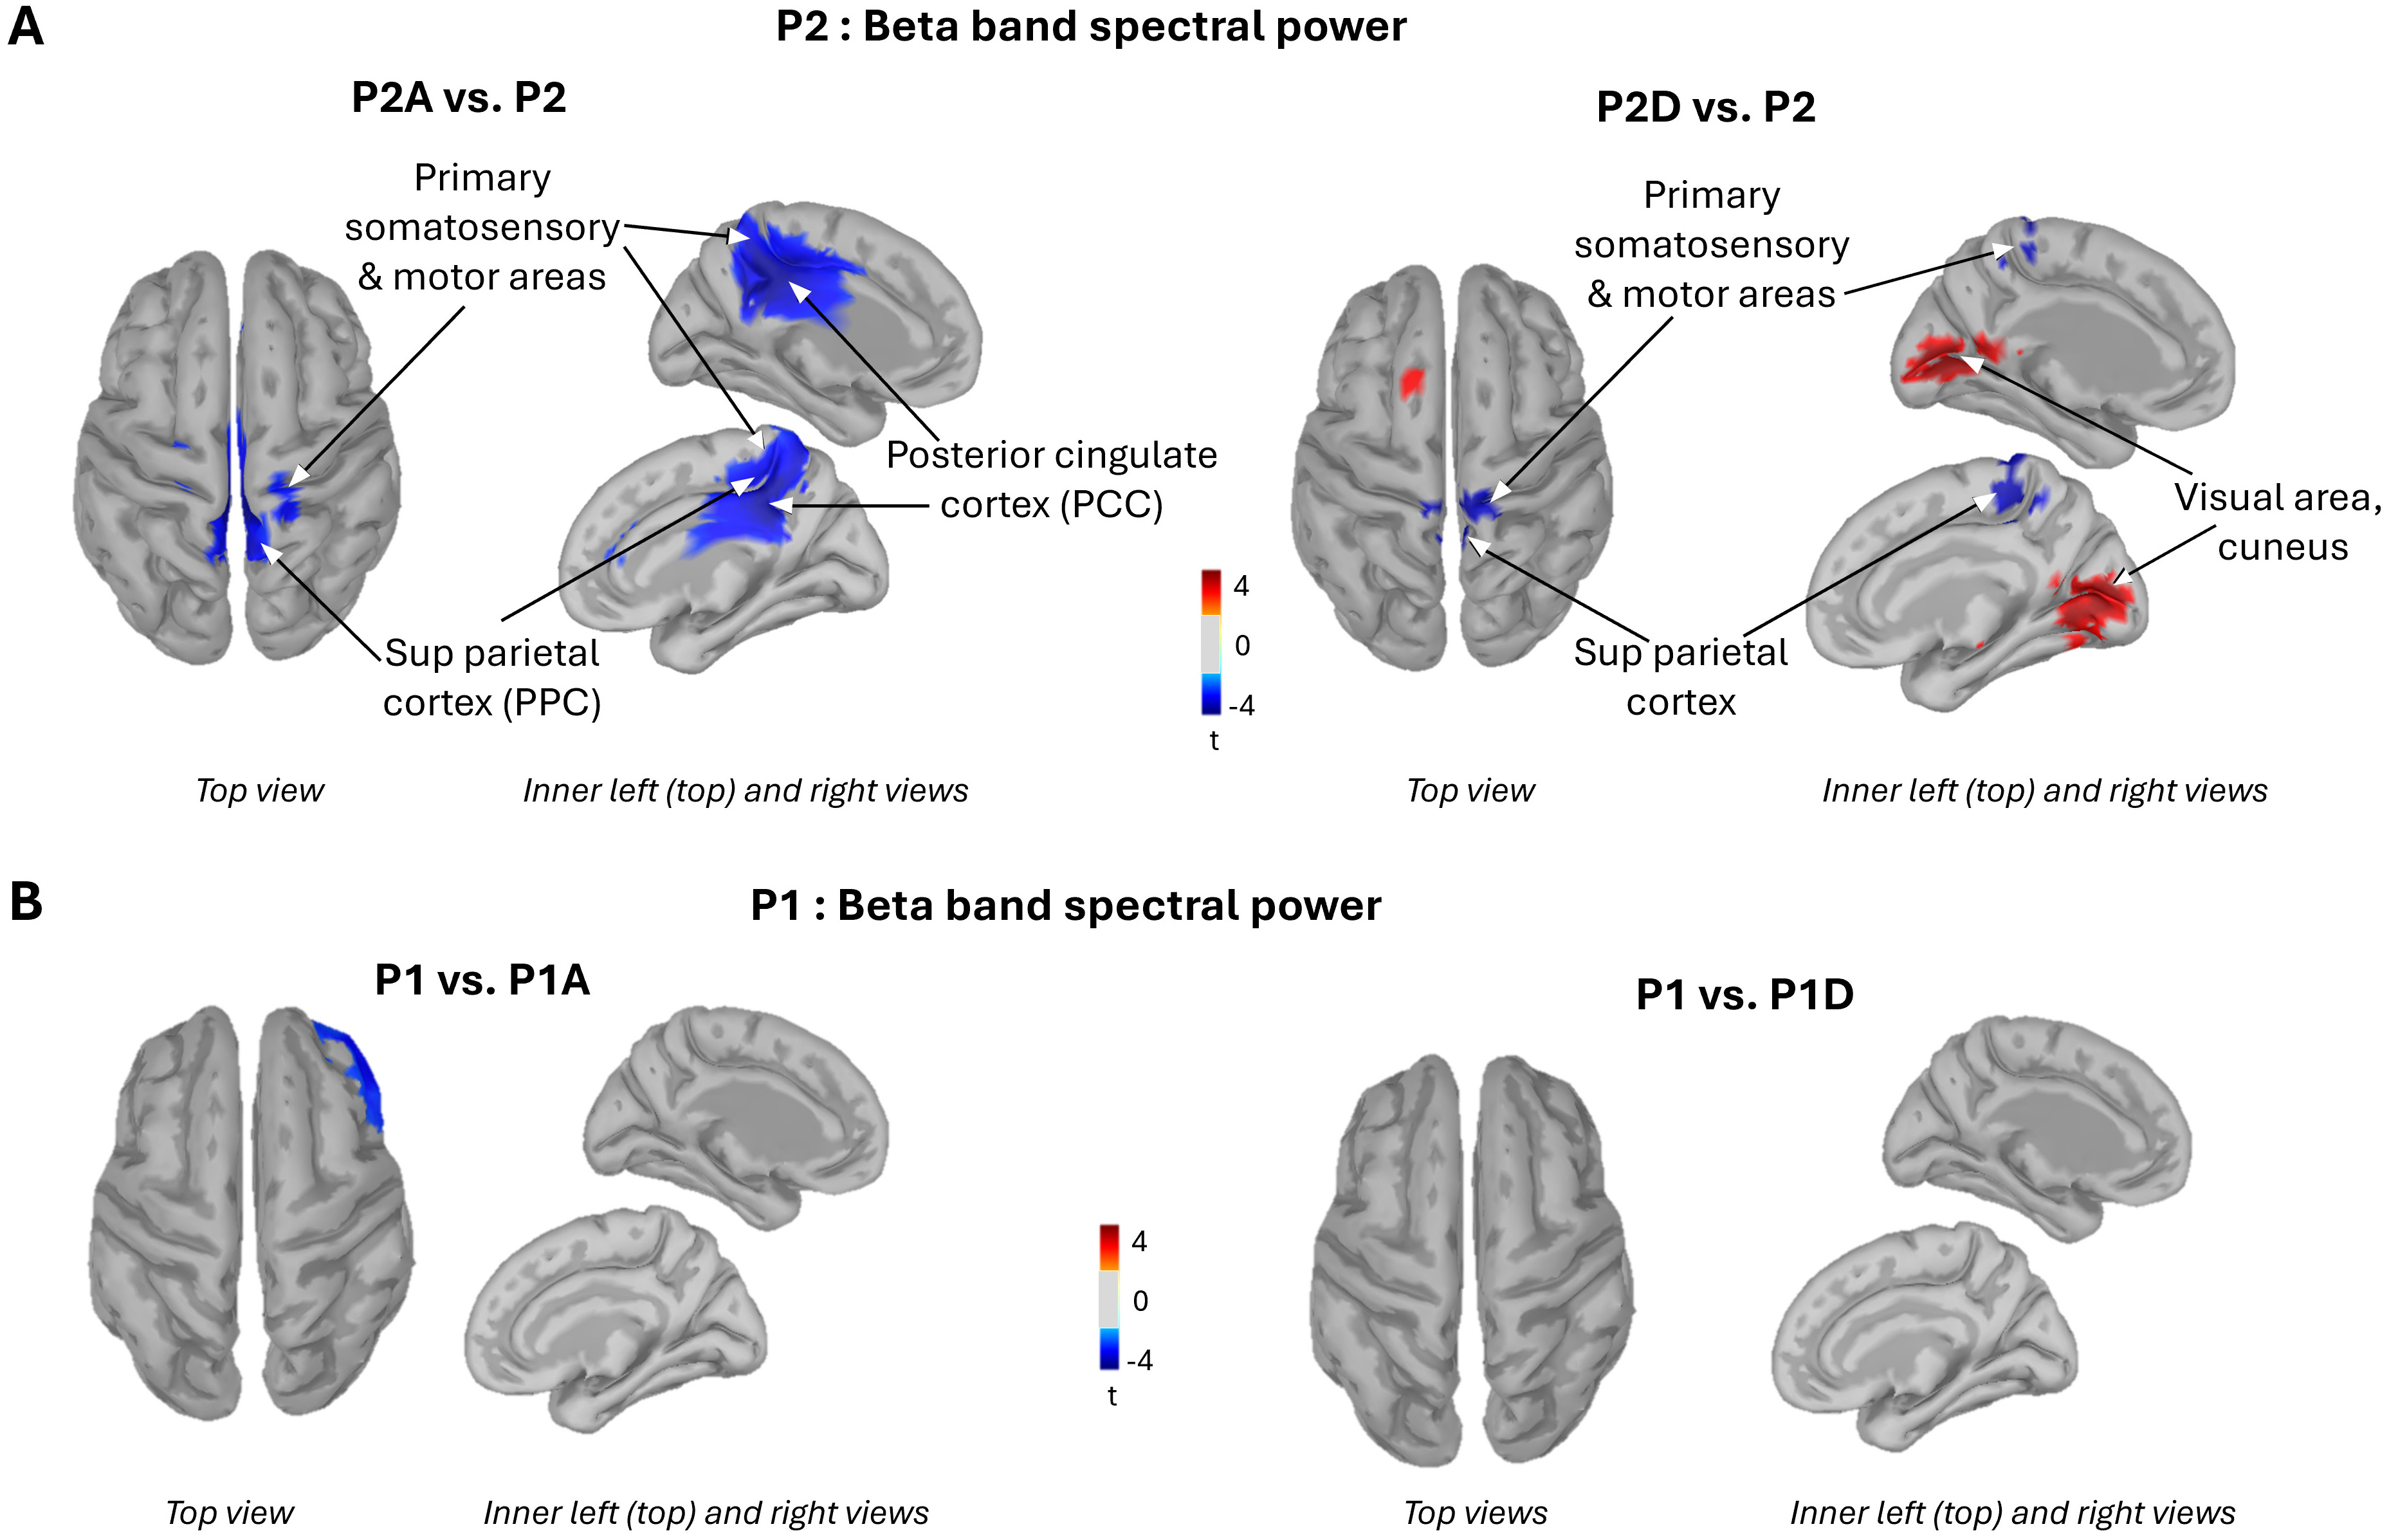 Fig. 5.
Brain activity. Topographical distribution of beta band power resulting from the contrasts: P2 rough surface with agreeable (left panel) and disagreeable (right panel) sonifications vs P2 with silent stroke (A), P1: slippery surface with agreeable (left panel) and disagreeable (right panel) sonifications vs P1 silent stroke (B). PCC, posterior cingulate cortices; PPC, posterior parietal cortex.
The agreeable movement sonification elicited an ERD largely circumscribed to the posterior cingulate cortices (PCC) (Fig. 5A, left panel). In contrast, the disagreeable sonification induced an increased beta-band power (ERS) over both the right and left primary visual cortices relative to the silent condition (indicated by the warm orange color in Fig. 5A, right panel). The valence of the movement sonification had no effect on beta-band power when stroking the P1 slippery surface (Fig. 5B). Overall, pairing an auditory stimulus with finger movement significantly altered cortical processing when participants stroked the rough, unpleasant P2 surface, but had no observable effect during contact with the smooth, pleasant P1 surface.
These findings were further confirmed by extracting the averaged beta band power over 4 regions of interest (ROI): the left and right PCC (Brodmann areas 23/31) and the left and right visual areas (Brodmann areas 17/18) (see Table 2 for ROI sizes and for individual values). Contrasts revealed a significant decrease in beta-band power during agreeable sonification compared to silent stroke, bilaterally in the PCC ROI (t = 3.21; p = 0.01 and t = 2.49; p = 0.03, for the left and right PCC, respectively). In the visual ROI, beta band power significantly decreased in the right hemisphere when stroking was paired with the disagreeable sonification relative to the silent stroke (t = –2.57; p = 0.02), with a similar trend for the left visual ROI (t = –2.09; p = 0.06).
| P2 | P2A | P2D | |||||||||
| Left PCC | Right PCC | Left Visual | Right Visual | Left PCC | Right PCC | Left Visual | Right Visual | Left PCC | Right PCC | Left Visual | Right Visual |
| 92 vertices | 124 vertices | 149 vertices | 156 vertices | 92 vertices | 124 vertices | 149 vertices | 156 vertices | 92 vertices | 124 vertices | 149 vertices | 156 vertices |
| 0.0056 | 0.0065 | 0.0045 | 0.0048 | 0.0049 | 0.0057 | 0.0043 | 0.0047 | 0.0052 | 0.0061 | 0.0044 | 0.0047 |
| 0.0152 | 0.0169 | 0.0120 | 0.0126 | 0.0135 | 0.0152 | 0.0117 | 0.0127 | 0.0160 | 0.0177 | 0.0137 | 0.0135 |
| 0.0156 | 0.0160 | 0.0038 | 0.0039 | 0.0143 | 0.0148 | 0.0039 | 0.0041 | 0.0140 | 0.0148 | 0.0040 | 0.0040 |
| 0.0084 | 0.0094 | 0.0066 | 0.0057 | 0.0086 | 0.0098 | 0.0078 | 0.0070 | 0.0084 | 0.0100 | 0.0067 | 0.0067 |
| 0.0409 | 0.0464 | 0.0294 | 0.0262 | 0.0364 | 0.0417 | 0.0286 | 0.0278 | 0.0445 | 0.0468 | 0.0389 | 0.0306 |
| 0.0009 | 0.0010 | 0.0004 | 0.0004 | 0.0009 | 0.0010 | 0.0003 | 0.0003 | 0.0010 | 0.0010 | 0.0004 | 0.0004 |
| 0.0166 | 0.0203 | 0.0122 | 0.0130 | 0.0135 | 0.0159 | 0.0133 | 0.0119 | 0.0171 | 0.0207 | 0.0146 | 0.0139 |
| 0.0183 | 0.0195 | 0.0116 | 0.0114 | 0.0170 | 0.0196 | 0.0133 | 0.0129 | 0.0185 | 0.0210 | 0.0145 | 0.0137 |
| 0.0139 | 0.0156 | 0.0068 | 0.0059 | 0.0122 | 0.0142 | 0.0069 | 0.0065 | 0.0151 | 0.0177 | 0.0099 | 0.0091 |
| 0.0115 | 0.0124 | 0.0078 | 0.0077 | 0.0110 | 0.0120 | 0.0070 | 0.0069 | 0.0109 | 0.0118 | 0.0076 | 0.0077 |
| 0.0147 | 0.0164 | 0.0095 | 0.0092 | 0.0132 | 0.0150 | 0.0097 | 0.0095 | 0.0151 | 0.0168 | 0.0115 | 0.0104 |
| 0.0107 | 0.0122 | 0.0080 | 0.0072 | 0.0094 | 0.0108 | 0.0079 | 0.0076 | 0.0118 | 0.0123 | 0.0108 | 0.0084 |
The number of vertices is indicated below each ROI. The values correspond to the mean frequency band of each participant. The mean and standard deviation for all participants are reported in bold in the last two rows of the table. ROI, regions of interest; PCC, posterior cingulate cortices.
The aim of this study was to investigate whether movement sonification alters the perceptual evaluation and hedonic valence of textured surfaces, as assessed through behavioural, psychophysical, and neurophysiological measures. The results show that texture appraisal is impervious to sonification conditions, whereas their emotional valence is not. This effect was observed with the P2 rough surface, which was classified as disagreeable and perceived as even more unpleasant when paired with disagreeable movement sonification. However, the brain’s response to the audio-tactile integration was altered by both the agreeable and the disagreeable movement sonifications. In both conditions where stroking movement evoked auditory inputs, we observed a marked decrease in beta-band oscillatory power over the sensorimotor cortex and the superior parietal cortex as compared to silent touch. Such decreases in beta-band power are commonly interpreted as reflecting increased cortical excitability and enhanced sensory processing [36, 37, 38, 39]. It is also in line with the functional magnetic resonance imaging (fMRI) study by Landelle et al.’s [16], which demonstrated the sensitivity of the primary somatosensory cortex to tactile input from the hand. The reason for the increased sensorimotor activity requires further investigation, and may reflect a combination of motor, emotional, and attentional processes. Nevertheless, our findings suggest that multisensory interactions are not confined to higher-order brain regions but also occur in early somatosensory areas, including primary somatosensory cortices and superior parietal regions.
This suggestion is supported by neuroanatomical studies showing direct thalamocortical projections to the superior parietal areas in macaques [40, 41, 42, 43]. The early multisensory interaction is thought to be mediated by means of phase resetting. The presentation of a stimulus to one sensory modality (e.g., auditory) resets the phase of ongoing oscillations in another modality (e.g., tactile) such that processing in the latter modality is modulated [17, 44].
While these data speak to the importance of primary somatosensory regions for audio-tactile information integration, evaluating the hedonic valence of movement sonification likely engages higher-order brain areas. One candidate region is the PCC, which exhibited a significant increase in beta band ERD (15–25 Hz) during agreeable sonification compared to silent touch. However, this change in beta band power was not accompanied by a corresponding change in the emotional rating of the scanned surface. It is possible that altering the hedonic valence of the touched surface would require a sound that is not merely free of dissonance but is explicitly pleasant. The fact that PCC beta-band power remained unchanged during disagreeable sonification suggests that this medial cortical region may be specifically involved in processing pleasantness. In this light, our findings are consistent with studies showing that the PCC is engaged in evaluating the emotional valence [45] and context of sensory information via pathways from somatosensory regions (superior and inferior parietal areas [46]), auditory regions [47] and adjacent cingulate areas such as the midcingulate cortex [48, 49, 50]. Due to these extensive connections, the PCC is considered to exhibit the highest degree of cross-network interaction [51].
When false notes were present while stroking the P2 rough surface, a bilateral decrease in activity was observed in the early visual cortex compared to silent touch. This was evidenced by an increase in event related synchronization ERS (red/warm color, Fig. 3A, right panel) in occipital regions (BA17/18). One could argue that this effect reflects task-related disengagement, given that participants’ eyes were closed. However, because the eyes were closed in all sonification conditions, the increased ERS observed in visual areas when contrasting beta power topography between the disagreeable and silent conditions cannot be attributed to the absence of visual feedback. The disengagement of visual cortical areas during disagreeable movement sonification may have played a crucial role in enhancing auditory-driven emotional responses. Surface texture is often co-deployed with a visual pattern, allowing the formation of a combined haptic-visual representation of the surface. The reduction in visual cortex activity may have redirected participants’ attention away from the visual attributes of the surface, thereby giving more weight to the disagreeable sonification and amplifying its emotional impact.
The potential mechanism explaining why participants rated the rough surface as even more unpleasant when their haptic exploration was paired with dissonant sonification is twofold. First, the visual cortical area, known to receive direct retinal inputs from the thalamic lateral geniculate nucleus, can be modulated by auditory signals. Signatures of auditory inputs in primary visual cortex were previously observed by Vetter et al.’s [52] fMRI study in absence of visual inputs [53]. Their results showed that the visual cortex contributes, via its corticocortical connections, to the encoding of complex natural sounds as abstract, higher-level internal representations [54], further highlighting the existence of multiple cortical representations of sounds.
Second, our results may be interpreted within the framework of the Bayesian causal inference model that postulates that multisensory integration is a consequence of an optimal probabilistic inference of each sensory modality [55]. Accordingly, both sensory sources, auditory and tactile, are integrated in the judgment task but with a different weight allocated to each sensory input, which depends on the level of relevance and accuracy of the processed information. For instance, for the surface P2, the addition of disagreeable sounds shifts the emotional response towards the unpleasant, as the emotional categorization of the tactile modality is less stabilized as shown by the emotional rating distribution. The lack of effect of sound conditions on neural excitability for the P1 slippery and agreeable surface suggests that the tactile modality has a greater weight than the auditory modality in this texture perception task, both at the perceptual and emotional levels. In other words, adding an unpleasant sound is not sufficient to override the agreeable tactile experience (P1). This observation may also point to the presence of a valence threshold effect; whereby only unpleasant textures are subject to modulation. In line with this interpretation, Ackerley et al. [56] reported that listening to classical music evoking sad, neutral, or happy emotions alters the sense of limb position (i.e., proprioception, not tactile), by increasing muscular fiber sensitivity to muscle shortening/lengthening. This effect was found for sad music, but not for happy music, relative to neutral, further suggesting a valence threshold effect.
This study shows that the hedonic valence of auditory signals can modulate emotional aspects of touch without altering texture perception and, outlines possible underlying brain mechanisms. However, it presents some limitations. The most notable concerns the relatively small sample size and the limited set of textured surfaces tested which can both restrict the generalizability of the findings. Future studies should also consider individual differences in sensory (audio, tactile) discrimination abilities and in the emotion elicited by touch and sound. Indeed, we know that sensitivity to sounds and music [57], and to haptic information [58] varies across individuals. Exploring both sensory domains in tandem would provide a more comprehensive understanding of the complex interplay between tactile and auditory processing.
Our results offer new insights into the neural mechanisms by which hedonic valence of auditory signals modulates haptic emotional processing, without disrupting the perceptual analysis of texture properties. More precisely, texture appraisal seems unaffected by sonification conditions, whereas their emotional valence is clearly influenced. This effect was evident for the disagreeable texture, which was perceived as even more unpleasant when paired with disagreeable sonification. At the neural level, audio-tactile integration was altered by both the agreeable and the disagreeable movement sonifications. These findings confirm that the emotional valence of the texture perception arises not only from tactile input, but also from multisensory processing. Finally, augmented audio reality offers promising clinical applications for modulating the emotional and sensory experience when interacting with physical objects in individuals with sensory or emotional regulation deficits.
The paper is listed as, “Movement sonification during haptic exploration shifts emotional outcome without altering texture perception” as a preprint on BioRxiv at: https://www.biorxiv.org/content/10.1101/2025.05.28.656569v1.abstract.
The data generated and analyzed during the present study are not publicly available for ethical reasons but are available from the corresponding author on reasonable request.
Conception, investigation, formal analyses, methodology: LM, PHC, JF, AW, FM, EC, JD designed the research, analyzed and interpreted the results. CS, BW, JB analyzed the data and interpreted the results. LM, PHC, JF, AW, FM, EC, JD, JB wrote the manuscript. All authors contributed to editorial changes in the manuscript. All authors read and approved the final manuscript. All authors have participated sufficiently in the work and agreed to be accountable for all aspect of the work.
All participants gave their written informed consent to take part in this study, which conformed to the standards set in the Declaration of Helsinki. This study was approved by the Ethics Committee for research in Sciences et Techniques des Activités physiques et Sportives (CERSTAPS: IRB00012476-2021-09-12-140).
We thank Gilles Marivier and Pauline Couta, society Weydo Music, for creating the sonification setup and Franck Buloup for developing the software Docometre used for data acquisition.
This work was supported by the project COMTACT (ANR 2020-CE28-0010-03), funded by the french “Agence Nationale de la Recherche” (ANR).
The authors declare no conflict of interest.
References
Publisher’s Note: IMR Press stays neutral with regard to jurisdictional claims in published maps and institutional affiliations.