


 , Juliana Dushanova 2,*
1 Department of Physiology and Pathophysiology, Faculty of Medicine, Medical University of Sofia, 1431 Sofia, Bulgaria
2 Institute of Neurobiology, Bulgarian Academy of Sciences, 1113 Sofia, Bulgaria
Abstract
In previous studies, children with developmental dyslexia (DD) have been found to exhibit alterations in auditory sampling within the delta/theta and low-frequency gamma bands in auditory cortical areas during the initial processing stages, which affects the development of phonological skills. It has been suggested that auditory frequency discrimination measures sensory processing in language disorders such as DD. However, it is unclear how the pure-tone frequency discrimination task can detect abnormalities in functional connectivity in DD.
We investigated local and global topological properties of functional networks in electroencephalographic (EEG) frequency bands from δ to γ2 based on a small-world propensity (SWP) model. This was done in both groups during pure-tone frequency discrimination.
Auditory α-, β-, and γ1-networks in the DD group were more integrated and less segregated than those of the control group. They were also not as functionally specialized, as indicated by larger deviations in characteristic path lengths and smaller deviations in clustering. The balanced segregation and integration (moderate clustering and path length) observed in the control group’s γ2-network may explain the optimal structure underlying their better performance. In the low-tone auditory θ- and γ2-frequency networks, the DD group, when compared with controls, lacked hubs in the inferior frontal cortex (IFC) and parietal connectivity to sensory areas. In the control group, however, the superior parietal lobes (SPL) mediated sensory connections. In the high-tone auditory network, only the controls had strong hubs in the right sensorimotor/auditory cortex (δ-frequency), bilateral IFC (γ1), and bilateral anterior temporal cortex (aITG, γ2), while the main hubs in the DD group were only in the left hemisphere. In the γ1 (high-tone) and γ2 (both tones) networks, controls showed strong right frontal-parietal-sensory hubs, which were lacking in the DD group during the task discrimination.
The impairment in low-tone discrimination in the DD group is due to a lack of SPL-prefrontal connectivity within the auditory network. For high-tone discrimination, the DD group showed engagement of only the left-sided auditory network, with bilateral prefrontal recruitment (δ-network). In contrast, the SPL in the control group integrates sensory input for tone prediction, establishing tone-specific sensory/auditory connections with left prefrontal involvement (δ-network). Lower predictability for high tones in the DD group led to more localized processing with prefrontal influence. Overall, reduced frontotemporal connectivity in the DD group may indicate poorer auditory processing. This is likely due to impaired prefrontal-sensory communication and reduced interhemispheric auditory communication, which may underlie perceptual-cognitive biases in tone frequency discrimination.
Graphical Abstract
Keywords
- developmental dyslexia
- auditory processing
- functional connectivity
Developmental dyslexia (DD), a reading and spelling disorder affecting children with normal intelligence, is primarily linked to difficulties in processing speech sounds, known as phonemic awareness [1, 2, 3, 4, 5]. Research also suggests that individuals with dyslexia may struggle with both speech and non-speech sound perception [6, 7, 8].
Auditory skills, which are crucial for language development, involve two distinct but related abilities: auditory recognition and auditory discrimination. Auditory recognition refers to the ability to identify and remember sounds, an early step in vocabulary building and language comprehension that focuses on overall sound processing rather than fine distinctions. In contrast, auditory discrimination involves a more refined level of listening. It is the ability to perceive and differentiate between subtle variations in sounds, such as pitch, tone, frequency, or duration. This skill is particularly critical for developing phonological awareness in young children—the capacity to hear and manipulate the sounds that make up words. Consequently, without strong auditory discrimination, children may struggle to distinguish between similar sounds, which can lead to difficulties in reading, spelling, and articulate speech.
Studies reveal links between auditory processing impairments and differences in the auditory cortex [5, 9, 10]. A prominent hypothesis suggests that dyslexia originates from a deficit in processing rapid auditory changes, which in turn leads to phonological and reading problems. Numerous studies indicate a fundamental auditory processing deficit in dyslexia [8, 11, 12, 13, 14, 15, 16], specifically concerning the processing of rapid temporal changes that differentiate consonants within a language [17, 18, 19]. The phonological problems associated with dyslexia may result from difficulties in processing rapid speech timing, a notion supported by the observed link to musical rhythm processing [20]. However, research has not definitively confirmed the precise nature of this auditory deficit—such as whether it is specific to speech or encompasses more general acoustic processing [11], or if it is limited to rapid temporal processing [8, 12, 13, 14, 15, 16, 17] versus broader spectrotemporal processing [18]. A core deficit in dyslexia is the ability to process and manipulate individual speech sounds (phonemes) [21, 22].
Dyslexia is not solely a language-based disorder; it also has fundamental auditory processing underpinnings, with both temporal and tone processing affecting phonemic awareness [23, 24, 25, 26]. These auditory deficits extend beyond speech, impacting the processing of various non-speech sounds, and their connection with linguistic abilities suggests shared neural pathways and processing mechanisms. Research highlights the significant role of tone processing in understanding dyslexia. Beyond temporal processing, studies also link phonemic awareness to pitch processing. Since speech sounds have distinct frequencies and pitch perception reflects frequency, it is hypothesized that both phoneme and pitch perception may rely on a common mechanism of frequency discrimination. Consequently, pitch sensitivity is relevant to reading because phonemic awareness has been shown to correlate with performance on pitch-related tasks [27]. Furthermore, the fact that specific language impairment (SLI) is associated with deficits in pitch discrimination strengthens the connection between musical pitch ability and phonemic awareness [28, 29, 30, 31].
The hypothesis of a common neural substrate for linguistic sound and musical processing, which could explain both dyslexia and tone-deafness, is supported by evidence that the auditory deficit affects both speech and non-speech perception, as well as by the established link between phonemic awareness and pitch perception [19, 21, 22]. This framework suggests that understanding the relationship between developmental language disorders and tone-deafness is crucial for future research.
Frequency discrimination, a fundamental auditory skill [32], is significantly
affected in children with auditory processing challenges, particularly auditory
processing disorder (APD). Both APD and SLI impact frequency discrimination and
the detection of frequency differences above a certain threshold level
(
Research on pure-tone frequency discrimination in typically developing school-aged children [34] reveals significant variability among them. Some children could detect very small frequency differences (around 1% of a 1000 Hz base frequency [34]), while others required much larger differences (around 10%) in a bimanual presentation [33]. Children with dyslexia have demonstrated impaired tone discrimination, with a difference threshold of up to 15% (e.g., distinguishing 0.9 kHz from 1.05 kHz [33]). This impairment is even greater in dichotic presentations, where a 20% impairment has been reported [35].
Crucial for cortical sound processing [36], the auditory network encompasses several key brain regions: the primary and auditory association cortices, both residing in the superior temporal cortex. This network reaches beyond the temporal lobe to include portions of the parietal lobe, the posterior superior and middle temporal cortices, and the temporal pole. Additionally, subregions of the inferior parietal cortex (IPL) and the temporal-parieto-occipital junction contribute. These auditory regions functionally connect with frontal areas, alongside the primary somatosensory and middle occipital cortices [37]. The parietal and frontal lobes handle the final stages of sound processing. The primary auditory cortex (A1) is the main site for simplified auditory processing, handling simple sounds like unchanging single-frequency tones. However, complex sounds, such as noise bursts or speech, require more extensive processing that spans A1 and other auditory areas. Within this network, neural frequency tuning seems to mirror perceptual qualities, such as tone, rather than just the sound stimulus’s physical traits [38, 39]. Significantly, the right auditory cortex is more sensitive to sound’s spectral details (tonality), while the left auditory cortex shows greater attunement to rapid temporal dynamics, evident in speech [40]. The auditory cortex’s belt region, particularly its caudal fields, forms significant connections with the secondary visual [41] and secondary somatosensory cortices [42, 43]. Moreover, tonality is represented not only within the auditory cortex but also in the rostromedial prefrontal cortex [44].
Individuals with dyslexia often show auditory processing differences, marked by altered neural activity in the auditory cortex. These manifest as prolonged auditory evoked potentials (P1, N1, P2) and atypical mismatch negativity (MMN) responses. The MMN responses are elicited solely by the brain’s ability to distinguish deviant from standard stimuli, regardless of focused attention. The brain’s MMN, a response to changes in repeated sounds, serves as an indicator of central auditory processing, relying on both novel acoustic input and the memory of preceding sounds [45, 46]. The finding of reduced electroencephalographic (EEG) mismatch responses in dyslexia has led to their widespread application in auditory and cognitive research [47, 48, 49, 50]. Both adults and children demonstrate MMN responses even to subtle frequency differences [51]. An insensitivity to repetition could explain the abnormal mismatch response in individuals with dyslexia [25, 52], especially for speech, by disrupting repetition-induced neural habituation [53]. Within a predictive coding framework [54, 55], this phenomenon highlights the brain’s continuous model updating for stimulus consistency, a process fundamental to perception and learning [45]. In children, the P1-N1-P2 acoustic complex shows age dependency and reflects sensitivity to frequency changes, capable of detecting variations as minor as 1% of the base frequency. This complex, recorded at temporal electrodes, holds significant importance for studying auditory cortex activity related to frequency discrimination. Magnetoencephalography (MEG) studies, specifically, have documented delayed brain responses (P1, N1, P2) in individuals with dyslexia, suggesting an underlying auditory and sensory processing deficit [51]. Further, recent research points to structural and functional changes within the auditory cortex in dyslexia [37, 56, 57, 58].
Expanding on connections with other disorders and insights from dyslexia research, the auditory processing hypothesis for dyslexia proposes that the auditory difficulties experienced by individuals with dyslexia aren’t confined to complex sounds [56, 57, 58, 59, 60, 61]. Instead, it suggests they may also encounter challenges discriminating simple tones that typically demand minimal auditory processing. These anticipated difficulties with both pure tones and complex sounds would inherently require broad engagement from brain networks, including both primary and associative auditory cortices [62]. Brain abnormalities are evident in Neuroimaging studies of disorders such as dyslexia (a reading and language impairment), tone-deafness (congenital amusia), and developmental prosopagnosia (face recognition impairment). These issues notably affect the inferior frontal cortex (IFC) and the crucial pathway linking the frontal, parietal, and temporal lobes [63, 64]. A shared underlying pathology, like early neuronal migration disorders or problems with axon outgrowth or guidance during development, could be at play. This common root might result in subtle malformations across multiple brain networks, manifesting as various functional impairments: a more pronounced effect on the left hemisphere for dyslexia, the right for tone-deafness, and more widespread regions for prosopagnosia. Functional magnetic resonance imaging (fMRI) and electrophysiology investigations have identified brain abnormalities within the auditory cortex of children presenting with SLI and APD. However, MMN studies have yielded inconsistent results: some indicate reduced MMN amplitude in SLI children who performed poorly on a gap detection task [65, 66], while others report no significant differences. Notably, children with both SLI and APD displayed the weakest MMN responses [60, 67]. Anomalies in the P1, N1, and P2 components have also been observed, indicative of immature or delayed auditory pathway development.
While control subjects typically show a right hemisphere preference for tone processing, this is frequently absent in individuals with dyslexia [35]. Compensated dyslexia, even with typical speech lateralization, might involve less specialized general auditory lateralization [64]. Furthermore, the medial temporal lobe plays a supportive role, enabling individuals with dyslexia and other procedural memory deficits to sustain performance on serial reaction time tasks [68].
The reliability of neural findings, particularly MMN evidence concerning reduced automatic speech discrimination in dyslexia, remains a subject of ongoing debate [51]. To reconcile these conflicting outcomes, future research should differentiate between speech perception and general regularity detection and, critically, establish a stronger link between neural measures, behavioral performance, and broader language difficulties [67]. Ultimately, dyslexia is best characterized by a reduced capacity to learn and effectively utilize short-term statistical regularities, which are essential for enhancing perception and minimizing processing costs.
It’s been proposed that graph theory [69] be applied to brain networks, offering another perspective for understanding auditory processing in DD [70]. In functional brain networks, unusual graph metrics often point to changes in aspects like path length, clustering coefficients, or how hubs are distributed. Crucially, researchers have observed that DD involves both altered graph metrics and changes in the overall network structure. This includes a disrupted balance between local specialization and global integration within the brain’s networks. By using graph theory to analyze functional connectivity data, we can uncover precisely how different brain regions interact and organize themselves to support cognitive functions. This powerful approach could illuminate the specific ways network development is disrupted in DD, paving the way for deeper understanding and potential interventions. This research considers to studying auditory processing in children with DD to explore its developmental relationship with different frequency networks.
Examining pure-tone frequency discrimination is essential for understanding auditory processing deficits in children with DD. Research suggests that the sharpness of high-frequency components is crucial for speech encoding, recognition, and retrieval [71]. This is particularly relevant in Bulgarian, where consonants exhibit distinct high-frequency acoustic characteristics depending on whether they precede front or back vowels [72, 73].
This study investigates the impact of simple pure tones on auditory discrimination in the DD group, specifically exploring the relationship between tone frequency and neural processing. We further examine brain connectivity in the DD group using graph theoretical analysis and the small-world propensity (SWP) model.
Given that no previous research has investigated how pure-tone discrimination affects functional brain networks in the DD group, a key question emerges: Can the analysis of brain functional networks help us understand the neurophysiological origins of DD, as well as the connection between the functional auditory network and specific local brain hubs? Our primary goal is to determine the variability in brain networks between the control and DD groups during a tone discrimination task.
We hypothesize that the DD group will exhibit altered SWP and reduced connectivity within various frequency-specific brain networks compared to typically developing children. We further hypothesize that these alterations may be modulated by tone frequency. We expect that if differences are found in the functional auditory networks of the DD group, they will be manifested as changes in specific local hubs within certain frequency networks during the auditory task.
All participants had hearing thresholds better than 20 dB hearing level (HL) in both ears across standard audiometric frequencies (250 Hz to 8 kHz). With the exception of pure-tone audiometry, all auditory stimuli were digitally created in MATLAB R2018a (MathWorks, Inc., Natick, MA, USA) and transformed into analog signals via a 24-bit sound card at a 44 kHz sampling rate. The stimuli consisted of 50 ms pure tones at 900 Hz (low) and 1050 Hz (high). To ensure smooth onset and offset, 5 ms half-Hanning windows were applied. Tones were presented binaurally through Sound Blaster Z SE speakers powered by a Sound Blaster Z Audio Processor (Cat. No. SB1500, Creative Technology Ltd., Singapore) in blocks. Each block contained 40 low and 40 high tones, presented in a pseudo-random order. The interstimulus interval (ISI) varied between 1.5 and 2.5 seconds during each experimental session (Supplementary Fig. 1). Stimuli were calibrated to 60 dB SPL using a sound level meter (Brüel & Kjaer, mod. 2238; MicroPrecision, Grass Valley, CA, USA) in a sound-attenuated booth. Participants responded by pressing the right button for a low tone and the left button for a high tone. The percentage of correct responses was displayed to the experimenter on a computer monitor at the end of each session.
Eligibility for this quantitative cross-sectional study was determined through a
neuropsychological examination [74] administered to all children. The study
included a DD group (n = 36; 18 boys/girls; 103
The dyslexic group was formed by selecting children who demonstrated reading difficulties, specifically scoring below the average range (more than one standard deviation) for their age on measures of reading speed and accuracy from both the Dyslexia & Developmental Dysorthography Assessment Battery-Second Edition (DDE-2) battery [76, 77] and the “Reading Abilities” test [78] (Supplementary Table 1). Age-matched children from the same socio-demographic backgrounds, who exhibited typical reading performance within the norms of the DDE-2 and “Reading Abilities” assessments, formed the control group that included no children diagnosed with dyslexia or any co-occurring language disorders.
A standardized test battery, including the DDE-2 for DD [76, 77], “Reading Abilities” tests [78], and the Girolami-Boulinier’s test for non-verbal perception with “differently oriented signs” [79, 80], was administered to all children. This battery revealed a wide range of reading and writing difficulties in the children with DD (Supplementary Table 1). Additionally, all participants completed Raven’s Progressive Color Matrices [81] to assess nonverbal intelligence.
Psychometric testing included a battery designed for primary school-aged children to assess reading, writing, and phonological awareness [78] (Supplementary Table 1). The “Reading Abilities” test battery evaluated reading fluency through reading a 133-word text aloud, and writing was assessed via dictation of 30 sentences with missing compound words. Phonological awareness was evaluated through tasks involving word identification and the omission of a word’s initial sound (“without the first sound-letter”) or final syllable (“without the last syllable”). Differences between the control and DD groups were observed in both the accuracy and speed of test completion (Supplementary Table 1). Importantly, all children with DD demonstrated normal nonverbal intelligence quotient (IQ) scores on the Raven test, consistent with age-appropriate norms.
EEG signals were recorded using a 40-channel wireless system (https://portal.bpo.bg/bpo-registers/utility-models/view/BG_U_2023_5703) [82] featuring
star-shaped dry gold sensors. Data were sampled at 250 Hz. Electrodes were
positioned according to both the 10–10 and 10–20 systems (Supplementary
Fig. 2), encompassing the following locations: 10/10 (AF3–AF4, F7–F8,
FT9–F10, FC3–FC4, FC5–FC6, C1–C2, C5–C6, CP1–CP2, CP3–CP4, TP7–TP8,
P7–P8, PO3–PO4, PO7–PO8) and 10/20 (Fz, F3–F4, C3–C4, Cz, T7–T8, P3–P4,
Pz, O1–O2, Oz; Supplementary Fig. 2) [83, 84]. Reference electrodes were
placed on the processus mastoidei and the ground electrode was positioned on the
forehead. Rereferencing to global median reference was performed online to
eliminate the volume conduction [85]. Skin impedance was maintained below 5
k
Individual trials were segmented into 800-ms epochs locked to stimulus onset.
EEG signals underwent bandpass filtering (1–70 Hz; Chebyshev II) and a 50 Hz
notch filter was applied. Before we analyzed the data set was band-pass filtered
by using a 4th-order Butterworth filter in forward and backward directions to
avoid artificial phase shifts in each frequency band:
Following preprocessing, the average number of artifact-free data epochs per
condition and subject (mean
Functional connectivity between brain regions was assessed by computing the weighted phase lag index (wPLI) [87, 88]. For all possible pairs of EEG sensors, an adjacency matrix was constructed, with separate computations performed for each time series and for each frequency band. The wPLI quantifies the extent of phase synchronization between two brain regions and reduces the bias introduced by volume conduction [87, 88]. The wPLI is calculated as a fraction: the numerator highlights the magnitude of phase lag asymmetry, while the denominator scales the result, ensuring the wPLI value always falls between 0 and 1. A wPLI value near 0 indicates an absence of a consistent phase lag, whereas a value closer to 1 indicates strong and consistent phase synchronization. The wPLI was used to determine the weighted adjacency matrix, which was then applied to calculate the network’s SWP [89].
The efficiency of information transfer within the network was quantified using
SWP (
Small-world characteristics are quantitatively defined by the deviation of the
observed network’s clustering coefficient (
For each frequency-specific functional network, brain connectivity
characteristics, such as SWP (
Local node measures included strength (defined as the sum of weights to all other nodes) and betweenness centrality (BC), which is the proportion of all shortest paths in the network that pass through a given node [90, 91, 92]. Both strength and BC values were calculated for each node using the weights within the adjacency matrix. These values were then normalized for each subject by dividing a node’s score by the average of the local measures across all nodes. Nodes exhibiting high strength (and consequently high BC) are crucial for information processing within the network, as they are involved in a large number of the shortest paths between other nodes [93]. The most crucial nodes in a network are often termed hubs [91]. A key indicator of a network’s integration is a higher maximum BC or strength [90, 92]. Hubs were defined as nodes whose strength or BC, averaged across all participants, was at least one standard deviation greater than the group’s average for that measure. The most important links were then determined by identifying edges whose BC, averaged across all participants, was at least one standard deviation above the mean group edge BC.
The characteristics of individual brain networks, summarized at the participant level for each frequency band and tone, were established by combining anatomical parcellation methods, brain mapping techniques, and connectivity measures using the BrainNet Viewer functional package 1.7 (http://www.nitrc.org/projects/bnv, [93]). This package was then used to map nodes (brain regions) and edges (connections) onto a brain template, with their properties represented by size and color.
During EEG recording sessions, Kruskal-Wallis nonparametric tests (KW test) were used to compare reaction times and performance accuracy between control and DD groups for each tone condition (low/high).
A multi-way analysis of variance (ANOVA) was conducted on the global measures,
with the within-subject factors of tone (low, high) and frequency (
A multi-way ANOVA was conducted on the local measures, employing the same
factors as described for the global measures. Local measures of individual nodes
were assessed using statistical methods based on non-parametric permutation
analyses with cluster-mass tests [94, 96]. Hubs were identified as nodes where the
maximum strength or BC value was at least one standard deviation greater than
their respective group’s average for that measure. Significant clusters were
identified by applying a critical value to the maximum cluster statistic, with
the false alarm rate controlled through multiple comparison corrections. The
nodes within these clusters were indexed according to their corresponding EEG
sensors, and the medians of their distributions were used to examine hemispheric
differences. Permutation tests with cluster-mass tests were employed to
effectively control the FWER and address the multiple comparisons problem for the
dependent local measures (adjusted significance level: p =
Children with DD were significantly faster than controls only for the high-tone
condition (mean
 Fig. 1.
Significantly different behavioral characteristics and reaction times in ms and successful discrimination of tones in % between the control group (blue) and children with DD (yellow). RT, reaction time; LT, low tone; HT, high tone. In the color plots, the mean is marked by an asterisk (*), and the median by a dash (——), as indicated by the black violin legend.
The control group gave better success discrimination compared to the children
with DD for low tone (children with DD, 64.54
When comparing two tones in a series of trials, performance is influenced by an implicit memory of previously presented tones [98]. Both control children and those with DD form this implicit memory, which they use to aid in subsequent tone discrimination. However, children with DD benefit less from this effect, particularly for low tones. This deficit is reflected in faster reaction times, a finding observed exclusively in the high-tone condition.
Analysis of global measures showed a significant within-group effect for tones
(F(1, 1036) = 8.79, p
Significant differences in global network measures between children with DD and
controls in low- and high-tone conditions showed (Fig. 2; Supplementary
Tables 2,3) that the controls exhibited statistically higher
 Fig. 2.
The global measures (
Significant differences between groups were found in the high tone at: (1)
A difference was found between the groups in the
These global features suggest that these frequency networks in dyslexic children are more integrated than in controls and not as well segregated as in controls. Heterogeneous trajectories of cortical network maturation during childhood underlie variations associated with disruptions in brain network development across the studied groups.
Analysis of EEG graphs revealed changes in the local characteristics (hub
strength, hub BC, and connections between them) of functional brain networks in
control children and those with DD. Analysis of local measures showed a
significant within-group effect for tones (F(1, 1484) = 4.55, p
Different rates of cortical network maturation between groups during childhood contribute to variations in local measures (BC, Str) of certain frequency networks associated with disruptions in brain network development. These local measures indicate that certain frequency networks in children with DD are more integrated compared to controls and are not as well segregated as in controls.
In the low-tone condition, the distribution of the strongest hubs in the
| Frequency band | Local measures | Controls | Dyslexia | Kruskal-test | Wallis |
| Main hubs | Main hubs | p-values | |||
| strength | AF3–4, Fz, F3, FC5, C5, CP1, T8 | AF3, F7, F3, FC3, CP1, T8 | 0.693 | 0.154 | |
| BC | Fz, FT9–10, T8, PO4 | F7, FT9, C3, CP2 | 0.246 | 1.342 | |
| strength | Fz, FC3, F7, FT9, C1, C5, TP8, P4, Oz | FC3–4, C3, C5 | 0.012 | 6.188 | |
| BC | F7, FT9, C3, T7, PO8 | Fz, FC3, FT9, C3, T7, PO8, O2 | 0.130 | 2.291 | |
| strength | Fz, C1, C3, C5, CP1, P8, Pz, PO8, O1–2 | C3, CP3, TP7, P3, PO7 | 0.043 | 4.090 | |
| BC | Fz, FT9, C3, C5, PO4, PO8, Oz, O2 | Fz, F7, FT9–10, C4, PO7–8, O2 | 0.094 | 2.803 | |
| strength | Fz, C1, Cz, C3, PO3 | F3, C1–2, C3–4, CP4, Pz, Oz | 0.033 | 4.535 | |
| BC | FT9, C3, T7, PO4, PO8, O2 | FT9, T7, PO4, P8, PO7–8, Oz | 0.194 | 1.682 | |
| strength | FT9, C3, T7, PO4, PO8, O2 | FC4, FT9, C3–4 | 0.183 | 1.771 | |
| BC | Fz, FC4, C2, Cz, C4, PO7 | F7, FT9–10, C3, TP7 | 0.531 | 0.392 | |
| strength | FC4, FT9–10, C2, C5, T7–8, TP8 | FC4, C4, C6, T8, TP8, PO8 | 0.043 | 4.090 | |
| BC | FC4, C4, T7, Oz, O2 | AF3, FT9, C6, T7–8, PO4, PO8, O2 | 0.094 | 2.803 | |
| strength | F3, FT9, C2, CP2 | FC3, FT9, C2, Cz, C3 | 44.110 | ||
| BC | FC6, FT9–10, C2, CP2, PO4, Oz | AF3, FC3, FT9–10, C2, C3, TP8, PO4 | 15.935 |
Statistically different local measures between groups for low-tone discrimination are indicated in bold. BC, betweenness centrality.
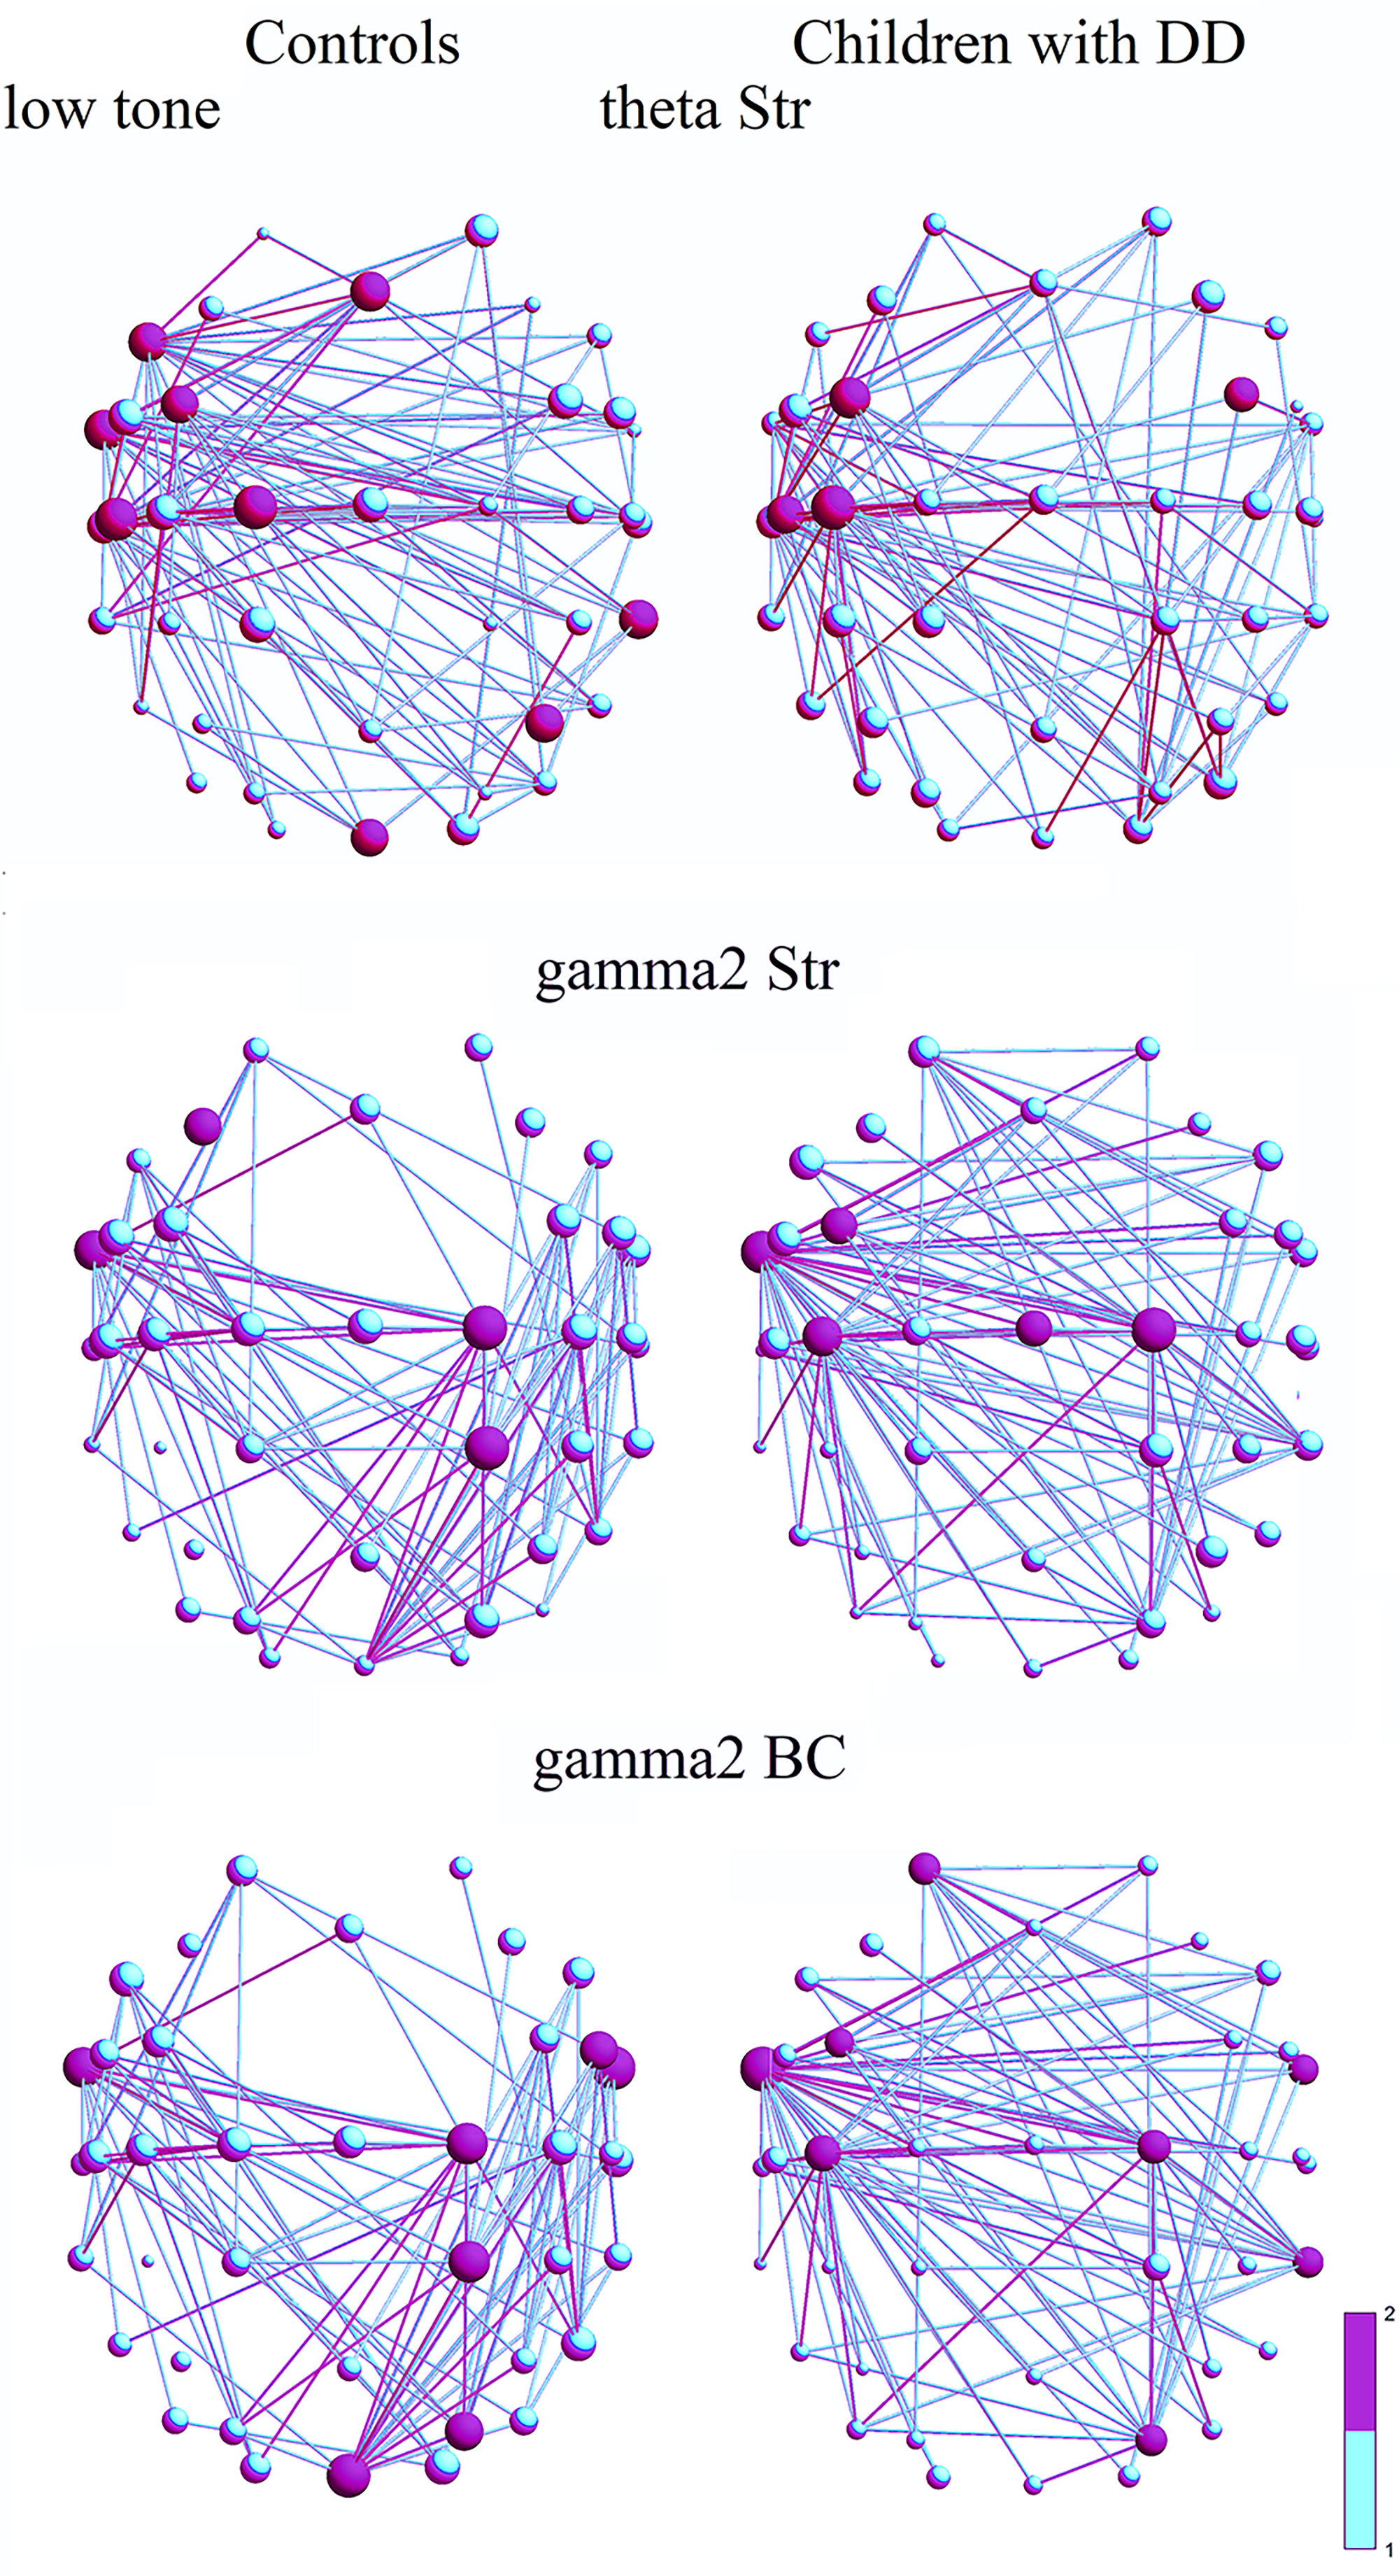 Fig. 3.
Frequency networks of controls (1st column) and children with DD
(2nd column) for a low tone. The 3D spatial network topology of nodes is shown
in scalp coordinates, using a color gradient from purple to cyan. Purple nodes
and connections represent main hubs and strong connections that are above the
significant threshold; their largest size corresponds to a value of 2 on the
color scale. Cyan nodes and links are below the significant threshold, with the
smallest size representing a value of 1: (1) Strength (Str) of hubs in the
In the
| Frequency band | Local measures | Control | Dyslexia | Kruskal-test | Wallis |
| Main hubs | Main hubs | p-values | |||
| strength | AF3, C6, T7, Oz | AF3–4, F7, FT9, C5, T7 PO4, P8, Pz | 13.360 | ||
| BC | C6, T7, TP7, PO8, Oz, O2 | F3, FT9, T7, PO4, P8 | 0.525 | 0.402 | |
| strength | FC3, FC5, Fz, PO7, Oz | F3, FC3, FC5, FT9, C3, C5 | 0.150 | 2.069 | |
| BC | FC3, FC5, FT9, C2, PO7–8, P8, Oz, O2 | Fz, FT9–10, PO4, PO8 | 0.079 | 3.078 | |
| strength | AF3, F3, FC3, C3, CP1, Pz, P3, O1 | CP1, CP3, PO3–4, P3, Pz | 0.240 | 1.376 | |
| BC | AF3, PO4, PO8, O1–2, Oz | Fz, FT9, T7, PO4, PO7–8 | 0.923 | 0.009 | |
| strength | Fz, FC4, C1, PO3, CP2 | AF3, F3, FC3, F7, FC5, C3, C5 | 0.069 | 3.291 | |
| BC | Fz, FT10, T7–8, PO4, PO8, Oz | AF4, F7, FT9–10, PO4, P8 | 0.666 | 0.185 | |
| strength | AF4, FT9, C1, TP7, P7, Oz | Fz, C1, CP1–2, CP3, TP7, C4 | 0.355 | 0.852 | |
| BC | FC4, FT9–10, T7, TP7, PO8, Oz | Fz, FC4, FT10, C2, T7–8, TP7 | 0.040 | 4.177 | |
| strength | FT10, CP1, TP8, CP4, P4, PO7 | FC6, C4, C5–6, TP8, CP1, CP4, P8 | 0.788 | 0.072 | |
| BC | F7–8, FT9–10, C5, TP8, PO4, PO7 | F7, C2, C5, T7–8, TP7 | 0.021 | 5.302 | |
| strength | F3, C2, C3, C5, CP2 | FT9, C2, Cz, C3 | 68.752 | ||
| BC | FT9–10, C5, CP2, P8, PO4 | AF3, FT9–10, C2 | 14.242 |
Statistically different local measures between groups for low-tone discrimination are indicated in bold.
The distribution of hubs with the greatest strength in the
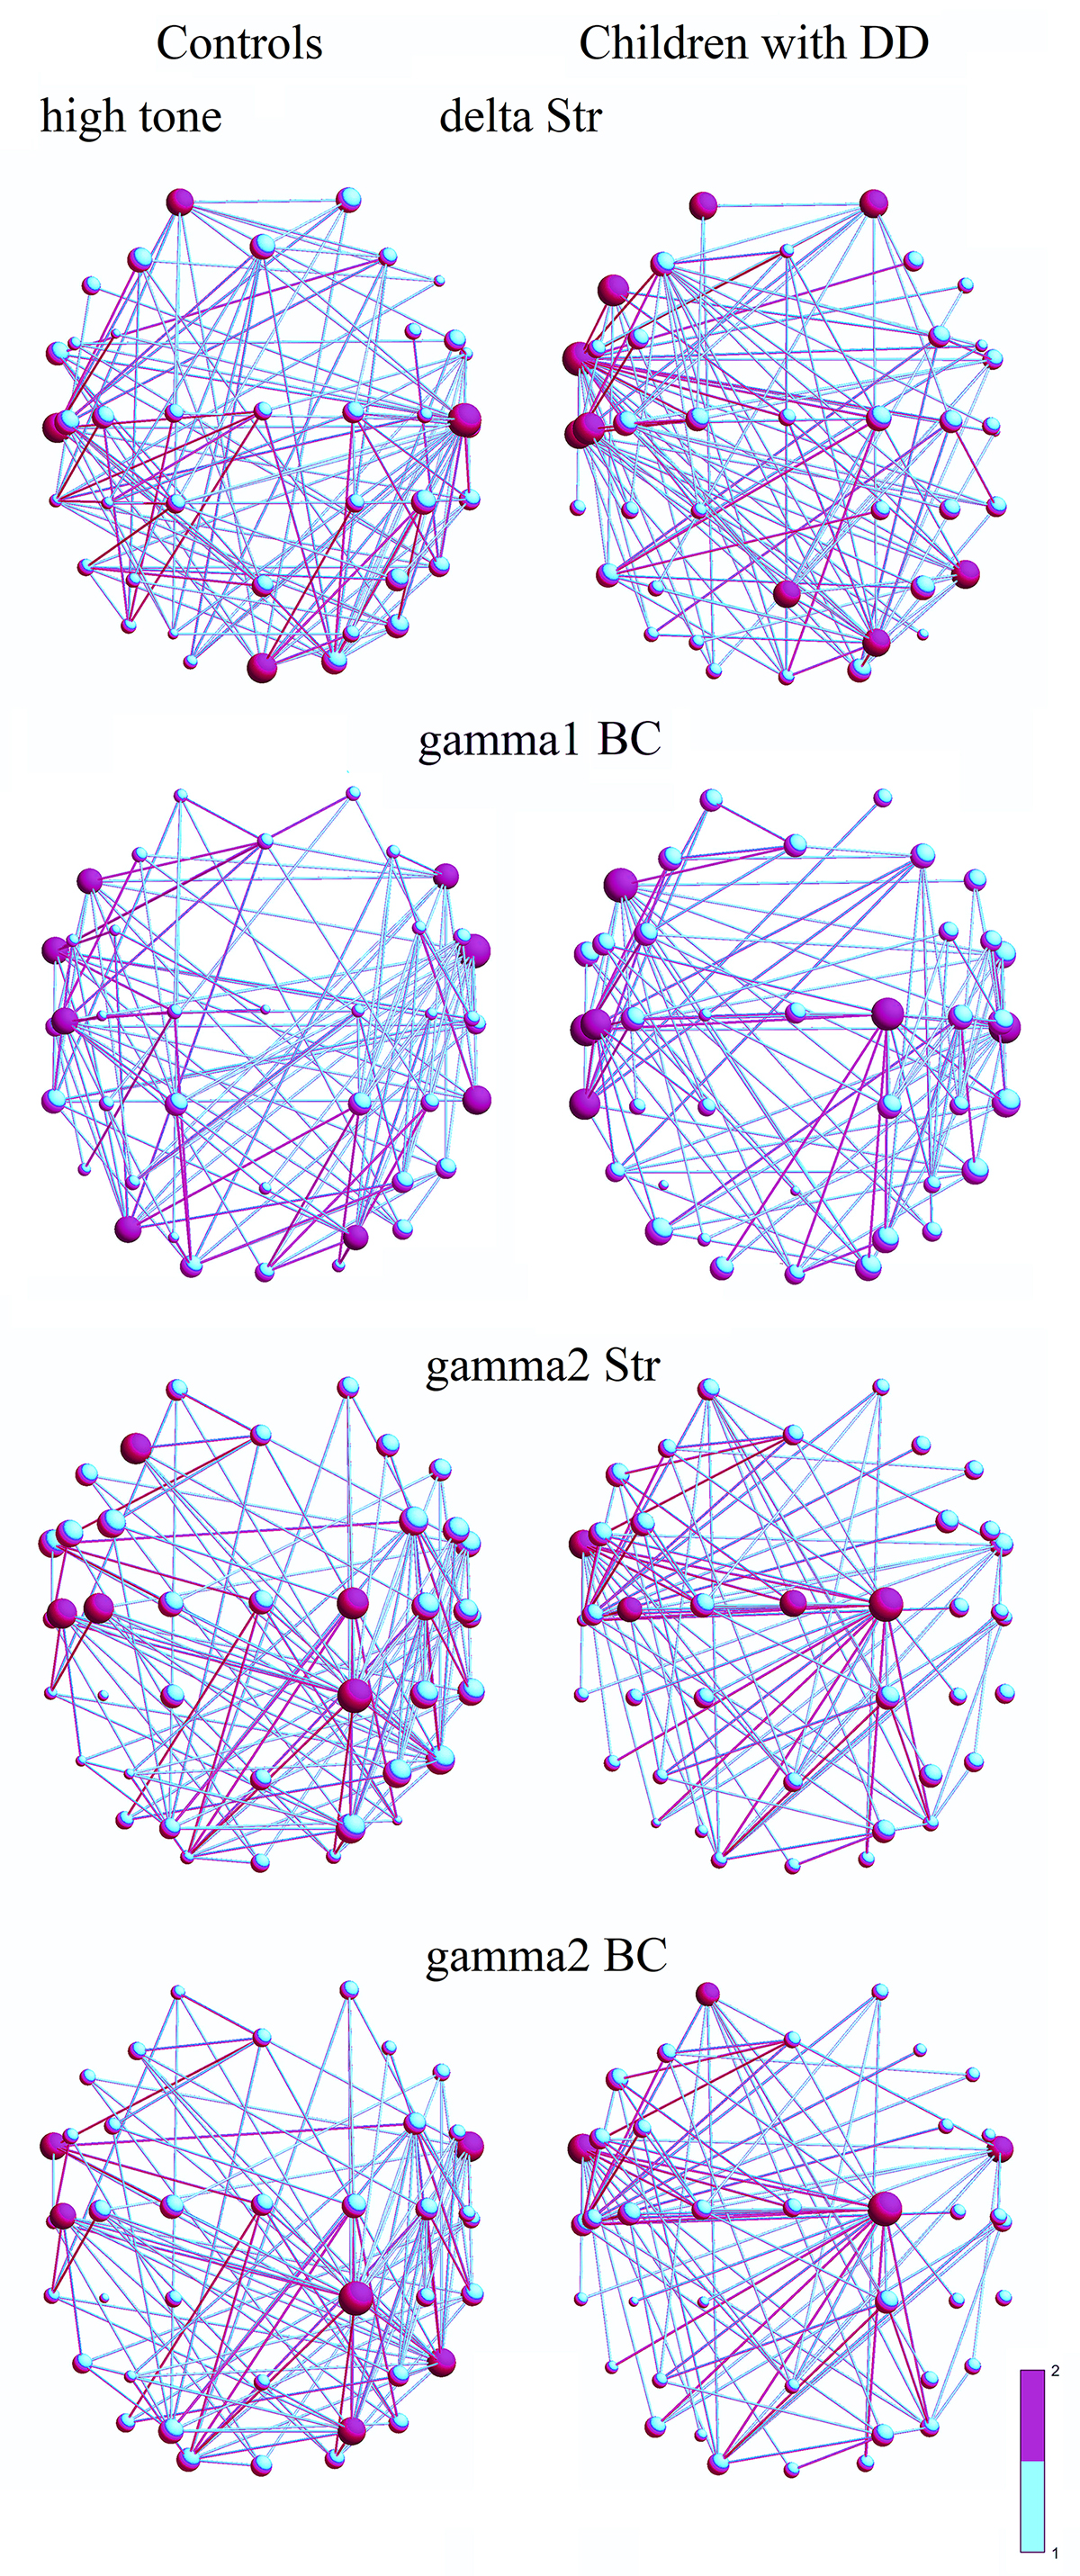 Fig. 4.
Frequency networks in controls (1st column) and children with DD
(2nd column) for a high tone: (1)
Str of hubs in the
In the
In the
The multifaceted relationship between DD and auditory processing offers a deeper understanding of this learning disorder. A central debate revolves around whether auditory deficits in dyslexia are specific to speech or reflect more general auditory processing challenges. Dyslexia is linked to alterations in auditory cortex anatomy and function. Specifically, children with DD exhibit alterations in auditory sampling within the delta/theta [99, 100] and low-frequency gamma bands [101, 102] in auditory cortical areas [103] during early stages of processing.
The small-world propensity (
The study revealed that tone differences were reflected in functional networks by variations in the strength and BC of major hubs across frontal, parietal, and primary sensory cortices, alongside the diverse contributions of individual nodes.
In the low-tone
In the control group’s low-tone
These findings suggest the middle frontal cortex, particularly the pre-SMA,
plays a tone-structure-modulated role in DD children’s
In the high-tone
In the high-tone
Additional hubs observed in controls for high tone included primary
somatosensory, auditory, and supramarginal cortex (right in
A potential neurophysiological mechanism for dyslexia’s deficits may involve impaired functional communication between sensory regions and the prefrontal cortex, alongside excessive communication between homologous auditory areas. The strength of interhemispheric functional connections within relevant sensory networks could underpin specific neurophysiological mechanisms leading to perception-cognitive biases or frequency discrimination difficulties.
The study reveals distinct local and global functional network properties in children with DD during auditory processing. It highlights differences in integration, segregation, hub organization, and connectivity, particularly involving the parietal and prefrontal cortices. It is important to interpret scalp-level EEG network results with caution, even though the estimations of functional connectivity are highly reliable [120]. These findings suggest neurophysiological differences that may underlie the auditory processing difficulties associated with DD.
The data are not publicly available due to privacy and confidentiality concerns but are available from the corresponding author on reasonable request.
TT and JD designed and performed the research. TT was responsible for data analysis. Both authors wrote the initial draft. Both authors contributed to editorial changes in the manuscript. Both authors read and approved the final manuscript. Both authors have participated sufficiently in the work and agreed to be accountable for all aspects of the work.
This study was conducted in accordance with the Declaration of Helsinki and approved by the Ethics Committee of the Institute of Neurobiology, Bulgarian Academy of Sciences (BAS, approval No. 02-41/12-07-2019), on 12 July 2019. Ethical approval, ensured through informed consent from the children and their parents, was a prerequisite for the children’s participation in the EEG study.
The authors thank the psychologists and logopedists for administering and scoring the psychological tests.
This research was supported by the Bulgarian Ministry of Education and Science under the National Program ‘Young Scientists and Postdoctoral Students-2’. Funding for the author’s salary was also provided through this program.
The authors declare no conflict of interest. Given the role as the Editorial Board member, Dr. Juliana Dushanova had no involvement in the peer-review of this article and has no access to information regarding its peer review. Full responsibility for the editorial process for this article was delegated to Bettina Platt.
Supplementary material associated with this article can be found, in the online version, at https://doi.org/10.31083/JIN42398.
References
Publisher’s Note: IMR Press stays neutral with regard to jurisdictional claims in published maps and institutional affiliations.