


 , Xiaochen Xue 1,*
1 Department of Pediatrics, China-Japan Union Hospital of Jilin University, 130033 Changchun, Jilin, China
†These authors contributed equally.
Abstract
Neurodevelopmental disorders [NDDs, including attention deficit hyperactivity disorder (ADHD), autism spectrum disorder (ASD), and tic disorder] usually arise during childhood or adolescence, but impact quality of life throughout the whole life cycle. Therefore, early diagnosis of NDDs is necessary; however, its etiology remains unclear. This study aimed to evaluate levels of thyroid, growth, and appetite hormones between children and adolescents with NDDs and healthy controls (HCs) by a meta-analysis of all evidence that demonstrated the importance of these indicators, but yielded controversial results.
Five online databases were searched to retrieve relevant articles published before March 1, 2025. Mean and standard deviation data were collected and pooled using Stata 15.0 software to generate standardized mean difference (SMD) with 95% confidence intervals (CIs) as the effect size (ES) measure.
Fifty-four studies were included. The overall meta-analysis, subgroup, and trim-and-fill adjusting revealed that compared with HCs, levels of thyroid hormone free triiodothyronine (FT3) (SMD = 0.22; 95% CI = 0.04 to 0.40; pES = 0.015), total triiodothyronine (TT3) (SMD = 0.82; 95% CI = 0.36 to 1.28; pES < 0.001), and thyroid peroxidase antibody (TPO-Ab) (SMD = 0.37; 95% CI = 0.08 to 0.67; pES = 0.014) were significantly increased, while free thyroxine (FT4) (SMD = –0.67; 95% CI = –0.69 to –0.64; pES < 0.001), total thyroxine (TT4) (SMD = –0.35; 95% CI = –0.50 to –0.20; pES < 0.001), and thyroid stimulating hormone (TSH) (SMD = –0.22; 95% CI = –0.41 to –0.03; pES = 0.026) were significantly decreased in children and adolescents with NDDs. These changes were mainly observed in ADHD patients, with TPO-Ab increased only in ASD patients. Levels of the appetite hormone leptin were significantly elevated in male NDDs (SMD = 0.74; 95% CI = 0.10 to 1.38; pES = 0.023) and ASD patients (SMD = 0.46; 95% CI = 0.17 to 0.74; pES = 0.002) relative to HCs, but not in ADHD cases. Growth factor IGF-1 (insulin-like growth factor-1) was only significantly lower in the cerebrospinal fluids of ASD patients when compared with HCs (SMD = –0.89; 95% CI = –1.42 to –0.36; pES = 0.001).
Thyroid hormones and IGF-1/leptin may respectively represent promising biomarkers for predicting ADHD and ASD in children and adolescents.
Keywords
- neurodevelopmental disorders
- thyroid hormones
- insulin-like growth factor I
- appetite regulation
- inflammation
- meta-analysis
Neurodevelopmental disorders (NDDs) represent a group of complex and heterogeneous conditions that manifest as impairments in cognition, communication, behavior and motor skills due to abnormal neural development [1]. Common NDDs usually have their initial-onset during childhood and adolescence, with an estimated global prevalence rate of 2–5.7% for attention deficit hyperactivity disorder (ADHD), 0.4–4.4% for autism spectrum disorder (ASD) and 0.3–0.8% for tic disorder (TD) [2, 3]. Children and adolescents with these disorders are at increased risk for poor long-term outcomes, including lower levels of educational attainment, employment status and high rates of substance abuse, delinquency and psychiatric comorbidity (e.g., anxiety and depression), which not only significantly affect their quality of life, but also impose a tremendous stress on families and society [4, 5]. This highlights the urgent need for early diagnosis and interventions, in children and adolescents with NDDs, to prevent serious consequences.
Although the etiology of NDDs is considered to be multifactorial, existing evidence suggests thyroid dysfunction as a probable trigger [6]. There have been meta-analyses that demonstrate a significant association exists between maternal thyroid dysfunction and NDDs in children [6, 7]. Pooling of 29 articles by Ge et al. [6] showed the risk of ADHD in offspring was increased in mothers with thyroid hormones outside the normal range during pregnancy, including hyperthyroidism [odds ratio (OR) = 1.18; 95% confidence interval (CI) = 1.04 to 1.34] or hypothyroidism (OR = 1.14; 95% CI = 1.03 to 1.26). Maternal hypothyroidism (OR = 1.41; 95% CI = 1.05 to 1.90) [6] or autoimmune thyroid diseases (OR = 1.28; 95% CI = 1.14 to 1.44) [7] was also found to elevate the prevalence ratio of ASD in children through integration of 29 [6] or 6 [7] studies, respectively. Additionally, mice overexpressing thyroid hormone-responsive protein or lacking thyroid hormone receptors (THRB or THRA) typically manifested with ADHD [8, 9, 10]. An animal model of hypothyroidism by treatment with propylthiouracil exhibited developmental cerebellar defects and autism-like behaviors [11, 12]. All these observations imply thyroid function status-related parameters in children and adolescents [such as free triiodothyronine (FT3), free thyroxine (FT4), total triiodothyronine (TT3), total thyroxine (TT4), thyroid stimulating hormone (TSH), thyroid peroxidase antibody (TPO-Ab) or thyroglobulin antibody (TG-Ab)] may represent potential biomarkers for predicting the development of NDDs. This hypothesis has been supported by some studies: Meng et al. [13] found FT3 was significantly increased, while FT4 was significantly decreased in children with ADHD, ASD and TD compared to healthy controls (HCs). Furthermore, both TT3 and TT4 were significantly lower in children with ADHD/TD than those in HCs, while TG-Ab was significantly reduced in children with TD/ASD relative to HCs. A receiver operating characteristic (ROC) curve analysis demonstrated FT4 was of high clinical value in the diagnosis of children with NDDs, with an area under the curve (AUC) of 0.76 [13]. Singh et al. [14] found the TSH level was 30% lower in male children with ASD than that in typically developing boys. The diagnostic accuracy and AUC for ASD based upon TSH levels was 76% and 0.674, respectively [14]. However, controversial results were also reported, including significantly higher levels of TSH and lower levels of FT4 in children with ASD [15, 16] and no statistical differences in TSH and TT4 between ADHD/ASD cases and HCs [17, 18]. Therefore, the relationship between thyroid hormones and NDDs in children and adolescents still requires further evaluation.
It furthermore has been reported that overweight and obesity are more prevalent among children and adolescents with NDDs [19]. Patients with hypothyroidism are often obese [20], which on one hand may be a consequence of lowered energy expenditure due to a decrease in the basal metabolic rate [21] or on the other hand associated with uncontrolled food intake due to disruptions in growth [insulin, insulin-like growth factor-1 (IGF-1) or IGF-binding protein 3 (IGFBP-3)] [22] and appetite (leptin, ghrelin or adiponectin) [23] hormone signaling pathways, ultimately facilitating weight gain. Thus, growth and appetite hormone-related parameters may serve as underlying diagnostic biomarkers for NDDs. Unfortunately, there were also conflicting findings in these indicators among different studies, including reduced [17, 24, 25], increased [26, 27] and non-significance [28, 29] of the various possible.
To further elucidate the link between the development of NDDs and levels of thyroid, growth and appetite hormones in children and adolescents, a meta-analysis that integrated all relevant evidence was conducted here. The sample size and statistical power can be increased through pooling of data from multiple individual studies, which may thus provide more convincing conclusions.
This analysis was conducted in accordance with the Preferred Reporting Items for Systematic Reviews and Meta-Analyses (PRISMA) 2020 guidelines (Supplementary material_PRISMA_2020_checklist) [30]. Electronic databases of PubMed, EMBASE, Cochrane Library, the China National Knowledge Infrastructure (CNKI, Chinese) and Wanfang (Chinese) were searched for relevant studies published before March 1, 2025. The search keywords included: (“thyroid function” OR “thyroid hormones” OR “thyroid-stimulating hormone” OR “free triiodothyronine” OR “free thyroxine” OR “TSH” OR “FT3” OR “FT4” OR “iodine” OR “thyroid peroxidase antibody” OR “Anti-TPO” OR “TPO-Ab” OR “thyroglobulin antibody” OR “TG-Ab” OR “hypothyroidism” OR “hyperthyroidism” OR “insulin” OR “insulin-like growth factor” OR “IGF-1” OR “IGFBP-3” OR “leptin” OR “ghrelin” OR “adiponectin”) AND (“children” OR “child” OR “childhood” OR “adolescents” OR “pediatric”) AND (“attention deficit hyperactivity disorder” OR “autism” OR “Tourette syndrome” OR “tic disorder” OR “neurobehavioral disorders”). The language or publication status was not restricted and the reference lists of included studies and reviews were reviewed to retrieve additional literature.
Studies were included if they met the following criteria: (1) Detected levels of
thyroid (FT3, FT4, TT3, TT4, TSH, TPO-Ab or TG-Ab), growth (IGF-1 or IGFBP-3) and
appetite (leptin, ghrelin or adiponectin) hormones in children (
Exclusion criteria included: (1) Duplicates; (2) Non-original articles (e.g., case reports, reviews, meta-analysis or conference abstract); (3) Articles or data not peer-reviewed (online preprints or results of clinical trial registries); (4) Cell, animal, neonatal or adult studies; (5) Lack of HCs; (6) Cases with ongoing pharmacotherapy; (7) Tissue samples analyzed; (8) Full-text or data unavailability; and (9) Other irrelevant topics.
A standardized Microsoft Excel (version 2019; Microsoft Corporation, Redmond,
WA, USA) spreadsheet was used to extract data from each study, which included the
first author, publication year, country, study design, disease type, diagnosis
criteria, number of cases and HCs, their sex, age, sample source and test levels
for each indicator. The data in tables and texts were directly retrieved, while
those in figures were estimated by using the GetData Graph digitizer software
(version 2.26; getdata-graph-digitizer, Moscow, Russia;
https://getdata-graph-digitizer.software.informer.com/). The quality of included
studies was assessed using the Newcastle-Ottawa Scale (NOS) [31], with the scores
ranging from 0 to 9 and studies of higher methodological quality were defined as
NOS scores
Stata software (v15.0; Stata Corporation, College Station, TX, USA) was used to
perform the meta-analysis. All continuous outcomes were expressed as the
standardized mean difference (SMD) with 95% CI to represent the pooled effect
size (ES). A pES-value
The initial search of electronic databases yielded 8288 records. A total of 7415 studies were duplicate papers and removed. The remaining 873 non-duplicate studies were screened based on title and abstract. Of them, 786 did not meet the inclusion criteria because they were reviews/meta-analyses (n = 65), case reports (n = 55), animal model studies (n = 77), lack of HCs (n = 34) and irrelevant topic (n = 555). The full-text of 87 studies was downloaded and read, after which 33 were excluded because of data unavailability (n = 5), undergoing pharmacotherapy in all or a part of cases (n = 7), lack of HCs (n = 8), neonatal (n = 9), adult studies (n = 3) or tissue sample studies (n = 1). Finally, 54 eligible studies (Supplementary File 1) were selected for this meta-analysis (Fig. 1).
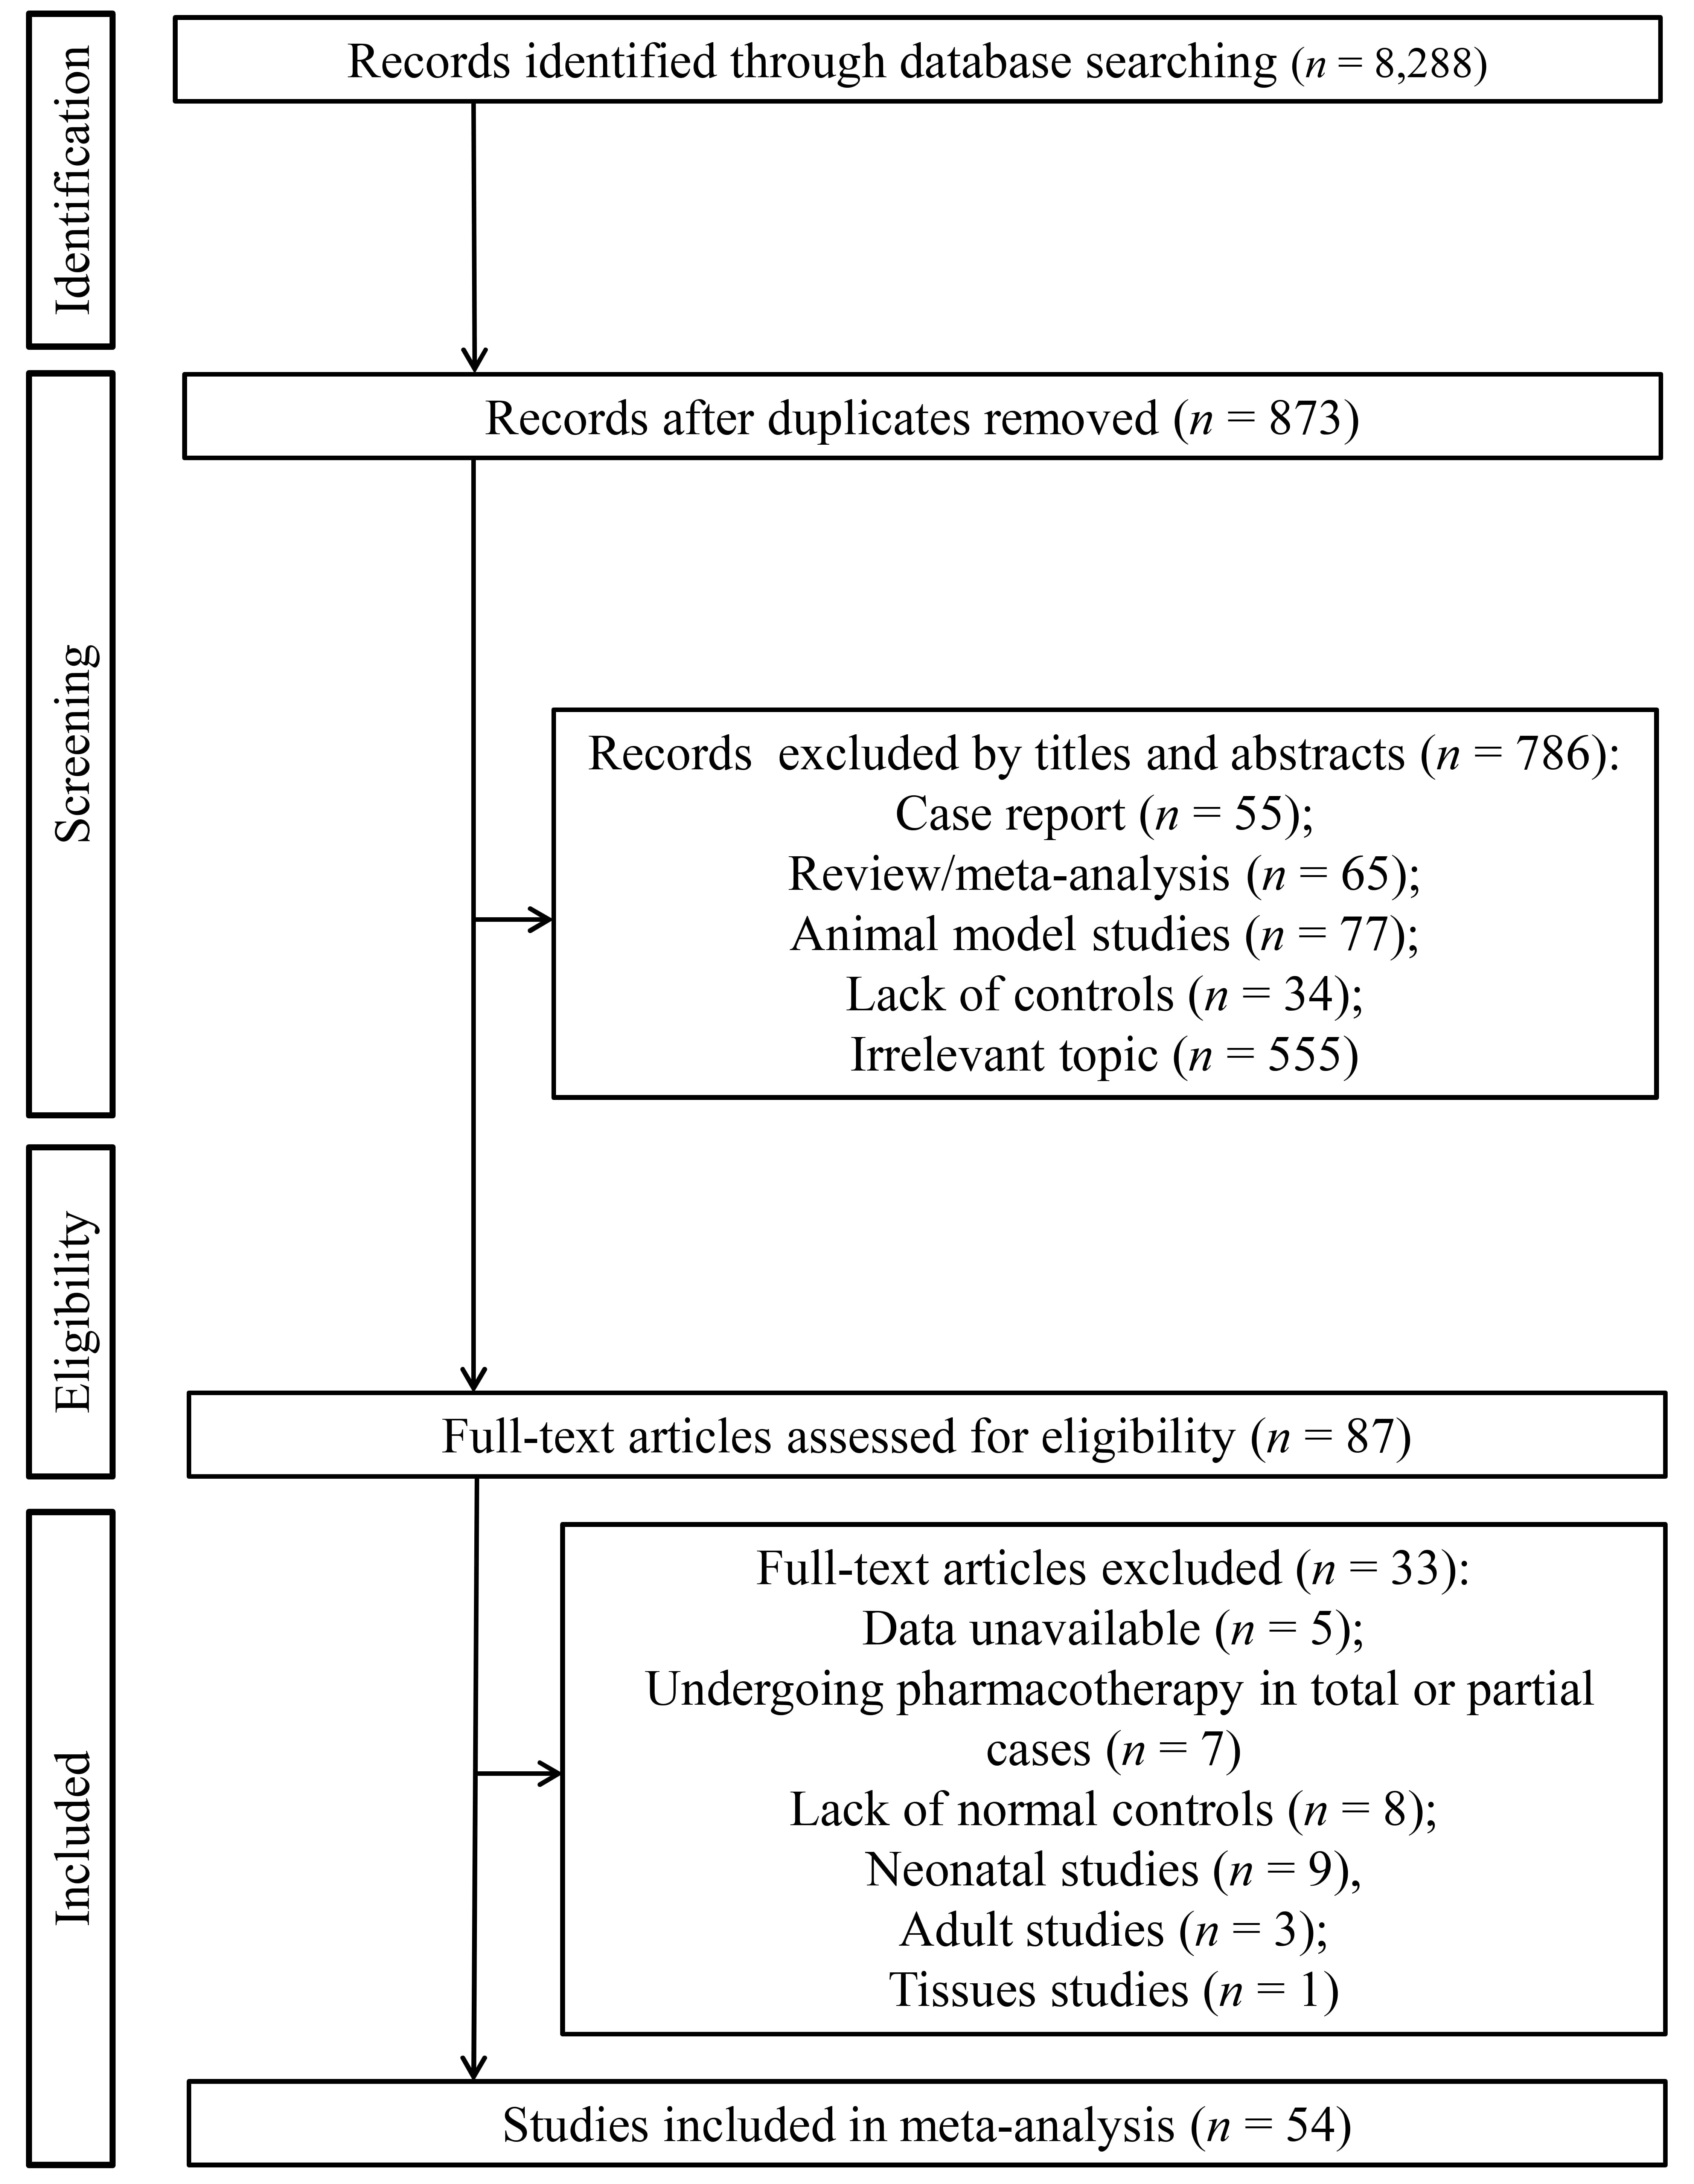 Fig. 1.
Flow chart showing the process of study selection.
The detailed characteristics of included studies are summarized in Table 1
and Supplementary Table 1. These studies were published from 1994 to
2025. Patients and HCs were enrolled from 16 countries, including China
(n = 13), Turkey (n = 12), USA (n = 8), Poland
(n = 5), Japan (n = 3), Germany (n = 2), Finland
(n = 2), Greece (n = 1), Italy (n = 1), Iran
(n = 1), India (n = 1), Egypt (n = 1), Korea
(n = 1), Saudi Arabia (n = 1), Serbia (n = 1) and
Canada (n = 1). Most studies (n = 46) were performed in a
single center and only eight studies used multi-centered designs. Biomarkers were
analyzed for ADHD in 22 studies, for ASD in 29 studies, for both ADHD and ASD in
two studies, for ADHD, ASD and TD in one study. NDDs were diagnosed mainly
according to the diagnostic and statistical manual of mental disorders (DSM)
(third, fourth or fifth version), with some studies involving supplementary
criteria, such as autism diagnostic interview-revised (ADI-R), autism diagnostic
observation schedule (ADOS), childhood autism rating scale (CARS), kiddie
schedule for affective disorders and schizophrenia of school-age children-present
and lifetime version (K-SADS-PL), diagnostic interview and disruptive behavior
disorder rating scale (DBDRS), international statistical classification of
diseases and related health problems 10th revision (ICD-10) or Chinese
classification of mental disorders (CCMD). Blood samples (serum or plasma) were
collected for all thyroid function status- and appetite-related indicators, while
urine, blood and CSF were for IGF-1 and IGFBP-3. Most studies did not address the
weight difference, except two that divided the cases and HCs into overweight and
normal weight. Some studies provided the results of all cases and cases with
specific sex (female or male) or age (
| First author@ | Year | Country | Design | Disease | Diagnosis criteria | Case | Control | Outcomes | NOS | ||||
| No. | Age | Gender | No. | Age | Gender | ||||||||
| (M/F) | (M/F) | ||||||||||||
| Lukovac T | 2024 | Serbia | Single-center | ADHD | DSM-IV | 67 | 10.13 |
67/0 | 66 | 9.94 |
66/0 | FT4, TSH* | 9 |
| Langrock C | 2018 | Germany | Multicenter | ADHD (OW) | ICD; DSM | 26 | 8.7 |
17/9 | 66 | 10.0 |
28/38 | FT3, FT4, TSH, leptin* | 8 |
| 2018 | Germany | Multicenter | ADHD (NW) | ICD; DSM | 56 | 9.0 |
44/12 | 82 | 9.1 |
51/31 | FT3, FT4, TSH, leptin* | ||
| Kuppili PP | 2017 | India | Single-center | ADHD | DSM-IV-TR | 30 | 9.47 |
28/2 | 30 | 10.30 |
28/2 | TT3, TT4, TSH* | 9 |
| Albrecht D | 2020 | Germany | Multicenter | ADHD | ICD-10 | 420 | 10.6 (8.8–12.5) | 336/84 | 8265 | 8.8 (6.1–11.5) | 4465/3800 | FT3, FT4, TSH* | 8 |
| 2020 | Germany | Multicenter | ADHD | ICD-10 | 152 | 15.6 (14.4–16.7) | 120/32 | 2751 | 15.6 (14.4–16.7) | 1272/1479 | FT3, FT4, TSH* | ||
| Wang LJ | 2023 | China | Single-center | ADHD | DSM-V | 144 | 8.9 |
110/34 | 70 | 9.2 |
46/24 | TT3, FT4, TT4, TSH, IGF-1, IGFBP3* | 9 |
| Öz E | 2023 | Turkey | Single-center | ADHD | DSM-V | 22 | 8.3 (7.0–9.3) | 14/8 | 21 | 5.0 (3.4–13.6) | 11/10 | FT4, TSH* | 9 |
| Stein MA | 2003 | USA | Single-center | ADHD-CT | DSM-IV | 195 | 8.9 |
- | 84 | 8.7 |
- | TSH* | 8 |
| 2003 | USA | Single-center | ADHD-IT | DSM-IV | 54 | 10.6 |
- | 84 | 8.7 |
- | TSH* | ||
| Kim WJ | 2020 | Korea | Multicenter | ADHD | DSM-IV | 41 | 8.81 |
41/0 | 79 | 9.2 |
79/0 | FT4, TSH, IGF-1* | 9 |
| 2020 | Korea | Multicenter | ADHD | DSM-IV | 23 | 9.22 |
0/23 | 33 | 9.36 |
0/33 | FT4, TSH, IGF-1* | ||
| Singh S | 2017 | USA | Single-center | ASD | DSM-IV | 43 | 2–8 | 43/0 | 37 | 2–8 | 37/0 | TSH* | 9 |
| Desoky T | 2017 | Egypt | Single-center | ASD | CARS | 60 | 7.03 |
55/5 | 40 | 7.91 |
20/20 | FT3, FT4, TSH* | 8 |
| Błażewicz A | 2021 | Poland | Single-center | ASD | DSM-V; ADI-R; CARS | 53 | 14.09 |
41/12 | 77 | 14.71 |
46/31 | FT3, FT4, TSH* | 9 |
| Frye RE | 2017 | USA | Single-center | ASD | ADI-R; DSM | 87 | 6.8 |
70/17 | 12 | 8.2 |
- | FT4, TSH* | 7 |
| Błażewicz A | 2022 | Poland | Single-center | ASD | ADOS-2; ADI-R; ICD-10; DSM-V | 129 | 14.1 |
108/21 | 86 | 14.7 |
54/32 | FT3, FT4, TSH* | 7 |
| Błażewicz A | 2016 | Poland | Single-center | ASD | DSM-IV | 40 | 7.2 (2–17) | 40/0 | 40 | 9.9 (2–17) | 40/0 | FT3, FT4, TSH* | 8 |
| Elia J | 1994 | USA | Single-center | ADHD | DSM-III | 53 | 9.16 |
53/0 | 42 | - | 42/0 | TSH, TT3, TT4* | 8 |
| Bala KA | 2016 | Turkey | Single-center | ASD | DSM-V; DSM-IV; CARS | 16 | 7.88 |
10/6 | 27 | 9.80 |
13/14 | TSH, T4, TPO-Ab* | 9 |
| 2016 | Turkey | Single-center | ADHD | DSM-V; DSM-IV; DBDRS | 34 | 7.68 |
23/11 | 27 | 9.80 |
13/14 | TSH, FT4, TPO-Ab* | ||
| Han L | 2024 | China | Single-center | ADHD (total, CT, IT, HIT) | CCMD-IV | 81 | 8.04 |
46/35 | 79 | 7.74 |
45/34 | FT3* | 9 |
| Chen JJ | 2019 | China | Single-center | ADHD | CCMD-III | 48 | 9.38 |
32/16 | 60 | 9.53 |
34/26 | FT3, FT4, TSH* | 9 |
| Jiang L | 2021 | China | Single-center | ADHD (total, CT, IT, HIT) | DSM-V | 35 | 9.5 |
29/6 | 18 | 9.3 |
15/3 | FT3, FT4, TT3, TT4, TSH* | 9 |
| Fan LP | 2007 | China | Single-center | ADHD (total, CT, IT, HIT) | DSM-IV | 32 | 9–15 | 28/4 | 15 | 6.5–14.5 | 13/2 | FT3, FT4, TT3, TT4, TSH* | 9 |
| Meng HJ | 2024 | China | Single-center | ADHD, ASD, TD | - | 7035 | 6.53 |
5680/1355 | 4801 | 6.34 |
2771/2030 | FT3, FT4, TT3, TT4, TSH, TPO-Ab* | 8 |
| Błażewicz A | 2020 | Poland | Single-center | ASD (OW); | ADI-R; DSM-V; CARS | 102 (OW); | 7.98 |
- | 53 (OW); | 8.06 |
- | FT3, FT4, TSH* | 9 |
| ASD (NW) | 50 (NW) | 7.96 |
82 (NW) | 8.6 |
|||||||||
| 2020 | Poland | Single-center | ASD (OW); | ADI-R; DSM-V; CARS | 76 (OW); | 14.07 |
- | 47 (OW); | 14.09 |
- | FT3, FT4, TSH* | ||
| ASD (NW) | 53 (NW) | 14.08 |
82 (NW) | 14.6 |
|||||||||
| Iwata K | 2011 | Japan | Single-center | ASD | DSM-IV-TR; ADI-R | 32 | 12.3 |
- | 34 | 12.4 |
- | TSH* | 9 |
| Lai KY | 2024 | China | Single-center | ADHD | DSM-V | 77 | 8.2 |
54/23 | 87 | 9.3 |
49/38 | Leptin, ghrelin, adiponectin* | 7 |
| Gurbuz F | 2016 | Turkey | Single-center | ADHD | DSM-IV | 48 | 7–14 | 48/0 | 41 | 7–14 | 41/0 | Leptin, IGF-1, IGFBP-3, ghrelin* | 9 |
| Baykal S | 2019 | Turkey | Single-center | ADHD | DSM-V | 56 | 8.66 |
39/17 | 40 | 7.93 |
28/12 | Ghrelin* | 9 |
| Hao YY | 2020 | China | Single-center | ADHD | DSM-IV | 100 | 9.43 |
56/44 | 100 | 9.56 |
52/12 | Ghrelin* | 9 |
| Petropoulos A | 2024 | Greece | Single-center | ADHD | DSM-IV | 40 | 7.55 |
23/17 | 40 | 8.07 |
20/20 | Leptin* | 8 |
| 2024 | Greece | Single-center | ASD | DSM-IV | 42 | 8.56 |
38/4 | 40 | 8.07 |
20/20 | Leptin* | ||
| Özcan Ö | 2018 | Turkey | Single-center | ADHD | DSM-IV; K-SADS-PL | 36 | 9.30 |
29/7 | 40 | 8.87 |
29/11 | Leptin, adiponectin* | 9 |
| Sahin S | 2014 | Turkey | Single-center | ADHD | DSM-IV; K-SADS-PL-TR | 30 | 9.54 |
24/6 | 20 | 9.65 |
18/2 | Leptin, ghrelin, adiponectin* | 9 |
| Zhang CJ | 2024 | China | Single-center | ASD | DSM-V; ADOS | 56 | 3.0 (2.3–4.1) | 51/5 | 30 | 2.8 (2.3–3.3) | 25/5 | IGF-1* | 9 |
| Robinson-Agramonte MLA | 2022 | Canada | Multicenter | ASD | DSM-V | 22 | 9.45 |
17/5 | 29 | 8.68 |
21/8 | IGF-1* | 9 |
| Anlar B | 2007 | Turkey | Single-center | ASD | DSM-IV | 34 | 3.1 |
26/8 | 29 | 3.3 |
25/4 | IGF-1, IGFBP-3# | 9 |
| Şimşek F | 2021 | Turkey | Single-center | ASD | DSM-V | 40 | 6.98 |
37/3 | 40 | 7.79 |
37/3 | IGF-1* | 9 |
| Li Z | 2022 | China | Single-center | ASD | DSM-V | 150 | 4 |
113/37 | 165 | 4.17 |
124/41 | IGF-1, IGFBP-3* | 9 |
| Mills JL | 2007 | USA | Single-center | ASD | DSM-IV; ADOS | 71 | 6.6 |
71/0 | 59 | 6.5 |
59/0 | IGF-1, IGFBP-3* | 9 |
| Vanhala R | 2001 | Finland | Multicenter | ASD | DSM-III | 11 | 3.8 |
7/4 | 11 | 3.8 |
5/6 | IGF-1& | 8 |
| Riikonen R | 2006 | Finland | Multicenter | ASD | DSM-III | 25 | 5.42 (1.92–15.83) | 20/5 | 16 | 7.33 (1.08–15.17) | 8/8 | IGF-1& | 7 |
| Blardi P | 2010 | Italy | Single-center | ASD | DSM-IV; CARS | 35 | 14.1 |
21/14 | 35 | - | - | Leptin, adiponectin* | 8 |
| ADOS | |||||||||||||
| Chen L | 2024 | China | Single-center | ASD | DSM-V | 42 | 3.68 |
20/22 | 42 | 4.02 |
21/21 | Leptin* | 9 |
| Ashwood P | 2008 | USA | Multicenter | ASD | ADOS; ADI-R | 70 | 4.25 (2.4–15.5) | 32/5 | 50 | 4.33 (2.2–14.7) | 38/12 | Leptin* | 9 |
| Maekawa M | 2020 | Japan | Single-center | ASD | DSM-IV | 21 | 5.7 |
18/3 | 26 | 6.05 |
14/12 | Leptin, adiponectin* | 8 |
| 2020 | Japan | Single-center | ASD | DSM-IV | 101 | 10.1 |
92/9 | 66 | 10.47 |
55/11 | Leptin, adiponectin* | ||
| Al-Zaid FS | 2014 | Saudi Arabia | Single-center | ASD | DSM-IV; CARS | 31 | 5.60 |
31/0 | 28 | 5.44 |
28/0 | Leptin* | 9 |
| ADOS | |||||||||||||
| Wang BJ | 2025 | China | Single-center | ASD | DSM-V | 36 | 6.4 |
24/12 | 18 | 6.8 |
12/6 | Leptin, adiponectin* | 9 |
| Skórzyńska-Dziduszko KE | 2023 | Poland | Single-center | ASD | DSM-V; CARS | 102 (OW) | 8.09 |
86/16 | 53 | 8.09 |
25/28 | Leptin* | 9 |
| ADI-R | |||||||||||||
| 2023 | Poland | Single-center | ASD | DSM-V; CARS | 50 (NW) | 8.09 |
41/9 | 82 | 8.09 |
53/29 | Leptin* | ||
| ADI-R | |||||||||||||
| 2023 | Poland | Single-center | ASD | DSM-V; CARS; ADI-R | 76 (OW) | 14.26 |
67/9 | 47 | 14.26 |
25/22 | Leptin* | ||
| 2023 | Poland | Single-center | ASD | DSM-V; CARS | 53 (NW) | 14.26 |
12/41 | 82 | 14.26 |
49/33 | Leptin* | ||
| ADI-R | |||||||||||||
| Çelikkol Sadıç Ç | 2021 | Turkey | Single-center | ASD | DSM-V | 44 | 2.86 |
38/6 | 44 | 3.03 |
35/9 | Leptin, ghrelin* | 9 |
| Nehir Yazici Ö | 2024 | Turkey | Single-center | ASD | DSM-V | 40 | 3.95 |
29/11 | 40 | 4.42 |
23/17 | Leptin, ghrelin* | 9 |
| Ertürk E | 2024 | Turkey | Single-center | ADHD | DSM-V | 40 | 9.87 |
24/16 | 40 | 9.94 |
24/16 | IGF-1* | 9 |
| Toren P | 1997 | USA | Multicenter | ADHD | DSM-III-R | 21 | 6–16 | 21/0 | 30 | 6–16 | 30/0 | IGF-1* | 9 |
| Abedini M | 2022 | Iran | Single-center | ASD | DSM-IV | 200 | 6.6 |
- | 198 | 6.8 |
- | IGF-1* | 8 |
| Işeri E | 2007 | Turkey | Single-center | ADHD | DSM-IV | 20 | 6–12 | 20/0 | 12 | 6–12 | 12/0 | Leptin* | 9 |
| Fujita-Shimizu A | 2010 | Japan | Single-center | ASD | DSM-IV-TR; ADI-R | 31 | 11.6 |
31/0 | 31 | 12.1 |
31/0 | Adiponectin* | 9 |
| Raghavan | 2019 | USA | Single-center | ASD | - | 36 | 1.59 (0.86–4.1) | - | 602 | 1.59 (0.86–4.1) | - | Adiponectin* | 8 |
| Quan L | 2021 | China | Single-center | ASD | DSM-V | 88 | 4.3 |
68/20 | 88 | 4.3 |
68/20 | Adiponectin* | 9 |
M, male; F, female; ADHD, attention deficit hyperactivity disorder; ASD, autism spectrum disorder; TD, tic disorder; OW, overweight; NW, normal weight; IT, inattentive type; HIT, hyperactive/impulsive type; CT, combined types; DSM, diagnostic and statistical manual of mental disorders; ADI-R, autism diagnostic interview-revised; ADOS, autism diagnostic observation schedule; CARS, childhood autism rating scale; K-SADS-PL, kiddie schedule for affective disorders and schizophrenia of school-age children-present and lifetime version; K-SADS-PL-TR, K-SADS-PL Turkish version; DBDRS, diagnostic interview and disruptive behavior disorder rating scale; ICD-10, international statistical classification of diseases and related health problems 10th revision; CCMD, Chinese classification of mental disorders; FT3, free triiodothyronine; FT4, free thyroxine; TSH, thyroid stimulating hormone; TT3, total triiodothyronine; TT4, total thyroxine; TPO-Ab, thyroid peroxidase antibody; IGF-1, insulin-like growth factor 1; IGFBP3, insulin-like growth factor binding protein 3; CSF, cerebrospinal fluid; *blood samples; #urinary samples; &CSF samples; @the references for these authors can be seen in Supplementary File 1; - indicated the information unknown.
Twelve studies with 19 experimental datasets provided the mean and SD of FT3
concentration in NDD cases and HCs (Supplementary Table 1). There was
significant heterogeneity between studies (I2 = 96.3%,
pH
| Variables | No. | SMD | 95% CI | pES | I2 | pH | Model | pPB | ||
| FT3 (pmol/L) | Overall | 19 | 0.22 | 0.04, 0.40 | 0.015 | 96.3 | R | 0.765 | ||
| Sex | Male | 3 | –0.05 | –0.85, 0.75 | 0.906 | 91.5 | R | |||
| Female | 2 | 0.19 | –0.24, 0.61 | 0.385 | 0.0 | 0.674 | F | |||
| Mix | 16 | 0.28 | 0.09, 0.48 | 0.004 | 96.7 | R | ||||
| Design | Multicenter | 4 | 0.14 | –0.51, 0.79 | 0.673 | 97.6 | R | |||
| Single-center | 15 | 0.24 | 0.05, 0.43 | 0.012 | 95.6 | R | ||||
| Age | Children | 11 | 0.004 | –0.21, 0.21 | 0.971 | 97.1 | R | |||
| Adolescents | 4 | 0.27 | –0.16, 0.69 | 0.223 | 88.7 | R | ||||
| Mix | 5 | 0.78 | –0.18, 1.73 | 0.110 | 94.8 | R | ||||
| Weight | OW | 3 | –0.18 | –0.39, 0.03 | 0.100 | 0.0 | F | |||
| NW | 3 | 0.22 | –0.15, 0.59 | 0.250 | 69.9 | 0.036 | R | |||
| Mix | 13 | 0.31 | 0.09, 0.53 | 0.006 | 97.4 | R | ||||
| FT4 (pmol/L) | Overall | 26 | –0.02 | –0.19, 0.15 | 0.808 | 95.9 | R | |||
| Sex | Male | 5 | –0.02 | –0.41, 0.37 | 0.907 | 81.0 | R | |||
| Female | 3 | 0.23 | –0.19, 0.64 | 0.283 | 33.8 | 0.221 | F | |||
| Mix | 20 | –0.02 | –0.21, 0.17 | 0.827 | 96.3 | R | ||||
| Design | Multicenter | 6 | –0.29 | –0.52, –0.06 | 0.013 | 79.4 | R | |||
| Single-center | 20 | 0.07 | –0.13, 0.26 | 0.501 | 96.1 | R | ||||
| Age | Children | 18 | –0.07 | –0.26, 0.12 | 0.463 | 96.2 | R | |||
| Adolescents | 4 | 0.01 | –0.48, 0.50 | 0.957 | 91.4 | R | ||||
| Mix | 5 | 0.16 | –0.25, 0.58 | 0.442 | 75.5 | 0.003 | R | |||
| Weight | OW | 3 | –0.18 | –0.93, 0.58 | 0.646 | 91.7 | R | |||
| NW | 3 | 0.28 | –0.11, 0.68 | 0.162 | 73.7 | 0.022 | R | |||
| Mix | 20 | –0.06 | –0.24, 0.13 | 0.553 | 96.0 | R | ||||
| TT3 (ng/mL) | Overall | 8 | –0.07 | –0.59, 0.45 | 0.804 | 99.4 | R | 0.188 | ||
| Sex | Male | 1 | –0.04 | –0.45, 0.37 | 0.854 | - | - | R | ||
| Mix | 7 | –0.07 | –0.62, 0.48 | 0.804 | 99.5 | R | ||||
| Age | Children | 5 | –0.54 | –1.16, 0.07 | 0.084 | 99.6 | R | |||
| Mix | 3 | 0.82 | 0.36, 1.28 | 45.4 | 0.160 | F | ||||
| TT4 (ng/mL) | Overall | 8 | –0.35 | –0.50, –0.20 | 91.0 | R | 0.170 | |||
| Sex | Male | 1 | –0.07 | –0.47, 0.34 | 0.752 | - | - | R | ||
| Mix | 7 | –0.38 | –0.54, –0.22 | 91.7 | R | |||||
| Age | Children | 5 | –0.37 | –0.53, –0.21 | 94.2 | R | ||||
| Mix | 3 | –0.26 | –0.86, 0.33 | 0.386 | 69.4 | 0.038 | R | |||
| TSH (µIU/mL) | Overall | 32 | –0.08 | –0.23, 0.08 | 0.326 | 95.0 | R | 0.435 | ||
| Sex | Male | 6 | –0.46 | –1.24, 0.31 | 0.241 | 95.8 | R | |||
| Female | 3 | –0.16 | –0.50, 0.19 | 0.369 | 4.5 | 0.351 | F | |||
| Mix | 24 | –0.02 | –0.18, 0.14 | 0.831 | 95.0 | R | ||||
| Design | Multicenter | 6 | –0.19 | –0.63, 0.24 | 0.387 | 94.9 | R | |||
| Single-center | 26 | –0.04 | –0.20, 0.12 | 0.619 | 94.2 | R | ||||
| Age | Children | 20 | –0.22 | –0.41, –0.03 | 0.026 | 96.4 | R | |||
| Adolescents | 4 | 0.21 | –0.19, 0.61 | 0.304 | 86.9 | R | ||||
| Mix | 9 | 0.20 | –0.12, 0.52 | 0.215 | 81.2 | R | ||||
| Weight | OW | 3 | 0.03 | –0.18, 0.24 | 0.802 | 0.0 | 0.568 | R | ||
| NW | 3 | 0.02 | –0.75, 0.78 | 0.962 | 92.8 | R | ||||
| Mix | 26 | –0.10 | –0.23, 0.07 | 0.261 | 95.7 | R | ||||
| TPO-Ab (IU/mL) | Overall | 5 | 0.37 | 0.08, 0.67 | 0.014 | 98.3 | R | 0.762 | ||
| IGF-1 (ng/mL) | Overall | 15 | –0.41 | –1.14, 0.33 | 0.275 | 97.8 | R | 0.640 | ||
| Sex | Male | 4 | 0.21 | –0.04, 0.46 | 0.094 | 31.6 | 0.223 | F | ||
| Female | 1 | 0.40 | –0.14, 0.94 | 0.146 | - | - | R | |||
| Mix | 10 | –0.74 | –1.78, 0.31 | 0.167 | 98.3 | R | ||||
| Design | Multicenter | 7 | –0.21 | –1.26, 0.83 | 0.691 | 94.9 | R | |||
| Single-center | 8 | –0.58 | –1.62, 0.47 | 0.280 | 98.6 | R | ||||
| Age | Children | 10 | –0.73 | –1.67, 0.21 | 0.127 | 98.4 | R | |||
| Mix | 5 | 0.24 | –0.74, 1.22 | 0.632 | 91.1 | R | ||||
| Source | Blood | 12 | –0.09 | –0.90, 0.73 | 0.830 | 98.1 | R | |||
| Urinary | 1 | –3.37 | –4.14, –2.59 | - | - | R | ||||
| CSF | 2 | –0.89 | –1.42, –0.36 | 0.001 | 0.0 | 0.566 | F | |||
| IGFBP-3 (µg/mL) | Overall | 5 | –0.51 | –1.29, 0.28 | 0.204 | 96.0 | R | 0.273 | ||
| Sex | Male | 2 | 0.31 | –0.61, 1.23 | 0.512 | 91.1 | R | |||
| Mix | 3 | –1.12 | –2.37, 0.13 | 0.079 | 97.5 | R | ||||
| Design | Multicenter | 1 | –3.78 | –4.62, –2.95 | - | - | R | |||
| Single-center | 4 | 0.17 | –0.22, 0.56 | 0.394 | 84.5 | R | ||||
| Age | Children | 4 | –0.62 | –1.60, 0.36 | 0.215 | 97.0 | R | |||
| Mix | 1 | –0.17 | –0.59, 0.25 | 0.430 | - | - | R | |||
| Source | Blood | 4 | 0.17 | –0.22, 0.56 | 0.394 | 84.5 | R | |||
| Urinary | 1 | –3.78 | –4.62, –2.95 | - | - | R | ||||
| Leptin (ng/mL) | Overall | 24 | 0.10 | –0.33, 0.53 | 0.645 | 95.2 | R | 0.305 | ||
| Sex | Male | 6 | 0.74 | 0.10, 1.38 | 0.023 | 87.7 | R | |||
| Female | 3 | 0.18 | –1.77, 2.12 | 0.860 | 93.7 | R | ||||
| Mix | 16 | –0.08 | –0.66, 0.50 | 0.787 | 96.5 | R | ||||
| Design | Multicenter | 3 | –0.27 | –2.47, 1.94 | 0.811 | 98.6 | R | |||
| Single-center | 21 | 0.14 | –0.27, 0.56 | 0.496 | 93.9 | R | ||||
| Age | Children | 17 | –0.007 | –0.62, 0.60 | 0.982 | 96.4 | R | |||
| Adolescents | 2 | 0.04 | –0.21, 0.29 | 0.741 | 0.0 | 0.818 | F | |||
| Mix | 5 | 0.53 | 0.02, 1.04 | 0.042 | 82.1 | R | ||||
| Weight | OW | 3 | –0.95 | –2.54, 0.64 | 0.240 | 97.7 | R | |||
| NW | 3 | 0.80 | 0.007, 1.60 | 0.048 | 93.0 | R | ||||
| Mix | 18 | 0.16 | –0.36, 0.67 | 0.547 | 94.7 | R | ||||
| Ghrelin (ng/mL) | Overall | 7 | 0.62 | –0.38, 1.62 | 0.226 | 97.5 | R | 0.218 | ||
| Sex | Male | 2 | 1.03 | 0.01, 2.04 | 0.047 | 89.2 | R | |||
| Mix | 5 | 0.44 | –0.89, 1.77 | 0.519 | 98.1 | R | ||||
| Age | Children | 3 | 1.21 | –0.88, 3.30 | 0.256 | 98.5 | R | |||
| Mix | 4 | 0.17 | –0.74, 1.08 | 0.713 | 94.7 | R | ||||
| Adiponectin (µg/mL) | Overall | 10 | –0.16 | –0.58, 0.25 | 0.437 | 89.8 | R | 0.957 | ||
| Sex | Male | 1 | –0.75 | –1.26, –0.23 | 0.005 | - | - | R | ||
| Mix | 9 | –0.10 | –0.54, 0.34 | 0.650 | 90.4 | R | ||||
| Age | Children | 6 | –0.33 | –0.89, 0.23 | 0.249 | 92.9 | R | |||
| Mix | 4 | 0.10 | –0.49, 0.69 | 0.740 | 79.8 | 0.002 | R | |||
SMD, standardized mean difference; ES, effect size; 95% CI, 95% confidence
intervals; H, heterogeneity; R, random-effect; F, fixed-effect; PB, publication
bias. Bold indicates indicators with the pES-value
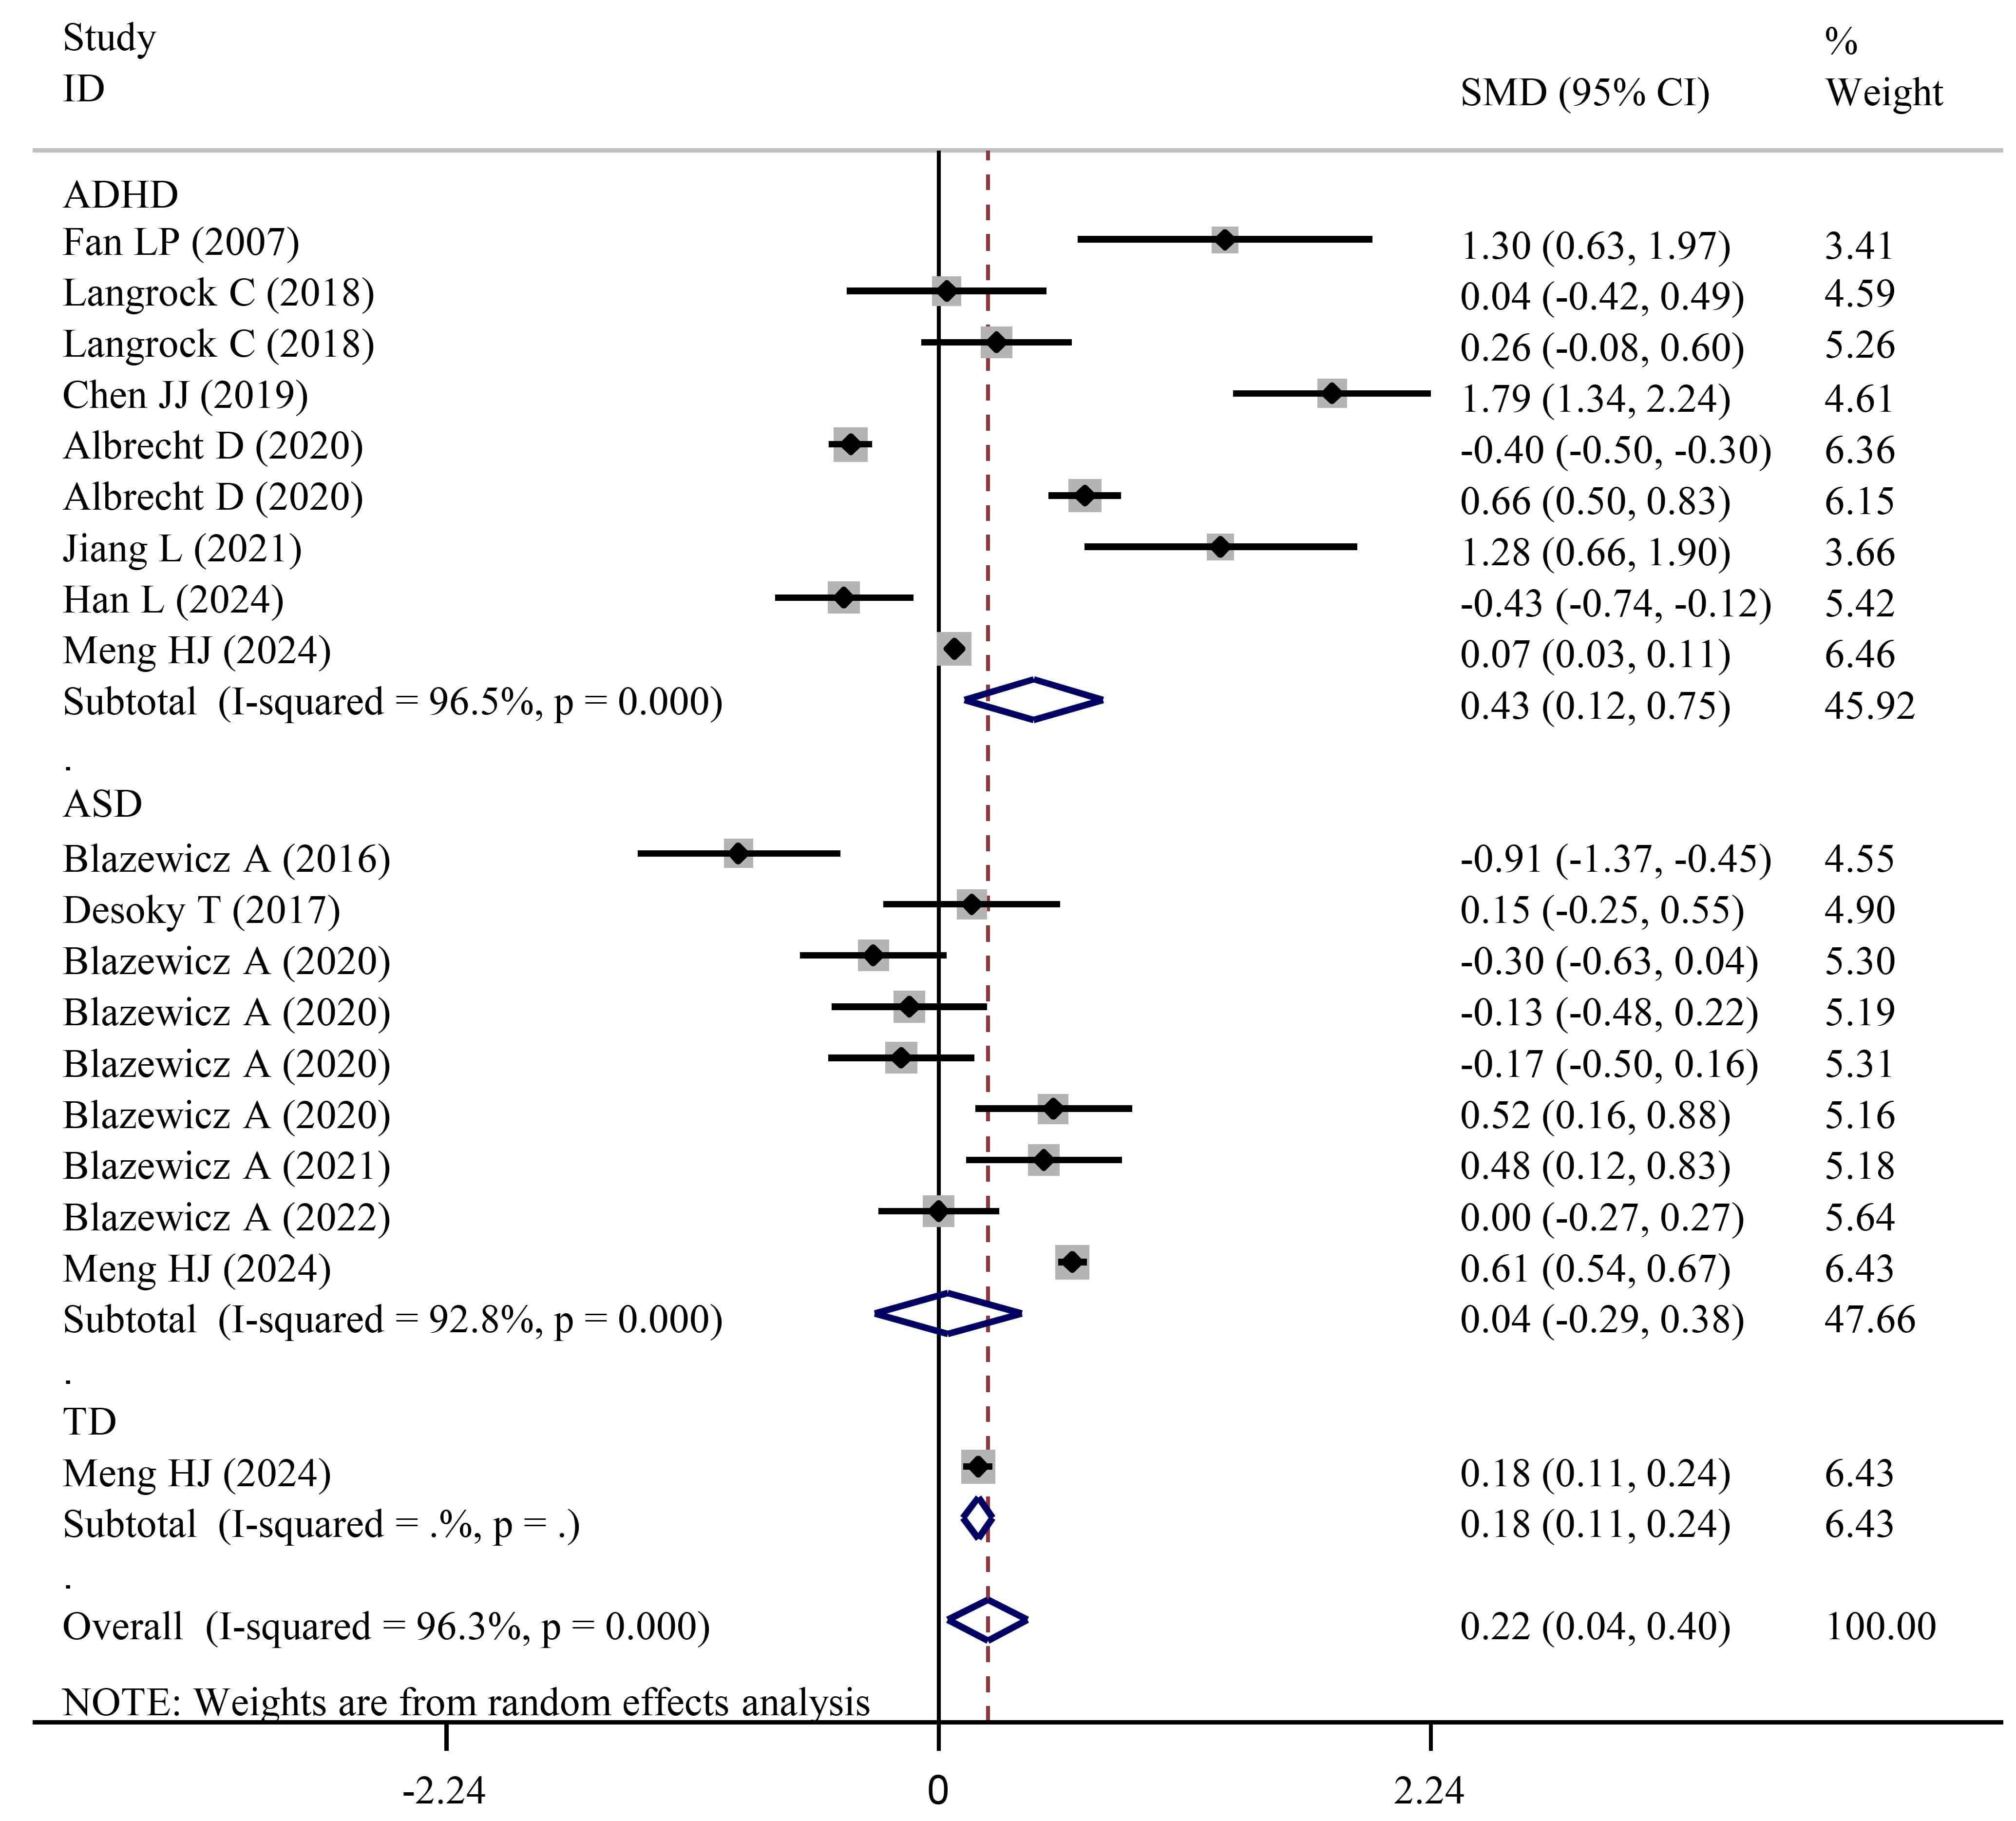 Fig. 2.
Forest plots showing significantly higher FT3 levels in NDD (or ADHD) patients than in HCs. NDD, neurodevelopmental disorders; HCs, healthy controls; ASD, autism spectrum disorder.
A further independent analysis was performed for ADHD and ASD subjects. Results
showed a significant increase in FT3 levels between subjects with ADHD and HCs
(SMD = 0.43; 95% CI = 0.12 to 0.75; pES = 0.007) (Table 3; Fig. 2), while no significant alterations in ASD subjects were found relative to HCs
(SMD = 0.04; 95% CI = –0.29 to 0.38; pES = 0.800) (Table 4; Fig. 2). Similar results were also obtained in subgroup analysis for ADHD
(single-center, pES = 0.034; mixed-sex, pES
| Variables | No. | SMD | 95% CI | pES | I2 | pH | Model | pPB | ||
| FT3 (pmol/L) | Overall (ADHD) | 9 | 0.43 | 0.12, 0.75 | 0.007 | 96.5 | R | 0.341 | ||
| Design | Multicenter | 4 | 0.14 | –0.51, 0.79 | 0.673 | 97.6 | R | |||
| Single-center | 5 | 0.76 | 0.06, 1.47 | 0.034 | 95.7 | R | ||||
| Age | Children | 5 | –0.10 | –0.40, 0.20 | 0.494 | 95.3 | R | |||
| Adolescents | 1 | 0.66 | 0.50, 0.83 | - | - | R | ||||
| Mix | 3 | 1.53 | 1.18, 1.88 | 13.9 | 0.313 | R | ||||
| Weight | OW | 1 | 0.04 | –0.42, 0.49 | 0.875 | - | - | R | ||
| NW | 1 | 0.26 | –0.08, 0.60 | 0.132 | - | - | R | |||
| Mix | 7 | 0.52 | 0.15, 0.89 | 0.006 | 97.4 | R | ||||
| ADHD-IT | 3 | 1.52 | 0.80, 2.23 | 62.2 | 0.071 | R | 0.102 | |||
| ADHD-HIT | 3 | 0.63 | –0.90, 2.16 | 0.422 | 84.1 | 0.002 | R | 0.248 | ||
| ADHD-CT | 3 | 0.06 | –2.39, 2.52 | 0.961 | 97.8 | R | 0.077 | |||
| FT4 (pmol/L) | Overall (ADHD) | 14 | –0.07 | –0.34, 0.20 | 0.612 | 95.7 | R | 0.008 | ||
| Sex | Male | 2 | –0.26 | –0.52, –0.01 | 0.042 | 0.0 | 0.380 | R | ||
| Female | 1 | –0.14 | –0.67, 0.40 | 0.619 | - | - | R | |||
| Mix | 11 | –0.03 | –0.34, 0.29 | 0.856 | 96.6 | R | ||||
| Design | Multicenter | 6 | –0.29 | –0.52, –0.06 | 0.013 | 79.4 | R | |||
| Single-center | 8 | 0.13 | –0.44, 0.71 | 0.647 | 96.3 | R | ||||
| Age | Children | 10 | –0.08 | –0.43, 0.26 | 0.632 | 96.8 | R | |||
| Adolescents | 1 | –0.47 | –0.64, –0.31 | - | - | R | ||||
| Mix | 3 | 0.16 | –0.12, 0.44 | 0.256 | 0.0 | 0.991 | R | |||
| Weight | OW | 1 | –1.00 | –1.48, –0.52 | - | - | R | |||
| NW | 1 | –0.34, 0.34 | 1.000 | - | - | R | ||||
| Mix | 12 | –0.003 | –0.30, 0.29 | 0.985 | 96.2 | R | ||||
| ADHD-IT | 2 | –0.78 | –1.36, –0.19 | 0.009 | 0.0 | 0.869 | F | - | ||
| ADHD-HIT | 2 | 0.59 | –0.16, 1.34 | 0.125 | 0.0 | 0.931 | F | - | ||
| ADHD-CT | 2 | 0.43 | –0.04, 0.90 | 0.070 | 0.0 | 0.928 | F | - | ||
| TT3 (ng/mL) | Overall (ADHD) | 6 | 0.22 | –0.85, 1.29 | 0.681 | 98.6 | R | 0.002 | ||
| Sex | Male | 1 | –0.04 | –0.45, 0.37 | 0.854 | - | - | R | ||
| Mix | 5 | 0.28 | –0.97, 1.53 | 0.661 | 98.7 | R | ||||
| Age | Children | 3 | –0.38 | –1.72, 0.97 | 0.583 | 98.9 | R | |||
| Mix | 3 | 0.82 | 0.36, 1.28 | 45.4 | 0.160 | R | ||||
| ADHD-IT | 2 | 0.83 | 0.24, 1.41 | 0.006 | 0.0 | 0.476 | R | - | ||
| ADHD-HIT | 2 | 1.50 | 0.69, 2.31 | 0.0 | 0.590 | F | - | |||
| ADHD-CT | 2 | 1.06 | 0.56, 1.56 | 12.9 | 0.284 | F | - | |||
| TT4 (ng/mL) | Overall (ADHD) | 6 | –0.16 | –0.59, 0.27 | 0.462 | 90.8 | R | 0.150 | ||
| Sex | Male | 1 | –0.07 | –0.47, 0.34 | 0.752 | - | - | R | ||
| Mix | 5 | –0.18 | –0.69, 0.33 | 0.485 | 91.9 | R | ||||
| Age | Children | 3 | –0.08 | –0.74, 0.59 | 0.817 | 95.6 | R | |||
| Mix | 3 | –0.26 | –0.86, 0.33 | 0.386 | 69.4 | 0.038 | R | |||
| ADHD-IT | 2 | –1.07 | –1.67, –0.46 | 0.001 | 0.0 | 0.988 | F | - | ||
| ADHD-HIT | 2 | 0.75 | –0.008, 1.50 | 0.053 | 0.0 | 0.984 | F | - | ||
| ADHD-CT | 2 | 0.27 | –0.20, 0.73 | 0.262 | 0.0 | 0.991 | F | - | ||
| TSH (µIU/mL) | Overall (ADHD) | 18 | –0.04 | –0.26, 0.18 | 0.723 | 94.1 | R | 0.406 | ||
| Sex | Male | 3 | 0.07 | –0.14, 0.29 | 0.515 | 0.0 | 0.946 | R | ||
| Female | 1 | –0.46 | –1.00, 0.08 | 0.094 | - | - | R | |||
| Mix | 14 | –0.04 | –0.29, 0.22 | 0.783 | 95.4 | R | ||||
| Design | Multicenter | 6 | –0.19 | –0.63, 0.24 | 0.387 | 94.9 | R | |||
| Single-center | 12 | 0.04 | –0.18, 0.26 | 0.701 | 83.7 | R | ||||
| Age | Children | 11 | –0.25 | –0.55, 0.05 | 0.108 | 95.9 | R | |||
| Adolescents | 1 | 0.33 | 0.17, 0.49 | - | - | R | ||||
| Mix | 6 | 0.29 | –0.06, 0.64 | 0.107 | 76.5 | 0.001 | R | |||
| Weight | OW | 1 | –0.17 | –0.62, 0.29 | 0.469 | - | - | R | ||
| NW | 1 | –0.34 | –0.68, 0.005 | 0.054 | - | - | R | |||
| Mix | 16 | –0.01 | –0.25, 0.2 | 0.919 | 94.7 | R | ||||
| ADHD-IT | 3 | 0.41 | –0.31, 1.13 | 0.265 | 72.2 | 0.027 | R | 0.052 | ||
| ADHD-HIT | 2 | 0.91 | 0.15, 1.68 | 0.019 | 0.0 | 0.969 | F | - | ||
| ADHD-CT | 3 | 0.67 | 0.44, 0.90 | 0.0 | 0.801 | F | - | |||
| TPO-Ab (IU/mL) | Overall | 2 | 0.22 | 0.18, 0.25 | 0.0 | 0.876 | F | - | ||
| IGF-1 (ng/mL) | Overall | 6 | –0.57 | –1.93, 0.80 | 0.414 | 98.1 | R | 0.683 | ||
| Sex | Male | 3 | 0.08 | –0.17, 0.33 | 0.533 | 0.0 | 0.691 | R | ||
| Female | 1 | 0.40 | –0.14, 0.94 | 0.146 | - | - | R | |||
| Mix | 2 | –2.07 | –6.40, 2.27 | 0.350 | 99.4 | R | ||||
| Design | Multicenter | 3 | 0.21 | –0.06, 0.48 | 0.129 | 0.0 | 0.633 | R | ||
| Single-center | 3 | –1.39 | –4.07, 1.29 | 0.310 | 99.1 | R | ||||
| Age | Children | 4 | –0.91 | –2.98, 1.16 | 0.388 | 98.8 | R | |||
| Mix | 2 | 0.07 | –0.26, 0.41 | 0.672 | 0.0 | 0.391 | R | |||
| IGFBP-3 (µg/mL) | Overall | 2 | 0.05 | –0.32, 0.42 | 0.773 | 54.4 | 0.139 | R | - | |
| Leptin (ng/mL) | Overall | 9 | –0.59 | –1.74, 0.56 | 0.316 | 97.7 | R | 0.223 | ||
| Sex | Male | 2 | 0.32 | –0.07, 0.71 | 0.107 | 18.7 | 0.267 | R | ||
| Female | 1 | –1.01 | –1.70, –0.32 | 0.004 | - | - | R | |||
| Mix | 6 | –0.81 | –2.52, 0.90 | 0.356 | 98.5 | R | ||||
| Design | Multicenter | 2 | –0.97 | –5.25, 3.30 | 0.655 | 99.2 | R | |||
| Single-center | 7 | –0.48 | –1.69, 0.73 | 0.434 | 97.1 | R | ||||
| Age | Children | 7 | –0.80 | –2.31, 0.72 | 0.304 | 98.2 | R | |||
| Mix | 2 | 0.15 | –0.53, 0.83 | 0.659 | 73.0 | 0.054 | R | |||
| Weight | OW | 1 | –3.16 | –3.81, –2.51 | - | - | R | |||
| NW | 1 | 1.20 | 0.83, 1.57 | - | - | R | ||||
| Mix | 7 | –0.48 | –1.69, 0.73 | 0.434 | 97.1 | R | ||||
| Ghrelin (ng/mL) | Overall | 5 | –1.32 | –3.15, 0.52 | 0.161 | 98.8 | R | 0.409 | ||
| Sex | Male | 1 | 1.55 | 1.07, 2.02 | - | - | R | |||
| Mix | 4 | 0.63 | –1.07, 2.32 | 0.468 | 98.5 | R | ||||
| Age | Children | 1 | 3.36 | 2.88, 3.83 | - | - | R | |||
| Mix | 4 | 0.17 | –0.74, 1.08 | 0.713 | 94.7 | R | ||||
| Adiponectin (µg/mL) | Overall | 3 | 0.16 | –0.73, 1.04 | 0.730 | 91.7 | R | 0.735 | ||
ADHD, attention deficit hyperactivity disorder; IT, inattentive type; HIT,
hyperactive-impulsive type; CT, combined type; H, heterogeneity; R,
random-effect; F, fixed-effect; PB, publication bias. Bold indicates indicators
with the pES-value
| Variables | No. | SMD | 95% CI | pES | I2 | pH | Model | pPB | ||
| FT3 (pmol/L) | Overall | 9 | 0.04 | –0.29, 0.38 | 0.800 | 92.8 | R | 0.005 | ||
| Sex | Male | 3 | –0.05 | –0.85, 0.75 | 0.906 | 91.5 | R | |||
| Female | 2 | 0.19 | –0.24, 0.61 | 0.385 | 0.0 | 0.674 | F | |||
| Mix | 6 | 0.12 | –0.26, 0.51 | 0.530 | 92.0 | R | ||||
| Age | Children | 5 | 0.06 | –0.41, 0.52 | 0.810 | 92.5 | R | |||
| Adolescents | 3 | 0.11 | –0.29, 0.52 | 0.582 | 75.6 | 0.016 | R | |||
| Mix | 2 | –0.21 | –1.57, 1.15 | 0.766 | 95.4 | R | ||||
| Weight | OW | 2 | –0.23 | –0.47, 0.003 | 0.053 | 0.0 | 0.599 | R | ||
| NW | 2 | 0.19 | –0.45, 0.84 | 0.554 | 84.7 | 0.011 | R | |||
| Mix | 5 | 0.09 | –0.37, 0.55 | 0.695 | 93.4 | R | ||||
| FT4 (pmol/L) | Overall | 11 | 0.14 | –0.32, 0.60 | 0.558 | 96.5 | R | |||
| Sex | Male | 3 | 0.14 | –0.50, 0.77 | 0.670 | 86.7 | 0.001 | R | ||
| Female | 2 | 0.44 | 0.006, 0.86 | 0.047 | 0.0 | 0.553 | F | |||
| Mix | 8 | 0.14 | –0.42, 0.70 | 0.627 | 96.6 | R | ||||
| Age | Children | 7 | 0.11 | –0.49, 0.72 | 0.714 | 96.2 | R | |||
| Adolescents | 3 | 0.19 | –0.27, 0.65 | 0.419 | 81.5 | 0.005 | R | |||
| Mix | 2 | 0.15 | –1.00, 1.29 | 0.800 | 93.8 | R | ||||
| Weight | OW | 2 | 0.21 | –0.28, 0.70 | 0.406 | 76.9 | 0.038 | R | ||
| NW | 2 | 0.43 | –0.06, 0.92 | 0.089 | 73.6 | 0.052 | R | |||
| Mix | 7 | 0.03 | –0.55, 0.62 | 0.913 | 96.3 | R | ||||
| TT3 (ng/mL) | Overall | 1 | –0.21 | –0.27, –0.14 | - | - | F | - | ||
| TT4 (ng/mL) | Overall | 1 | –0.45 | –0.51, –0.38 | - | - | F | - | ||
| TSH (µIU/mL) | Overall | 13 | –0.24 | –0.62, 0.14 | 0.209 | 94.8 | R | 0.621 | ||
| Sex | Male | 4 | –0.96 | –2.61, 0.69 | 0.253 | 97.9 | R | |||
| Female | 2 | 0.03 | –0.39, 0.46 | 0.885 | 0.0 | 0.733 | F | |||
| Mix | 9 | –0.02 | –0.34, 0.30 | 0.914 | 89.1 | R | ||||
| Age | Children | 8 | –0.44 | –1.07, 0.19 | 0.173 | 96.3 | R | |||
| Adolescents | 3 | 0.16 | –0.49, 0.82 | 0.626 | 90.6 | R | ||||
| Mix | 3 | 0.03 | –0.65, 0.71 | 0.926 | 86.9 | R | ||||
| Weight | OW | 2 | 0.08 | –0.16, 0.31 | 0.512 | 0.0 | 0.626 | R | ||
| NW | 2 | 0.20 | –1.00, 1.40 | 0.747 | 95.5 | R | ||||
| Mix | 9 | –0.46 | –1.00, 0.08 | 0.097 | 95.8 | R | ||||
| TPO-Ab (IU/mL) | Overall | 2 | 0.14 | 0.08, 0.21 | 24.9 | 0.249 | F | - | ||
| IGF-1 (ng/mL) | Overall | 9 | –0.30 | –1.24, 0.64 | 0.528 | 97.8 | R | 0.573 | ||
| Sex | Male | 1 | 0.50 | 0.15, 0.85 | 0.005 | - | - | R | ||
| Mix | 8 | –0.40 | –1.44, 0.63 | 0.446 | 97.8 | R | ||||
| Design | Multicenter | 4 | –0.55 | –2.86, 1.77 | 0.644 | 96.8 | R | |||
| Single-center | 5 | –0.10 | –1.25, 1.06 | 0.870 | 98.5 | R | ||||
| Age | Children | 6 | –0.61 | –1.74, 0.51 | 0.285 | 98.4 | R | |||
| Mix | 3 | 0.40 | –1.94, 2.73 | 0.739 | 95.5 | R | ||||
| Source | Blood | 6 | 0.39 | –0.74, 1.53 | 0.499 | 98.4 | R | |||
| Urinary | 1 | –3.37 | –4.14, –2.59 | - | - | R | ||||
| CSF | 2 | –0.89 | –1.42, –0.36 | 0.001 | 0.0 | 0.566 | F | |||
| IGFBP-3 (µg/mL) | Overall | 3 | –0.97 | –2.54, 0.60 | 0.224 | 97.9 | R | 0.562 | ||
| Leptin (ng/mL) | Overall | 15 | 0.46 | 0.17, 0.74 | 0.002 | 84.1 | R | 0.383 | ||
| Sex | Male | 4 | 1.03 | 0.006, 2.05 | 0.049 | 91.9 | R | |||
| Female | 2 | 0.91 | –3.43, 5.25 | 0.681 | 96.7 | R | ||||
| Mix | 10 | 0.35 | 0.01, 0.69 | 0.044 | 85.9 | R | ||||
| Design | Multicenter | 1 | 1.10 | 0.71, 1.49 | - | - | R | |||
| Single-center | 14 | 0.40 | 0.12, 0.69 | 0.006 | 82.6 | R | ||||
| Age | Children | 10 | 0.46 | 0.08, 0.83 | 0.016 | 84.6 | R | |||
| Adolescents | 2 | 0.04 | –0.21, 0.29 | 0.741 | 0.0 | 0.818 | F | |||
| Mix | 3 | 0.78 | 0.15, 1.41 | 0.015 | 80.4 | 0.006 | R | |||
| Weight | OW | 2 | 0.11 | –0.13, 0.36 | 0.375 | 0.0 | 0.783 | R | ||
| NW | 2 | 0.60 | –0.56, 1.77 | 0.308 | 95.1 | R | ||||
| Mix | 11 | 0.51 | 0.14, 0.87 | 0.006 | 83.3 | R | ||||
| Ghrelin (ng/mL) | Overall | 2 | 0.14 | –0.74, 1.02 | 0.752 | 87.8 | 0.004 | R | - | |
| Adiponectin (µg/mL) | Overall | 7 | –0.30 | –0.75, 0.14 | 0.184 | 87.4 | R | 0.773 | ||
| Sex | Male | 1 | –0.75 | –1.26, –0.23 | 0.005 | - | - | R | ||
| Mix | 6 | –0.23 | –0.73, 0.27 | 0.363 | 88.9 | R | ||||
| Age | Children | 4 | –0.47 | –1.08, 0.14 | 0.128 | 90.9 | R | |||
| Mix | 3 | –0.06 | –0.75, 0.64 | 0.875 | 81.5 | 0.004 | R | |||
Bold indicates indicators with the pES-value
Eighteen studies with 26 experimental datasets examined the concentration of FT4
in NDD cases and HCs (Supplementary Table 1). Pooling all related data
under a random-effect model (I2 = 95.9%, pH
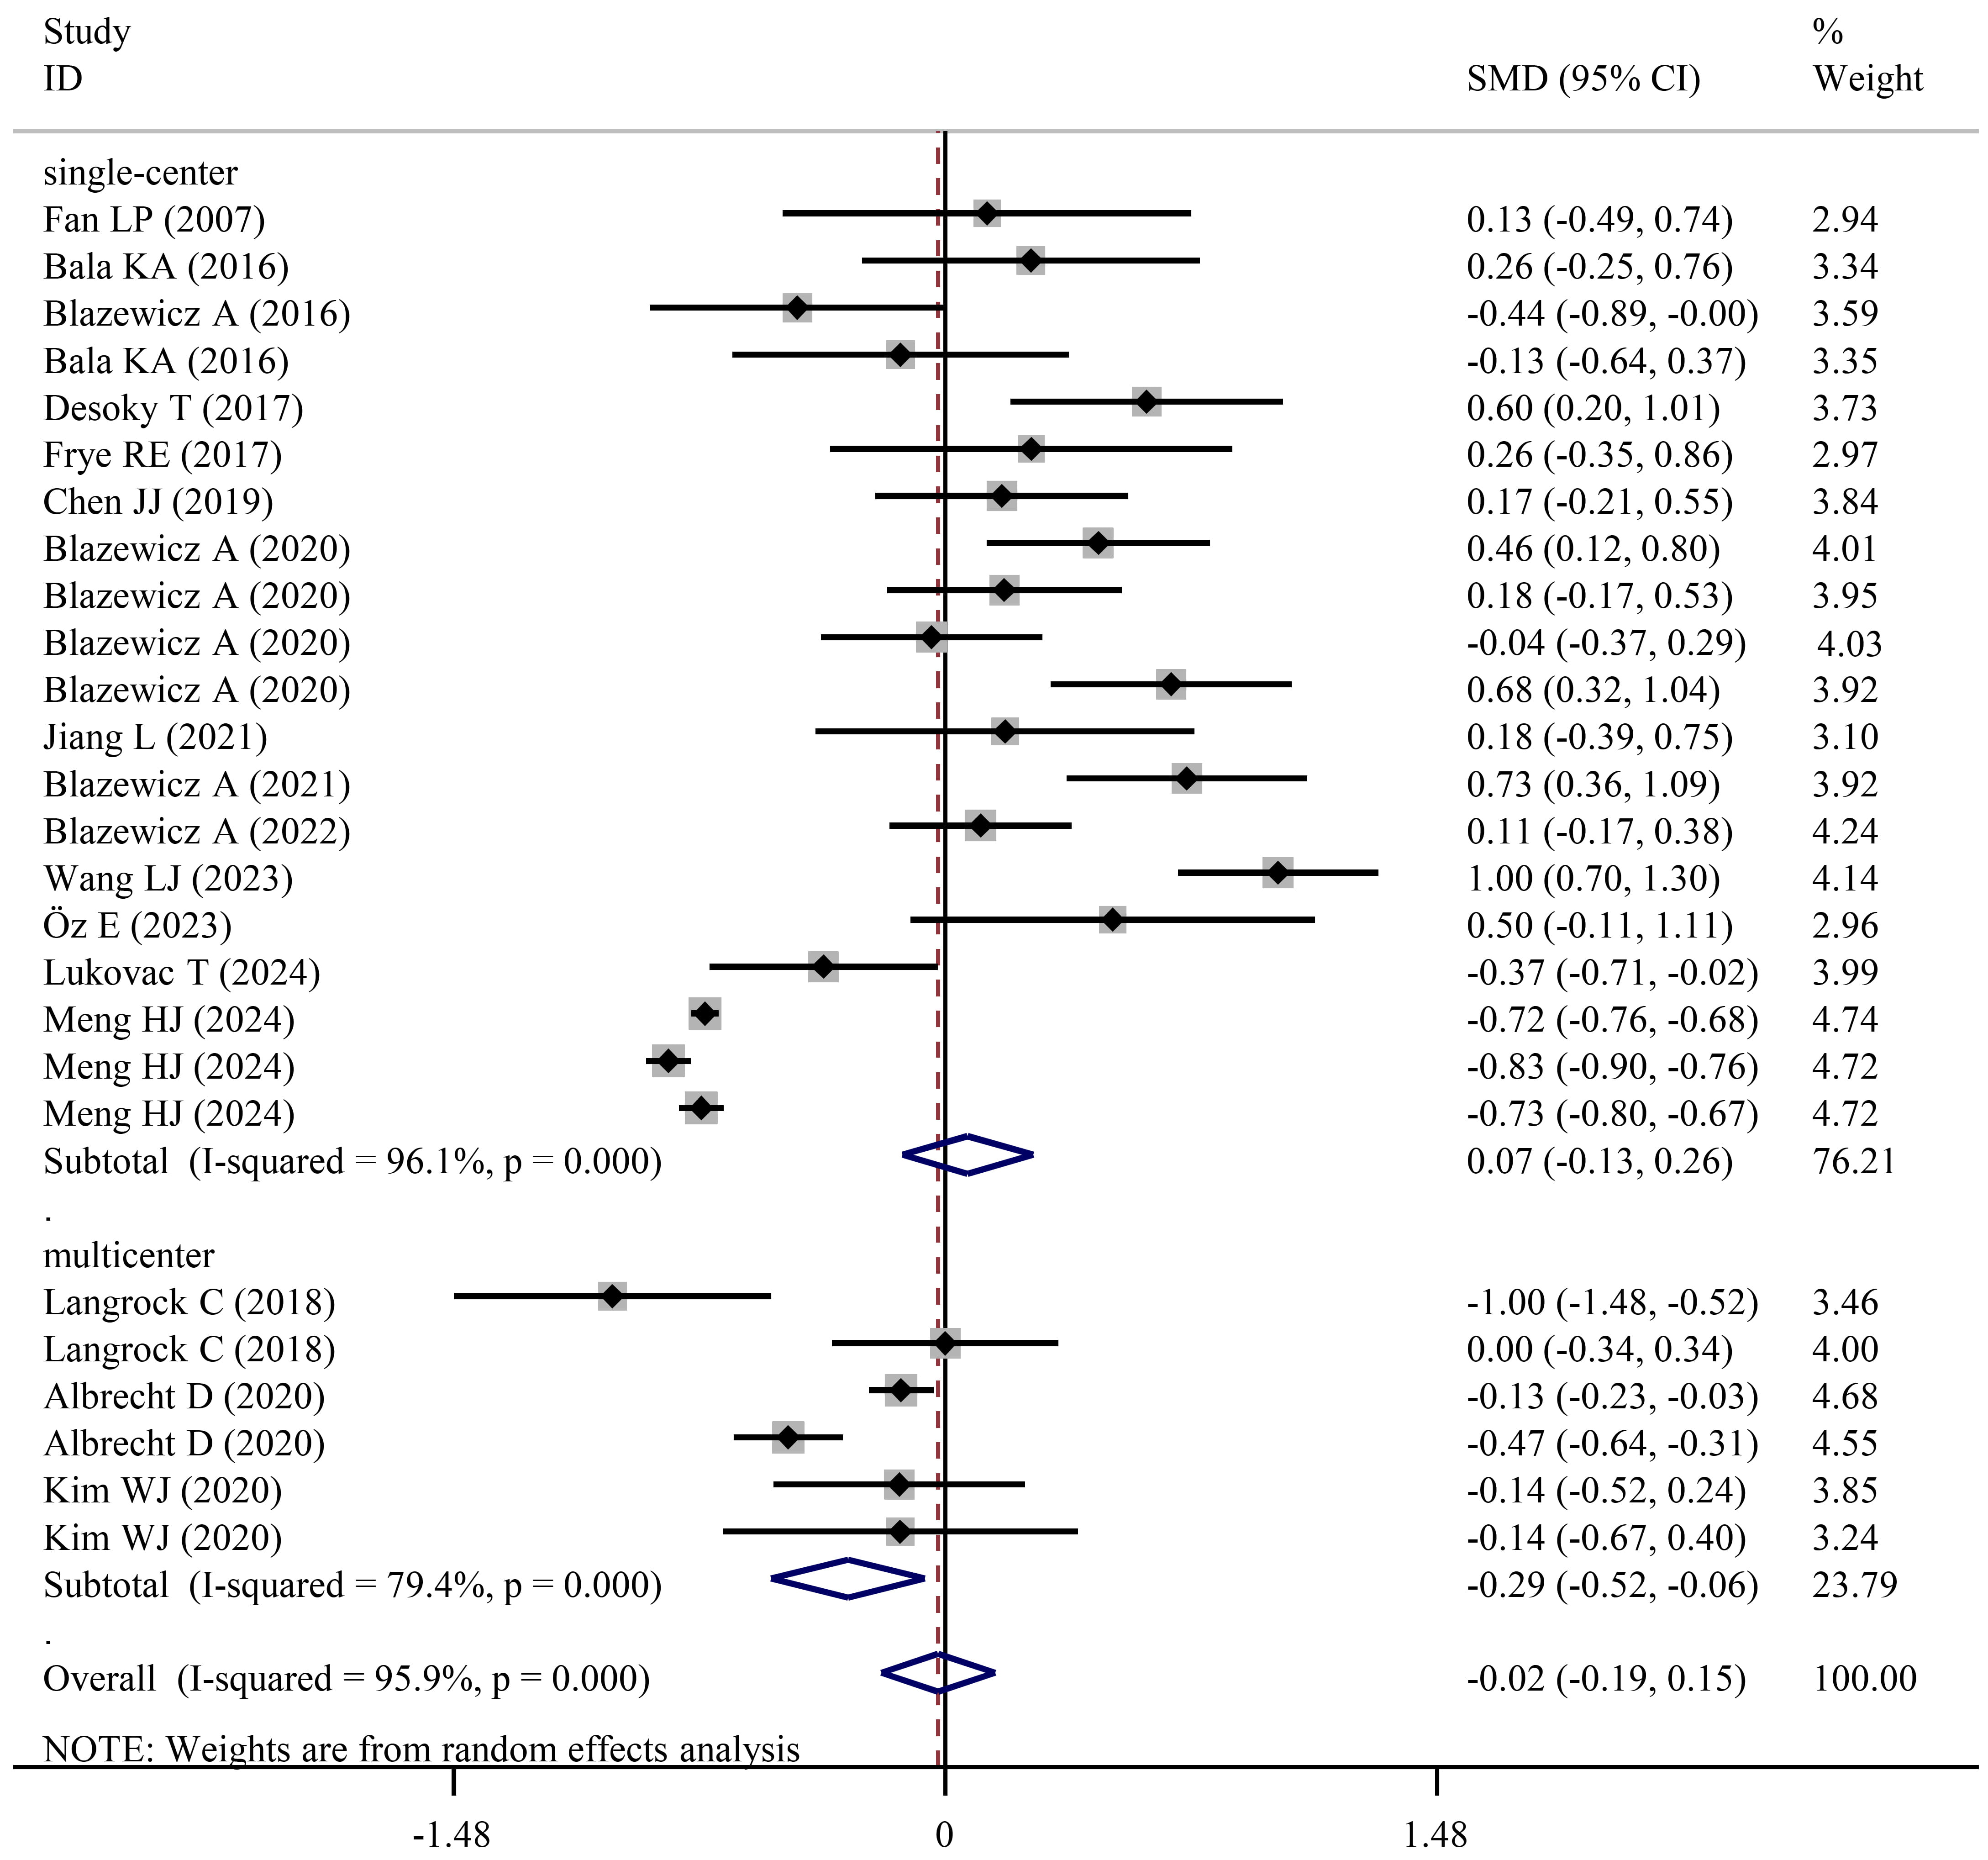 Fig. 3.
Forest plots showing significantly lower FT4 levels in NDD patients than in HCs when studies with a multicenter design were pooled.
No statistical significance was found during the independent meta-analysis of FT4 for ADHD (SMD = –0.07; 95% CI = –0.34 to 0.20; pES = 0.612) (Table 3) and ASD cases (SMD = 0.14; 95% CI = –0.32 to 0.60; pES = 0.558) (Table 4). However, subgroup analysis showed FT4 levels were significantly decreased either for male ADHD cases (SMD = –0.26; 95% CI = –0.52 to –0.01; pES = 0.042) or for analysis of studies with a multicenter design (SMD = –0.29; 95% CI = –0.52 to –0.06; pES = 0.013) (Table 3). Similarly to these subgroup analysis results, a lower concentration of FT4 was observed in ADHD-IT cases when compared to HCs (SMD = –0.78; 95% CI = –1.36 to –0.19; pES = 0.009). Different from the results of ADHD, FT4 was found to be higher in female ASD patients when compared to HCs (SMD = 0.44; 95% CI = 0.006 to 0.86; pES = 0.047) (Table 4), but this conclusion requires further investigation as the pES-value was approximately 0.05.
Six studies with eight experimental datasets compared the average level of TT3
in NDD cases and HCs (Supplementary Table 1). Under a random-effect
model (I2 = 99.4%, pH
All these six studies explored TT3 in ADHD and one study simultaneously included
ASD and TD patients; thus, both pooled and subgroup meta-analyses were only
performed for ADHD. No significant variations in levels of TT3 were found between
ADHD cases and HCs in overall meta-analysis (SMD = 0.22; 95% CI = –0.85 to
1.29; pES = 0.681), but TT3 levels were significantly increased in
mixed-age populations in the subgroup analysis (SMD = 0.82; 95% CI = 0.36 to
1.28; pES
The meta-analysis of TT4 levels encompassed six studies with eight experimental
datasets (Supplementary Table 1). The combined results which were
analyzed based on a random-effect model (I2 = 91%,
pH
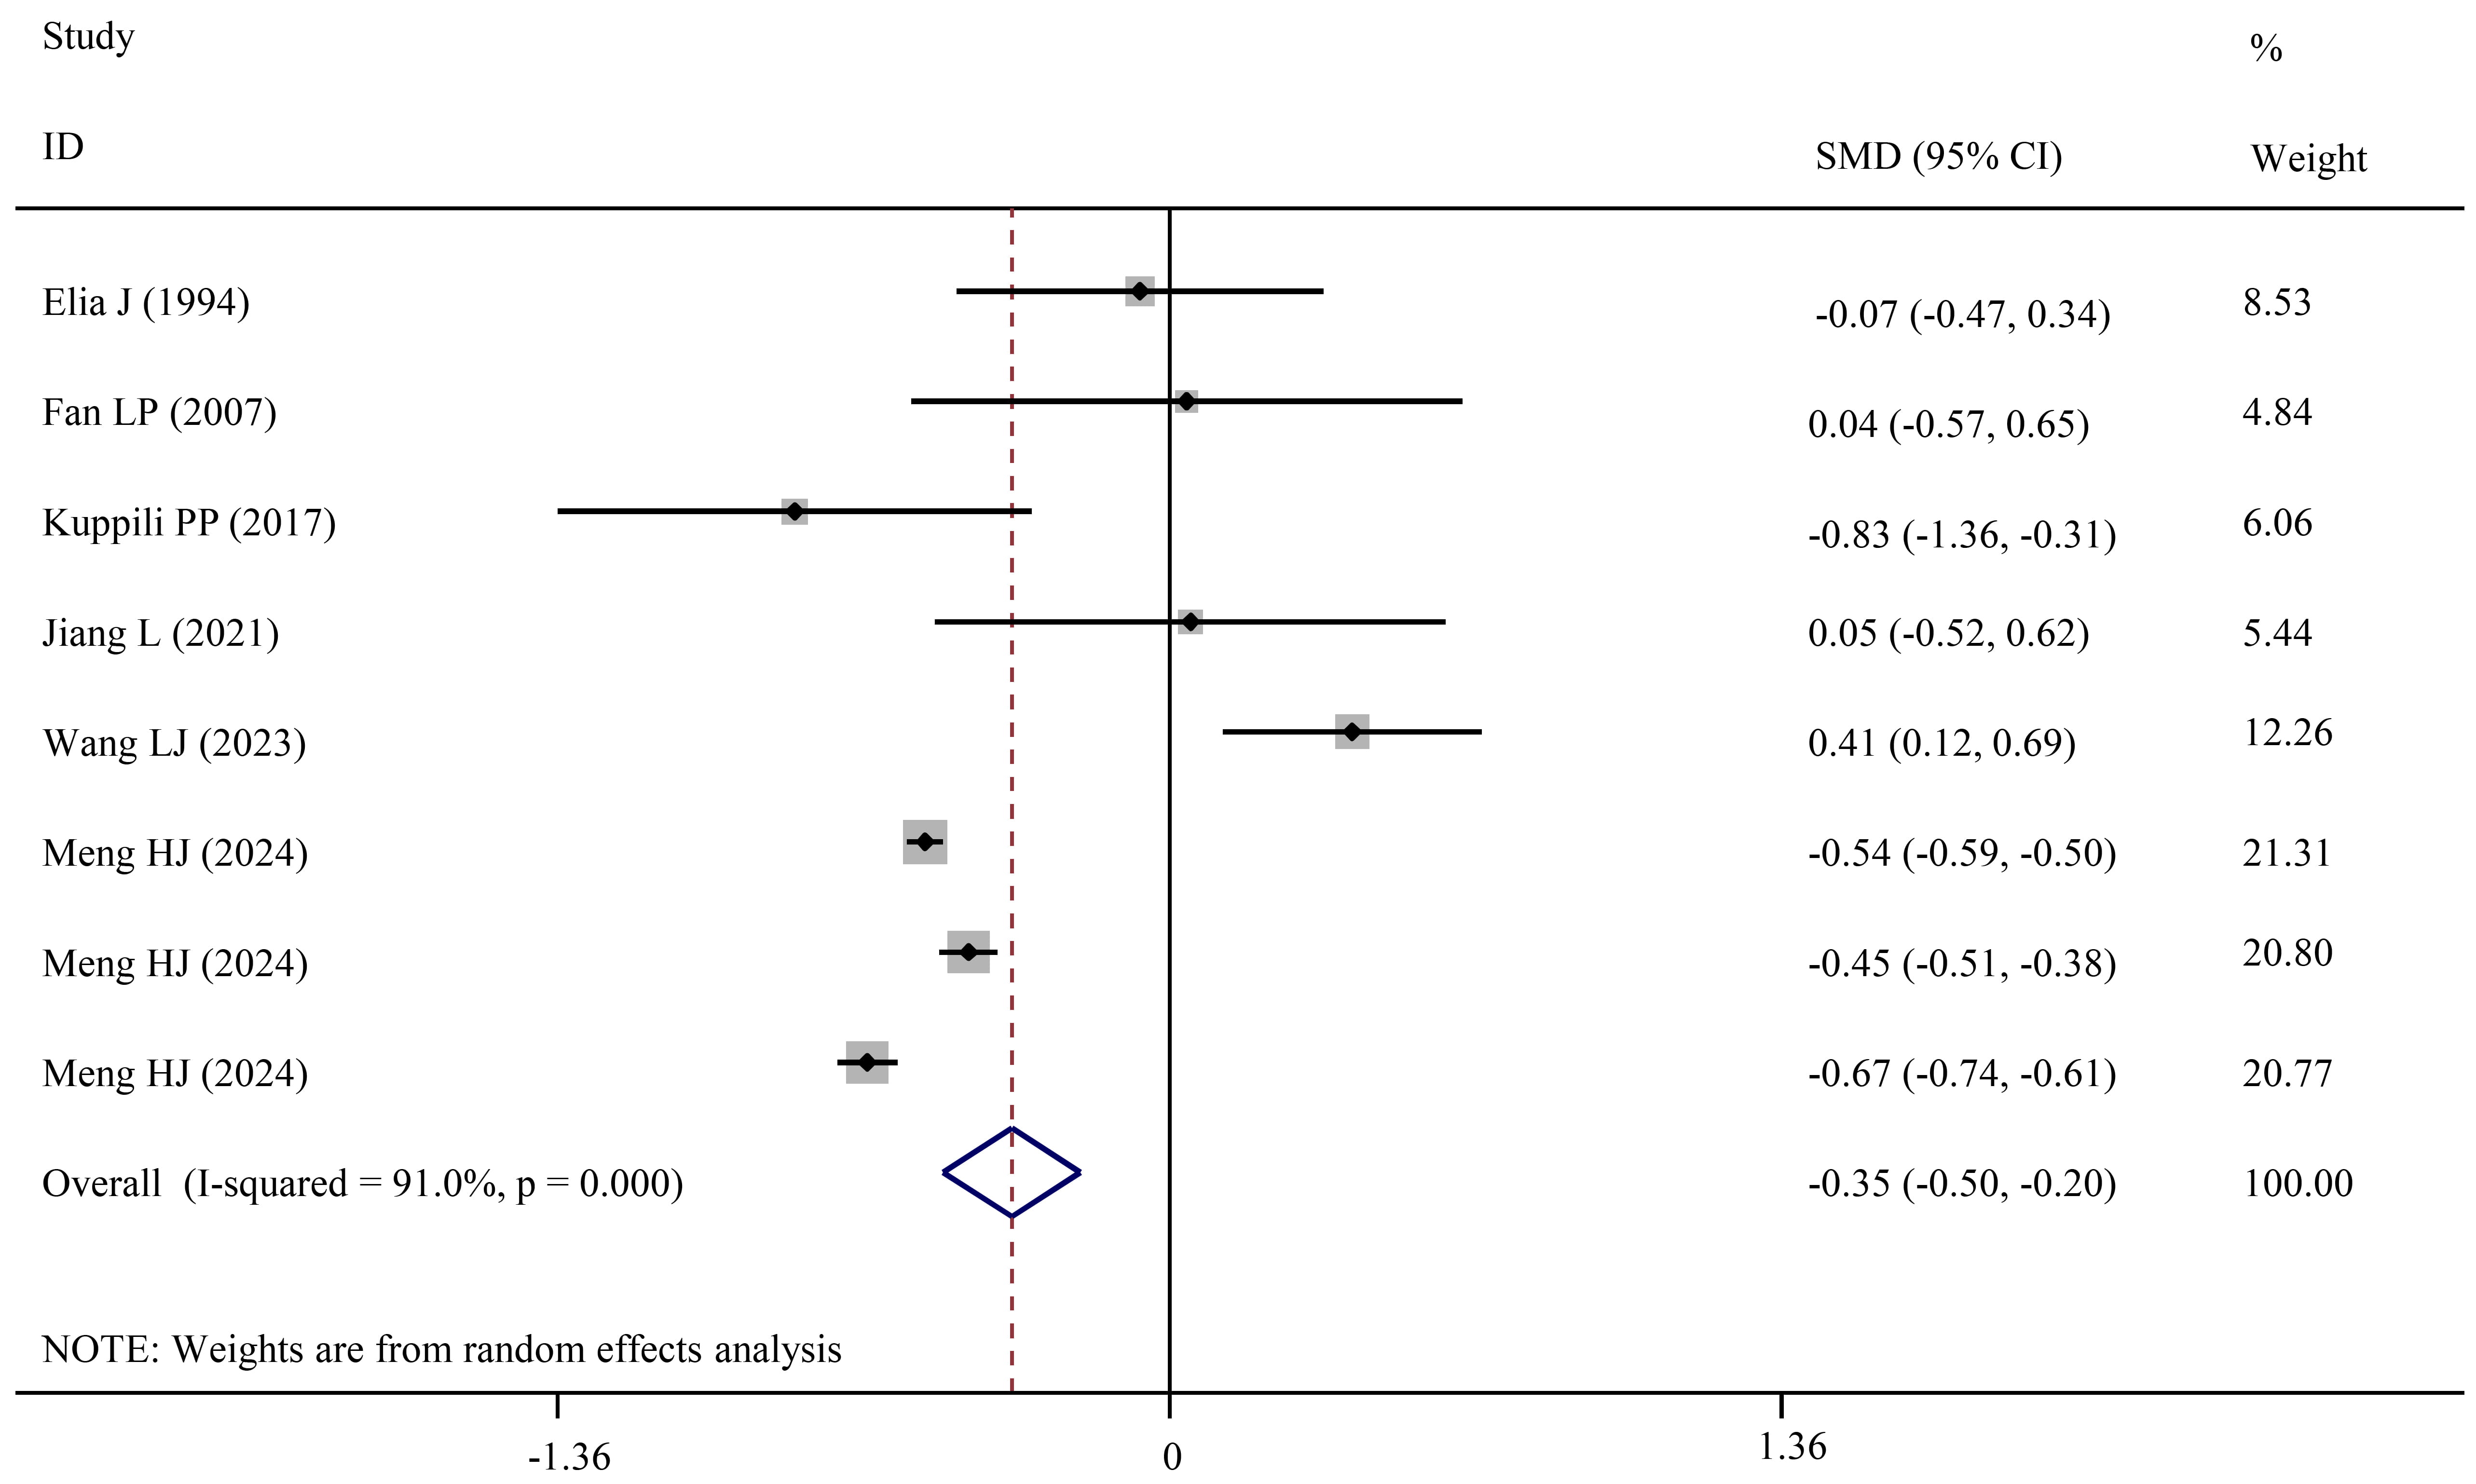 Fig. 4.
Forest plots showing significantly lower TT4 levels in NDD patients than in HCs.
Although pooled and subgroup analyses did not detect significant changes in TT4 levels between ADHD and HCs, the combined analysis of two studies revealed TT4 levels were decreased in ADHD-IT when compared to HCs (SMD = –1.07; 95% CI = –1.67 to –0.46; pES = 0.001) (Table 3).
Twenty-three studies with 32 datasets recorded the TSH levels in NDD patients
and HCs (Supplementary Table 1). A random-effect meta-analysis
demonstrated TSH levels in NDD patients were not significantly different from
those of HCs (SMD = –0.08; 95% CI = –0.23 to 0.08; pES = 0.326;
I2 = 95%, pH
Pooled and subgroup meta-analyses did not identify the association of TSH levels
for both ADHD (Table 3) and ASD (Table 4) patients. However, children and
adolescents with ADHD-HIT (SMD = 0.91; 95% CI = 0.15 to 1.68; pES
= 0.019) and ADHD-CT (SMD = 0.67; 95% CI = 0.44 to 0.90; pES
Two studies with five datasets reported TPO-Ab levels in NDD patients and HCs
(Supplementary Table 1). Combined results showed TPO-Ab levels were
significantly increased in NDD patients when compared to HCs (SMD = 0.37; 95% CI
= 0.08 to 0.67; pES = 0.014) (Table 2). A similar result was also
obtained for ADHD (SMD = 0.22; 95% CI = 0.18 to 0.25; pES
Fourteen studies with 15 datasets measured IGF-1 concentration in NDD patients and HCs (Supplementary Table 1). The overall meta-analysis did not detect a significant difference in IGF-1 between two groups (SMD = –0.41; 95% CI = –1.14 to 0.33; pES = 0.275). However, subgroup analysis of studies with CSF samples found IGF-1 levels were significantly reduced in NDD patients relative to HCs (SMD = –0.89; 95% CI = –1.42 to –0.36; pES = 0.001) (Table 2).
Six and nine datasets were respectively used to determine the difference in levels of IGF-1 between ADHD/ASD and HCs. Similarly to NDDs, IGF-1 levels were not significantly different between ADHD (SMD = –0.57; 95% CI = –1.93 to 0.80; pES = 0.414)/ASD (SMD = –0.30; 95% CI = –1.24 to 0.64; pES = 0.528) and HCs in the overall meta-analysis (Tables 3,4). Reduced IGF-1 levels were only observed in ASD patients in subgroup analysis of studies with CSF samples (SMD = –0.89; 95% CI = –1.42 to –0.36; pES = 0.001) (Table 4).
The concentration of IGFBP-3 in NDD patients and HCs were determined and compared in five studies (Supplementary Table 1). Regardless of total NDDs (SMD = –0.51; 95% CI = –1.29 to 0.28; pES = 0.204) (Table 2) or specific ADHD (SMD = 0.05; 95% CI = –0.32 to 0.42; pES = 0.773) (Table 3)/ASD cases (SMD = –0.97; 95% CI = –2.54 to 0.60; pES = 0.224) (Table 4), IGFBP-3 levels were not found to be significantly altered when compared to HCs.
The difference in the concentration of leptin between NDD patients and HCs was evaluated by 17 studies that included 24 datasets (Supplementary Table 1). Pooled analysis uncovered no significant disparities in levels of leptin between NDD patients and HCs (SMD = 0.10; 95% CI = –0.33 to 0.53; pES = 0.645) (Table 2; Fig. 5). However, subgroup analysis showed leptin levels were significantly increased in male (SMD = 0.74; 95% CI = 0.10 to 1.38; pES = 0.023), normal weight (SMD = 0.80; 95% CI = 0.007 to 1.60; pES = 0.048), mixed-age (SMD = 0.53; 95% CI = 0.02 to 1.04; pES = 0.042) NDDs when compared to HCs (Table 2).
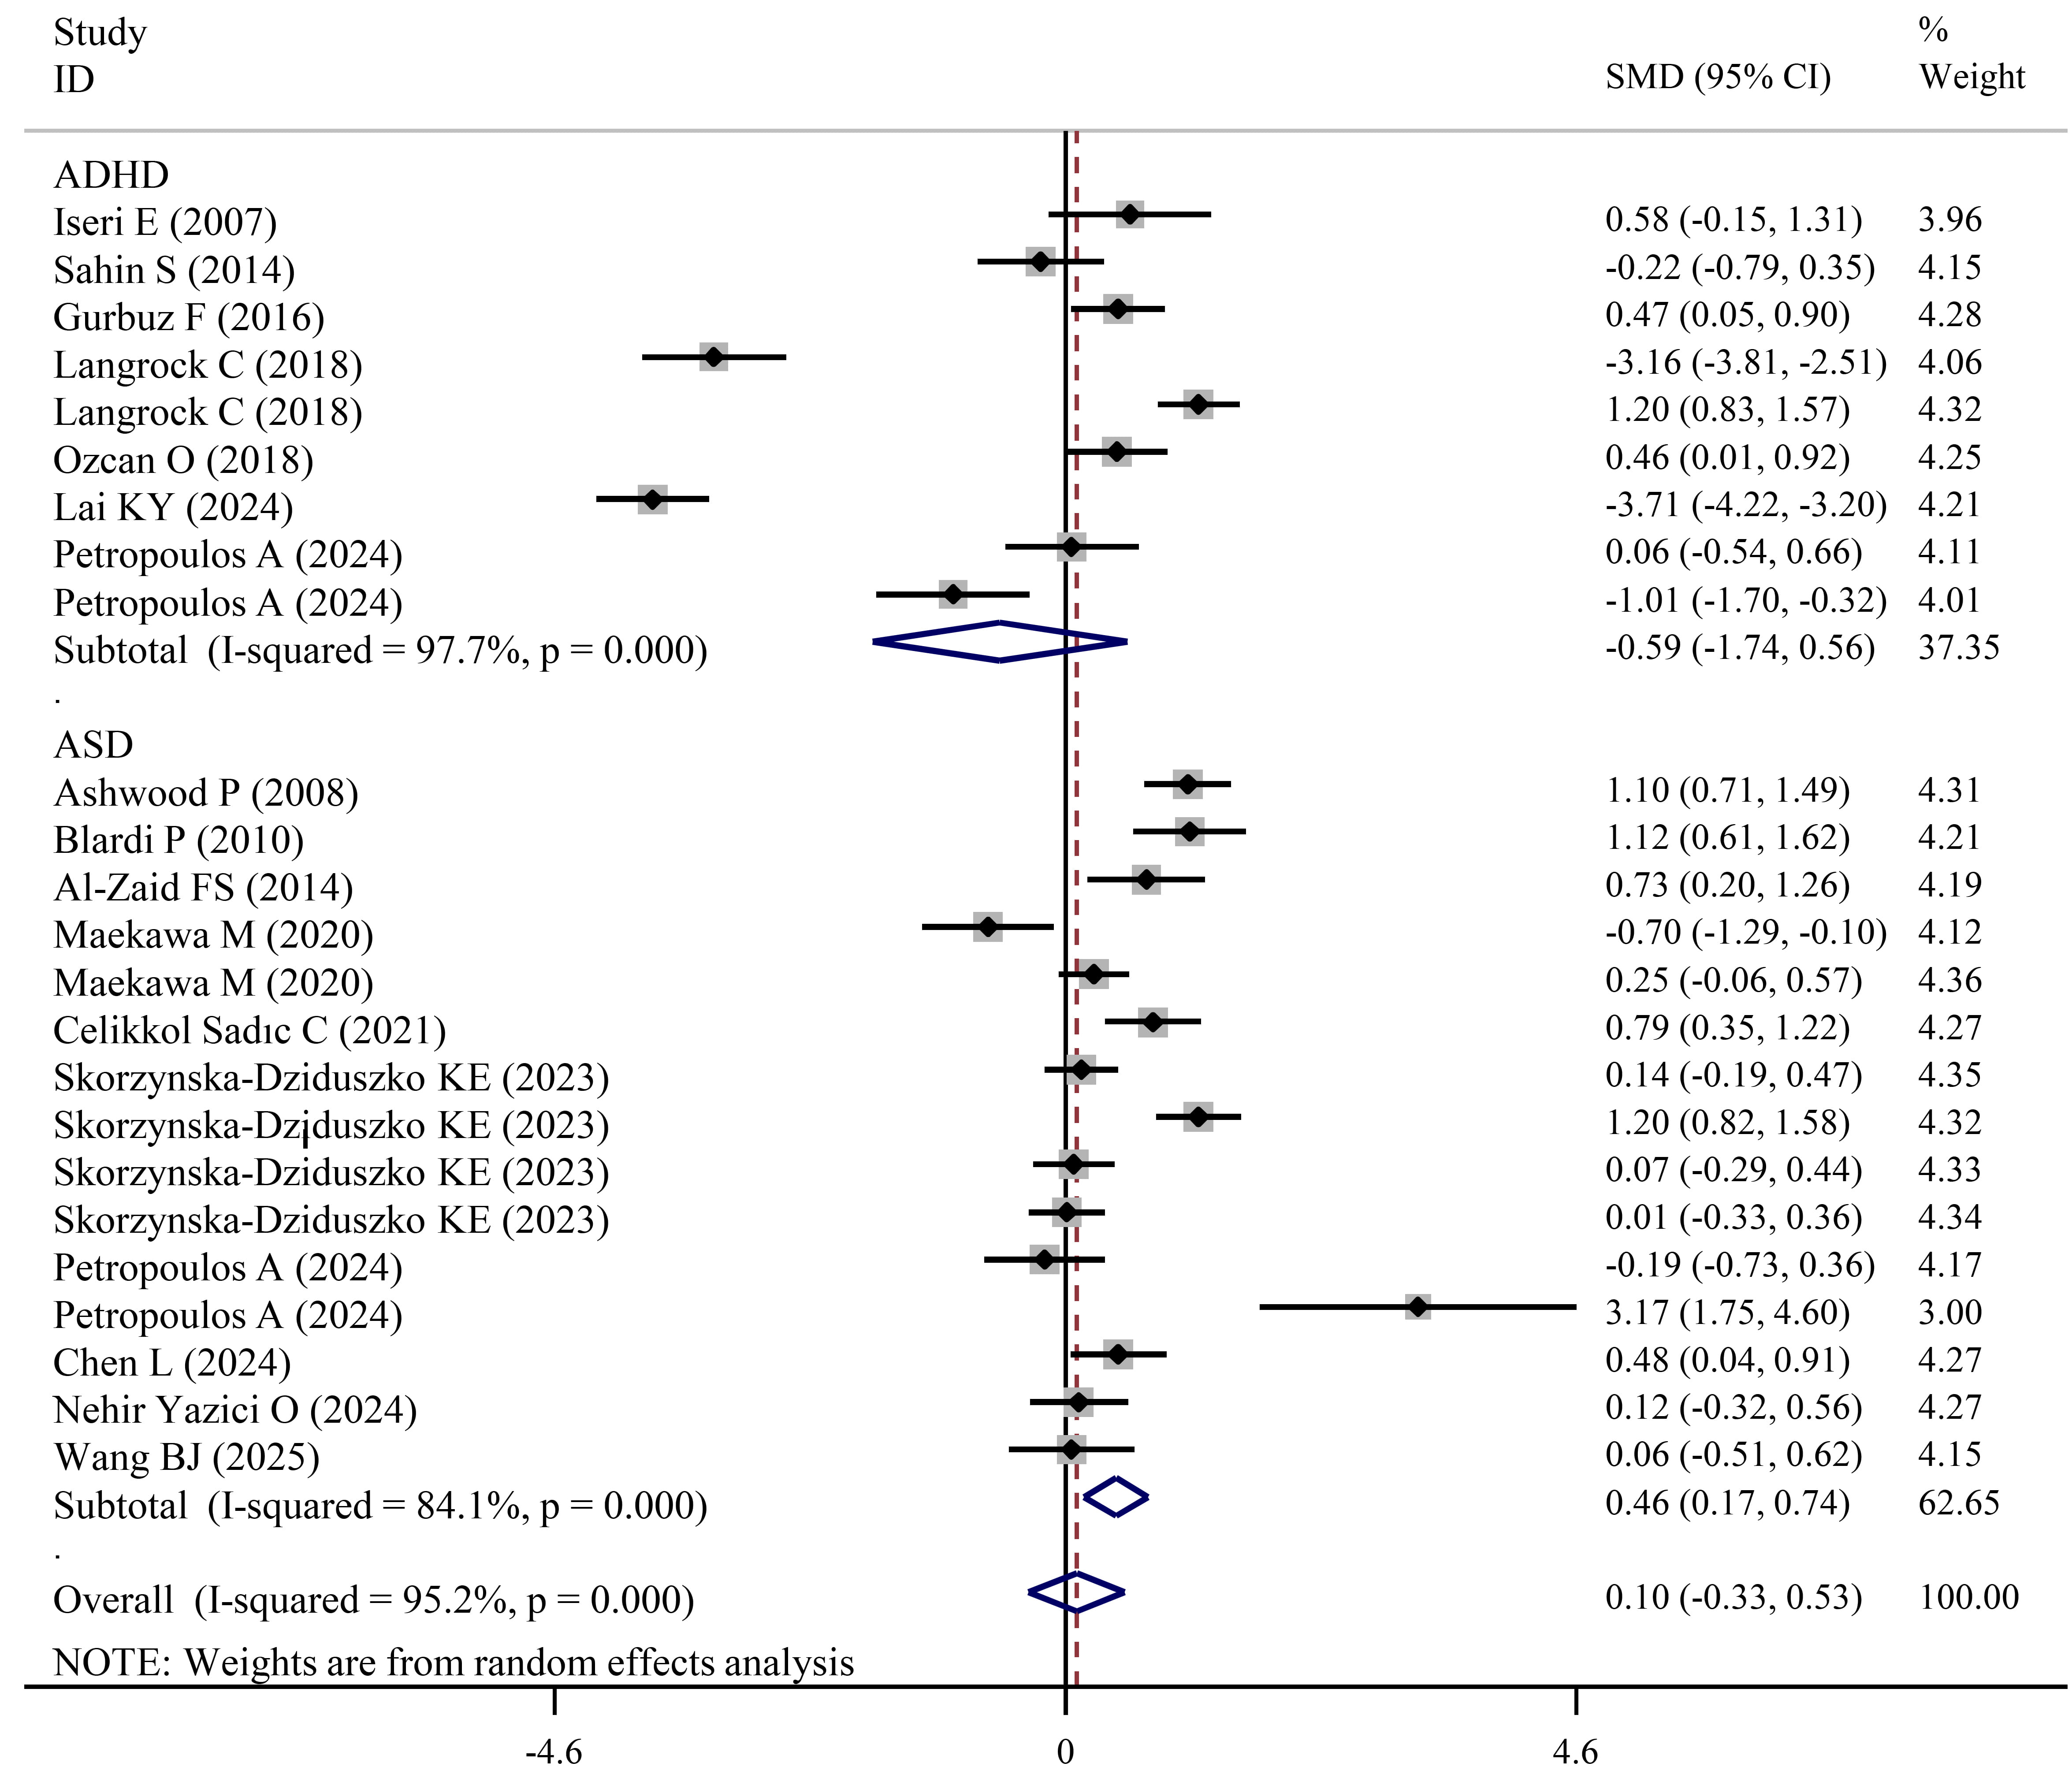 Fig. 5.
Forest plots showing significantly higher leptin levels in ASD patients than in HCs.
Independent meta-analysis for ADHD cases did not detect significant changes in levels of leptin regardless of pooled or subgroup analysis (Table 3; Fig. 5). However, compared with HCs, leptin levels were significantly increased in ASD patients (SMD = 0.46; 95% CI = 0.17 to 0.74; pES = 0.002) (Table 4; Fig. 5). Subgroup analysis of studies with male (SMD = 1.03, pES = 0.049), mixed-sex (SMD = 0.35, pES = 0.044), a single-center design (SMD = 0.4, pES = 0.006), children (SMD = 0.46, pES = 0.016), mixed-age (SMD = 0.78, pES = 0.015) and mixed-weight (SMD = 0.51, pES = 0.006) cases also confirmed significantly high levels of leptin in ASD cases (Table 4).
Seven studies investigated levels of ghrelin in NDD patients and HCs (Supplementary Table 1). The meta-analysis of these studies found no significant difference in ghrelin levels between the two groups. Subgroup analysis observed a significant increase in ghrelin levels in male NDD patients relative to HCs, although the p-value was approximately 0.05 (SMD = 1.03; 95% CI = 0.01 to 2.04; pES = 0.047) (Table 2). Non-significant results were also detected during independent meta-analysis of ADHD (Table 3) and ASD cases (Table 4).
Nine studies with ten datasets examined levels of adiponectin in NDD patients and HCs (Supplementary Table 1), which were used for the meta-analysis. Results showed adiponectin levels were not significantly changed in total NDD patients (Table 2), ADHD (Table 3) and ASD (Table 4) patients when compared to HCs. Subgroup analysis also obtained non-significant results for all cases.
Egger’s linear regression test was used to determine the PB for each variable.
As shown in Tables 2,3,4, there was evidence of PB for analysis of FT4 in total
NDD patients (pPB
Sensitivity analyses showed that by individually excluding the studies in a series of leave-one-out analyses, no significant changes were obtained in the effect estimates for all variables, providing support for the robustness of the meta-analysis conclusion (Fig. 6).
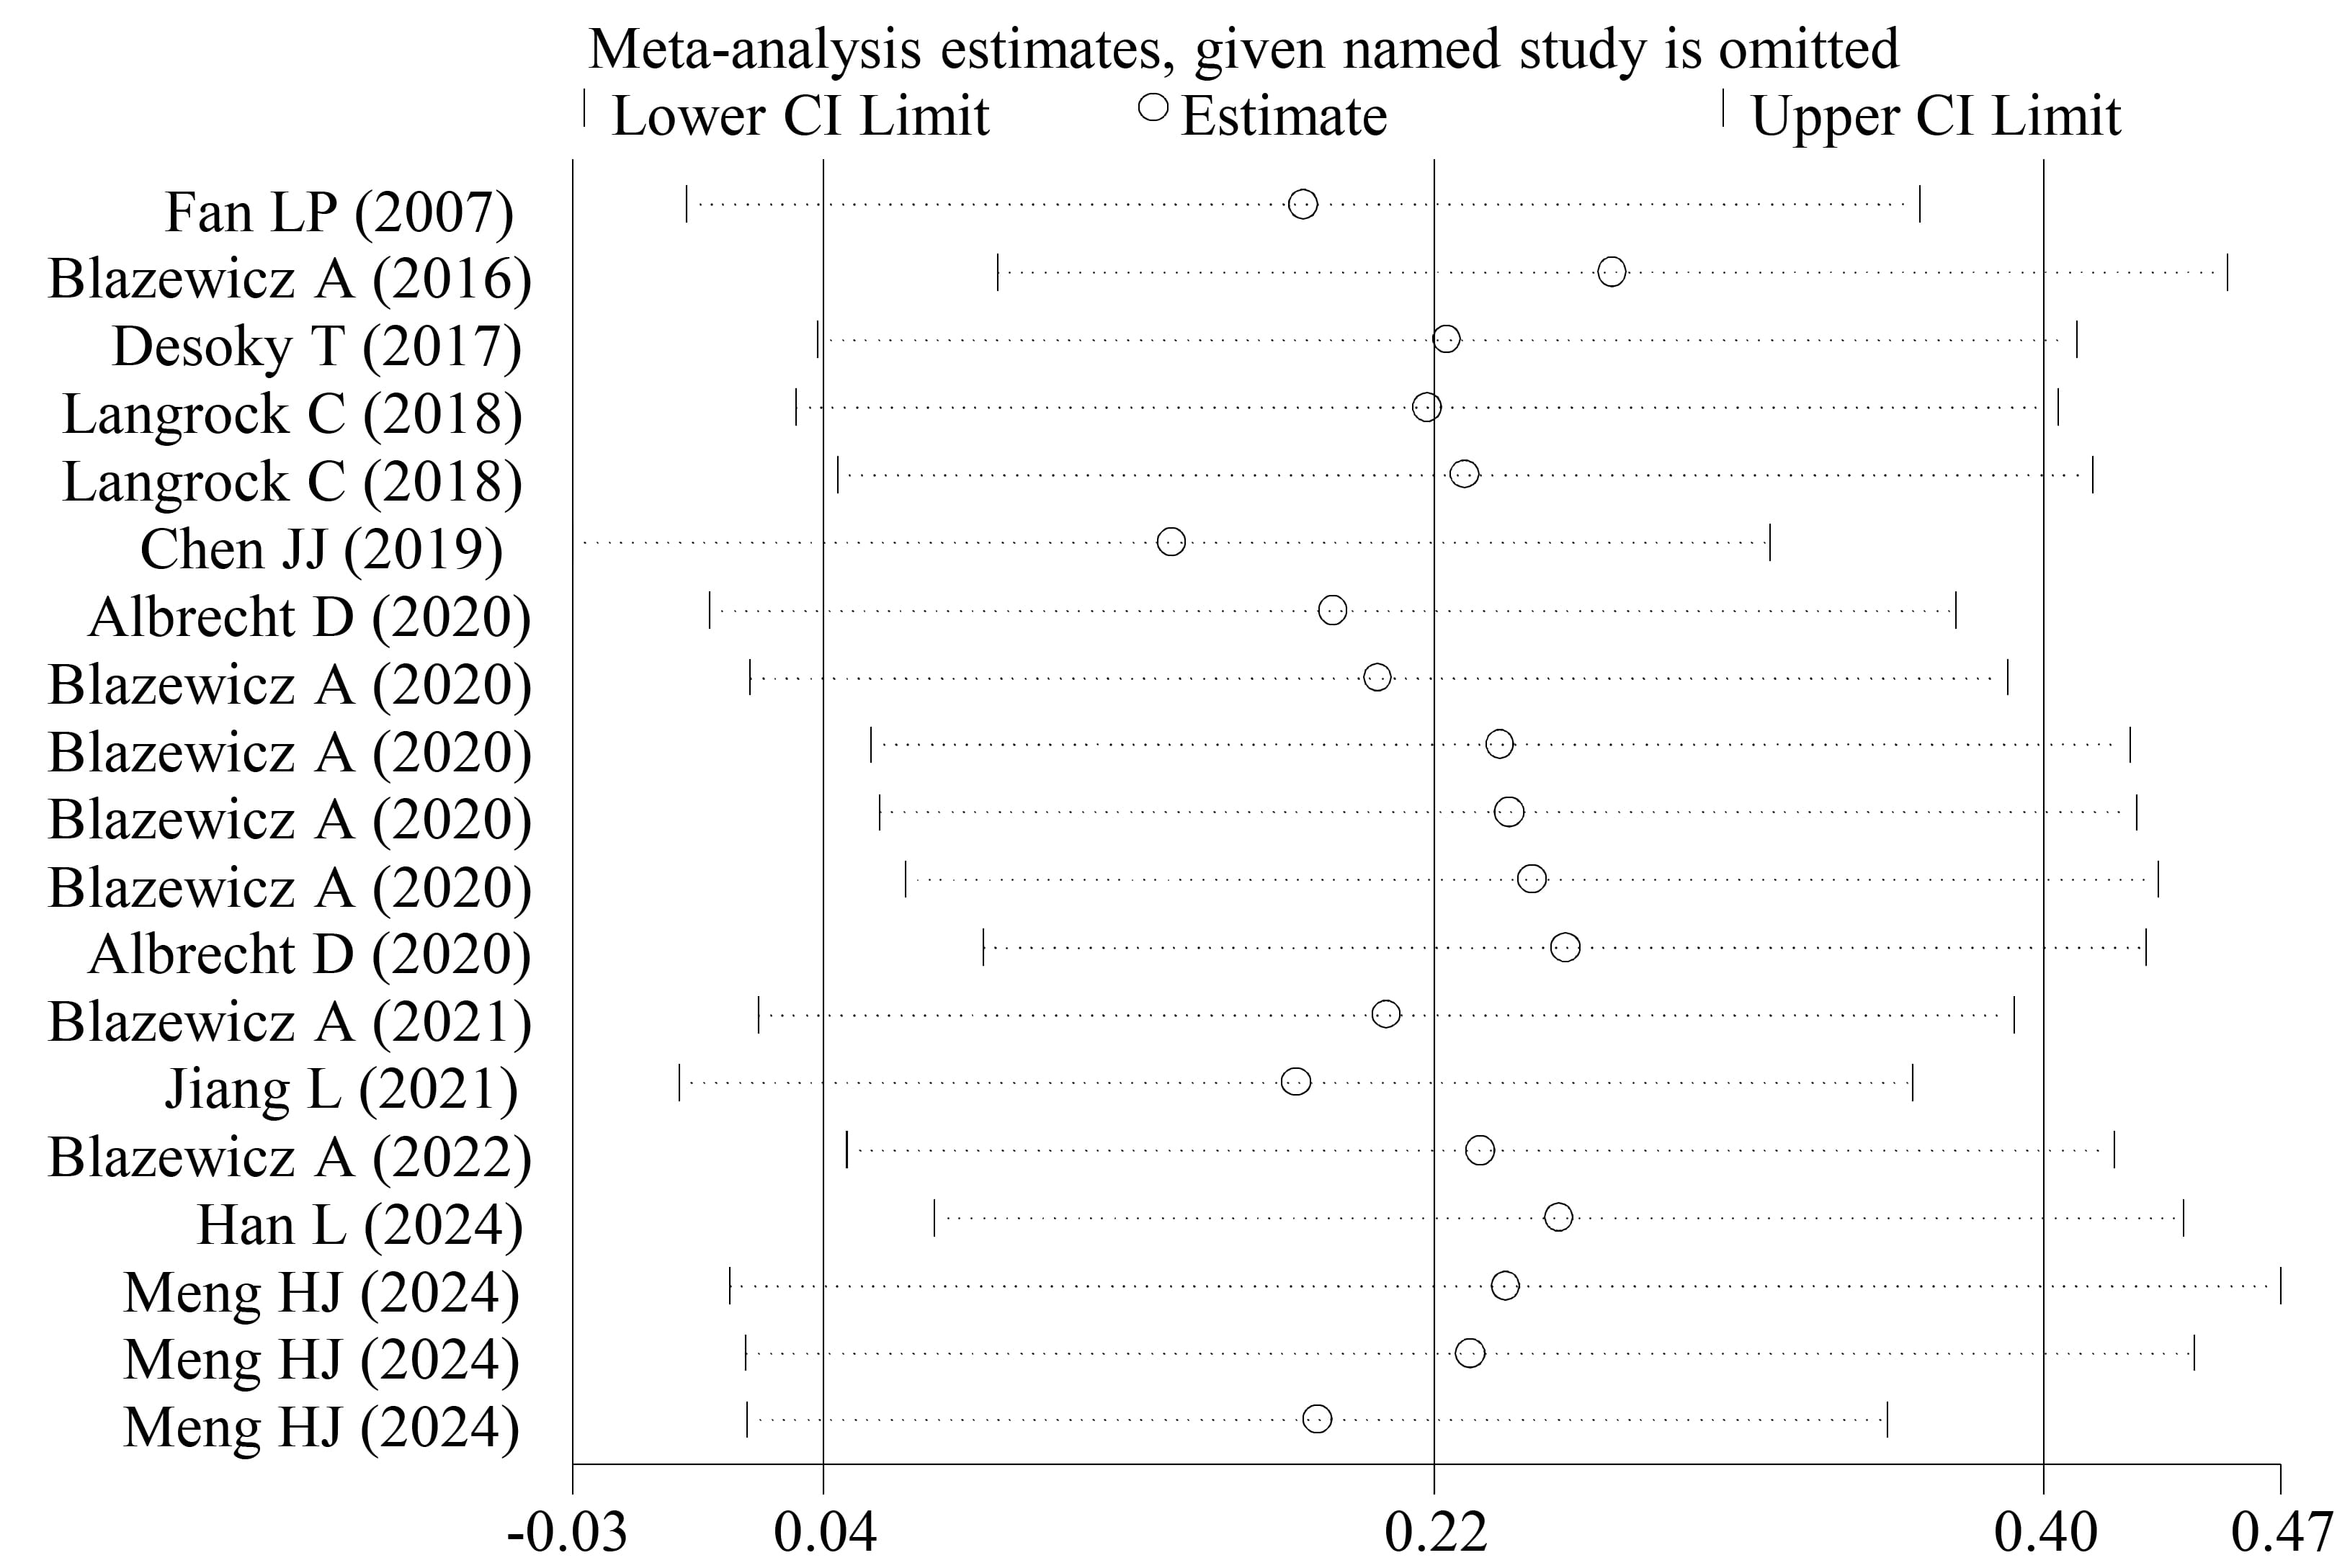 Fig. 6.
Sensitivity analysis for FT3.
Although there was one meta-analysis [13] that explored the link of thyroid hormones in children with the development of NDDs, this study only collected data of FT4 and TSH before August 23, 2024. In the present study, an updated meta-analysis that retrieved studies providing all thyroid hormones (e.g., FT3, FT4, TT3, TT4, TSH and TPO-Ab) in both children and adolescents with NDDs and HCs until March 1, 2025, was performed. Consequently, 26 and 32 datasets were respectively obtained for analysis of FT4 and TSH, the sample size of which was clearly larger than those of the study of Meng et al. [13] (FT4, 9; TSH, 14) and thus, the conclusion may be more certain. As expected, the results of the overall meta-analysis were non-significant for both FT4 (SMD = –0.02; 95% CI = –0.19 to 0.15) and TSH (SMD = –0.08; 95% CI = –0.23 to 0.08), which was somewhat different from those of Meng et al. [13] (FT4: MD = –0.29, 95% CI: –0.50 to –0.09, significant; TSH: MD = –0.07, 95% CI: –0.36 to 0.2, non-significant). However, significantly reduced FT4 was observed in the overall analysis for the ADHD-IT subtype, subgroup analyses for total NDDs/ADHD (multicenter studies) and trim-and-fill adjusted analysis for total NDDs, ADHD and ASD. More interestingly, subgroup analysis revealed lower TSH levels were associated with an increased risk for NDDs diagnosis in children, but not in adolescents. Furthermore, this study, for the first time, identified that compared to HCs, FT3 levels were significantly increased in total NDD and ADHD patients; TT4 levels were significantly decreased in total NDD and ADHD-IT patients; TT3 levels were only elevated in each ADHD subtype (ADHD-IT, ADHD-HIT, ADHD-CT); TPO-Ab levels were significantly increased in total NDD, ADHD and ASD patients. This suggests TSH, FT4 and TPO-Ab may represent potential biomarkers for diagnosing and monitoring children and/or adolescents with various NDDs (both ADHD and ASD), while FT3, TT3 and TT4 may be associated with the development of ADHD.
Thyroid hormones are synthesized and secreted by the thyroid gland. T4 is the
major thyroid hormone secreted by this gland. However, T4 is a biologically
inactive form that must be converted to T3 by iodothyronine deiodinases for
biological activity in target cells. T4 and T3 can be free or bound to plasma
proteins, among which, only FT4 and FT3 are pivotal for physiological functions
[32]. Therefore, theoretically, the importance sequence of thyroid hormones for
the development of diseases may be FT3
Currently, there were no meta-analyses that investigated the association of
IGF-1/IGFBP-3 with NDDs. In this study, six and nine datasets that respectively
analyzed ADHD and ASD were, for the first time, integrated. Although the overall
meta-analysis did not obtain significant differences between NDDs (ADHD and ASD)
and HCs, subgroup analysis indicated significantly reduced IGF-1 levels in CSF
samples of ASD when compared to HCs. IGF-1, a polypeptide hormone, was implicated
in exerting neuro-protective roles in brain cells, including increasing cell
viability and decreasing both pro-apoptotic caspase-3 activity and lactate
dehydrogenase release through activation of the PI3K/AKT-YAP/TAZ cascade [44, 45]. In SHANK3-deficient mice that mimicked ASD, daily intraperitoneal injections
of IGF-1 or its derivative were observed to reverse deficits in hippocampal
Chen et al. [49] used a meta-analysis to explore the changes of
appetite hormones (including leptin, n = 11; ghrelin, n = 2;
adiponectin, n = 7) in children with ASD, with leptin significantly
increased to be identified. However, articles included in the study of Chen
et al. [49] contained data from patients undergoing medical treatment
(methylphenidate or atomoxetine) which may have influenced levels of those
appetite hormones (e.g., increase leptin, ghrelin and adiponectin) [29, 50]. In
this study, all data were collected from drug-naïve patients with ADHD and
ASD. When compared to Chen et al.’ study [49], more or newly published
[51, 52, 53] datasets were included for analysis of ASD (leptin: n = 15;
ghrelin: n = 2; adiponectin: n = 7). Moreover, appetite
hormones were, for the first time, analyzed for ADHD patients (leptin: n
= 9; ghrelin: n = 5; adiponectin: n = 3). Regardless of pooled
or subgroup analysis, no remarkably significant differences in levels of
adiponectin were identified between total NDDs/ADHD/ASD and HCs. Leptin and
ghrelin levels were found to be significantly increased in male NDDs (leptin:
ADHD, n = 2; ASD, n = 4; ghrelin: ADHD, n = 1; ASD,
n = 1); leptin levels were also higher in independent analyses of all
ASD patients and several subgroups. Leptin was originally discovered to be
secreted from adipose tissues into the blood and function as a regulator of
body-weight by reducing food intake and increasing energy expenditure [54].
Administration of recombinant leptin was found to induce weight loss [55, 56],
which was similar to the symptoms of hyperthyroidism (FT3 increase) observed in
ASD and ADHD. Additionally, leptin was previously identified to share structural
and functional similarities with the IL-6 family of cytokines [57]. In
vitro incubation with or in vivo injection of leptin was shown to
stimulate the release of pro-inflammatory mediators (e.g., TNF-
Several limitations should be acknowledged. First, the number of published studies was relatively small for some indicators, such as TPO-Ab, IGFBP3, ghrelin and TG-Ab (only one study; thus, TG-Ab was not analyzed) [13]. Patients in female, adolescent and overweight subgroups were rarely enrolled, which led to the inconclusive ES estimate. Second, the mean and SD were provided for thyroid, growth and appetite hormones in NDDs. Whether the data of these indicators were outside the normal range and the corresponding proportion were very little described [60]. Third, few studies explored the diagnostic efficiency and threshold values of these biomarkers for predicting NDDs by ROC curve analysis and calculation of AUCs [13, 14, 61, 62]. Fourth, few research evaluated clinical factors that affected levels of thyroid, growth and appetite hormones, such as dietary intake, nutrition (albumin) [63], genetics (polymorphism) [14, 24, 62] and environmental factors (perfluoroalkyl substances) [64]. Fifth, there was evidence of significant heterogeneity in the majority of pooled analyses and it could not be eliminated after subgroup analyses. Sixth, considering the possibly same mechanisms for the development of various NDDs, the meta-analysis was firstly performed for the whole NDDs and then each NDD type. However, our research mainly focused on three types (ADHD, ASD and TD) of NDDs because of their high prevalence and relatively numerous studies. No studies reported the association of thyroid, growth and appetite hormones-related indicators with other types of NDDs [e.g., disorder of intellectual development (DID), developmental speech or language disorder (DSD) or developmental learning disorder (DLD)]. Seventh, the diagnosis criterion of NDDs was somewhat different among included studies (different DSM versions or others), which may influence prevalence rates of patients and levels of studied indicators in them. Therefore, more clinical trials with larger sample sizes and detailed information need to be designed to further understand the associations of these thyroid, growth and appetite biomarkers with various NDDs (including ADHD, ASD, TD, DID, DSD and DLD; classified using the same diagnosis criterion), and confirm their diagnostic thresholds and prediction performance before clinical generalization of these results.
The current meta-analysis showed a significant association of the high risk of NDDs in children and adolescents with significantly low levels of FT4, TT4, TSH, IGF-1 and high levels of FT3, TT3, TPO-Ab and leptin in bodily fluids. Thyroid hormones (FT3, FT4, TT3, TT4, TSH and TPO-A) were particularly suited as noninvasive biomarkers for monitoring the development of ADHD, while growth factor IGF-1 and the appetite hormone leptin (in addition to FT4 and TPO-Ab) may serve as more desirable biomarkers for predicting ASD.
NDDs, neurodevelopmental disorders; ADHD, attention deficit hyperactivity disorder; ASD, autism spectrum disorder; TD, tic disorder; OR, odds ratio; CI, confidence interval; THR, thyroid hormone receptor; FT3, free triiodothyronine; FT4, free thyroxine; TT3, total triiodothyronine; TT4, total thyroxine; TSH, thyroid stimulating hormone; TPO-Ab, thyroid peroxidase antibody; TG-Ab, thyroglobulin antibody; ROC, receiver operating characteristic; AUC, an area under the ROC curve; IGF-1, insulin-like growth factor-1; IGFBP-3, IGF-binding protein 3; PRISMA, Preferred Reporting Items for Systematic Reviews and Meta-Analyses; CSF, cerebrospinal fluid; NOS, Newcastle-Ottawa Scale; SMD, standardized mean difference; ES, effect size; H, heterogeneity; HC, healthy controls; DSM, diagnostic and statistical manual of mental disorders; ADI-R, autism diagnostic interview-revised; ADOS, autism diagnostic observation schedule; CARS, childhood autism rating scale; K-SADS-PL, kiddie schedule for affective disorders and schizophrenia of school-age children-present and lifetime version; DBDRS, diagnostic interview and disruptive behavior disorder rating scale; ICD-10, international statistical classification of diseases and related health problems 10th revision; CCMD, Chinese classification of mental disorders; ADH-IT, ADHD-predominantly inattentive type; ADHD-HIT, ADHD-the predominantly hyperactive/impulsive type; ADHD-CT, ADHD-combined type.
The data used for meta-analysis in the study are displayed in Supplementary Table 1.
HW: Data curation, Formal analysis, Writing — original draft. KH: Data curation, Formal analysis, Writing — original draft. LZP: Conceptualization, Methodology, Supervision, Writing — review & editing. XCX: Conceptualization, Supervision, Writing — review & editing. All authors read and approved the final manuscript. All authors have participated sufficiently in the work and agreed to be accountable for all aspects of the work.
Not applicable.
Not applicable.
This research received no external funding.
The authors declare no conflict of interest.
Supplementary material associated with this article can be found, in the online version, at https://doi.org/10.31083/JIN39816.
References
Publisher’s Note: IMR Press stays neutral with regard to jurisdictional claims in published maps and institutional affiliations.