1. Introduction
Alzheimer’s disease (AD) is a typical form of dementia familiar to the public
for which aging is the primary risk factor. Longer life expectancies increase the
risk of people suffering from AD [1]. Alzheimer’s patients typically encounter
memory deficits and reduced cognitive abilities alongside other complications,
with the chronic nature of their condition creating escalating burdens for family
systems and society at large [2]. Hence, the development of efficient therapies
for AD has become a pressing necessity. Pathologically, AD is distinguished from
other forms of dementia by the appearance of Amyloid-beta (A) plaques and neurofibrillary tangles (NFTs) [3], which are considered the cornerstone of its pathogenesis.
Despite the approval of lecanemab, a new monoclonal antibody that targets
A elimination, by the Food and Drug Administration earlier this year
[4], advancements in drug development focused on A and NFTs have
continued to progress at a sluggish pace over recent decades [5]. Therefore,
other important factors are also involved in AD progression.
The central role of glial cell-driven neuroinflammation in Alzheimer’s
pathogenesis is gaining growing recognition. A positron emission tomography (PET)
imaging study has demonstrated that neuroinflammatory processes initiate at
preclinical stages, preceding A plaque deposition—a finding
replicated in multiple transgenic rodent models [6]. Longitudinal observations
reveal sustained activation of microglial cells in AD-affected brains [7]. A
systematic review documented altered expression of inflammatory biomarkers in
both central nervous system (CNS) and peripheral compartments, corroborating the systemic inflammatory
phenotype of AD [8]. Mechanistically, A accumulation promotes
neuroinflammatory responses marked by cytokine secretion and activation of
canonical signaling pathways including nuclear factor kappa-light-chain-enhancer of activated B cells (NF-B) and mitogen-activated protein kinase (MAPK) [9]. Moreover, the
heightened neuroinflammation fosters the production of additional A
plaques, leading to a vicious circle [10]. Neflamapimod, a selective inhibitor of
p38 MAPK pathway, was confirmed to dampen biomarkers of synaptic impairment in
the cerebrospinal fluid in a phase 2 clinical trial, which deserves further
clinical trials before its application [11]. Thus, focusing on neuroinflammation
may offer a potential pathway for the creation of therapeutic agents to tackle
AD.
Due to their abundant sources and excellent safety profile, natural products and
their derivatives have garnered increasing attention in the field of drug
development [12]. In addition, their diverse and complex chemical structures may
be sued to develop multi-target drugs [13]. For example, ferulic acid protected
the hippocampal capillaries, lessened A aggregation, and improved memory
deficits in Mo/HuAPP695swe (APP)/PS1-dE9 (PS1) mice [14], which also regulated
oxidative stress and inflammation. Rubiadin (RB) is an anthraquinone compound
that mainly originates from the root of Rubia cordifolia Linn., an ancient
medicinal plant found in Ayurveda [15]. RB has been documented to exhibit a broad
spectrum of pharmacological activities, such as anticancer, anti-osteoporotic,
hepatoprotective, antidiabetic, antioxidant, antifungal, and anti-inflammatory
effects [16]. In particular, 500 mg of the RB suspension improved epileptic
seizures caused by maximal electric shock and pentylene tetrazole, indicating its
neuroprotective effects. However, no studies have explored whether RB plays a
neuroprotective role in AD-related rodent or cell models.
This study systematically evaluated the neuroprotective efficacy of RB in
Alzheimer’s disease using transgenic APP/PS1 mice and
A1–42-challenged N2a cells. Behavioral assessments including
Morris water maze (MWM), step-down/step-through passive avoidance tasks, and
novel object recognition (NOR) were employed to characterize memory improvement
following RB administration. Amyloid plaque burden in APP/PS1 mouse brains was
quantified via immunohistochemical staining, while inflammatory marker expression
was analyzed using western blot techniques. To validate in vitro
neuroprotection, an A1–42-exposed N2a cell model was established,
with cytoprotective effects evaluated through cell viability assays, western blot
analysis, and immunofluorescence microscopy. Collectively, these findings
contribute preclinical evidence supporting RB’s therapeutic potential and
facilitate translational research toward AD treatment development.
2. Materials and Methods
2.1 Animals
Twenty APP/PS1 mice (8-month-old, 44–50 g) and ten wild-type (WT) littermate
mice (8-month-old, 38–44 g) were provided by Liaoning Changsheng Biotechnology
Co., Ltd. (Benxi, Liaoning, China). All mice stayed in the SPF-level laboratory,
where each mouse lived in a single cage with sufficient water and food. 10 WT
mice were included in the WT group (n = 10). All APP/PS1 mice were randomly and
equally divided into the APP/PS1 group and RB-treated APP/PS1 group (n = 10).
Mice in the WT and APP/PS1 group were given normal saline (0.9%) orally every
day, while the RB-treated APP/PS1 mice were treated with 20 mg/kg RB (117-02-2,
Chengdu Herbpurify Co., Ltd., Chengdu, Sichuan, China) through the same way. The
intragastric administration dose was 0.1 mL/10 g, which means 0.1 mL was given
for every 10 g of mouse body weight. The whole agent treatment lasted for 8 weeks
and behavioral tests began since the 6th week. Subsequently, the mice were
intraperitoneally injected with 150 mg/kg of pentobarbital (P3761, Sigma-Aldrich, Shanghai, China) sodium and their brain samples were procured for subsequent experimental
analysis. Animal experiments were approved by Institutional Animal Care, use
Committee of Jilin University (SY202103007), and the date (10-03-2021) of this
approval. All procedures were in accordance with ARRIVE guidelines.
2.2 MWM Test
The MWM test was conducted on the 36th day. MWM test included 2 parts, the 6-day
navigation test and 1-day probe trial. In the navigation test, mice were put into
the muddy water containing TiO2 in the tank which is 120 cm in diameter.
Their goal was to find the platform, which was hidden 2 cm below the water
surface, within a 60 s time limit. If they were unsuccessful in finding the
platform, they would be guided to it and required to stay there for 30 s to
become familiar with its location. All mice were trained for 5 days and the
formal test was carried out on the 6th day (day 41st since the beginning of agent
treatment). In the probe trial, the platform was taken away, and the mice were
permitted to swim freely in the opaque water for 60 s. A video tracking system
(XR-XM101, Shanghai XinRuan Information Technology Co., Ltd., Shanghai, China) was utilized to record the every-day escape latency, the crossing
numbers in the platform area and time staying in this area in the probe trail,
and their trajectories. Data analysis was conducted by an observer unaware of the
treatment conditions.
2.3 Step-Down and Step-Through Passive Avoidance Test
Since the 44th day, the step-down test was initiated. The equipment consisted of
was a square box (30 cm 30 cm 30 cm), with a circular
platform (8 cm in diameter) positioned at its center (XR-3TB, Shanghai XinRuan
Information Technology Co., Ltd., Shanghai, China). This platform was elevated 4
cm above a grid floor made of stainless steel. As previously mentioned, the mice
were initially placed on the grid floor and subjected to an electric shock,
prompting them to jump onto the platform to evade the stimulus. Following a
24-hour interval, the mice were placed on the platform again. The step-down
latency was determined by measuring the time it took for each mouse to jump back
down to the floor for the first time. A maximum step-through latency of 300 s was
established. During this period, the number of times each mouse jumped down was
recorded as error counts.
The step-through test [17] was performed since day 47th. The apparatus comprised
two identical compartments (each measuring 20 cm 13 cm 12
cm), one illuminated and the other dark (XR-Med, Shanghai XinRuan Information
Technology Co., Ltd.). An automated doorway separated these two
compartments. The floor in the dark compartment was charged with electricity. In
the training session, the mice were first put in the light compartment for 10 s
of free exploration. Later, the door was opened, and driven by their natural
curiosity, the mice were inclined to enter the dark compartment. Upon chamber
entry, the door was shut, and subjects received a 0.2 mA electric foot shock for
5 seconds. After a 48-hour interval, mice were placed back into the light
compartment with the open-door configuration. The latency to enter the dark
compartment was measured as step-through latency, with a 300-second ceiling.
Blinded evaluation was conducted by an observer unaware of treatment assignments.
2.4 NOR Test
On day 50th, NOR test was performed referring to Wan et al. [18].
Initially, the mice were permitted to explore an empty apparatus (50 cm
50 cm) for a period of 5 min to become accustomed to the environment.
Subsequently, two identical objects, labeled A and B, were introduced into the
apparatus, and the mice were given an additional 5 min to explore. Following the
exploration phase, the mice were taken out, and the apparatus was meticulously
cleaned with 75% ethyl alcohol to remove any remaining odors. Then, object B was
substituted with a new object C, which was identical in size and material but
featured a distinct shape. The time spent by the mice exploring each object was
meticulously recorded by a video tracking system (XR-XM101). The recognition index (%) was calculated using
the formula: New object exploration time / (new object exploration time + old
object exploration time) 100%. Data analysis was carried out by an
observer unaware of the treatment groups to maintain objectivity.
2.5 Immunohistochemistry (IHC) Analysis
The general health status of the mice was closely monitored throughout the entire experimental period. Following the completion of behavioral tests, all mice were euthanized using CO2 anesthesia. CO2 was displaced into the euthanasia vessel at a flow rate of 40% of the chamber’s volume per minute. Like Wan et al. [18], after mice were euthanized, the intact brain
samples were fixed with 4% paraformaldehyde (BL539A, biosharp, Hefei, Anhui,
China) instantly followed by dehydration and embedding. The paraffin-embedded
blocks were cut into slices with a thickness of 5 µm. After re-hydrated,
slices were subjected to antigen retrieval at 96 °C. Then slices were sequentially
blocked with 5% bull serum albumin (abs9157, Absin (Shanghai) Bioscience Inc., Ltd., Shanghai, China), incubated with anti-A1–42 (A24422, 1:500,
ABclonal, Wuhan, China) and secondary antibody (E-AB-1003, 1:5000, Elabscience,
Wuhan, Hubei, China), and finally stained with DAB and hematoxylin. All agents
were from IHC detection kit (RK05872, ABclonal). Images were
taken using microscope (BX51, Olympus, Beijing, China). For all antibodies’ information see Supplementary Material-antibodies.
2.6 Cell Culture and Agent Treatment
N2a cells are a neuroblastoma cell line with neuronal and amoeboid stem cell
morphology isolated from brain tissue. Mouse neuroblastoma N2a cells (CL-0168,
Procell, Wuhan, Hubei, China) were maintained in MEM medium (11575032)
supplemented with 10% fetal bovine serum (16140071) and 1%
penicillin-streptomycin solution (15140148). Cells were cultured at 37
°C in a moist environment with 5% CO2. All reagents were offered
by Thermo (Waltham, MA, USA). The N2a cells used in the experiment were
morphologically characterized and confirmed to be free of mycoplasma
contamination.
For the agent treatment in the following experiments, in the 3 h pretreatment
period, N2a cells in the RB-treated groups were treated with 5 µM RB and 20
µM RB, respectively. In both the control and model groups, the medium was
replaced with an equal volume of basic MEM. Then in the 24 h treatment period,
the control group was still treated with basic MEM. The model group was treated
with 5 µM A1–42 (107P64, Taigu Biology, Nanjing, Jiangsu,
China). The RB-treated groups were firstly stimulated with 5 µM
A1–42, then treated with 5 µM RB and 20 µM RB,
respectively.
2.7 Cell Viability Test
This part refers to the previous method [19]. 100 µL of N2a cell
suspension were added in the 96-well plate (5 104/mL) for cell
viability test. Following the pretreatment for 3 h and treatment for 24 h as
described in the “Cell Culture and Agent Treatment” section, 20 µL of a 5
mg/kg MTT (1334GR001, Guangzhou saiquo biotech Co., Ltd., Guangzhou, Guangdong, China) solution was added to the cells. Following incubation at 37 °C
for 4 hours. The crystals were dissolved using dimethyl sulfoxide (D670381, Aladdin,
Shanghai, China) and the absorbance was measured at 490 nm using microplate
reader (Synergy 4, Omega Bio-tek, Inc., Norcross, GA, USA).
2.8 Cell Immunofluorescence
N2a cells were plated at 5 104 cells/mL on glass coverslips to
evaluate nuclear translocation of NF-B following RB treatment. After
completing the pre-treatment and drug administration protocols described in
section 2.6, culture medium was aspirated, and cells were washed with phosphate
buffer. Sample preparation followed the manufacturer’s instructions (SN368, Beyotime, Beijing, China). The
slides were incubated with NF-B (A2547, 1:300, ABclonal) antibodies,
followed by secondary antibody (AS058, 1:500, ABclonal), and
ultimately with DAPI (D1306, Thermofisher, Waltham, MA, USA). Confocal imaging was performed using a Zeiss LSM710 laser
scanning microscope (Shanghai, China). For all antibodies’ information see Supplementary Material-antibodies.
2.9 Western Blot
Brain sample were collected to homogenize (50 Hz, 60 s, twice) and centrifuge
(13,000 rpm, 5 min, twice) to extract protein solution. After treatment was
finished as shown in 2.6, N2a cells were collected to lyse (20 min) and
centrifuge (13,000 rpm, 5 min, twice) to extract protein sample. The whole
process of protein extraction was done under 4 °C. The solution was qualified
using BCA kit (P0012S, beyotime, Shanghai, China). Proteins (30–40 µg)
were separated using sodium dodecyl sulfate polyacrylamide gel electrophoresis
(SDS-PAGE) and then transferred to PVDF membranes. Primary antibodies
anti-IL-1 (A16288, 1:1000, ABclonal), anti-IL-4 (A14660, 1:1000,
ABclonal), anti-IL-6 (A0286, 1:1000, ABclonal), anti-TNF- (A11534,
1:1000, ABclonal), anti-p-inhibitor of kappa B kinase (IKK) (AP0546, 1:1000,
ABclonal), anti-IKK (A2062, 1:3000, ABclonal), anti-p-inhibitor of
NF-B (IB) (AP0614, 1:500, ABclonal), anti-IB
(A11397, 1:1000, ABclonal), anti-p-nuclear factor kappa-B (NF-B)
(AP0123, 1:400, ABclonal), anti-NF-B (A2547, 1:1000, ABclonal),
anti-p-Tau (bs-2392R, 1:2000, Bioss, Beijing, China) and anti-GAPDH (A19056,
1:5000, ABclonal) were used to incubate membranes at 4 °C overnight. The membranes
were subsequently washed and incubated with goat anti-rabbit immunoglobulin G
(IgG) (AS058, 1:10,000, ABclonal) at 4 °C for 4 hours. After incubation,
membranes were washed again and analyzed by gel imager (GenoSens 2150, Beijing,
China). For all antibodies’ information see Supplementary Material-antibodies.
2.10 Statistical Analysis
Semi-quantitative analysis of immunohistochemical staining and western blot
results was performed using ImageJ software (1.8.0.345, Bethesda, MD, USA). GraphPad Prism 9
(GraphPad Software, Inc., San Diego, CA, USA) was utilized to generate bar charts. Statistical comparisons
among WT, APP/PS1, and RB-treated APP/PS1 groups were conducted with BONC DSS
Statistics 25 software (Business-intelligence of Oriental Nations Co., Ltd., Beijing, China), presenting data as mean
(standard error of the mean) SEM. The normality of the behavioral data was
assessed using the Shapiro-Wilk test, and non-parametric statistical analysis was
conducted via the Kruskal-Wallis H test due to potential deviations from normal
distribution. For the comparison of multiple groups in the other data, one-way
ANOVA was performed, followed by Least Significant Difference (LSD) post hoc analysis. Statistical significance
was determined at p 0.05. For original data see Supplementary Material-Original data.
3. Results
3.1 RB Ameliorated Memory Loss and Learning Ability of APP/PS1 Mice
MWM is widely utilized to evaluate spatial memory and learning capacities in
rodent models [20]. Representative swimming trajectories on day 6 are presented
in Fig. 1A. During the initial navigation session, no significant differences in
platform localization time were observed among WT, APP/PS1, and APP/PS1 + RB
groups (Fig. 1B). Following repeated training, RB-treated APP/PS1 mice
demonstrated reduced search times compared to untreated counterparts (Fig. 1B).
Notably, APP/PS1 mice displayed more disorganized swimming patterns compared to
RB-treated animals. Statistical analysis revealed that RB administration
significantly decreased escape latency during formal navigation testing in
APP/PS1 mice (p 0.01) (Fig. 1C). Probe trial results showed distinct
trajectory patterns (Fig. 1D), with APP/PS1 mice spending significantly less time
in the target quadrant compared to WT controls (p 0.01) (Fig. 1E).
Additionally, platform crossings were reduced in APP/PS1 mice (p 0.001) (Fig. 1F). Significantly, RB intervention enhanced both target area
occupancy and platform crossing frequency in APP/PS1 mice (p 0.05,
Fig. 1E,F). Passive avoidance testing (step-down/step-through) evaluated memory
function following RB administration. Step-down test results showed APP/PS1 mice
had shorter latency to step down compared to WT controls (p 0.001,
Fig. 1G). Additionally, APP/PS1 mice made more jump-down attempts within 5
minutes despite repeated shocks (p 0.001, Fig. 1H). RB treatment
reversed these impairments in APP/PS1 mice, increasing step-down latency
(p 0.001, Fig. 1G) and reducing jump-down frequency (p 0.01, Fig. 1H). Step-through test results revealed RB-treated mice had
significantly longer latency to enter the dark compartment compared to untreated
APP/PS1 mice (p 0.001, Fig. 1I). NOR test results showed APP/PS1
mice had impaired non-spatial recognition memory, reflected by reduced
recognition index, which was improved by RB treatment (p 0.05, Fig. 1J). These data indicate RB improves both spatial and non-spatial memory in
APP/PS1 mice.
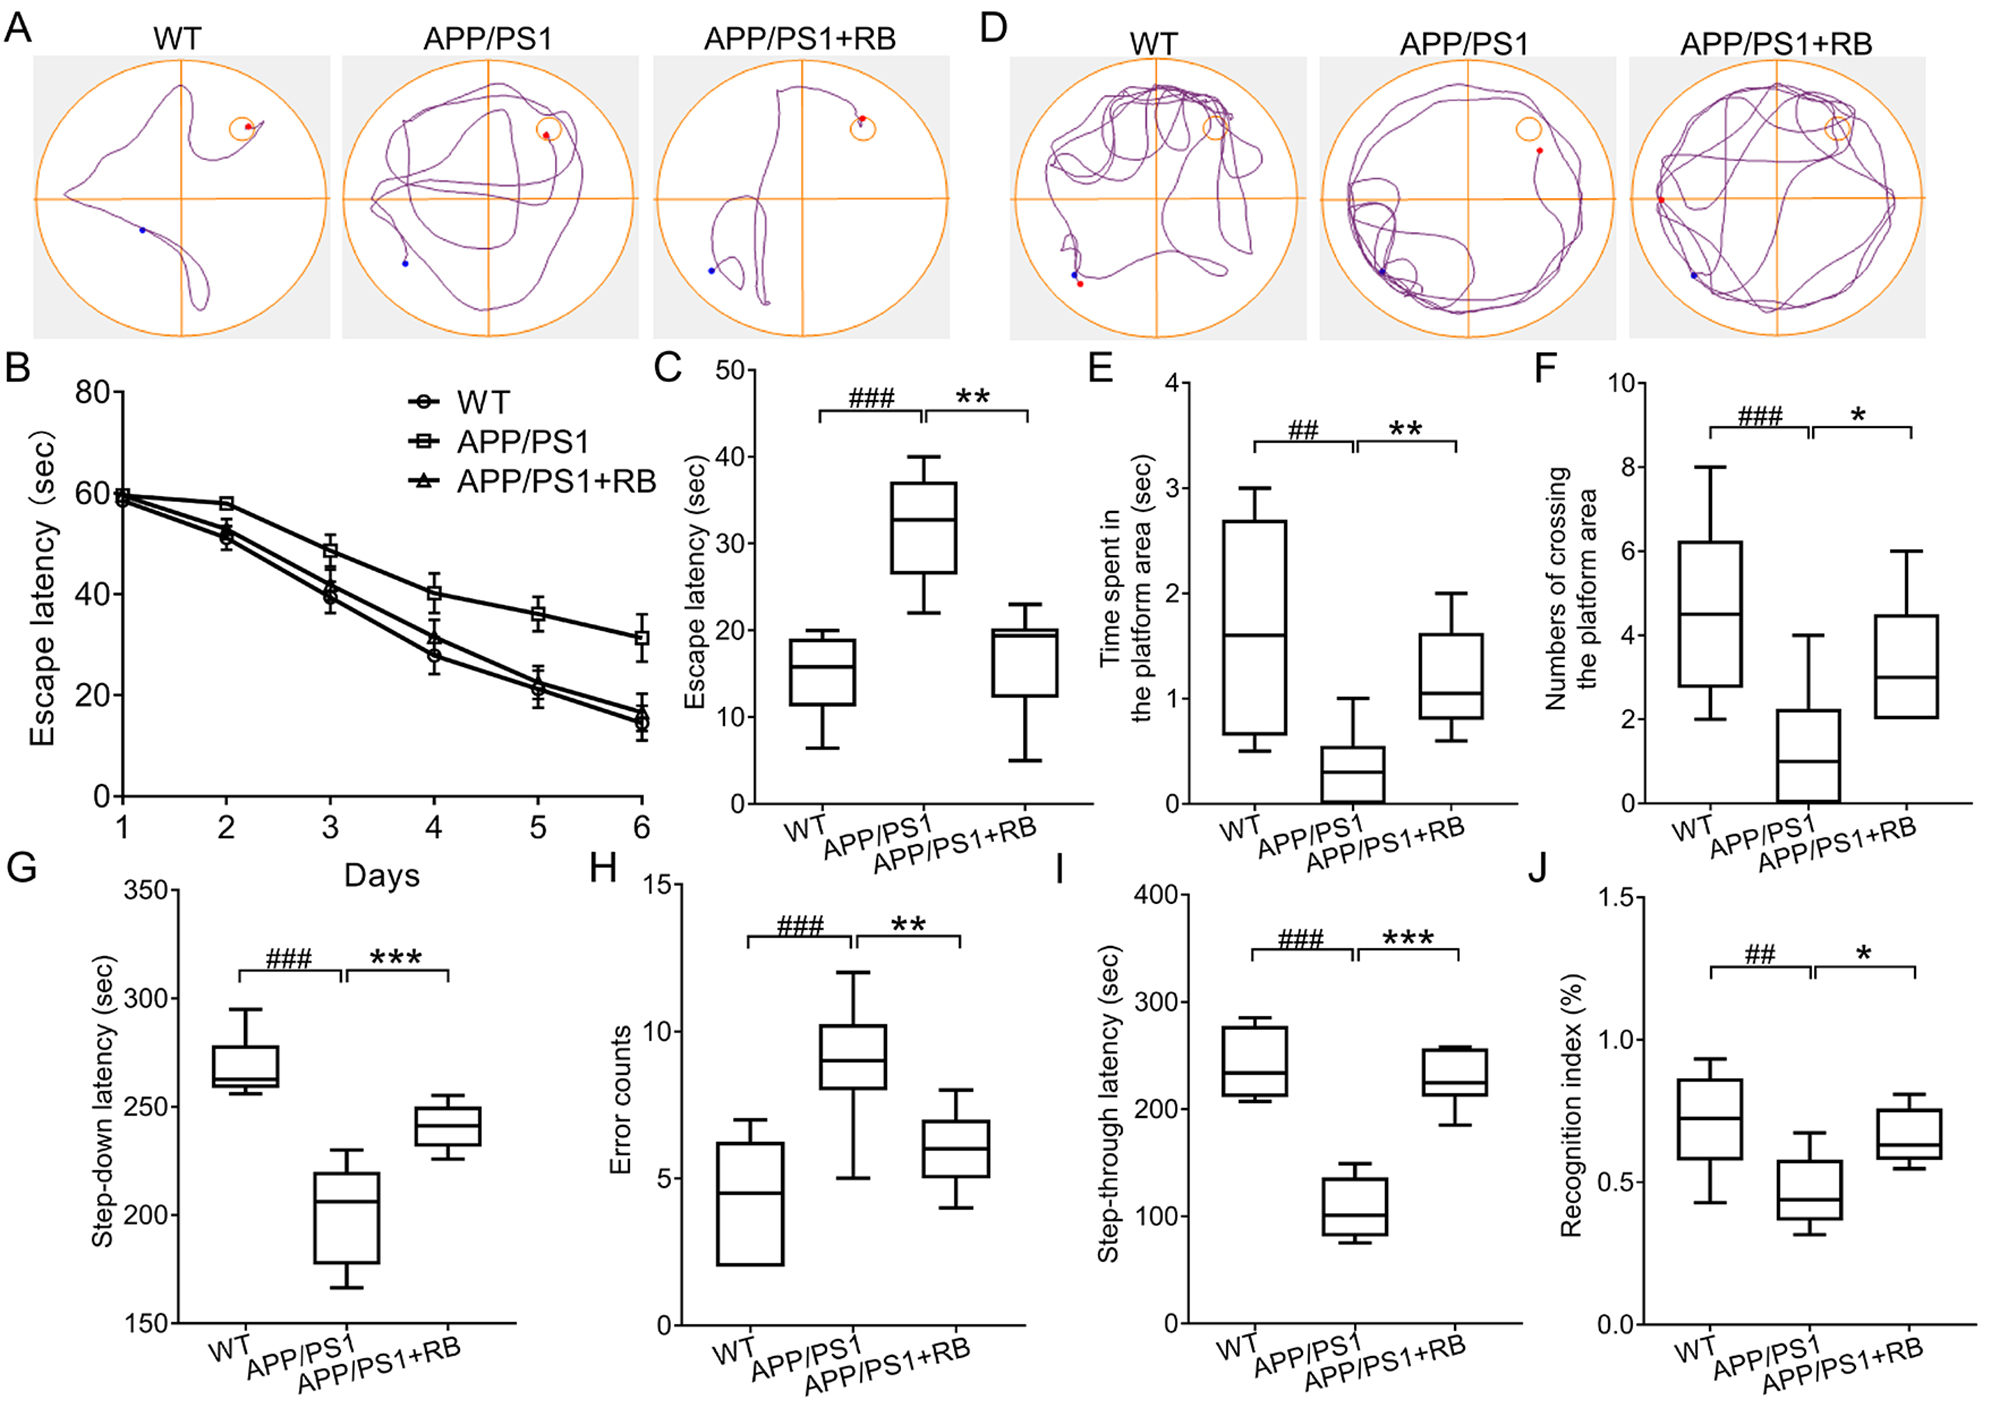 Fig. 1.
RB ameliorated memory loss and learning ability of
APP/PS1 mice. (A) Represent trajectories on day 6 in the navigation test
(n = 10). The escape latency (B) from day 1 to day 6 and (C) on day 6 in
the navigation part of MWM test (n = 10). (D) Represent trajectories of
mice in the probe trial (n = 10). RB increased (E) time that mice spent
in the platform area and (F) numbers of crossing the platform area (n =
10). (G,H) RB improved the memory performance of APP/PS1 mice in the step-down
passive avoidance test (n = 10). (I) RB extended the step-through
latency of APP/PS1 mice in the step-through passive avoidance test (n =
10). (J) RB enhanced the recognition index of APP/PS1 mice in the NOR test
(n = 10). ##p 0.01, ###p 0.001
compared with WT mice; *p 0.05, **p 0.01, and
***p 0.001 compared with APP/PS1 mice. RB, rubiadin; APP/PS1,
Mo/HuAPP695swe/PS1-dE9; MWM, Morris water maze; NOR, novel object recognition;
WT, wild-type.
3.2 RB Decreased Cerebral A Deposition and
Neuroinflammation of APP/PS1 Mice
To investigate the pathological effects of RB treatment in APP/PS1 mice,
immunohistochemical staining was performed to assess A plaque
distribution in cortical and hippocampal areas. Fig. 2 demonstrates that WT mice
had almost no A plaques, whereas APP/PS1 mice exhibited substantial
A accumulation in these regions (p 0.01). Strikingly,
RB-treated APP/PS1 mice showed significant reductions in A plaque
formation in both the cortex and hippocampus (p 0.05, Fig. 2A–C).
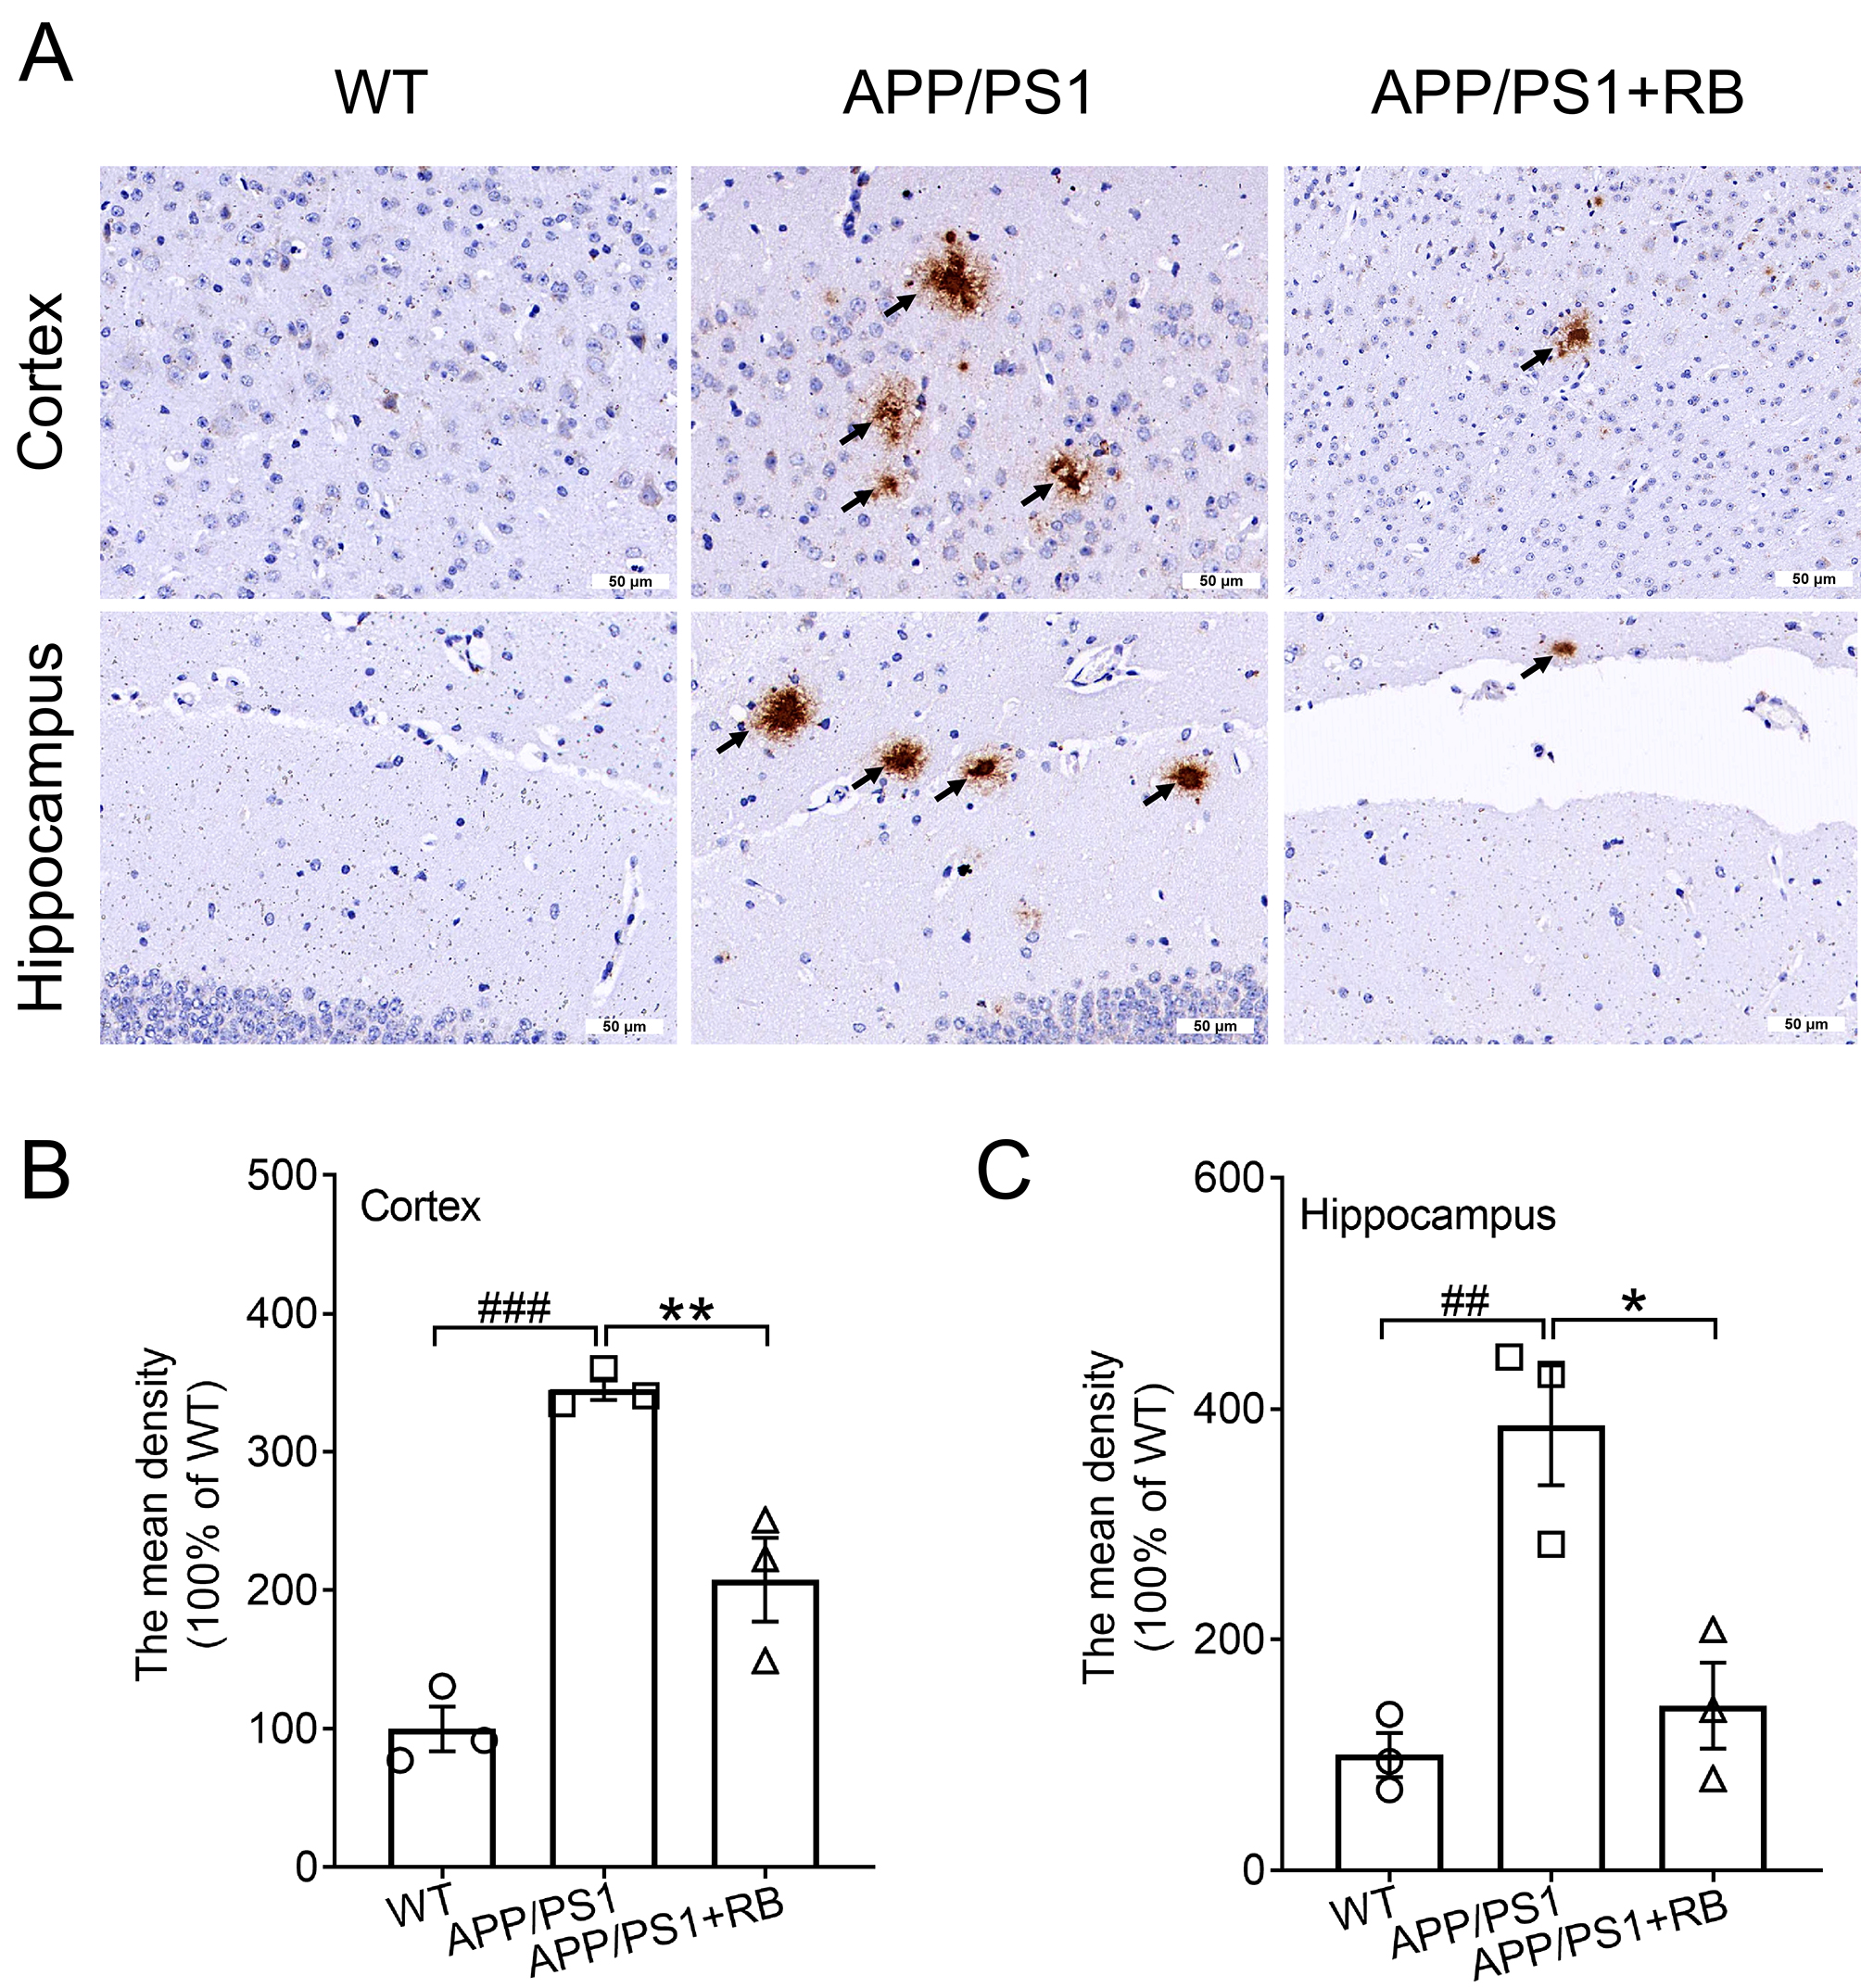 Fig. 2.
RB inhibited deposition of A plaques in the
brains of APP/PS1 mice. Example images showing A deposition in the (A)
cortex and (C) hippocampus of APP/PS1 mice (n = 3). Scale bar is equal
to 50 µm for 40 and 200 magnification,
respectively. The arrows indicate the A plaques in the cortex and
hippocampus. Semi-quantitative analysis of A deposition in the (B)
cortex and (C) hippocampus of APP/PS1 mice, expressed as the fold change relative
to the WT group (n = 3). Results were presented as means SEM.
##p 0.01 and ###p 0.001 compared with WT
mice; *p 0.05 and **p 0.01 compared with APP/PS1 mice.
SEM, standard error of the mean.
Subsequently, western blot analysis was performed to assess inflammatory markers
in APP/PS1 mouse brains. Compared to WT mice, APP/PS1 mice showed increased
pro-inflammatory cytokines (IL-1, IL-6, TNF-) and decreased
anti-inflammatory cytokine IL-4 (p 0.001, Fig. 3A–E). RB treatment
significantly reversed these alterations, reducing pro-inflammatory markers and
increasing IL-4 levels (p 0.05, Fig. 3A–E), confirming its
anti-inflammatory properties. Phosphorylation of NF-B signaling
components was also evaluated. RB treatment significantly suppressed
phosphorylation of IKK, IB, and NF-B in APP/PS1 mice compared
to untreated controls (p 0.001, Fig. 3F–I), further supporting its
role in mitigating neuroinflammation. For all original WB figures in Fig. 3A,F,
see the Supplementary Material-original images of WB.
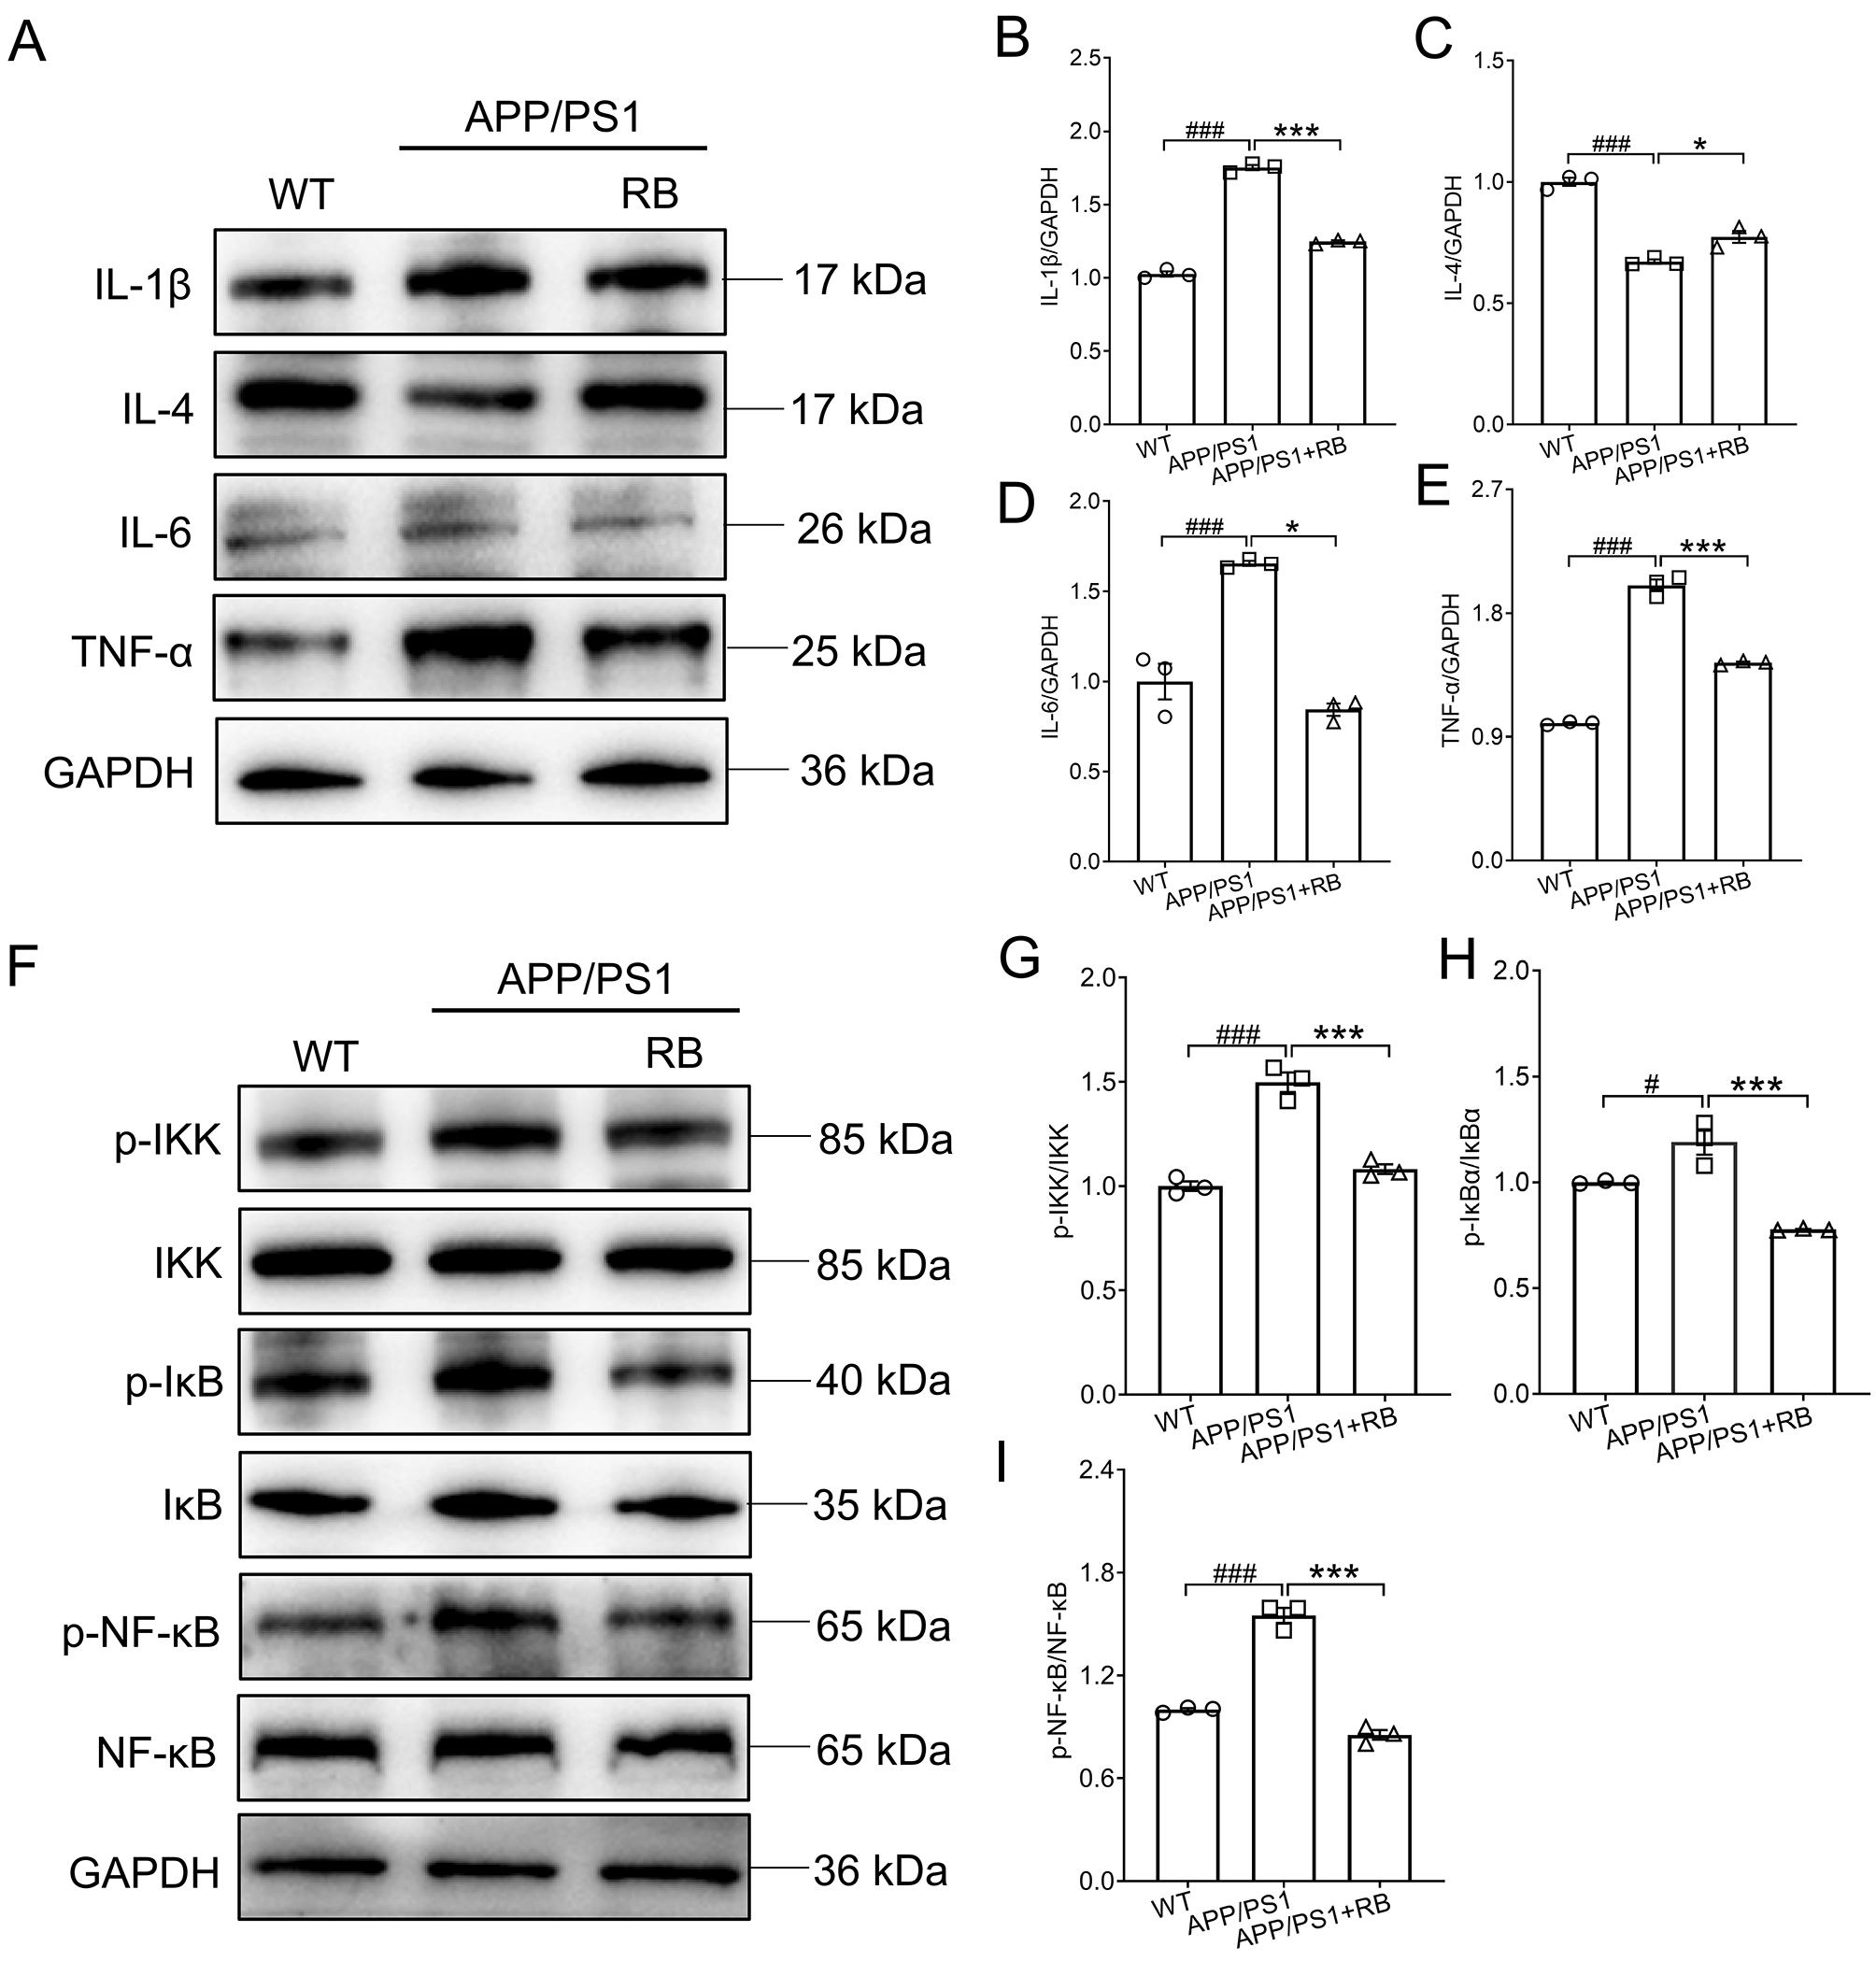 Fig. 3.
RB suppressed neuroinflammation in the brains of
APP/PS1 mice. (A) RB blocked the production of IL-1, IL-6, and
TNF- and promoted that of IL-4 in the brains of APP/PS1 mice
(n = 3). Semi-quantitative analysis of (B) IL-1, (C) IL-4, (D)
IL-6, and (E) TNF- which was normalized to GAPDH and presented as the
fold of the WT group (n = 3). (F) RB blunted the activation of
IKK/IB/NF-B in the brains of APP/PS1 mice (n = 3).
Semi-quantitative analysis of (G) p-IKK, (H) p-IB, and (I)
p-NF-B which was normalized to their total proteins and presented as
the fold of the WT group (n = 3). Results were presented as means
SEM. #p 0.05 and ###p 0.001
compared with WT mice; *p 0.05 and ***p 0.001 compared
with APP/PS1 mice. IKK, inhibitor of kappa B kinase; IB, inhibitor of
NF-B; NF-B, p-nuclear factor kappa-B.
3.3 RB Protected N2a Cells Against A1–42-Induced Cell
Damage and Inflammation
To further validate RB’s neuroprotective effects in vitro, N2a cells
were challenged with A1–42. RB treatment significantly improved
cell viability in A1–42-exposed N2a cells (p 0.001,
Fig. 4A), indicating its cytoprotective potential. Compared to control cells,
A1–42 exposure induced marked increases in pro-inflammatory
cytokines (IL-1, IL-6, TNF-) and decreases in
anti-inflammatory IL-4 (p 0.01, Fig. 4B–F), reflecting inflammatory
activation. For all original WB figures in Fig. 4B, see the Supplementary Material-original images of WB. Concurrently, A1–42 treatment significantly upregulated
phosphorylated Tau protein expression in N2a cells (p 0.001, Fig. 4G). RB administration effectively restored cytokine balance and reduced p-Tau
levels in A1–42-treated cells (p 0.01, Fig. 4B–G),
demonstrating its inhibitory effects on inflammatory responses.
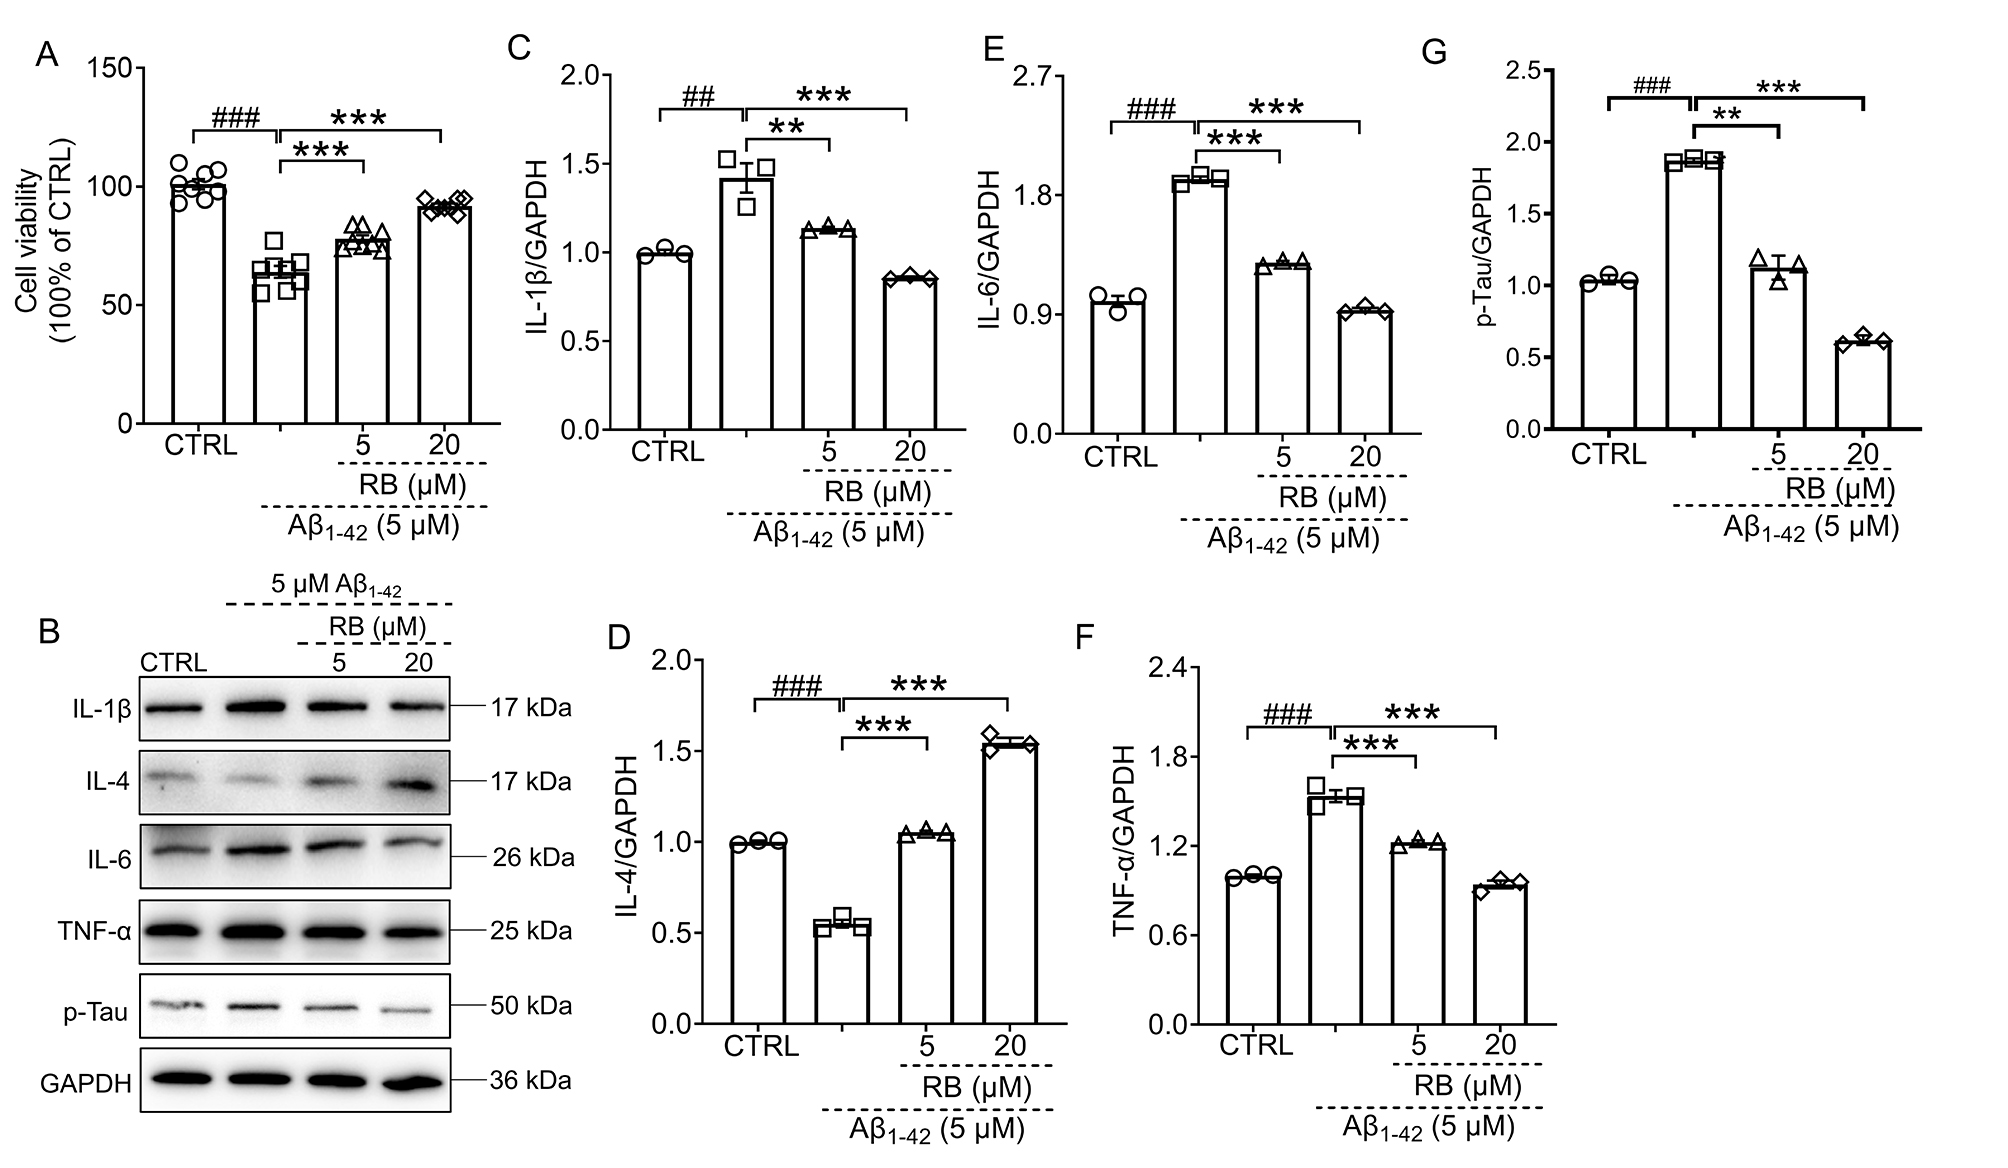 Fig. 4.
RB protected N2a cells against A1–42-induced cell
damage and inflammation. (A) RB improved cell viability of
A1–42-induced N2a cells (n = 8). (B) RB suppressed the
production of IL-1, IL-6, TNF- and p-Tau and increased that of
IL-4 in the A1–42-exposed N2a cells (n = 3).
Semi-quantitative analysis of (C) IL-1, (D) IL-4, (E) IL-6, (F)
TNF- and (G) p-Tau was conducted, with expression levels normalized to
GAPDH and expressed as fold change relative to the CTRL N2a group (n =
3). Results were presented as means SEM. ##p 0.01 and
###p 0.001 compared with CTRL N2a cells; **p 0.01 and ***p 0.001 compared with A1–42-exposed N2a
cells.
3.4 RB Blunted the Activation of IKK/IB/NF-B
Pathway
To further confirm whether NF-B was regulated in
A1–42-treated N2a cells, the phosphorylation of NF-B and
its upstream IKK and IB was detected through western blot. Once the N2a
cells were treated with 5 µM A1–42, the expression levels of
phosphorylated IKK, IB, and NF-B were all augmented
(p 0.001) (Fig. 5A–D). For all original WB figures in Fig. 5A, see
the Supplementary Material-original images of WB. Both 5 µM and 20 µM RB,
significantly inhibited the activation of IKK, IB, and NF-B
(p 0.05) (Fig. 5A–D). The red fluorescence–labeled NF-B
and the blue fluorescence–labeled nucleus overlapped much more in the
A1–42-exposed N2a cells than in the CTRL N2a cells, a phenomenon
that was finally reversed by RB treatment (Fig. 5E). Consequently, these findings
indicate that RB suppresses inflammation in A1–42-treated N2a
cells, which may partially involve the IKK/IB/NF-B pathway (Fig. 5F).
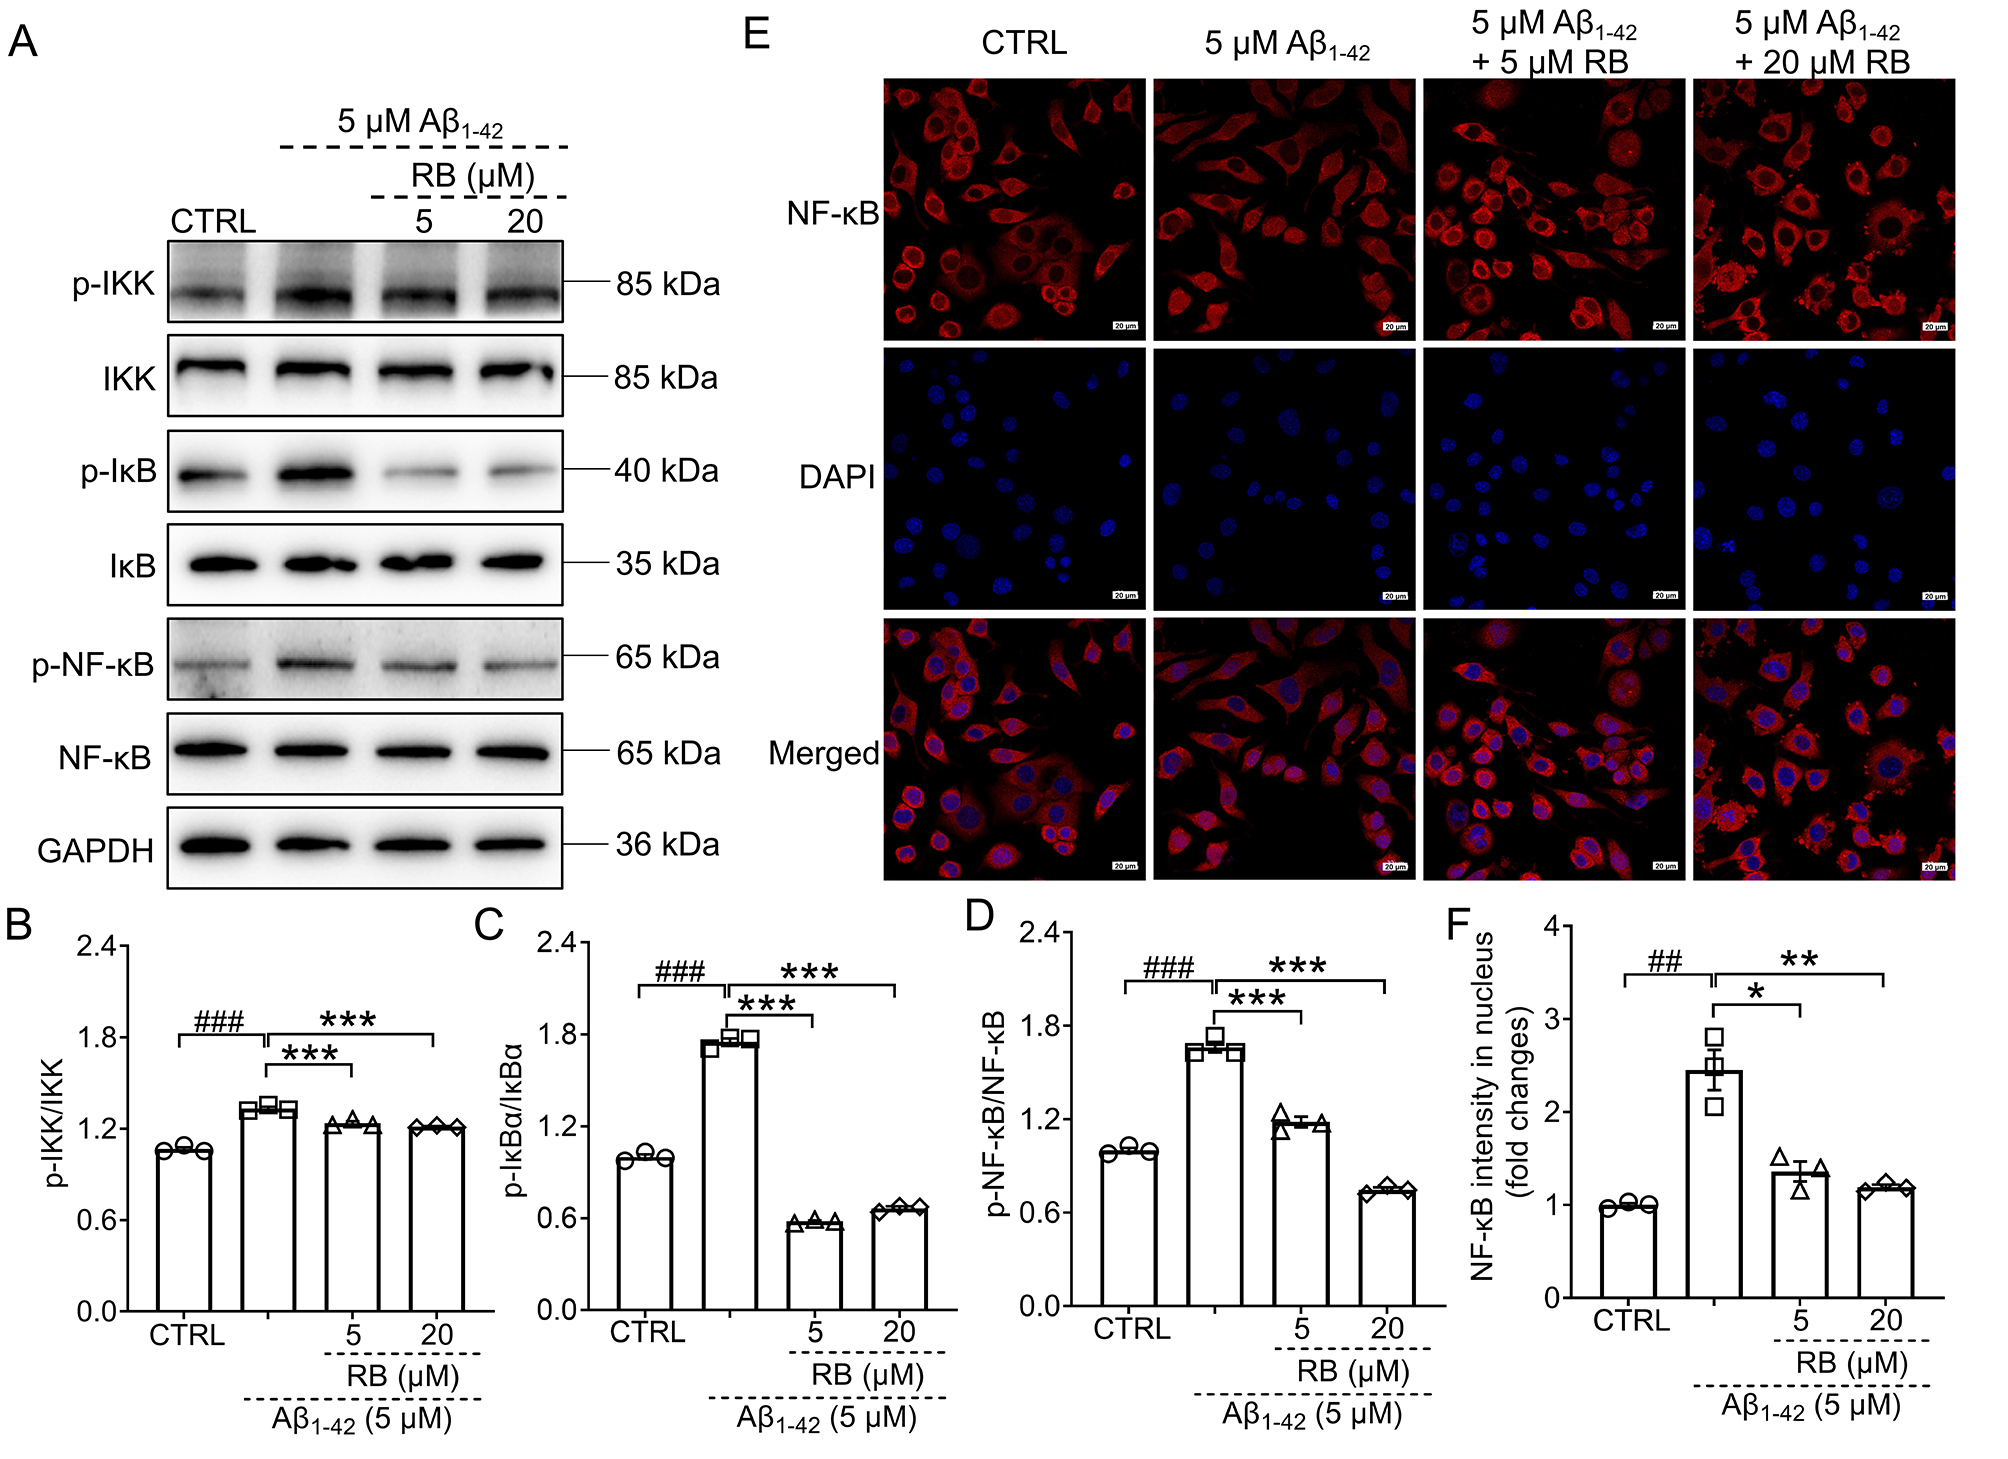 Fig. 5.
RB inhibited the activation of IKK/IB/NF-B
pathway in the A1–42-induced N2a cells. (A) RB down-regulated the
phosphorylation of IKK, IB, and NF-B in the
A1–42-treated N2a cells (n = 3). Semi-quantitative
analysis of (B) p-IKK, (C) p-IB, and (D) p-NF-B which was
normalized to their total proteins and presented as the fold of the control (CTRL) N2a
group (n = 3). (E) RB prevented the nuclear translocation of
NF-B in N2a cells treated with A1–42 (n = 3).
(F) The quantitative results of the nuclear fluorescence intensity of
NF-B were presented (n = 3). Scale bar is equal to 20 µm
for 400 magnification. Results were presented as means SEM.
##p 0.01 and ###p 0.001 compared with
CTRL N2a cells; *p 0.05, **p 0.01 and ***p 0.001 compared with A1–42-exposed N2a cells.
4. Discussion
This study investigated the neuroprotective effects of RB on AD using in
vivo and in vitro models. Memory deficits and learning dysfunction in
the APP/PS1 mice were improved by RB on behavioral tests. RB treatment
significantly inhibited the cerebral expression of A through IHC
analysis. Moreover, neuroinflammation was blunted in the brains of the RB-treated
mice based on decreases in pro-inflammatory cytokines, increases in IL-4, and the
inactivation of IKK/IB/NF-B. Subsequently, the efficacy of RB
in reducing inflammation was further confirmed in N2a cells exposed to
A1–42. RB treatment enhanced the viability of N2a cells exposed to
A1–42, while also modulating the secretion of inflammatory
cytokines and suppressing IKK/IB/NF-B pathway activation, as
well as NF-B nuclear transfer. These findings indicate that RB
alleviates symptoms similar to those of AD, which may act by inhibiting
neuroinflammation. Our study provides an experimental basis for future
pharmacological studies of RB, thus facilitating the development of AD drugs from
natural products.
Natural products have great potential for use in drug development. On one hand,
they can be directly developed as new drugs to treat diseases. However, their
novel and diverse structures make them lead compounds in the synthesis of more
effective drugs [21]. The development of AD drugs has extensively explored
natural products and their derivatives [13]. Emodin belongs to the anthraquinone
family and inhibits the amyloidogenic pathway, NFT formation, neuroinflammation,
and oxidative stress in AD-related cells and rodent models [22]. RB is also an
anthraquinone compound whose antioxidant, anti-inflammatory, antidiabetic, and
hepatoprotective effects have already been identified. RB is also a component of
the traditional Chinese medicine Jia-Jian-Di-Huang-Yin-Zi decoction, which
enhances behavioral performance and protects dopaminergic neurons from apoptosis
in Parkinson’s disease. Our study focused solely on the RB monomer as the subject
of investigation. RB treatment significantly improved spatial memory in APP/PS1
mice, as evidenced by reduced escape latency during MWM navigation and increased
target quadrant occupancy/crossings during probe trials. Non-spatial memory
enhancements were observed through multiple behavioral measures: increased
latency in step-down/step-through tests, reduced errors in passive avoidance, and
elevated recognition indices in NOR. Pathologically, RB attenuated A
plaque deposition in AD-relevant brain regions. In vitro experiments
confirmed RB protected N2a cells against A1–42-induced
cytotoxicity, supporting its neuroprotective mechanism. These results indicated
that RB relieves AD-like behavioral and pathological symptoms and serves as a
neuroprotective factor in AD.
Inflammatory cytokines play an important role in AD progression. Cerebral
neuronal degeneration in AD is mainly caused by an increase in neuroinflammatory
markers [23]. IL-1 accelerated the apoptosis of hippocampal neurons
treated with A1–42 [24]. Caspase-1 blockade, a key upstream
mediator of IL-1 processing, has been shown to mitigate cognitive
deficits, amyloid- deposition, and neuroinflammation in AD mouse models
[25]. IL-6 is implicated in early amyloid plaque formation and specifically
accumulates within cerebral plaques of AD patients [26]. This cytokine also
promotes tau hyperphosphorylation in hippocampal neurons [27]. Clinically, plasma
IL-6 levels correlate positively with brain inflammation and inversely with
cognitive performance in AD patients [28]. Cerebral IL-6 signaling was further
validated as a mediator of memory impairment in APP/PS1 mice [28]. Elevated
TNF- expression has been confirmed in both blood samples and postmortem
brain tissues of AD patients [29]. After treating AD neurons with TNF-,
researchers detected the formation of abundant protein aggregates which were
composed of A and -synuclein [30]. TNF- and its
receptor regulated neuronal necroptosis as confirmed both in vitro and
in vivo [31]. In a phase II trial, Etanercept, a TNF-
inhibitor, demonstrated favorable safety in 20 AD patients but did not result in
any significant changes in cognitive performance [32]. On the other hand, IL-4
overexpression in the brains of APP/PS1 mice improved AD pathogenesis including
decreased A deposition and gliosis and increased neurogenesis [33]. All
of the above studies imply that it may be effective to alleviate AD by regulating
inflammatory cytokines. In our study, RB reduced the expression levels of
IL-1, IL-6, and TNF- while increasing the expression of IL-4
in both APP/PS1 mice and A1–42-induced N2a cells. These results
indicate that the anti-AD effects of RB might be due to its capacity to reduce
neuroinflammation.
As one of the best-studied pathways, NF-B signaling is involved in
neurodegenerative diseases [34]. For example, nuclear NF-B regulated
-secretase expression at the transcriptional level, accelerating amyloid
precursor protein processing and A expression [35]. NF-B
signaling was also increased in reactive microglia and astrocytes to amplify the
neuroinflammation and aggregate neurodegeneration [36]. Additionally,
NF-B also exerted its function through regulating apolipoprotein E
activity, glutamate excitotoxicity, microRNA expression, and tau pathology [36].
Diverse natural products have demonstrated favorable pharmacological effects for
regulating NF-B in AD. Resveratrol was confirmed to suppress
NF-B and exert neuroprotection in A25-35-induced PC12
cells [37]. Accordingly, in APP/PS1 mice, RB markedly inhibited IKK,
IB, and NF-B phosphorylation. RB also inactivated
IKK/IB/NF-B pathway in A1–42-treated N2a cells
on western blot and suppressed the nuclear translocation of NF-B on an
immunofluorescence analysis. These results were consistent with the inhibition of
neuroinflammation. Therefore, RB attenuated AD pathogenesis, at least in part, by
inhibiting neuroinflammation via the IKK/IB/NF-B pathway.
This study has several limitations. Only the expression profiles of inflammatory
cytokines in APP/PS1 mouse brains were characterized. Neuroinflammation is
primarily regulated by microglial and astrocytic activation [38]. Future studies
will focus on quantifying microglial and astrocytic activation states in APP/PS1
mice to mechanistically validate RB’s anti-inflammatory effects. On the other
hand, based on the diverse pharmacological effects of RB in different disease
models [16] and since AD is also a complex disease influenced by multiple
factors, we will further explore whether RB has any biological activity other
than anti-neuroinflammatory effects in AD models.
Here we discussed the results and how they compare to those of previous studies
and working hypotheses. These findings and their significance should be
considered in a wider context and explored more thoroughly in future studies.


