


 , Semen Kurkin 1,2,3, Larisa Mayorova 1,2,4, Galina Portnova 1,4, Anastasia Kushnir 2,4, Alexander Hramov 1,2,3,*
1 Laboratory for the Study of Tactile Communication, Pushkin State Russian Language Institute, 117485 Moscow, Russia
2 Federal Research and Clinical Center of Intensive Care Medicine and Rehabilitology, 141534 Solnechnogorsk, Russia
3 Baltic Center for Neurotechnology and Artificial Intelligence, Immanuel Kant Baltic Federal University, 236016 Kaliningrad, Russia
4 Institute of Higher Nervous Activity and Neurophysiology of Russian Academy of Science, 117485 Moscow, Russia
Abstract
The significance of tactile stimulation in human social development and personal interaction is well documented; however, the underlying cerebral processes remain under-researched. This study employed functional magnetic resonance imaging (fMRI) to investigate the neural correlates of social touch processing, with a particular focus on the functional connectivity associated with the aftereffects of touch.
A total of 27 experimental subjects were recruited for the study, all of whom underwent a 5-minute calf and foot massage prior to undergoing resting-state fMRI. Additionally, 11 healthy controls participated solely in the resting-state fMRI recording. A functional connectivity network analysis was conducted to examine the alterations in connections between different brain regions following massage.
The findings indicated the involvement of discrete neural networks in the processing of social touch, with notable discrepancies in functional connectivity observed between the experimental and control groups. The study revealed that the control group exhibited a higher degree of connectivity within a subnetwork comprising 25 connections and 23 nodes than the experimental group following the massage intervention. The experimental group showed hypoactivation in this subnetwork following the massage. The left anterior pulvinar thalamus and the right pregenual anterior cingulate cortex, which serve as the key hubs within this subnetwork, exhibited higher clustering and increased node strength in the control group. Relatively small and unequal sample sizes are the limitations of the study that may affect the generalizability of the results.
These findings elucidate the neural underpinnings of tactile experiences and their potential impact on behavior and emotional state. Gaining insight into these mechanisms could inform therapeutic approaches that utilize touch to mitigate stress and enhance mental health. From a practical standpoint, our results have significant implications for the development of sensory stimulation strategies for patients with prolonged disorders of consciousness, sensory loss, autism spectrum disorders, or limited access to tactile interaction in their upper extremities.
Keywords
- neuroscience
- touch processing
- fMRI
- functional connectivity
- affective touch
- massage
- sensorimotor integration
- anterior cingulate cortex
- thalamus
Given the importance of touch in human social development and personal interaction, there has been surprisingly little functional magnetic resonance imaging (fMRI) research on the brain mechanisms involved in the processing of social touch and its associated affective properties. In addition, research on the perception of social touch in the lower extremities of humans has been extremely limited, despite its potential to greatly expand our understanding of the functions of the c-tactile (CT) system [1, 2, 3, 4].
Research shows that when people are touched gently and slowly, especially on their hairy skin, they experience a surge of the hormone oxytocin. This hormone plays a critical role in stress regulation and overall well-being [5]. Simply speaking, gentle, moderate pressure on the skin and slow touch can help reduce stress and have a positive effect on physical and mental health [6, 7]. In particular, massage therapy offers significant benefits as an adjunct treatment for chronic pain and emotional distress, including depression and anxiety. This evidence highlights the potential positive impact of massage therapy in alleviating these conditions and improving overall well-being [8, 9].
In general, the skin serves a dual sensory function, allowing the perception of touch and temperature through specific nerve fibers called A-beta and A-delta fibers, which are responsible for the rapid detection of stimuli and the rapid transmission of information about physical properties. In addition, a separate class of nerve fibers known as CT plays a critical role in transmitting emotional sensations such as dull pain and itch [10, 11, 12]. The sensations perceived through the discriminative and affective pathways engage different neurological mechanisms within the somatosensory and insular cortices, respectively. This differentiation in processing highlights the distinct roles these pathways play in shaping our tactile experiences and the emotional valence associated with them [13]. However, recent studies have uncovered C-tactile afferents that specifically encode the pleasurable aspects of tactile sensation [14, 15].
The existing literature suggests that the process of touch discrimination occurs primarily in the primary and secondary somatosensory cortices, where the majority of A-beta afferents terminate [16, 17, 18]. However, the exact areas of the brain responsible for processing the affective aspect of touch remain unclear. Anecdotal evidence suggests the involvement of the anterior cingulate cortex [19] and the insula [18] in this process, but further research is needed to gain a more definitive understanding of the cerebral areas involved in processing the emotional aspects of tactile sensation. Investigating functional connectivity in the aftereffects of touch is important for several reasons. First, it helps us understand how different areas of the brain communicate and work together to process and integrate information from touch sensations [20]. Second, it allows us to study the neural mechanisms underlying the processing of touch experiences, which can provide insight into the cognitive and emotional aspects of touch processing [21].
It is important to emphasize that the regulation of the CT system response to pleasant social stroking with the hand has undoubtedly received the most attention in existing research [22, 23]. Conversely, the mechanisms of information transmission for CT stimulation from less commonly studied regions of the body, such as the back, abdomen, and legs, have received significantly less research attention.
The present fMRI study aims to investigate the functional connectivity and the neural correlates of the lasting effects of touch in a form of lower limb massage, which may further our understanding of how touch experiences can have lasting effects on our behavior and emotional state. We are trying to identify resting-state brain networks after massage that are different in the experimental group compared to the control group.
27 healthy experimental subjects (EX; 13 male, 14 female) and 11 healthy controls (HC; 5 male, 6 female) participated in the study. Inclusion criteria for participation in the study included age between 20 and 40 years, right-handedness, no history of neurological or psychiatric diseases, no drug use before the study, native Russian speakers, no alcohol consumption for at least 48 hours before the study, no tobacco or caffeine consumption for at least 2 hours before the start of the study, and no use of psychoactive substances. All subjects underwent a clinical examination and resting-state functional magnetic resonance imaging (MRI).
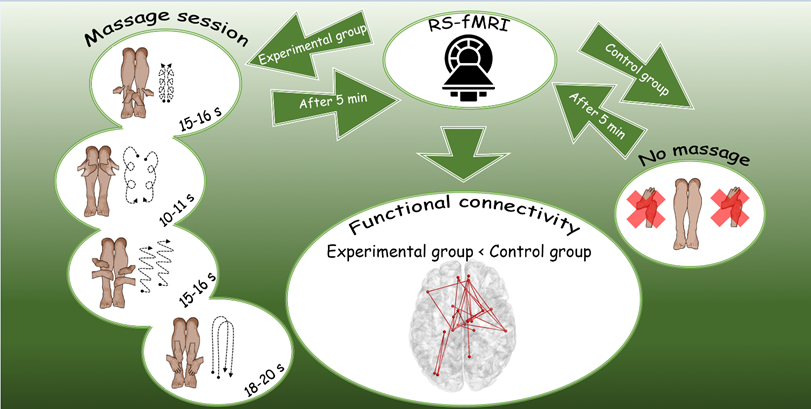
The experiment involved the administration of a 5-minute calf and foot massage, preceded and followed by a rest period, as shown in Fig. 1. Thus, for each participant we had two 8-minute periods of interest: Rest1 and Rest2. In addition, there was a control group in which subjects only lay down in the scanner for 5 minutes instead of receiving a massage. Two resting-state fMRI sessions were acquired for each subject. Each resting-state fMRI session lasted 480 seconds. The massage was performed by two specialists at the same time to rule out any laterality effect.
 Fig. 1.
Design and timeline of the experimental study.
The massage stimulation consisted of four sequential movements described below. The sequence of movements was repeated five times from the first to the fourth. The whole procedure took 5 minutes and a stopwatch was used.
(1) Massage movements with the thumbs from the centre of the leg (margo anterior tibiae) upwards about 2–3 cm and then towards the calf muscle on both sides, with the massage movements directed from the foot to the knee. The pressure is moderate. Duration: 15–16 seconds.
(2) Broad circular movements with the palm of the hand in a clockwise direction from the knee to the foot. The pressure is medium to light. Duration: 10–11 seconds.
(3) Friction movements with the palms of both hands from the foot to the knee and back. The movements are quick, with moderate to strong pressure. Duration: 15–16 seconds.
(4) Broad stroking movements with both palms from the knee to the foot and back. The movement is repeated twice with light pressure. Duration: about 18–20 seconds.
We asked participants to rate the pleasantness of the massage using a scale of 1 to 5, where 1 indicated “unpleasant”, 2 was “more unpleasant than pleasant”, 3 represented “neutral”, 4 stood for “more pleasant than unpleasant”, and 5 signified “pleasant”. The results showed no variation in assessments, as all participants rated the procedures as pleasant. After the study, we conducted additional interviews with the participants about their experience of the massage procedures and invited them to suggest any improvements. The majority (23 subjects) indicated that there was nothing to improve, while a few (4 subjects) mentioned that the MRI setup was a limitation.
Based on these findings, we conclude that the social touch procedure, performed in the form of massage, exhibits characteristics associated with an affective type of touch.
Functional and anatomical images were acquired using a 3.0-T Philips Achieva (Koninklijke Philips NV, Amsterdam, The Netherlands) with a 20-channel head coil. Each functional run consisted of 360 T2-weighted echoplanar images, each resting condition—240 slices. The imaging parameters were 2
The analyzed data were processed using the SPM12 statistical processing package (https://github.com/spm/spm12) [24] running on the MATLAB platform (version 2019b). The preprocessing procedure included motion correction, co-registration, segmentation of the structural data, and normalization to the Montreal Neurological Institute (MNI) standardized space in a typical manner (see Section 2.1.3 in Ref. [25] for details) to ensure consistency across the dataset.
To determine the connectivity between different brain regions, we calculated the blood oxygenation level-dependent (BOLD) time series in 144 different regions (regions of the cerebellum were excluded as they were not relevant to our study) according to the Automated Anatomical Labeling Atlas (AAL3), which is used to standardize and simplify the delineation of brain regions [26]. We chose the AAL atlas because it is widely used in functional network analysis, thus conforming to established standards and facilitating comparability of results across studies [27]. To determine connectivity between different brain regions, we computed and detrended the average time series
To analyze the topology and larger-scale features of the functional network, we examined the following network metrics: node strength (NS), betweenness centrality (BC), eigenvector centrality (EC), clustering coefficient (CC), global and local efficiency which are often used to analyze the features of resting-state fMRI-based brain connectivity [25, 28, 29]. More information on the methods used in this study can be found in the Supplementary Material.
We computed both the distributions of these network metrics across individual nodes and the overall average values for each metric, with the exception of global efficiency, which is inherently a network-wide measure. This allowed us to evaluate the variation in network properties at both the node and network level, providing a more comprehensive understanding of the functional network structure. Each metric provides a unique perspective on the functioning and organization of interconnected regions in the brain, contributing to a comprehensive understanding of the complex dynamics at play.
The data were processed to examine functional connectivity across the two groups using network-based statistics.
To identify significant differences in global network measures between the control group (HC) and the experimental group (EX), we performed statistical tests for each metric using the t-test. To assess the normality of the distributions of these measures, we applied the Kolmogorov-Smirnov one-sample test to ensure that the data met the normality assumption necessary for the validity of the t-test results.
To identify statistically significant differences in the functional connectivity between the groups, we applied the framework of network-based statistics (NBS) [30]. Specifically, we assessed significance at the p = 0.05 level using the t-test for pairwise comparisons involving the two rest conditions and 50,000 permutations.
We then defined regions of interest (ROIs) based on the results of the group-level statistical analysis using NBS. This was done to reduce the search space in subsequent analyses. We defined the ROIs as the network nodes or brain regions characterized by their inclusion in the maximum number of significantly changing connections according to the NBS results. For these ROIs, we examined the local network metrics and compared them between groups, using the t-test with Bonferroni correction to adjust for the multiplicity of tests due to the number of ROIs considered. This statistical method adjusts the significance threshold to keep the family-wise error rate (FWER) at a desired level, thus reducing the risk of false positives due to the large number of comparisons performed while maintaining statistical rigor.
Statistical analysis of the global network metrics allowed us to identify some important trends, in particular to note that there are no significant between-group differences for all network measures during condition Rest1 (see Table 1). However, for condition Rest2, we see near significant between-group effects on measures of global efficiency, node strength, and clustering coefficient. In addition, for the control group, there is no significant difference between Rest1 and Rest2, while the experimental group shows near significant difference for the global efficiency measure. Thus, global efficiency has near significant effects both in the between-groups comparison in Rest2 and for the experimental group between conditions.
| Measures | t HC–EX R1 | p-value | t HC–EX R2 | p-value |
| Betweenness centrality | 0.0247 | 0.9803 | 0.0944 | 0.9249 |
| Eigenvector centrality | 0.0630 | 0.9498 | 0.1281 | 0.8982 |
| Node strength | 1.1351 | 0.2638 | 1.7854 | 0.0826 |
| Clustering coefficient | 1.3196 | 0.1953 | 1.8066 | 0.0792 |
| Global efficiency | 1.0263 | 0.3116 | 1.7882 | 0.0822 |
| Averaged Local efficiency | 1.2355 | 0.2247 | 1.6638 | 0.1048 |
| Measures | t HC R1–R2 | p-value | t EX R1–R2 | p-value |
| Betweenness centrality | 0.7225 | 0.4712 | 1.2395 | 0.2172 |
| Eigenvector centrality | –1.1378 | 0.2571 | –1.0401 | 0.3000 |
| Node strength | 0.4375 | 0.6711 | 1.2948 | 0.2068 |
| Clustering coefficient | 0.7749 | 0.4563 | 1.3553 | 0.1870 |
| Global efficiency | 0.7638 | 0.4626 | 1.7607 | 0.0900 |
| Averaged Local efficiency | 0.1354 | 0.8936 | 0.7068 | 0.3782 |
Here, R1 denotes Rest1, R2—Rest2, each t-column corresponds to the t-values for the contrast indicated in that column, where the “–” sign indicates the conditions being compared. Next to each t-column is a column with the corresponding p-values. HC, control group; EX, experimental group.
In the Rest1 condition, no significant changes in connectivity were observed between the EX and HC groups. However, in the Rest2 condition, the connectivity in the HC-EX direction showed significant changes in 25 connections (p = 0.038, Fig. 2 and Table 2). In general, the situation is characterized by a limited number of hubs with a moderate number of connections clustered around them. Differences in functional connectivity, particularly around the thalamus and anterior cingulate cortex regions, were found between subjects from the EX group and healthy controls, as shown in the provided Table 2 and Fig. 2. The maximum difference between the groups was found for the Putamen R – anterior cingulate cortex (ACC) pre R connection (0.28), while the highest absolute values for both groups were found for the Caudate L – Temporal Sup R connection (0.48—for the HC group, 0.29—for the EX group). Observably, there is a notable absence of activity in the average connections Temporal Sup R – ACC sub R and Thal VL R – ACC sub R in the EX group, whereas the connection activation is preserved in the HC group.
 Fig. 2.
Significantly different connections in the Rest2 condition obtained with NBS method. NBS, network-based statistics.
| Node 1 | Node 2 | HC | EX | HC-EX |
| Cingulate Mid R | Putamen R | 0.309473 | 0.109355 | 0.200118 |
| Caudate L | Temporal Sup R | 0.487169 | 0.298977 | 0.188192 |
| Supp Motor Area L | Thal VA L | 0.26115 | 0.148991 | 0.112159 |
| Occipital Mid L | Thal VA L | 0.171402 | 0.053322 | 0.11808 |
| Putamen R | Thal MDm L | 0.338766 | 0.156676 | 0.18209 |
| Supp Motor Area L | Thal MDm R | 0.280608 | 0.106528 | 0.17408 |
| Temporal Sup R | Thal MDm R | 0.332682 | 0.137087 | 0.195595 |
| Occipital Mid L | Thal LGN L | 0.316269 | 0.15438 | 0.161889 |
| Occipital Inf L | Thal LGN L | 0.289609 | 0.121395 | 0.168215 |
| Frontal Inf Tri L | Thal PuA L | 0.307797 | 0.115729 | 0.192068 |
| Frontal Sup Medial L | Thal PuA L | 0.283928 | 0.13854 | 0.145388 |
| Frontal Sup Medial R | Thal PuA L | 0.278407 | 0.098276 | 0.180131 |
| Insula R | Thal PuA L | 0.30788 | 0.137569 | 0.17031 |
| Putamen R | Thal PuA L | 0.343024 | 0.177622 | 0.165402 |
| Thal MDm L | Thal PuA L | 0.313476 | 0.173676 | 0.1398 |
| Thal MDm L | Thal PuL R | 0.187783 | 0.073152 | 0.114631 |
| Precuneus R | ACC sub R | 0.11556 | 0.017775 | 0.097786 |
| Temporal Sup R | ACC sub R | 0.185459 | –0.02608 | 0.211539 |
| Thal VL R | ACC sub R | 0.13293 | –0.02614 | 0.159073 |
| Putamen R | ACC pre L | 0.37058 | 0.117458 | 0.253121 |
| Frontal Inf Tri L | ACC pre R | 0.469782 | 0.242122 | 0.22766 |
| Putamen R | ACC pre R | 0.420345 | 0.140241 | 0.280104 |
| Temporal Sup R | ACC pre R | 0.404532 | 0.180162 | 0.22437 |
| Thal VL R | ACC pre R | 0.314918 | 0.128285 | 0.186634 |
| Thal MDm L | ACC pre R | 0.300931 | 0.093689 | 0.207242 |
Columns HC and EX contain the connection strengths between the corresponding nodes, estimated by Pearson correlation, for the healthy control and experimental groups, respectively. Column HC-EX contains the differences of the connection strengths for the corresponding groups. ACC, anterior cingulate cortex; Thal, Thalamus; PuA, anterior pulvinar; MDm, mediodorsal magnacellular; VA, ventral anterior; VL, ventral lateral; LGN, lateral geniculate.
ROIs were restricted to the five nodes (see Table 3) that participated in the largest number of significant connections previously revealed by the NBS method. We calculated local network metrics for the given nodes and compared them statistically between groups. We found that only the left anterior pulvinar thalamus (Thal PuA L) and right pregenual anterior cingulate cortex (ACC pre R) nodes showed significance for most measures (see Table 3). For betweenness centrality, no node was significant after correction. For eigenvector centrality, the only node found significant was ACC pre R. For the remaining measures—node strength and clustering coefficient—the nodes ACC pre R and Thal PuA L showed significant effects.
| Nodes | Number of significant connections | BC | EC | NS | CC |
| Thal PuA L | 6 | - | - | + | + |
| ACC pre R | 5 | - | + | + | + |
| Putamen R | 5 | - | - | - | - |
| Thal MDm L | 4 | - | - | - | - |
| Temporal Sup R | 4 | - | - | - | - |
Columns denote network measures: BC, betweenness centrality; EC, eigenvector centrality; NS, node strength; CC, correlation coefficient. Sign “+” means a significant effect for the corresponding network metric and node in the Rest2 condition for the comparison HC
Based on the one-sided prevalence of significant connections in the control group, we can assume that this corresponds to the norm and indicates hypoactivity during the experiment in the EX group.
The present study provides valuable insights into the neural connectivity patterns associated with touch, with a particular focus on lower limb massage and its localized effects on sensory information processing nodes. The results show that the control group showed a significantly higher degree of connectivity within a subnetwork consisting of 25 connections and 23 nodes compared to the experimental group after the massage intervention. In other words, the experimental group showed hypoactivation in this subnetwork after massage.
The key hubs in this subnetwork—the left anterior pulvinar thalamus and the right pregenual anterior cingulate cortex—showed a higher degree of clustering and increased node strength in the control group. This suggests that the massage intervention is associated with disrupted clustering processes and altered brain network segregation around these nodes.
In addition, the global efficiency results indicated a trend towards reduced integration processes in the brain network after massage, although this effect was not statistically significant. This may suggest a therapeutic effect of massage, where relaxation affects network architecture. Network segregation in clusters appeared to decrease, possibly due to relaxation and reduced involvement of nodes in information processing.
The lack of a statistically significant effect at the global level can be attributed to the localized nature of the effects identified in specific nodes. This is supported by the lack of significant changes in connections during Rest1, confirming no differences between groups prior to massage. While focusing on the most prominent hubs, the study also discusses their potential influence on the experimental outcomes.
In particular, the anterior pulvinar has connections with the prefrontal cortex, parietal cortex, and other association areas that are critical for complex sensory processing and motor planning [31]. Evidence of abnormal thalamic connectivity in autism spectrum disorders (ASD) and sensory processing disorders suggests that the thalamus may play a role in sensory overreactivity [32, 33]. The mediodorsal magnacellular (MDm) nucleus is also involved in social and cognitive functions, including social cognition and decision-making. It has connections with the prefrontal cortex, which is involved in these processes [34].
The ACC is generally involved in attention and cognitive control. Touch can serve as a sensory cue that attracts attention and may play a role in the integration of this sensory information [35, 36, 37]. The ACC, including the pregenual ACC, is involved in the modulation of pain perception [38]. Touch can have an analgesic effect, in part by activating brain regions that help dampen the perception of pain. The ACC pre is involved in this process because it interacts with other areas of the brain, such as the insula and prefrontal cortex, to regulate emotional and cognitive responses to pain [39, 40]. This area is known to be affected by touch massage [41]. Among its many anatomical connections, the ACC receives nociceptive afferents from the thalamic nuclei and also has connections to the periaqueductal gray and amygdala, while functionally it is involved in specifying the affective content of noxious stimuli and learning to predict and avoid noxious stimuli [19, 42]. The ACC pre is involved in processing the emotional aspects of social interactions, including touch. It helps interpret the emotional meaning of tactile stimuli [43], which increases positive functional connectivity between the cingulate cortex and left anterior supramarginal cortex following mechanical affective touch therapy.
The putamen helps coordinate and execute movements in response to touch, such as reaching out to touch an object or withdrawing from a painful touch. It receives input from the somatosensory cortex, which provides information about touch, and integrates this information with motor plans and intentions. This integration allows for appropriate motor responses to tactile stimuli [44, 45, 46]. The decreased activation in the somatosensory cortices over time may represent stimulus habituation, according to the experimental work [47, 48].
Temporal superior is also involved in social cognition, including the perception and interpretation of others’ actions and emotions. It is particularly important for understanding the intentions and emotions of others based on their touch. For example, the temporal superior can help us interpret a pat on the back, and is known to be involved in predicting the pleasantness of skin stroking [49]. Interestingly, in the same paper [43], there is a reduction in functional connectivity during touch in the ASD subjects. The superior temporal region is a vital part of the mirror neuron system and play a significant role in social cognition, as other research has shown [50, 51].
Although we emphasise the importance of the ACC and pulvinar in this study, many previous studies using fMRI [52, 53, 54, 55] and Near-infrared spectroscopy (NIRS) [56] have highlighted the importance of the orbitofrontal cortex (OFC) and the insula in affective touch. The importance of the OFC has also long been demonstrated in animal electrophysiological studies [57, 58]. The next study showed differentiation in the head of the hippocampus associated with activity in specific limbic brain areas known to be involved in emotional processing [59], which is important in the diagnosis of bipolar disorder. Our findings may have potential in depression treatment trials [60] and other psychological conditions requiring emotion regulation with social touch [61].
The study highlighted the potential of relatively short massage sessions to reduce the activation in brain areas associated with reduced social anxiety and stress. Specifically, the abnormal activity in the discussed anterior pulvinar thalamus and the pregenual anterior cingulate cortex has previously been associated with anxiety-related disorders, including post-traumatic stress disorder (PTSD) and major depressive disorder [62, 63, 64]. The use of massage techniques such as those presented can be successfully used in the rehabilitation and treatment of patients with PTSD and high levels of psychological distress. In addition, the study of resting-state changes based on fMRI data in patients with high levels of psychological distress is the focus of our future research. One of the papers shows that people who received more affectionate touch from their partner during a stressful laboratory task experienced less stress [65].
In addition to its effects on pain and stress, the research has shown that massage therapy is also effective in improving the quality of life of people with multiple sclerosis [66]. In recent years, the use of mechanical affective touch therapy has gained attention as a promising treatment option for controlling symptoms of anxiety disorders [67]. This approach potentially offers a non-pharmacological approach to anxiety management [68]. In line with the attachment theory, the research has shown that social touch experiences can have significant psychological benefits for individuals [69]. These touch experiences can increase feelings of safety and security and improve sleep quality [70], as research has found notable correlations between touch deprivation and self-reported difficulties in initiating and maintaining sleep [71]. Furthermore, study has shown that affection deprivation is significantly associated with sleep disturbance [72].
The relatively small sample size is a limitation of the study that may affect the generalizability of the results. However, the homogeneity of the demographic characteristics of the subjects and the use of adjustments for multiple comparisons during statistical analysis with cluster-based permutation testing are steps taken to mitigate this limitation and improve the validity of the study results.
A potential limitation of the study is the difference in sample size between the experimental and control groups, which could affect the representativeness and generalizability of the results. However, due to practical constraints and limited availability of participants, it was not possible to include a larger sample size in the control group.
The subjects had no previous experience of participating in similar massage experiments. However, it seems reasonable to assume that the subjects have had experience of receiving massage in their lifetime. This factor was not controlled for, and potentially the subjects may have responded differently based on their previous experience.
It is challenging to differentiate the precise influence of social interaction and direct tactile stimulation with its associated affective properties during the massage process. As the subjects were not able to see the masseur in the MRI machine, we believe that the observed effects are mainly due to the tactile influence (touching during the massage). Furthermore, the aim of the current study was to investigate the effects of massage with its potential social aspect.
Our study aimed to investigate the differences in brain activity between an experimental group of healthy subjects before and after receiving lower limb massage and healthy controls who did not receive massage. We performed a functional connectivity study to examine the changes in connections between different brain regions after massage. In particular, we observed altered connectivity patterns in specific networks, especially between the left anterior pulvinar thalamus and the right pregenual anterior cingulate cortex. These changes in functional connectivity of brain regions involved in touch processing persist for a significant period of time after the touch experience.
Our findings suggest that touch experiences have effects on brain connectivity and processing, providing valuable insights into the neural mechanisms of touch processing and the effects of such experiences.
From a practical point of view, our results have important implications for the development of sensory stimulation strategies for patients with prolonged disorders of consciousness, sensory loss, autism spectrum disorders, or limited access to tactile interaction in their upper extremities.
AAL, Automatic anatomical labeling atlas; ACC, Anterior cingulate cortex; ASD, Autism spectrum disorders; BOLD, blood-oxygenation-level-dependent; CC, Clustering coefficient; CEN, Central executive network; DMN, Default mode network; EX, Experiment (Experimental group or subjects); HC, Healthy controls; ICA, Independent component analysis; MDm, mediodorsal magnacellular; NBS, Network based statistics; PMd, Dorsal premotor cortex; PuA, Thalamus anterior pulvinar; ROI, Region of interest; SD, Standard deviation.
The data presented in this study are available on request from the corresponding author.
Conceptualization, VK, SK, LM and AH; Data curation, LM, GP and AK; Formal analysis, SK and AK; Funding acquisition, AH; Investigation, VK, SK, LM, GP, AK and AH; Methodology, SK and AH; Project administration, SK, LM and AH; Resources, LM, GP and AH; Software, VK; Supervision, AH; Validation, VK; Visualization, VK; Writing—original draft, VK and SK; Writing—review & editing, GP and AH. All authors contributed to editorial changes in the manuscript. All authors read and approved the final manuscript. All authors have participated sufficiently in the work and agreed to be accountable for all aspects of the work.
The study was conducted in accordance with the Declaration of Helsinki, and approved by the Institutional Ethics Committee of the Pushkin State Russian Language Institute (protocol code 17-3-24-118, date of approval 15 July 2022). All participants submitted voluntary written informed consent signed by the participant themselves for the publication of any potentially identifiable images or data included in this article.
We would like to express our gratitude to all those who acted as peer reviewers, providing us with their valuable opinions and suggestions.
This research was funded by a grant of the Russian Ministry of Science and Higher Education project No 075-15-2022-1139 “The role of affective touch in developing brain: fundamental and translational research”.
The authors declare no conflict of interest.
Supplementary material associated with this article can be found, in the online version, at https://doi.org/10.31083/JIN26280.
References
Publisher’s Note: IMR Press stays neutral with regard to jurisdictional claims in published maps and institutional affiliations.