


 , Xie Wang 1, Daojun Xie 1,*
1 Department of Brain Disease Center, The First Affiliated Hospital of Anhui University of Chinese Medicine, 230031 Hefei, Anhui, China
Abstract
White matter (WM) is a principal component of the human brain, forming the structural basis for neural transmission between cortico-cortical and subcortical structures. The impairment of WM integrity is closely associated with the aging process, manifesting as the reorganization of brain networks based on graph theoretical analysis of complex networks and increased volume of white matter hyperintensities (WMHs) in imaging studies.
This study investigated changes in the robustness of WM brain networks during aging and assessed their correlation with WMHs. We constructed WM brain networks for 159 volunteers from a community sample dataset using diffusion tensor imaging (DTI). We then calculated the robustness of these networks by simulating neurodegeneration based on network attack analysis, and studied the correlations between WM network robustness, age, and the proportion of WMHs.
The analysis revealed a moderate, negative correlation between WM network robustness and age, and a weak and negative correlation between WM network robustness and the proportion of WMHs.
These findings suggest that WM pathologies are associated with aging and offer new insights into the imaging characteristics of the aging brain.
Keywords
- white matter
- aging
- brain networks
- robustness
- white matter hyperintensities
Human cognition, emotion, motor functions, and sensation all rely on the transmission of signals by brain neurons [1]. White matter (WM) is a major central nervous system component, primarily composed of myelinated and unmyelinated axons and oligodendrocytes that synthesize sphingomyelin. Myelin sheaths, composed of lipid-rich myelin and cholesterol, significantly increase the speed of neural impulses [2]. WM constitutes nearly half of the brain’s volume and is responsible for the transmission of electrical signals between brain regions [3]. Abnormalities in WM function can lead to several neuropsychiatric abnormalities and cognitive disorders. The brain undergoes a series of structural and functional changes during aging, including decrease in brain volume, gray matter (GM) atrophy, and ventricular expansion [4, 5]. Additionally, WM damage, infarctions, and microhemorrhages are more frequent among the aged population [4, 5]. Notably, neurotransmitters levels, including dopamine, acetylcholine, and serotonin, decline with aging [4, 5].
Recent research has emphasized the role of brain network connectivity in cognitive performance in old age. Studies have shown links between changes in network connectivity and several cognitive domains such as visuospatial reasoning, information processing speed, executive function, and memory [6, 7, 8]. Aging also triggers the reorganization of structural brain networks [9]. Individual differences in brain network alterations during aging may be mediated by common pathways in the disease process [10, 11, 12]. Although it was once believed that age-related brain functional changes are primarily due to GM atrophy, this view has shifted in recent years [13]. Study has found that changes in cognitive function do not necessarily accompany significant declines in the number of neurons [14]. With advancements in diagnostic techniques, WM atrophy, conduction disruption, vascular damage, inflammation, and demyelination have been observed in aging brain tissue. It has now been suggested that age-related WM pathologies are closely associated with the development and prognosis of brain diseases, including sensorimotor disorders, cognitive impairments, and mental diseases [15]. Therefore, WM integrity is critical for normal brain function and health.
Diffusion tensor imaging (DTI) is an imaging technique that utilizes magnetic resonance imaging (MRI) technology to study the diffusion behavior of water molecules in biological tissues. It has been extensively used to study WM pathologies [16, 17, 18]. WM fiber tracking reconstructs the trajectories of WM brain networks in the brain using DTI data [19, 20]. A WM brain network is a network of neurons interconnected by WM fiber tracts. Recently, a study has employed graph theoretical approaches to investigate the network structure of the brain [21]. Graph theory, a branch of mathematics, conceptualizes different brain regions as nodes and the connections between these regions as edges. Based on this perspective, researchers can calculate various network parameters, such as node degree, clustering coefficient, and characteristic path length, to reveal the topological properties of the network [22]. Considering the brain as a complex network, it becomes possible to study the types and degrees of resilience to damage exhibited by the brain, referred to as network robustness [23]. Network robustness describes the ability of a network to maintain its functionality and structure when experiencing damage or attacks [24]. Studies on network robustness primarily focus on two issues: The first is quantifying network robustness, and proposing various metrics, such as network efficiency and connectivity [25]; the second issue is, enhancing network robustness, where factors such as network topology, the significance of nodes, and network dynamics affect its robustness [26].
Leukoaraiosis (LA) manifests as white matter hyperintensities (WMHs) on T2-weighted brain magnetic resonance imaging scans, referring to changes in brain white matter [27, 28]. Age is recognized as a major risk factor for LA [27, 28, 29, 30, 31, 32]. Clinically, LA is strongly associated with an increased risk of cognitive decline [33, 34], motor gait dysfunction [35], stroke [36], and dementia [33]. Given the clinical importance of WMHs in the aged population, there is an urgent need to understand the clinical characteristics of WMHs and develop effective prevention and management strategies. In addition, the aging process is accompanied by changes in the WM network, and it is hypothesized that the WM network becomes progressively less resistant to lesions during aging, which might be relevant to the manifestation of WMHs commonly seen clinically. Therefore, unlike previous studies, this study used a network attack analysis to calculate the robustness of the WM network and explored the correlation between the robustness of WM brain networks and factors such as age and the proportion of WMHs, to provide new evidence supporting age-related WM pathologies and radiological features.
The subjects were from the NKI/Rockland Sample (NKI-RS), provided by the
Nathan Kline Institute (NKI, New York, NY, USA), publicly available through the
International Neuroimaging Data-sharing Initiative (INDI)
(http://fcon_1000.projects.nitrc.org/indi/pro/nki.html). The NKI Institutional
Review Board approved the protocol for data collection and sharing. After
excluding volunteers younger than 18 years, two volunteers were removed from the
study due to missing DTI data, and two volunteers were excluded due to errors in
data processing. Finally, 159 subjects (age range: 18 to 85; mean age: 41.6
All participants were scanned using a Siemens Trio 3.0 Tesla MRI scanner
(Diffusion MRI scans:
https://fcon_1000.projects.nitrc.org/indi/pro/nki/NKI_64DIR_DTI_PROTOCOL.pdf;
T1-weighted MRI image scans:
https://fcon_1000.projects.nitrc.org/indi/pro/nki/NKI_MPRAGE_PROTOCOL.pdf).
The diffusion MRI scans were acquired using conventional acquisition parameters
with 2 mm isotropic voxels and 64 gradient directions (b = 1000 s/mm2, 12
non-diffusion b = 0 images, repetition time (TR)/echo time (TE) = 10,000/91 ms,
field of view (FOV) = 256
DTI data were automatically preprocessed using the Pipeline for Analyzing braiN
Diffusion imAges (PANDA) package 1.3.1
(https://www.nitrc.org/projects/panda/)
[37], using the following main steps: (1) brain extraction and brain mask
estimation; (2) image cropping; (3) eddy current/motion correction; and (4)
computation of DTI metrics (fractional anisotropy (FA)). After preprocessing, the
steps for constructing the WM brain networks and graph theory analysis were as
follows: (1) affine transformation was used to align the FA map with its
corresponding T1 image in individual spaces; (2) the transformed T1 images were
non-linearly registered to the Montreal Neurological Institute (MNI) space using
a T1 template; (3) a non-linear transformation from was carried out from DTI
individual spaces to MNI standard spaces and their inverse was obtained. The
automated anatomical labeling (AAL) atlas was selected to define nodes and the
inverse transformation was used to register the AAL template, which included 90
brain regions, to individual spaces. Subsequently, 90 subregions in individual
spaces were segmented and labeled; (4) the fiber assignment by continuous
tracking (FACT) deterministic tracking algorithm was employed to trace WM fibers,
terminating the tracking when the FA
To measure network robustness, we chose node degree and node betweenness centrality as the targets for network-targeted attacks. Node degree is the most intuitive node metric in network theory, representing the actual number of connections of a node with other nodes [39]. Nodes with high degrees play a critical role in information transmission and integration and can act as “hub” nodes in brain networks [40]. They are responsible for coordinating and integrating information from different regions [41]. Node betweenness centrality refers to the frequency with which a node appears on all the shortest paths within the network, measuring a node’s intermediary role. Nodes with high node betweenness centrality often play key roles in information transfer and integration and serve as “bridges” in the network [42]. Global efficiency is the reciprocal of the average shortest path length between nodes, representing the network’s capacity for functional integration and parallel information processing. It is a commonly used indicator for assessing network robustness [43].
In our study, for each volunteer’s FA-weighted network, the network nodes in the remaining largest component of the network were removed in order of node degree or node betweenness centrality from high to low, respectively, until the number of network nodes was one. Whenever a node was removed, the global efficiency of the network at that point was first calculated, and then the percentage of the global efficiency of the network at that point in the global efficiency before the network attack (i.e., the relative global efficiency) was calculated. Although there might be differences in network global efficiency between different volunteers before the network attack, it was appropriate for each volunteer since the relative global efficiency was generated in comparison with itself (without involving other volunteers). Each time a node was removed, a corresponding relative global efficiency was obtained, and ultimately a curve indicating relative global efficiency with node removal was obtained (Fig. 1), which reflected the process of network disintegration in the face of attacks. We used the area under the curve (AUC) of the change curve as a quantitative metric for evaluating the robustness of the network, i.e., the robustness of the network was the AUC. For each network, the faster the relative global efficiency decreased, the smaller the AUC, and the faster the network disintegrated, the less robust the network becomes. The entire data processing process is shown in Fig. 2.
 Fig. 1.
Relative global efficiency change curve at the time of node removal in network attack analysis.
 Fig. 2.
Data analysis flowchart. DTI, diffusion tensor imaging; AUC, area under the curve; FA, fractional anisotropy; AAL, automated anatomical labeling; FN, fiber number; CAT, computational anatomy toolbox; GM, gray matter; WM, white matter; CSF, cerebrospinal fluid; WMHs, white matter hyperintensities; MNI, montreal neurological institute.
WMHs are typically segmented from the Fluid-Attenuated Inversion Recovery (FLAIR) sequences from the MRI data; however, FLAIR imaging was not available in the NKI-RS. Therefore, we used T1-weighted MRI data to segment the WMHs [44], which has been utilized in another study [45]. First, we used the computational anatomy toolbox (CAT 12.9) (https://neuro-jena.github.io/cat/) [46] in “expert mode” to divide the T1-weighted MRI data into GM, WM, cerebrospinal fluid (CSF), and WMHs tissue maps and estimated their intrinsic spatial volumes. Subsequently, considering the variability in brain volume among individuals, we defined the proportion of WMHs as the ratio of WMHs to the total WM, i.e., WMHs proportion = WMHs/(WM + WMHs).
Pearson correlation analysis was used to investigate the relationship between
the robustness of WM brain networks and age. Spearman rank correlation analysis
was used to determine the relationship between the robustness of the WM brain
networks and the proportion of WMHs. The Pearson chi-square test was used to
analyze gender differences across different age groups. The Kruskal-Wallis test
was employed to compare the levels of network robustness across various age
groups. In the presence of inter-group differences, the Steel-Dwass test was
conducted for post-hoc analysis. All p-values were two-sided, with
p-values
DTI connectomes tend to be relatively sparse [47], with the distribution of network densities ranging from 6.91% to 13.78% among the 159 FA-weighted networks constructed in this study. The global efficiency, average node degree and average node median centrality of the remaining largest components of the network in each age grouping before network attack analysis and the proportion of WMHs in each age subgroup are shown in Table 1.
| Age group | Global efficiency | Mean node degree | Mean node betweenness centrality | Proportion of WMHs |
| 18–35 | 0.456 |
9.961 |
138.943 |
0.402% |
| 36–64 | 0.451 |
9.725 |
141.899 |
0.496% |
| 65–85 | 0.421 |
8.420 |
161.920 |
1.428% |
Compared with the 18–35 age group, *p
The dataset samples were artificially divided into three age groups based on the
age of the volunteers: 18–35 years, 36–64 years, and 65–85 years [48]. The
gender composition of each group is shown in Table 2, and no significant
differences were found in gender composition between groups (p
| Age group | Gender | |
| Male | Female | |
| 18–35 | 40 | 28 |
| 36–64 | 45 | 22 |
| 65–85 | 12 | 12 |
| p | 0.297 | |
 Fig. 3.
Pearson correlation analysis of network robustness and age using
node degree as the target for network-targeted attacks and global efficiency as
the measure (r = –0.492, p
 Fig. 4.
Pearson correlation analysis of network robustness and age using
node betweenness centrality as the target for network-targeted attacks and global
efficiency as the measure (r = –0.532, p
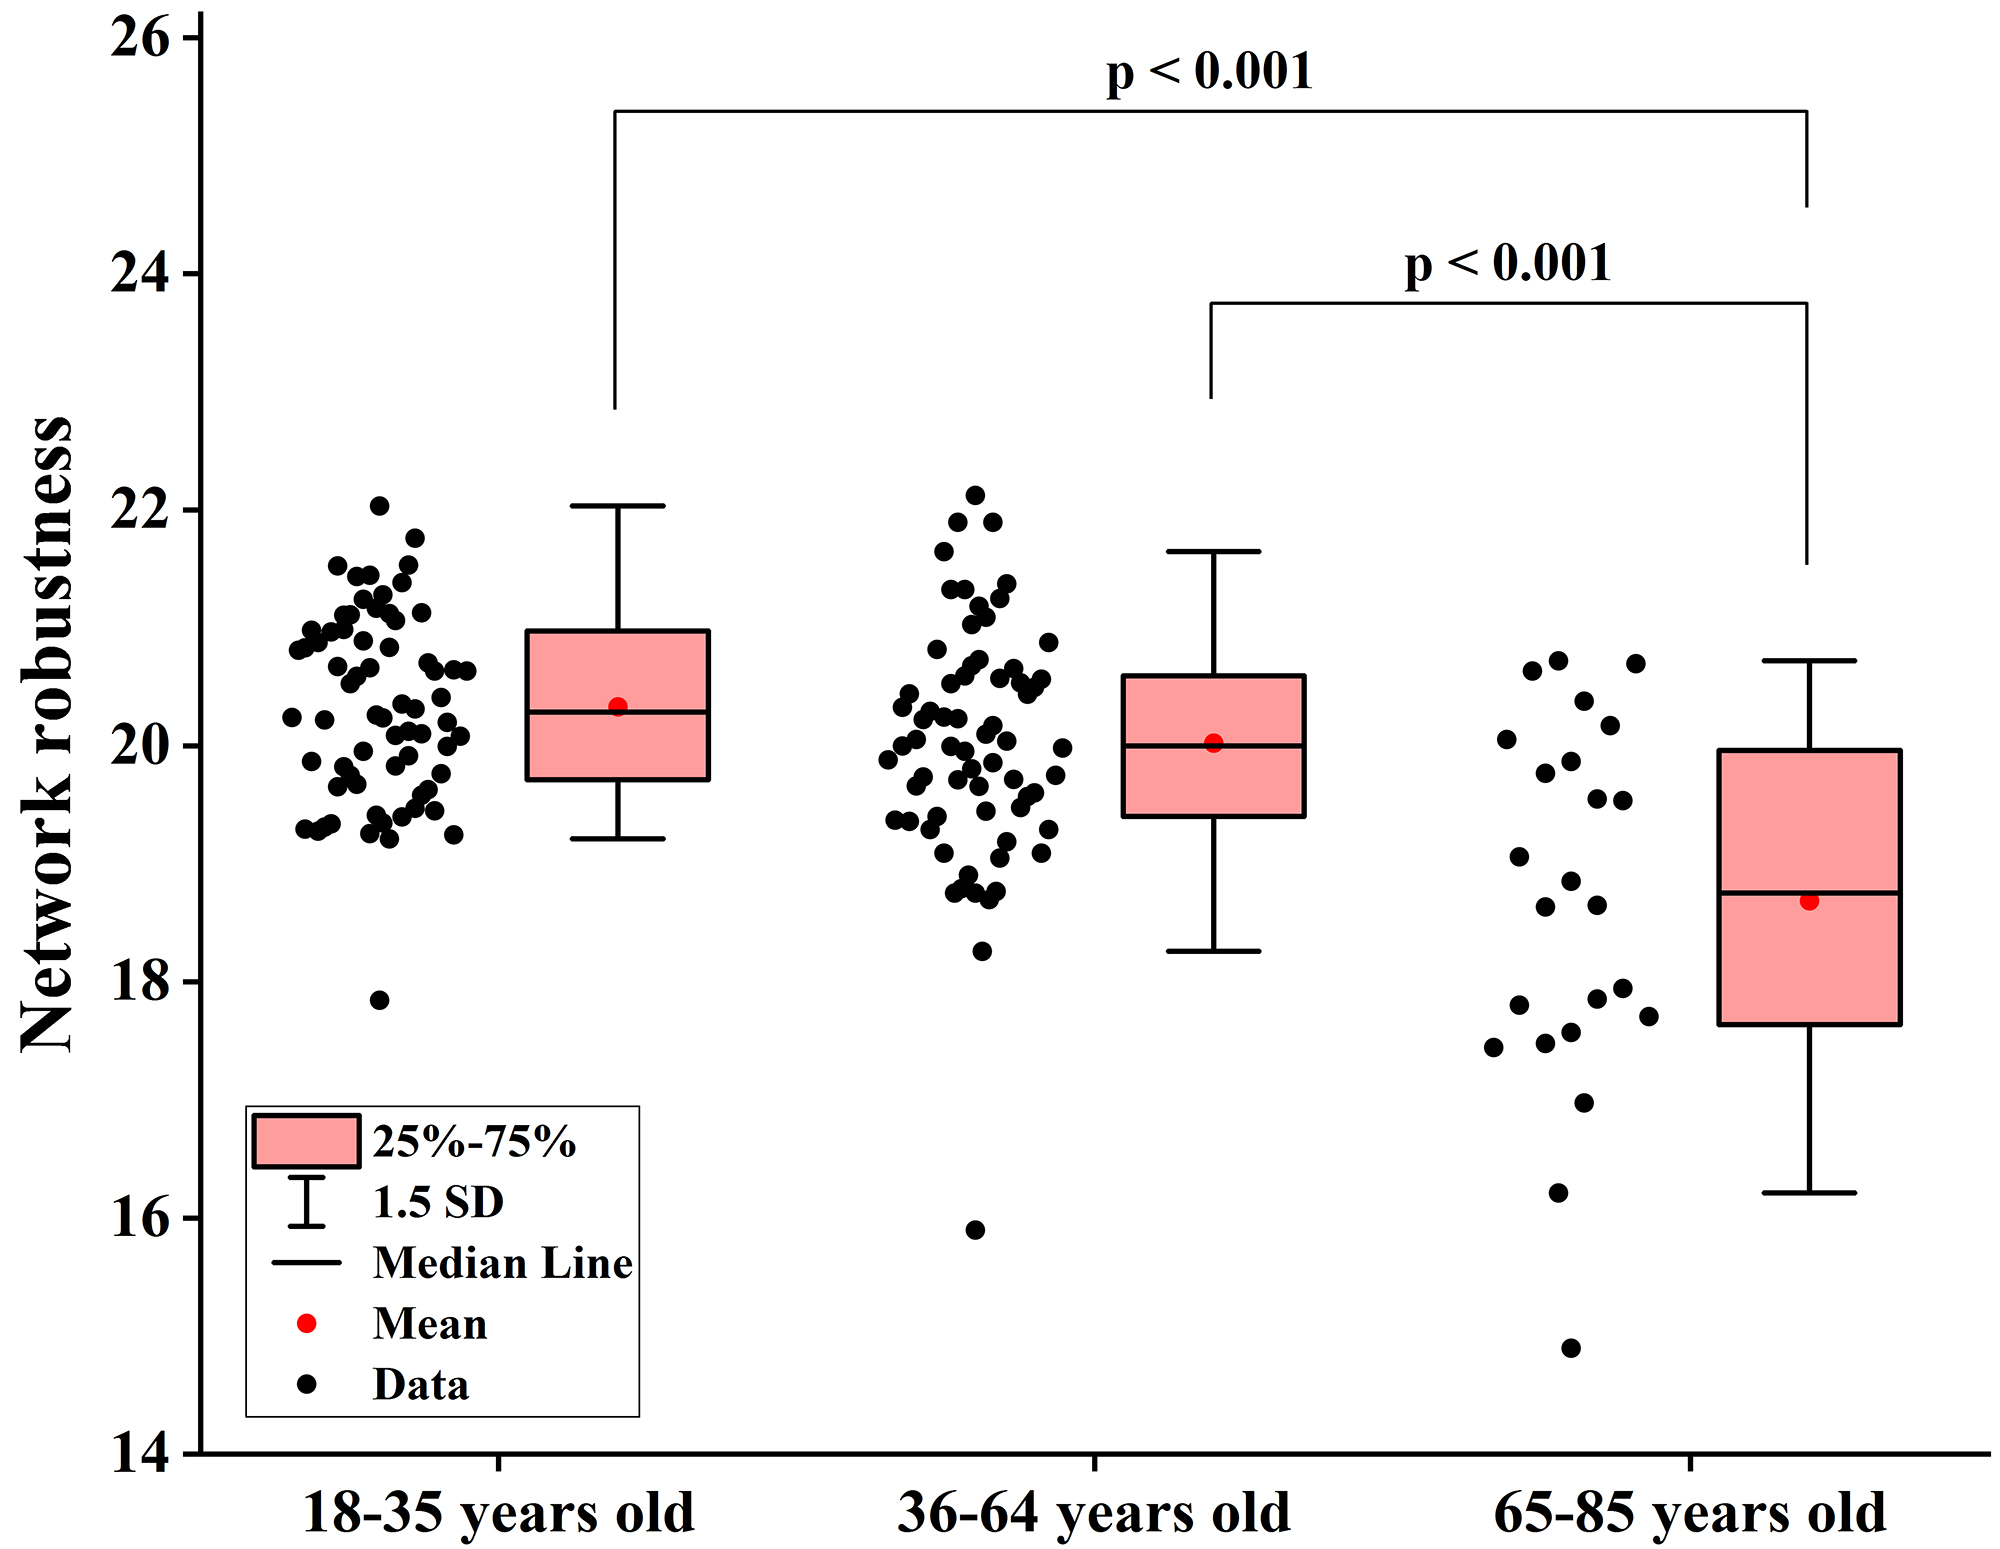 Fig. 5.
Differences in network robustness among groups when node degree is used as the target for network-targeted attacks. SD, standard deviation.
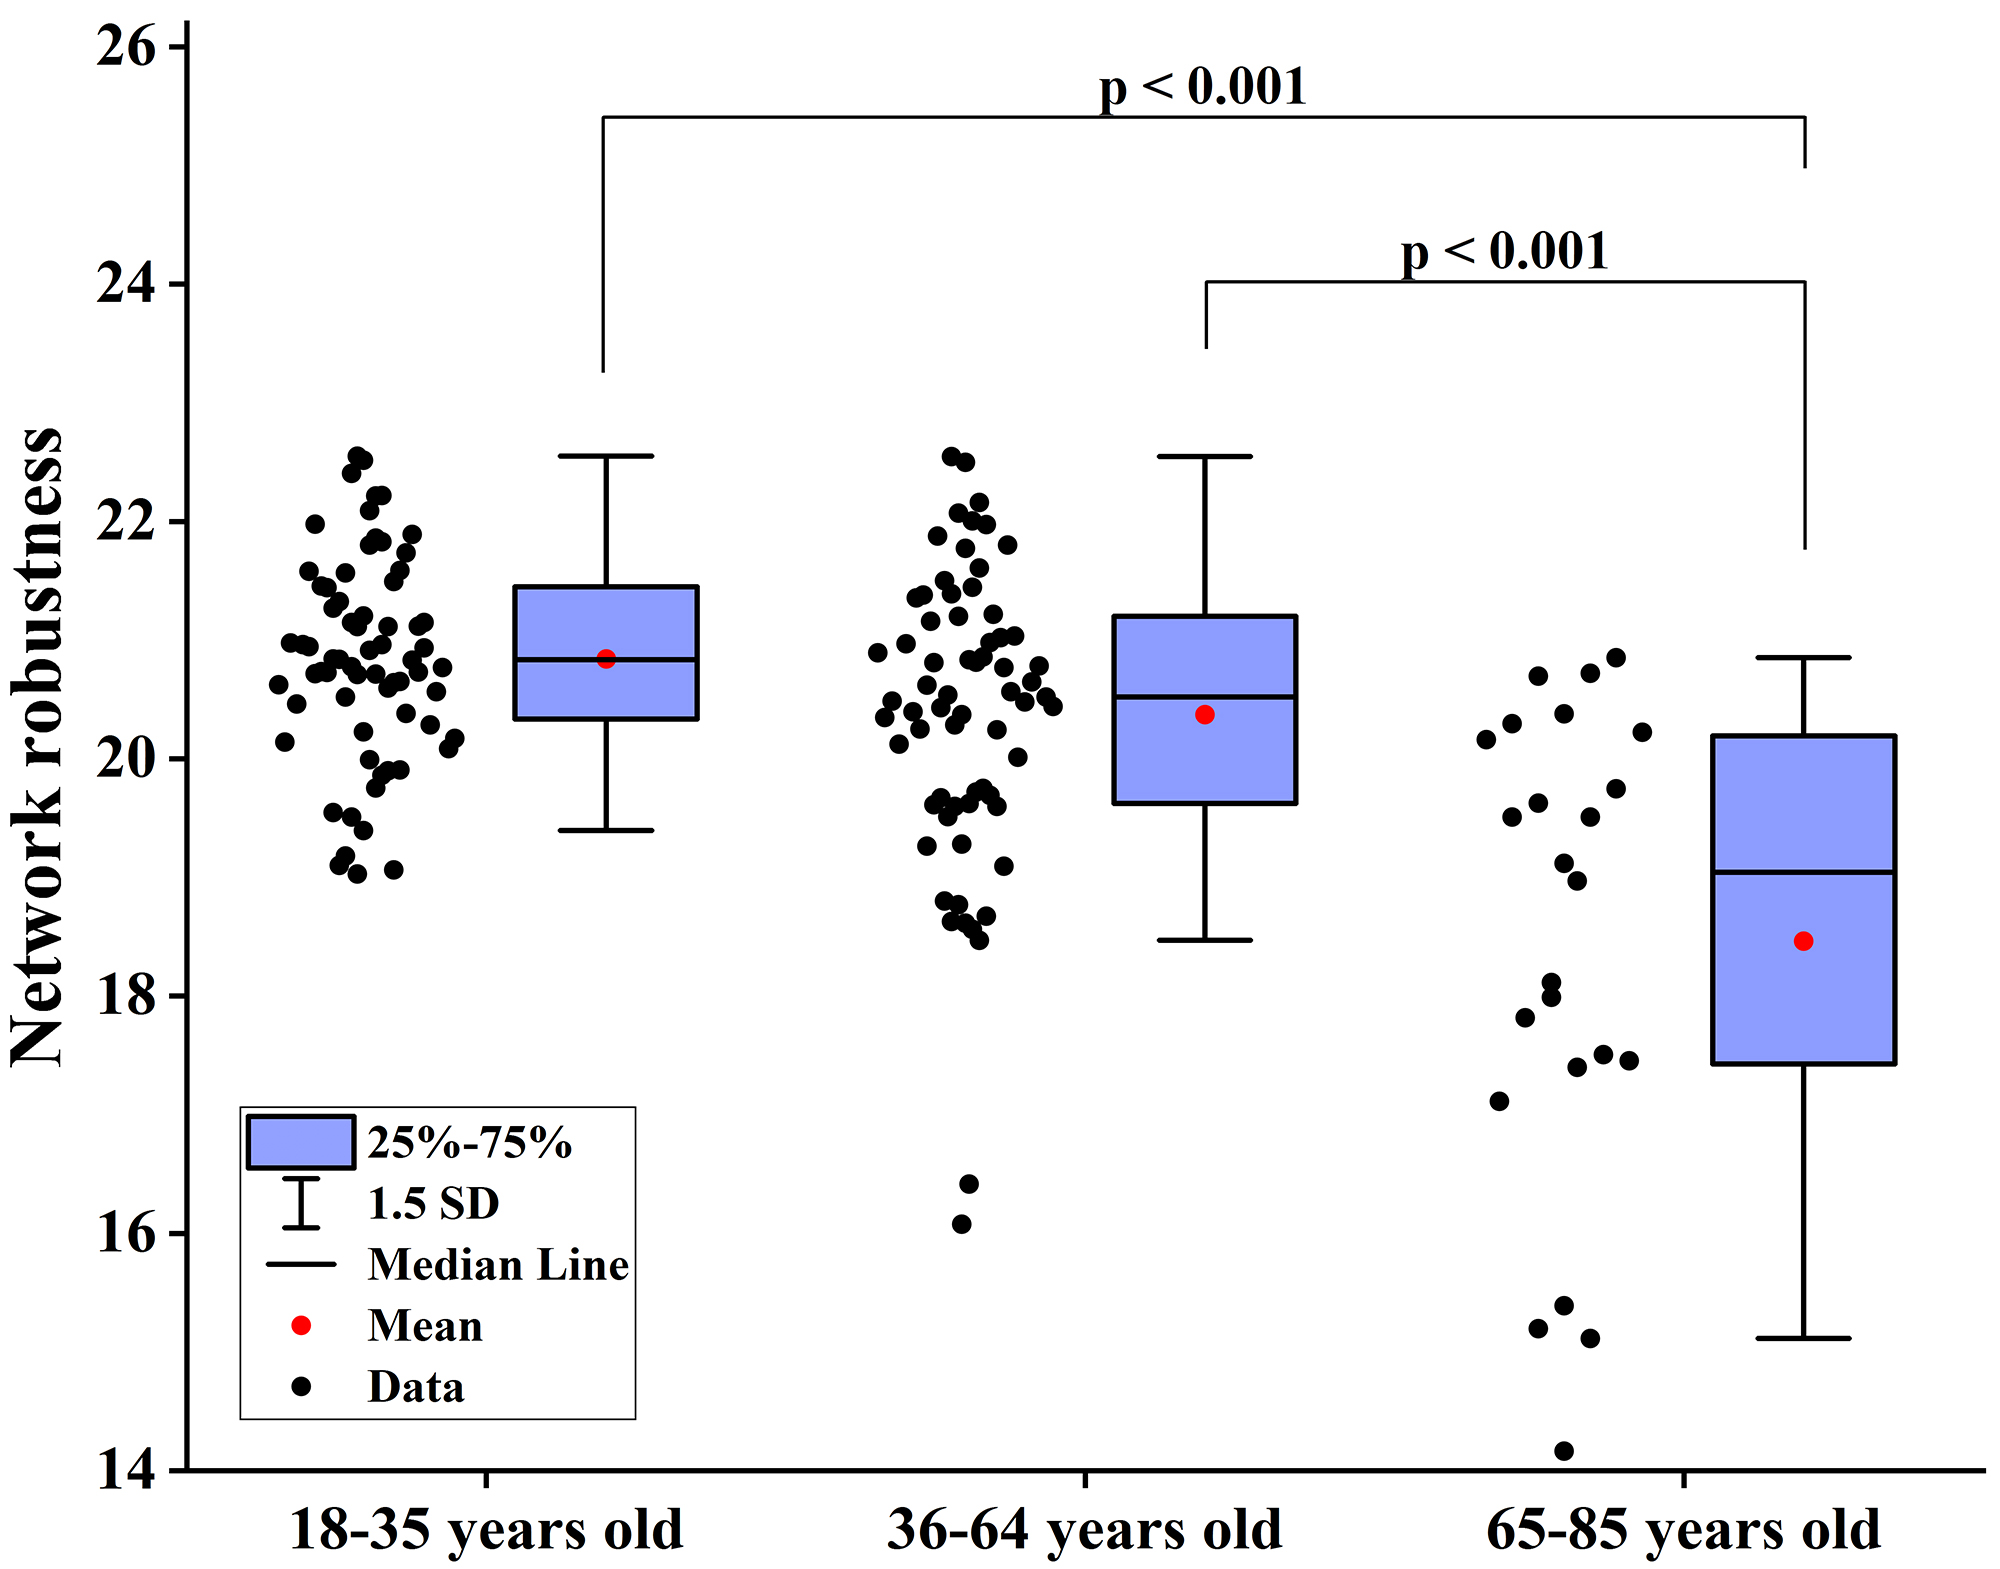 Fig. 6.
Differences in network robustness among groups when node betweenness centrality is used as the target for network-targeted attacks. SD, standard deviation.
Considering the markedly skewed distribution of the proportion of WMHs, we
employed Spearman rank correlation analysis to measure the relationship between
the robustness of WM brain networks and the proportion of WMHs. Considering node
degree as the target for network-targeted attacks and global efficiency as the
measure of network robustness, a negative correlation was found between network
robustness and the proportion of WMHs (r = –0.204, p
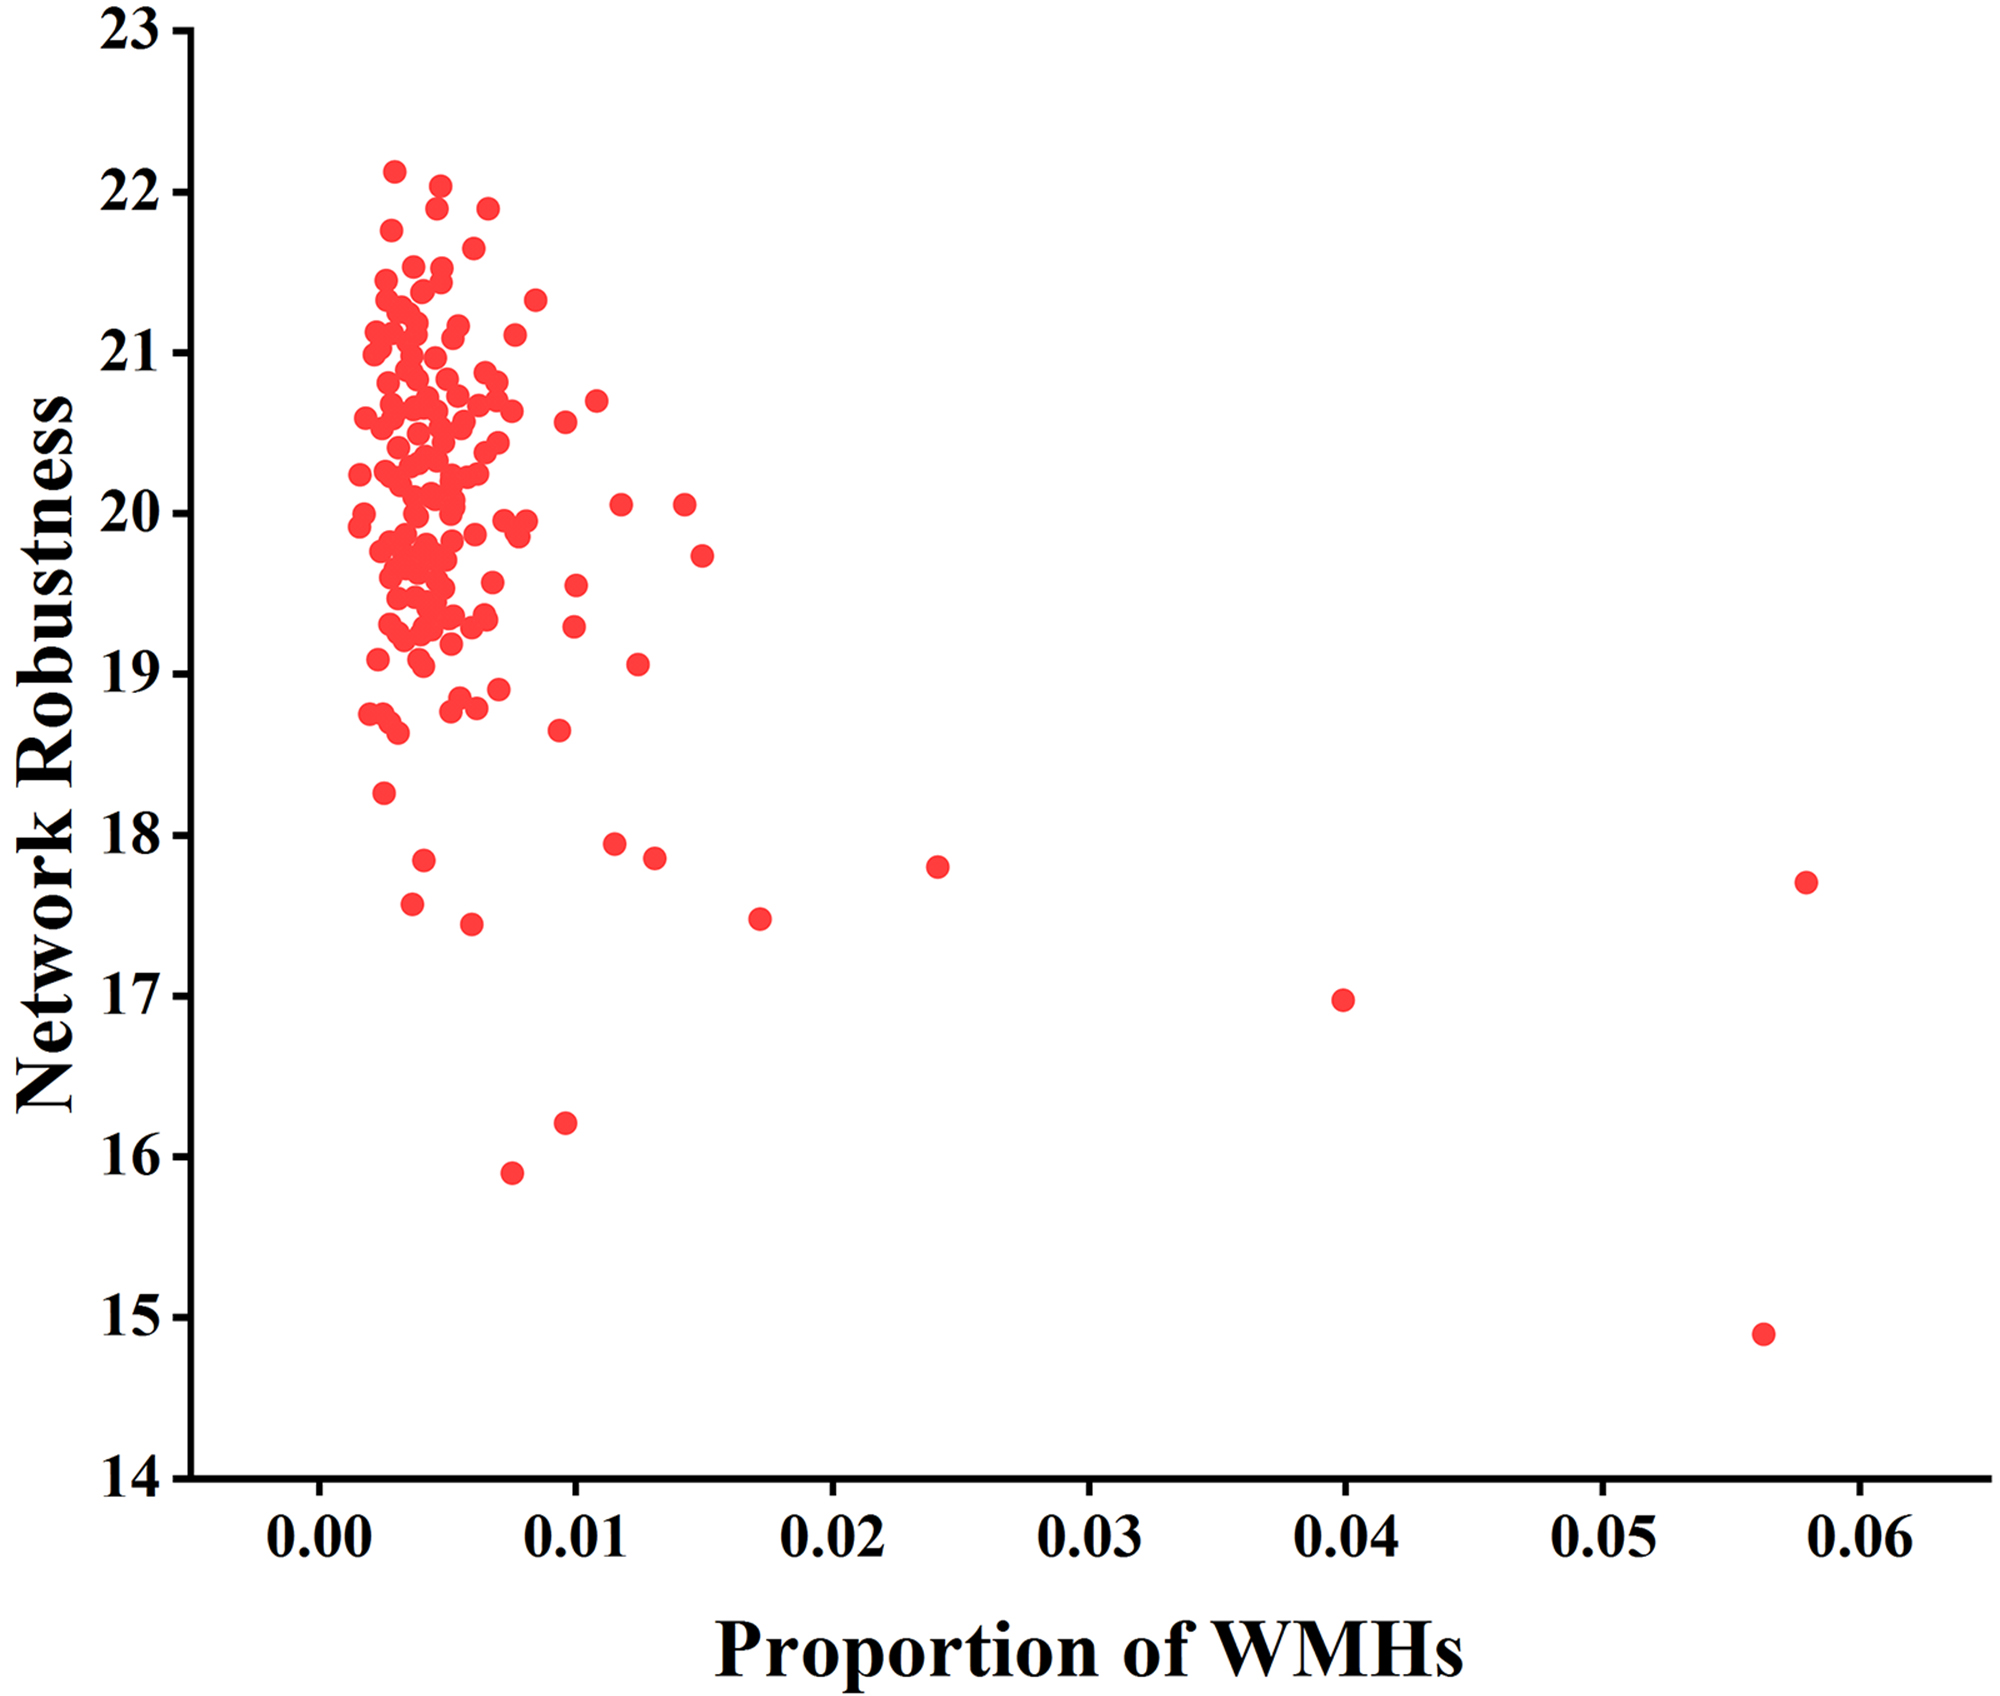 Fig. 7.
Analysis of the correlation between network robustness and the
proportion of WMHs using node degree as the target for network-targeted attacks
and global efficiency as the measure (r = –0.204, p
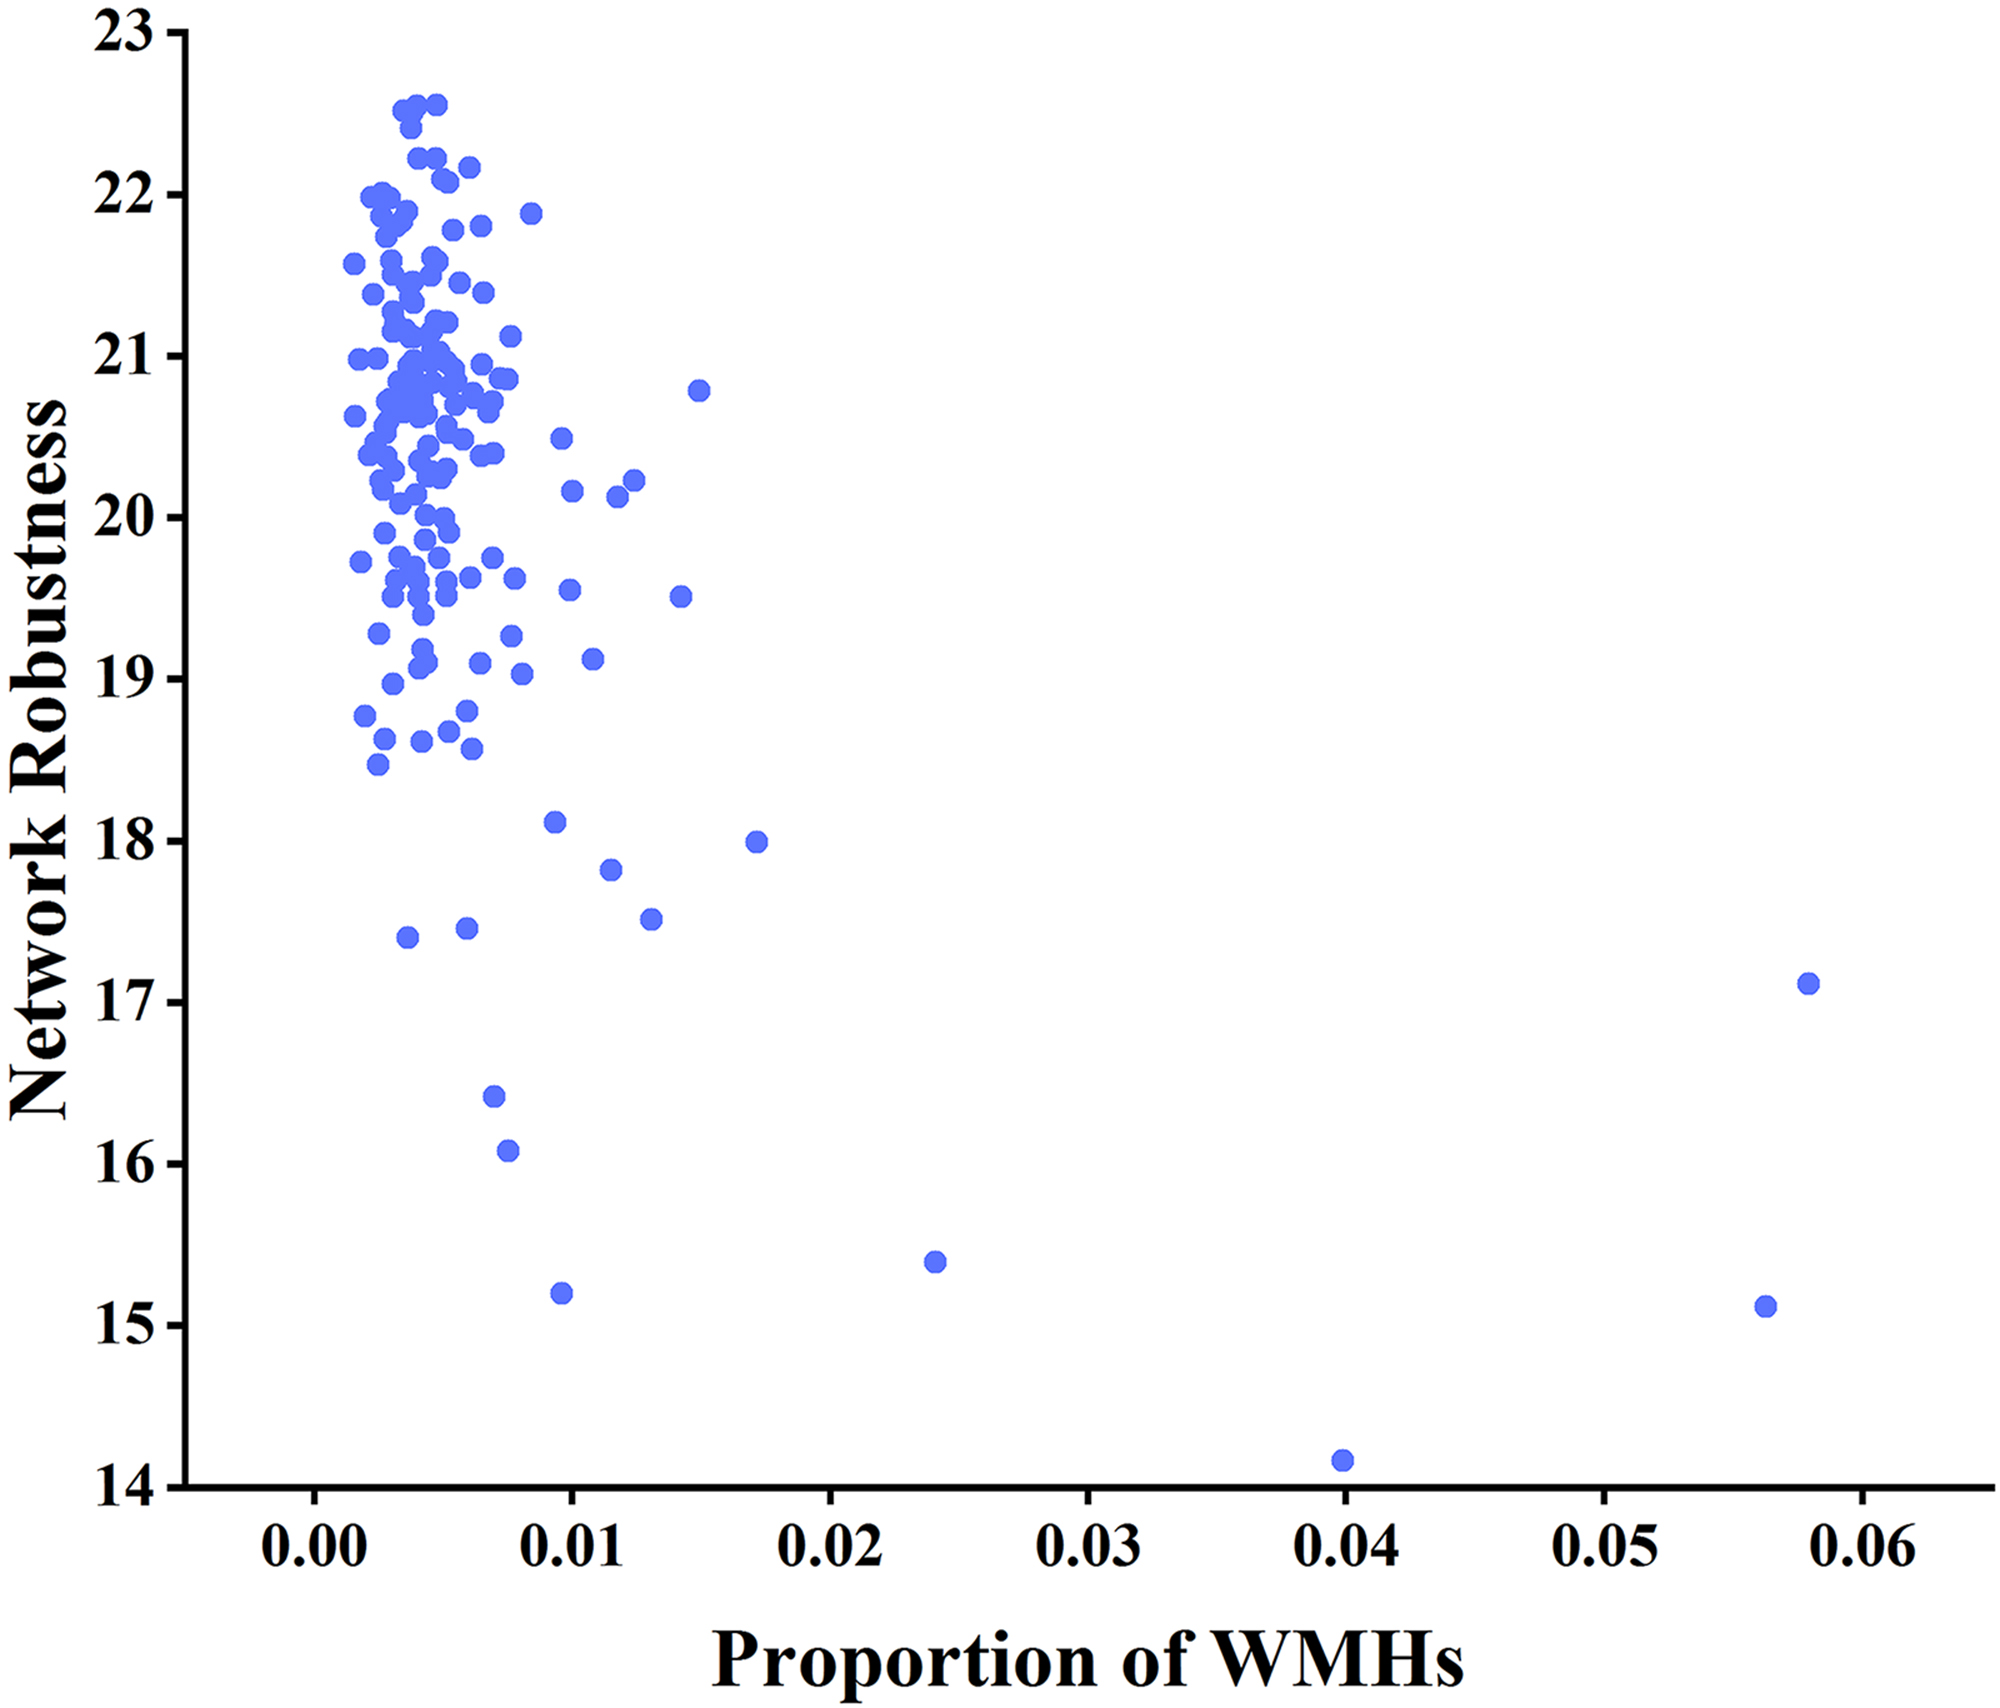 Fig. 8.
Analysis of the correlation between network robustness and the
proportion of WMHs using node betweenness centrality as the target for
network-targeted attacks and global efficiency as the measure (r = –0.277,
p
This study investigated the correlations between brain network robustness and age. The results demonstrated that network robustness exhibited a negative correlation with age and the proportion of WMHs as well as a significant reduction in network robustness among those over 65. These findings indicated that older age groups or individuals with a greater proportion of WMHs exhibited increased global efficiency loss and lower network robustness when subjected to network attacks.
Study has shown that changes in WM during aging include macroscopic alterations, such as reduced WM volume, WM damage, impaired WM integrity, and cortical disconnections [49]. At the microscopic level, these changes manifest in the deterioration of myelin and axons. Various cells are involved in forming and maintenance myelin, among which oligodendrocytes are crucial, as oligodendrocytes agings accelerates myelin deterioration [50]. Additionally, with aging, changes in lipid metabolism alter myelin structure and function, inclusiong cholesterol metabolism disorders, which impair myelin formation and maintenance [51]. Axonal degeneration often precedes clinical symptoms and occurs before cell bod loss. Axonal degeneration is related to protein homeostasis, cellular stress responses, and mitochondrial stability [52]. These changes ultimately reduce WM integrity.
DTI microstructural indices are the most sensitive indicators of age. Diffusion coefficients are positively correlated with age, while anisotropy is negatively correlated with age [53]. Common DTI metrics, such as FA, measures the overall directionality of water molecules, characterizing their ability to diffuse along WM fiber tracts. Study has revealed a negative correlation between age and FA values in brain regions, i.e., the older the age, the lower the FA values in different brain regions [54]. In this study, we investigated the relationship between WM brain network robustness and age. The results showed a negative correlation between network robustness and age. Previous study has analyzed the functional brain networks of brain glucose metabolism from the perspective of the functional brain networks of brain glucose metabolism and revealed that the functional brain networks in the elderly population are more susceptible to targeted attacks [55]. And in the present study, the previous study was complemented from the perspective of structural brain networks and similar conclusions were obtained. This will likely contribute to the understanding of changes in brain structure-function coupling in aging.
Key nodes and global attributes of WM brain networks, such as global efficiency, network strength, cost, and topological efficiency, change during brain aging, and different brain regions exhibit distinct trajectories during aging [56, 57]. Highly connected hub nodes have functional value because their topological centrality supports integrative processing and adaptive behaviors that are closely associated with anatomical structures involved in brain diseases [58]. In network robustness analysis, node degree and node betweenness centrality of the network are commonly used to assess node importance [59]. Global efficiency in brain networks can be interpreted as the capacity for information exchange between different brain regions. Higher global efficiency indicates more efficient information transmission within the brain network, and global efficiency is closely associated with cognition and attention [60]. This study revealed a negative correlation between network robustness and the proportion of WMHs when the node degree was considered as the target of network-directed attacks. Global efficiency was considered as a measure of network robustness. In addition, when inter-node degree centrality was considered as the target of network directed attacks and global efficiency was considered as a measure of network robustness, network robustness was negatively correlated with the proportion of WMHs.
WMHs are common manifestations of aging and pathological conditions. Various factors result in WMHs. Vascular WMHs are primarily associated with insufficient blood supply. For instance, hypertension and diabetes can damage the microvasculature of the brain, resulting in WM ischemia and edema [33, 61, 62]. Inflammatory WMHs are mainly related to inflammatory reactions in neurons and glial cells, with neurovascular inflammation playing a critical role in WMHs [63, 64]. Metabolic WMHs are primarily linked to impaired myelin metabolism [65]. These changes may affect the macroscopic and microscopic structures of the WM, manifesting as radiological alterations, affecting WM networks, and reducing network robustness. In addition, studies have confirmed that WMH is an independent risk factor for cognitive impairment, with some scholars reporting that WMH leads to a 14% elevated risk of cognitive dysfunction and dementia of all-cause, a 25% increased risk of Alzheimer’s, and a 73% increased risk of vascular dementia [33, 66]. This study demonstrated that older age groups or individuals with a greater proportion of WMHs exhibited greater global efficiency loss and lower network robustness when subjected to network attacks.
Decreased robustness of the WM network during the aging process might be a manifestation of WM aging. This manifestation might be associated with the imaging biomarkers of WMHs. These findings provide evidence for WM pathologies related to aging and offer new insights into brain imaging characteristics of aging.
The datasets generated and/or analyzed this study are from the NKI/Rockland Sample (NKI-RS), provided by the Nathan Kline Institute (NKI, NY), and publicly available through the International Neuroimaging Data-sharing Initiative (INDI) [http://fcon_1000.projects.nitrc.org/indi/pro/nki.html].
CH performed the research, analyzed the data and wrote the manuscript, XW provided help and advice on MRI data processing, DX designed the research study. All authors have participated sufficiently in the work and agreed to be accountable for all aspects of the work. All authors contributed to editorial changes in the manuscript. All authors read and approved the final manuscript.
Not applicable.
We acknowledge the dataset provided by NKI/Rockland Sample (NKI-RS) from Nathan Kline Institute (NKI, New York, NY, USA).
This research received no external funding.
The authors declare no conflict of interest.
References
Publisher’s Note: IMR Press stays neutral with regard to jurisdictional claims in published maps and institutional affiliations.