


 , Fang Cong 1,2,*, Fu-Biao Huang 2,3, Ming Zeng 4, Jun Wang 5
1 Department of Physical Therapy, Beijing Bo’ai Hospital, China Rehabilitation Research Center, 100068 Beijing, China
2 School of Rehabilitation Medicine, Capital Medical University, 100068 Beijing, China
3 Department of Occupational Therapy, Beijing Bo’ai Hospital, China Rehabilitation Research Center, 100068 Beijing, China
4 Department of Rehabilitation Medicine, The Second Affiliated Hospital of Jiaxing University, The Second Hospital of Jiaxing City, 314000 Jiaxing, Zhejiang, China
5 Department of Physical Therapy, Hangzhou Geriatric Hospital, 310022 Hangzhou, Zhejiang, China
Abstract
Observation, execution, and imitation of target actions based on mirror neuron network (MNN) have become common physiotherapy strategies. Electrical stimulation (ES) is a common intervention to improve muscle strength and motor control in rehabilitation treatments. It is possible to enhance MNN’s activation by combining motor execution (ME) and motor imitation (MI) with ES simultaneously. This study aims to reveal whether ES could impact cortical activation during ME and MI.
We recruited healthy individuals and assigned them randomly to the control group (CG) or experiment group (EG). Participants in EG performed ME and MI tasks with ES, while participants in CG performed the same two tasks with sham ES. We utilized functional near-infrared spectroscopy (fNIRS) to detect brain activation of MNN during ME and MI with and without ES, a randomized block design experiment paradigm was designed. Descriptive analysis of oxy-hemoglobin (HbO) and deoxy-hemoglobin (HbR) were used to show the hemoglobin (Hb) concentration changes after different event onsets in both CG and EG, a linear mixed-effects model (LMM) of HbO data was employed to analyze the effect of ES on the activation of MNN.
A total of 102 healthy adults were recruited and 72 participants’ data were analysed in the final report. The block averaged Hb data showed that HbO concentration increased and HbR concentration decreased in most MNN regions during ME and MI in both groups. The LMM results showed that ES can significantly improve the activation of inferior frontal gyrus, middle frontal gyrus, and precentral gyrus during MI, the supplementary motor area, inferior parietal lobule, and superior temporal gyri showed increased activation, but without statistical significance. Although the results did not reach statistical significance during ME, ES still showed positive effects on increased overall activations.
In this study, we present potential novel rehabilitation approaches that combines MNN strategies and low-frequency ES to enhance cortical activation. Our results revealed that ES has potential to increase activation of most MNN brain areas, providing evidence for related rehabilitative interventions and device development.
This study was registered on the China Clinical Trial Registration Center (identifier: ChiCTR2200064082, registered 26, September 2022, https://www.chictr.org.cn/showproj.html?proj=178285).
Graphical Abstract
Keywords
- mirror neuron network
- motor imitation
- motor execution
- electrical stimulation
- functional near-infrared spectroscopy
Mirror neuron network (MNN) has received much attention in recent years due to its potential application in developing novel rehabilitation strategies [1]. Action observation, imagery, and imitation are all typical useful methods to promote motor execution (ME), the effects of related treatment techniques in various diseases have been verified [2]. Neural plasticity, brain structural and functional reorganization have been the foundations of modern neurorehabilitation [3]. The brain plasticity changes induced by activation of MNN is one of the neural mechanisms underlying related interventions, which has the potentials to improve motor, speech, swallowing, and cognitive functions [4, 5, 6].
A fundamental question in neurorehabilitation is how to find therapeutic strategies to elicit long-time changes via motor learning strengthening [7]. Noteworthy, MNN-based rehabilitation methods have been used in stroke, cerebral palsy, and Parkinson’s disease [8, 9, 10, 11]. Enhancing brain activation as much as possible via comprehensive treatments plays a crucial role in rehabilitation process [12]. Therefore, an important research question is how to further improve the cortical activation of MNN to promote neuroplasticity. Another major challenge that therapists meet is how to improve patients’ involvement and motivation during the long period of rehabilitation sessions [13]. How to further improve effects and efficiency of MNN based treatments and make them more interesting and attractive is a major concern in clinical rehabilitation.
To improve motor performance via enhanced brain activation is a key topic in rehabilitation science. The MNN brain regions construct an observation execution matching system (OEMS), including the inferior frontal gyrus (IFG), premotor cortex (PMC), inferior parietal lobule (IPL) and superior temporal gyri (STG) as its core [14]. The OEMS is crucial in observing, imagining, understanding, and imitating biological motions, thereby playing an essential role in neurorehabilitation [15]. The MNN-based rehabilitation methods could be applied individually or in combination, such as observing others perform actions, executing the same tasks, or internally representing actions at visual and/or kinesthetic levels [16]. Motor imitation (MI) is a complex physiological process including motor observation, motor understanding, motor execution, and related cognitive elements [17]. MI is an effective strategy to engage brain regions critical for processing and producing actions and gestures, mainly including middle/inferior frontal gyrus (MIFG) and middle/superior temporal gyrus (MSTG) [4]. It is common to use MI as a method to improve motor learning and relearning in physiotherapy sessions, the clinical effects thereof have been proven by a wide range of studies [9, 15, 18].
Another important trend in physiotherapy is the combination of motor and cognitive rehabilitation tasks [19]. Observation, imagery, and illusion of the trained actions formed common cognitive strategies to facilitate the recovery of upper limb motor functions [20]. It is also best to use these strategies comprehensively to facilitate each other, for example, observation is able to improve imagery ability and enhance understanding of the actions, thus improving motor recovery [21].
Motor cognitive dual-task training has become a new type of rehabilitation training and been used in different kinds of patients [22, 23]. In clinical practice, it is common to combine different methods to make comprehensive rehabilitation plans for better effects, it has been proved that dual-task training plus action observation and imagery has better effects on both motor and cognitive functions, which may enhance the functional and structural connections of different neural circuits [24]. In addition, the MNN’s role in embodied cognition is also helpful to enhance sensorimotor integration, which is an important part of the neurorehabilitation mechanisms [25].
In recent years, the theory that central-peripheral synchronous stimulation may enhance neural plasticity has gained much attention and been used to guide clinical work [26]. Synchronous application of top-down interventions targeting the brain and bottom-up interventions targeting the muscle or peripheral nerve may further enhance each other to achieve synergistic effects [27]. Common top-down interventions mainly include emerging non-invasive brain stimulation (NIBS) techniques, including transcranial direct current stimulation (tDCS), transcranial magnetic stimulation (TMS), transcranial alternating current stimulation (tACS), transcranial ultrasound stimulation (TUS), transcranial photobiomodulation (tPBM), and MNN-based rehabilitation strategies [28, 29, 30, 31]. Common bottom-up interventions include vagus nerve stimulation (VNS), peripheral electrical stimulation (PES), neuromuscular electrical stimulation (NMES), and functional electrical stimulation (FES) [32, 33, 34]. Therefore, it is important to find peripheral stimulation techniques that can be combined with or synchronized with the above-mentioned MNN-based rehabilitation techniques, which may induce enhanced brain activation. For example, Seitz et al. [35] reported increased plasticity change in primary motor cortex (M1) brain area when applying action observation, imagery and PES synchronously, compared with using each one separately.
One of the most widely used physiotherapy techniques is low-frequency electrical stimulation (ES), which is able to enhance sensory inputs and improve muscle activation [36]. In addition, ES is able to stimulate sensory receptors in the skin and peripheral nerve to generate multi-sensory inputs, including tactile, joint kinesthesia, and position sensory inputs, which may provide feedback to the motor control and planning neural pathway [37]. Furthermore, the improved motor quality and amplitude evoked by ES provide visual feedback information to the central nervous system (CNS), which can modulate cortical activation and functional connectivity (FC) of the related brain regions [38]. In clinical settings, therapists often utilize ES to facilitate motor performance, because it is helpful to improve sensorimotor function in healthy individuals and patients [39]. ME and MI combined with ES may be prosperous methods in rehabilitation fields. Moreover, ES has the potential to improve the brain activation and enhance the brain signal quality in populations with neurological diseases, this is useful in neurobiofeedback and brain computer interface (BCI) design and application [40]. Regarding this concern, Son et al. [41] used action observation therapy combined with FES to promote the activation of MNN, thus improving the system performance of BCI based upper limb rehabilitation system.
As a commonly used rehabilitation tool, ES has many therapeutic benefits, including muscle exercise, pain relief, spasticity reduction, and urinary incontinence management [39]. ES may evoke changes at the cortical, spinal cord, peripheral nerves, and muscle level, modulating the neural pathways and cortical networks to generate clinical benefits [39]. More recently, it is reported that ES assists activating a number of brain regions, including primary somatosensory cortex (S1), M1, supplementary motor area (SMA), middle frontal gyrus (MFG), superior parietal gyrus (SPG), prefrontal cortex (PFC), and primary sensory-motor cortex (SM1), which overlaps with the core MNN, these brain areas are the main regions of interest (ROIs) in this study [42]. It is an important research direction to synchronize the application of ES as a peripheral intervention method with the central intervention strategy based on MNN to enhance cortical activation.
Our previous study revealed that observation, execution, and imitation of hand actions combined with NMES could all activate MNN, and the activation amplitude differs across experiment conditions: execution and imitation activate MNN more than observation when combined with NMES [1]. Since there was no control group in the aforementioned study, despite proving brain activation during ME + ES and MI + ES, it is not clear whether there is difference between ME versus ME + ES and MI versus MI + ES. The combination of MNN strategies and ES formed novel methods that could improve rehabilitation effects and efficiacy, but the underlying neural activity has not been fully understood. In this study, we aimed to answer this research question by recruiting two groups of healthy individuals and using functional near-infrared spectroscopy (fNIRS) to detect brain activation of MNN during ME and MI with and without ES. Due to its non-invasive nature, portability, relative low cost, and the potential to be used in naturalistic scene, fNIRS has become a promising brain imaging tool for measuring hemodynamic changes related to motor, speech and cognitive tasks in rehabilitation treatment and rehabilitation engineering fields, it is able detect the hemoglobin (Hb) concentration changes, including oxy-hemoglobin (HbO), deoxy-hemoglobin (HbR) and total-hemoglobin (HbT) [43, 44, 45].
Our hypothesis was as follows: based on ME, the addition of action videos’ visual stimuli and the haptic and motion sensory inputs induced by ES could enhance the activation of MNN. There is a chance that central and peripheral stimuli could generate multi-sensory integration to improve brain plasticity and motor function recovery of patients.
A total of 102 healthy adults were recruited from Beijing Bo’ai Hospital, the China Rehabilitation Research Center (CRRC), Capital Medical University, and local communities from September 2022 to April 2024. A screening evaluation was conducted for each participant at the CRRC. After the screening phase, 81 participants meeting the eligibility criteria were randomly assigned to the control group or experiment group using a block randomization protocol. The random allocation sequence was generated by the R package blockrand v1.5 (https://cran.r-project.org/web/packages/blockrand/index.html); the block sizes were 6, 8 and randomly ordered; the allocation ratio was 1:1. We printed the randomization cards created by the blockrand package and enclosed them in sequentially numbered, opaque, sealed, and stapled envelopes. The allocation sequence was concealed from the study coordinator responsible for enrolling and evaluating participants. The corresponding envelope was opened only after all baseline evaluations had finished.
The inclusion criteria for this study were as follows: healthy adults (18–60 years old); right-handed, as assessed by a seven-item Short Form of Edinburgh Handedness Inventory (EHI) [46]; Mandarin language; absence of visual impairment; education level above junior high school; absence of drug and alcohol abuse history; absence of neurological or mental illness history. We excluded participants with skin injuries or skin diseases in the right arm; acute infections; metal implants; poor fNIRS signal quality caused by thick and strong hair; not willing to undergo testing because the fNIRS cap is too tight.
This study was approved by the Medical Ethics Committee of CRRC (Approval number: 2021-053-1). This study was registered in the China Clinical Trial Registration Center (Registration number: ChiCTR2200064082). All participants signed the appropriate informed consent form according to the Helsinki declaration.
The flow diagram of participant enrollment, randomized allocation, and analysis is shown in Fig. 1. The data of 72 participants was included in the final report, the demographic and head size information are shown in Table 1. Except for the length from nasion (Nz) to inion (Iz) (Nz-Cz-Iz), all the baseline characteristics between the two groups had no significant difference.
 Fig. 1.
Flowchart of participant enrolment, randomized allocation and analysis. Abbreviation: fNIRS, functional near-infrared spectroscopy; ES, electrical stimulation.
| Characteristics | Control, N = 361 | Experiment, N = 361 | p-value2 | |
| Age (year) | 24.00 (22.00, 31.50) | 23.00 (22.00, 28.00) | 0.2 | |
| Gender | Female | 17 (47%) | 16 (44%) | 0.8 |
| Male | 19 (53%) | 20 (56%) | ||
| Weight (kg) | 65.50 (58.75, 75.25) | 73.00 (64.50, 80.00) | 0.11 | |
| Height (m) | 1.69 |
1.72 |
0.12 | |
| BMI (kg·m-2) | 23.83 |
24.49 |
0.6 | |
| BMI category | Normal weight (18.5–24.9 kg·m-2) | 21 (58%) | 20 (56%) | |
| Obesity ( |
2 (6%) | 4 (11%) | ||
| Overweight (25–29.9 kg·m-2) | 10 (28%) | 9 (25%) | ||
| Underweight ( |
3 (8%) | 3 (8%) | ||
| Education (year) | 16.00 (16.00, 16.00) | 16.00 (16.00, 16.00) | 0.6 | |
| EHI (point) | 100.00 (100.00, 100.00) | 100.00 (100.00, 100.00) | 0.4 | |
| Nz-Cz-Iz (cm) | 33.00 (32.00, 34.00) | 31.00 (29.88, 32.00) | ||
| LPA-Cz-RPA (cm) | 37.00 (36.00, 39.13) | 38.25 (36.50, 39.50) | 0.6 | |
| Circumference (cm) | 56.75 (55.50, 59.00) | 58.00 (56.00, 59.00) | 0.2 |
*1n (%); Median (IQR); Mean
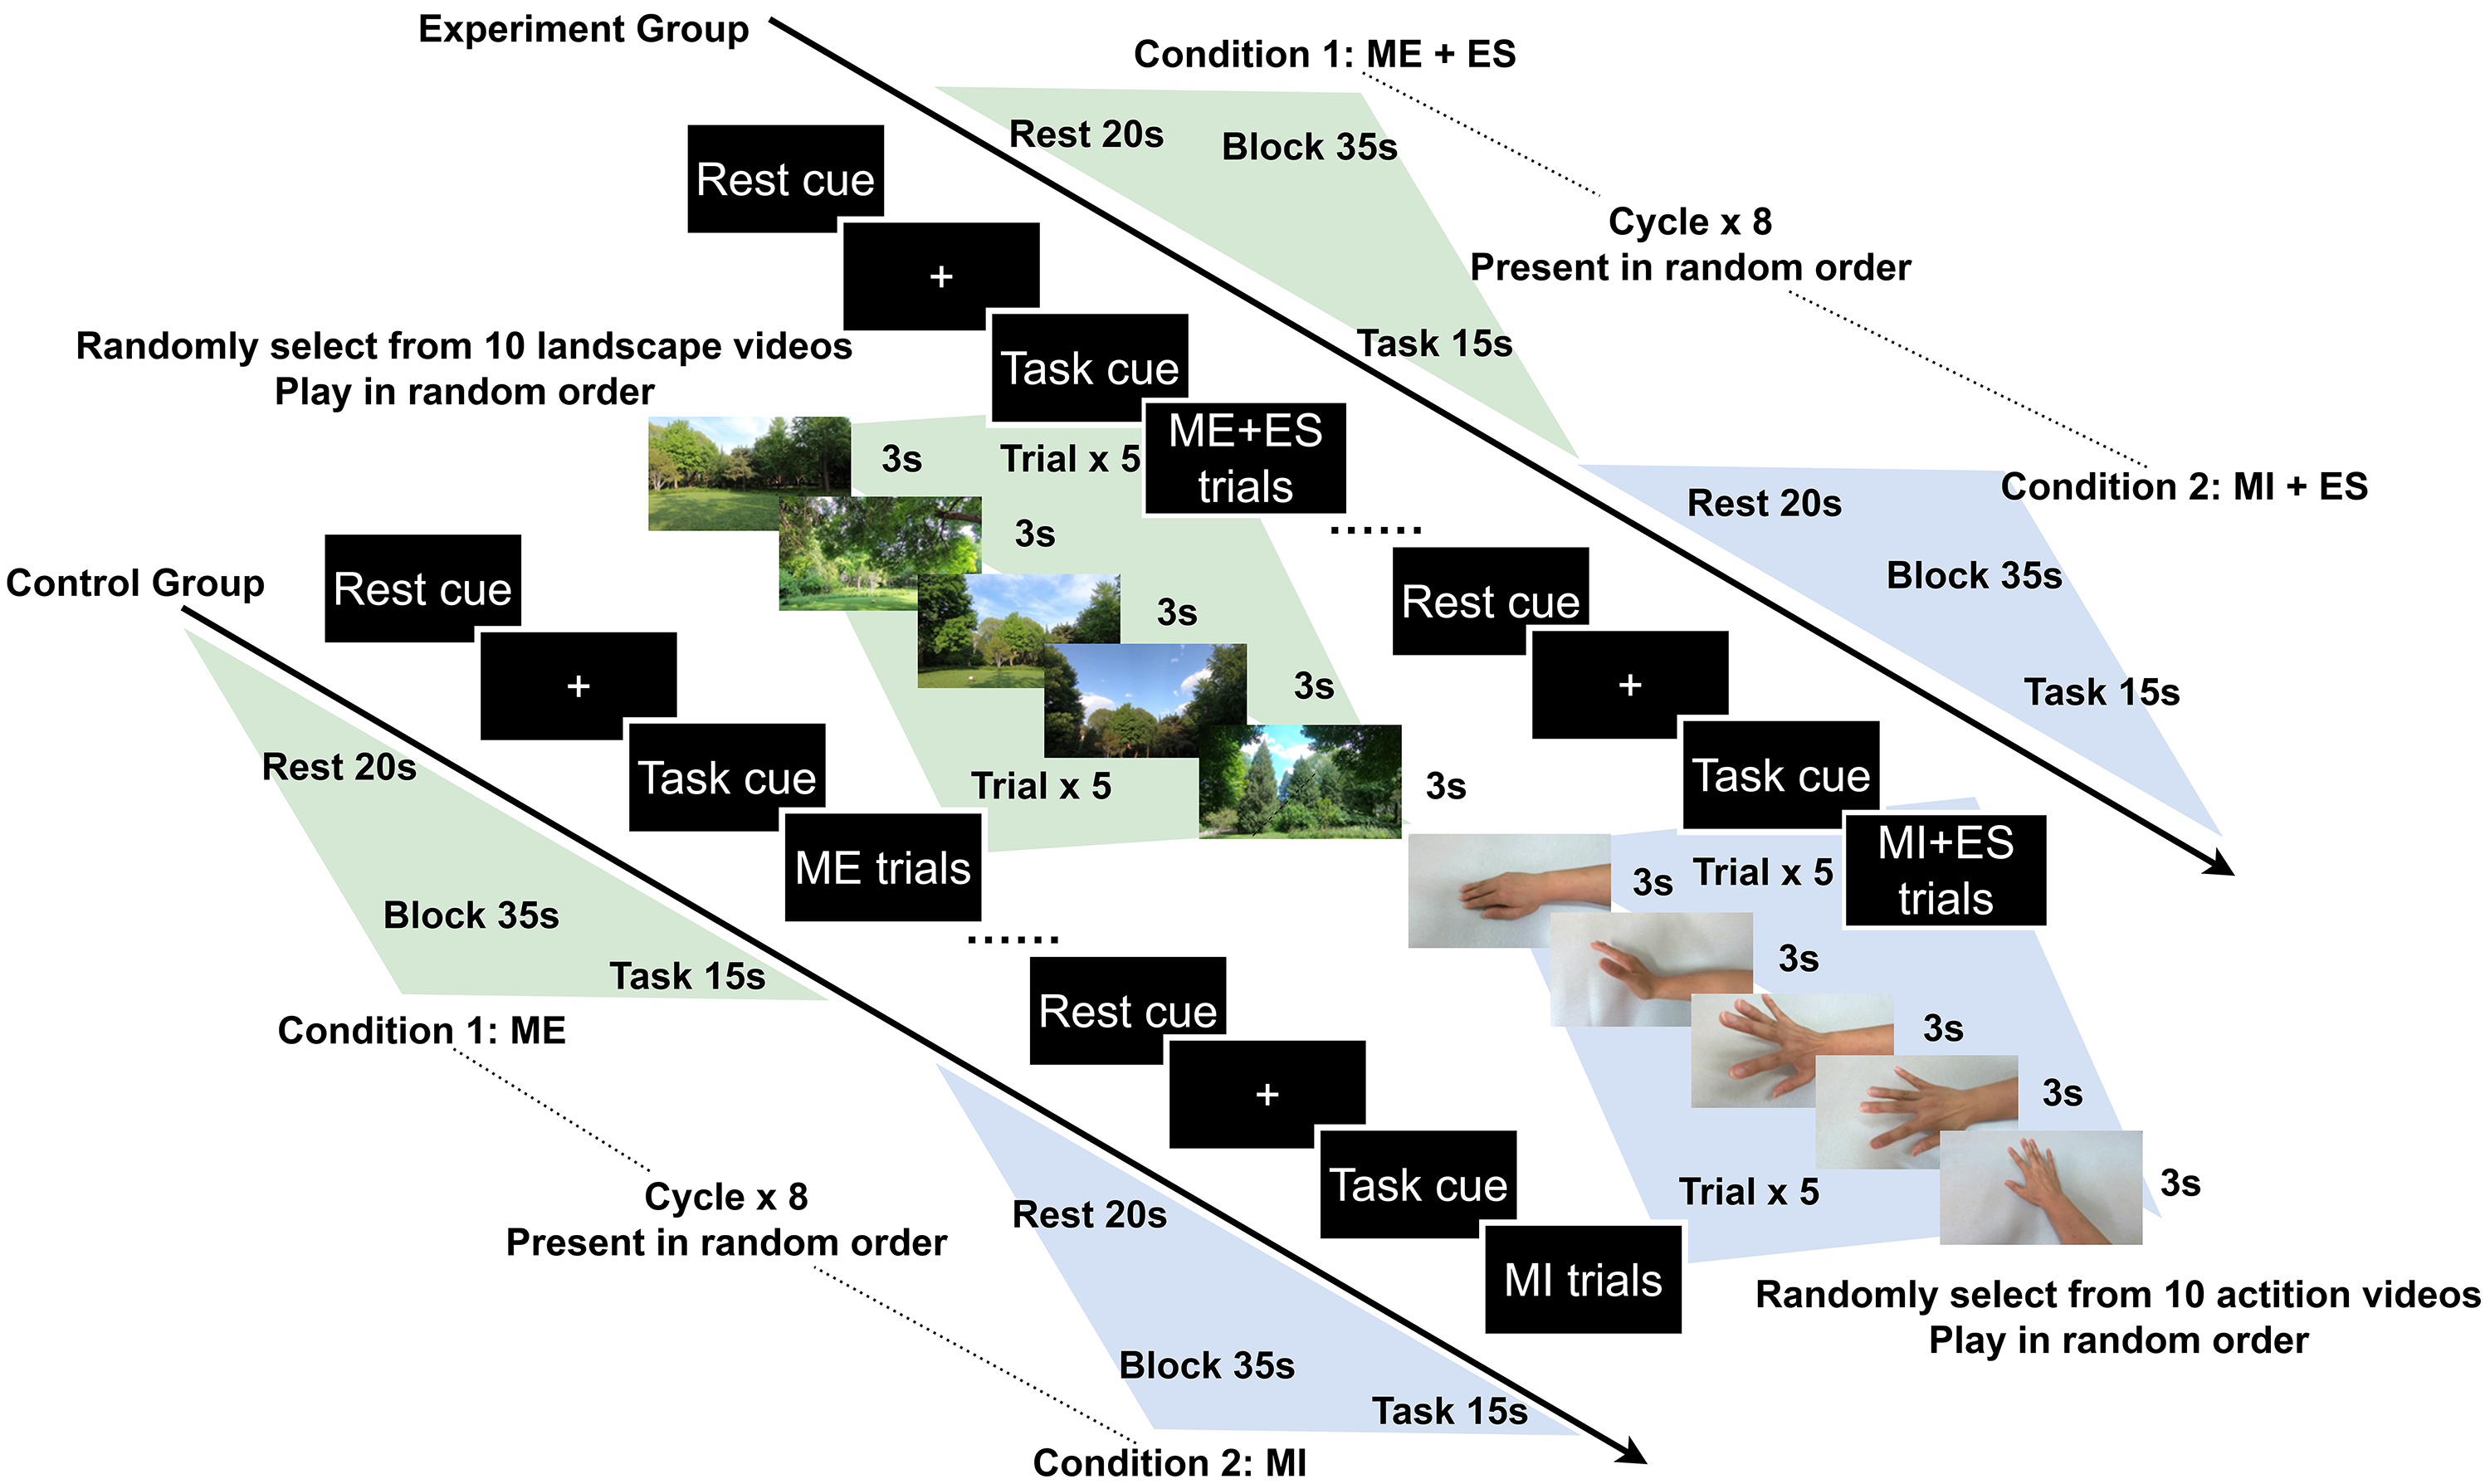
A block design experiment paradigm was utilized in our study. The task duration was 15 s and the inter-task rest duration was 20 s. During the ME condition, the participants performed right hand and wrist extension actions while watching scenery video clips. During the MI condition, the participants performed the same hand action while watching related first-person perspective action videos. The conditions and the video clips in each block were presented randomly. In one session, each task was repeated eight times, each block included 5 trials, each trial lasted 3 s, and the total duration of the assessment was approximately 10 min (Fig. 2).
 Fig. 2.
Schematic illustration of the experimental paradigm. Abbreviation: ME, motor execution; MI, motor imitation; ES, electrical stimulation.
Two computer programs were used and synchronized via Lab Streaming Layer (LSL) to conduct the experiment: (1) a Python program based on the PsychoPy 3.8 package (Open Science Tools Ltd., Nottingham, Nottinghamshire, UK) presenting the visual stimulus and sending makers to record tasks onsets; and (2) the Aurora recording software v2021.9.0.6 (NIRx Medical Technologies, Minneapolis, MN, USA) to record the fNIRS raw data with the markers from the PsychoPy 3.8 program [47]. A fixation cross was presented during the rest phase; 5 scenery videos randomly selected from 10 clips were displayed during ME phases; 5 hand action videos randomly selected from 10 clips were played during MI phase.
The experiment was conducted in a quiet and dark evaluation room. Participants
were instructed to sit in a chair and relax in a comfortable position while
wearing the fNIRS cap. Two 50
The fNIRS data were recorded using a portable continuous wave Nirsport2 (NIRx,
Minneapolis, MN, USA) device with eight dual-wavelength light-emitting diodes
(LED) centered at 769 and 850 nm sources and eight avalanche photodiode
detectors. The data were collected with a sample rate of 10 Hz. The custom
montage was designed using the fOLD toolbox (https://github.com/nirx/fOLD-public) and used in the fNIRS cap
configuration, which included eight sources and eight detectors, forming a total
of 20 source-detector pairs (channels) (
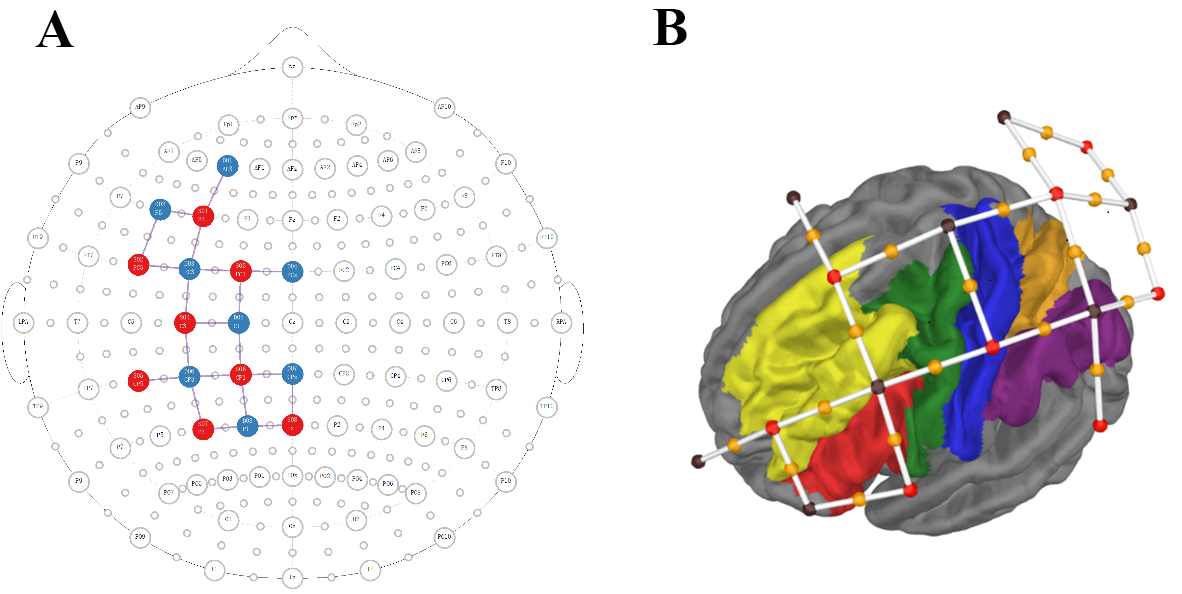 Fig. 3.
The custom fNIRS montage is shown in 2D (A) and 3D format (B). (A) Location of sources and detectors over 10–20 map. Sources are shown as red circles, detectors are shown as blue circles, and channels are shown as black lines. (B) Location of sources-detector pairs and channels over 3D brain surface and marked brain areas. Sources are shown as red dots, detectors are shown as black dots, and channels are shown as white lines with an orange dot (the midpoint of source-detector pairs). The brain areas covered by the montage are shown in different colors: Inferior Frontal Cortex, red; Premotor Cortex, green; Dorso Lateral Prefrontal Cortex, yellow; Somatosensory and Motor Cortex, blue; Superior Parietal Cortex, orange; Inferior Parietal Cortex, purple.
The EN-STIM 4 (ENRAF-NONIUS, Rotterdam, South Holland, Netherlands) apparatus was utilized to generate electrical current output during the task periods and drop to 0 mA during the rest periods (Fig. 2). A custom ES protocol was designed: rectangular waveform, 200 µs phase duration, 50 Hz pulse frequency; 1 Hz burst frequency, 1 s ramp up time, 15 s hold time, 1 s ramp down time, and 18 s interval time. The intensity of the electrical current for each participant in the experiment group was individualized to minimize evoked muscle contractions and avoid discomfort.
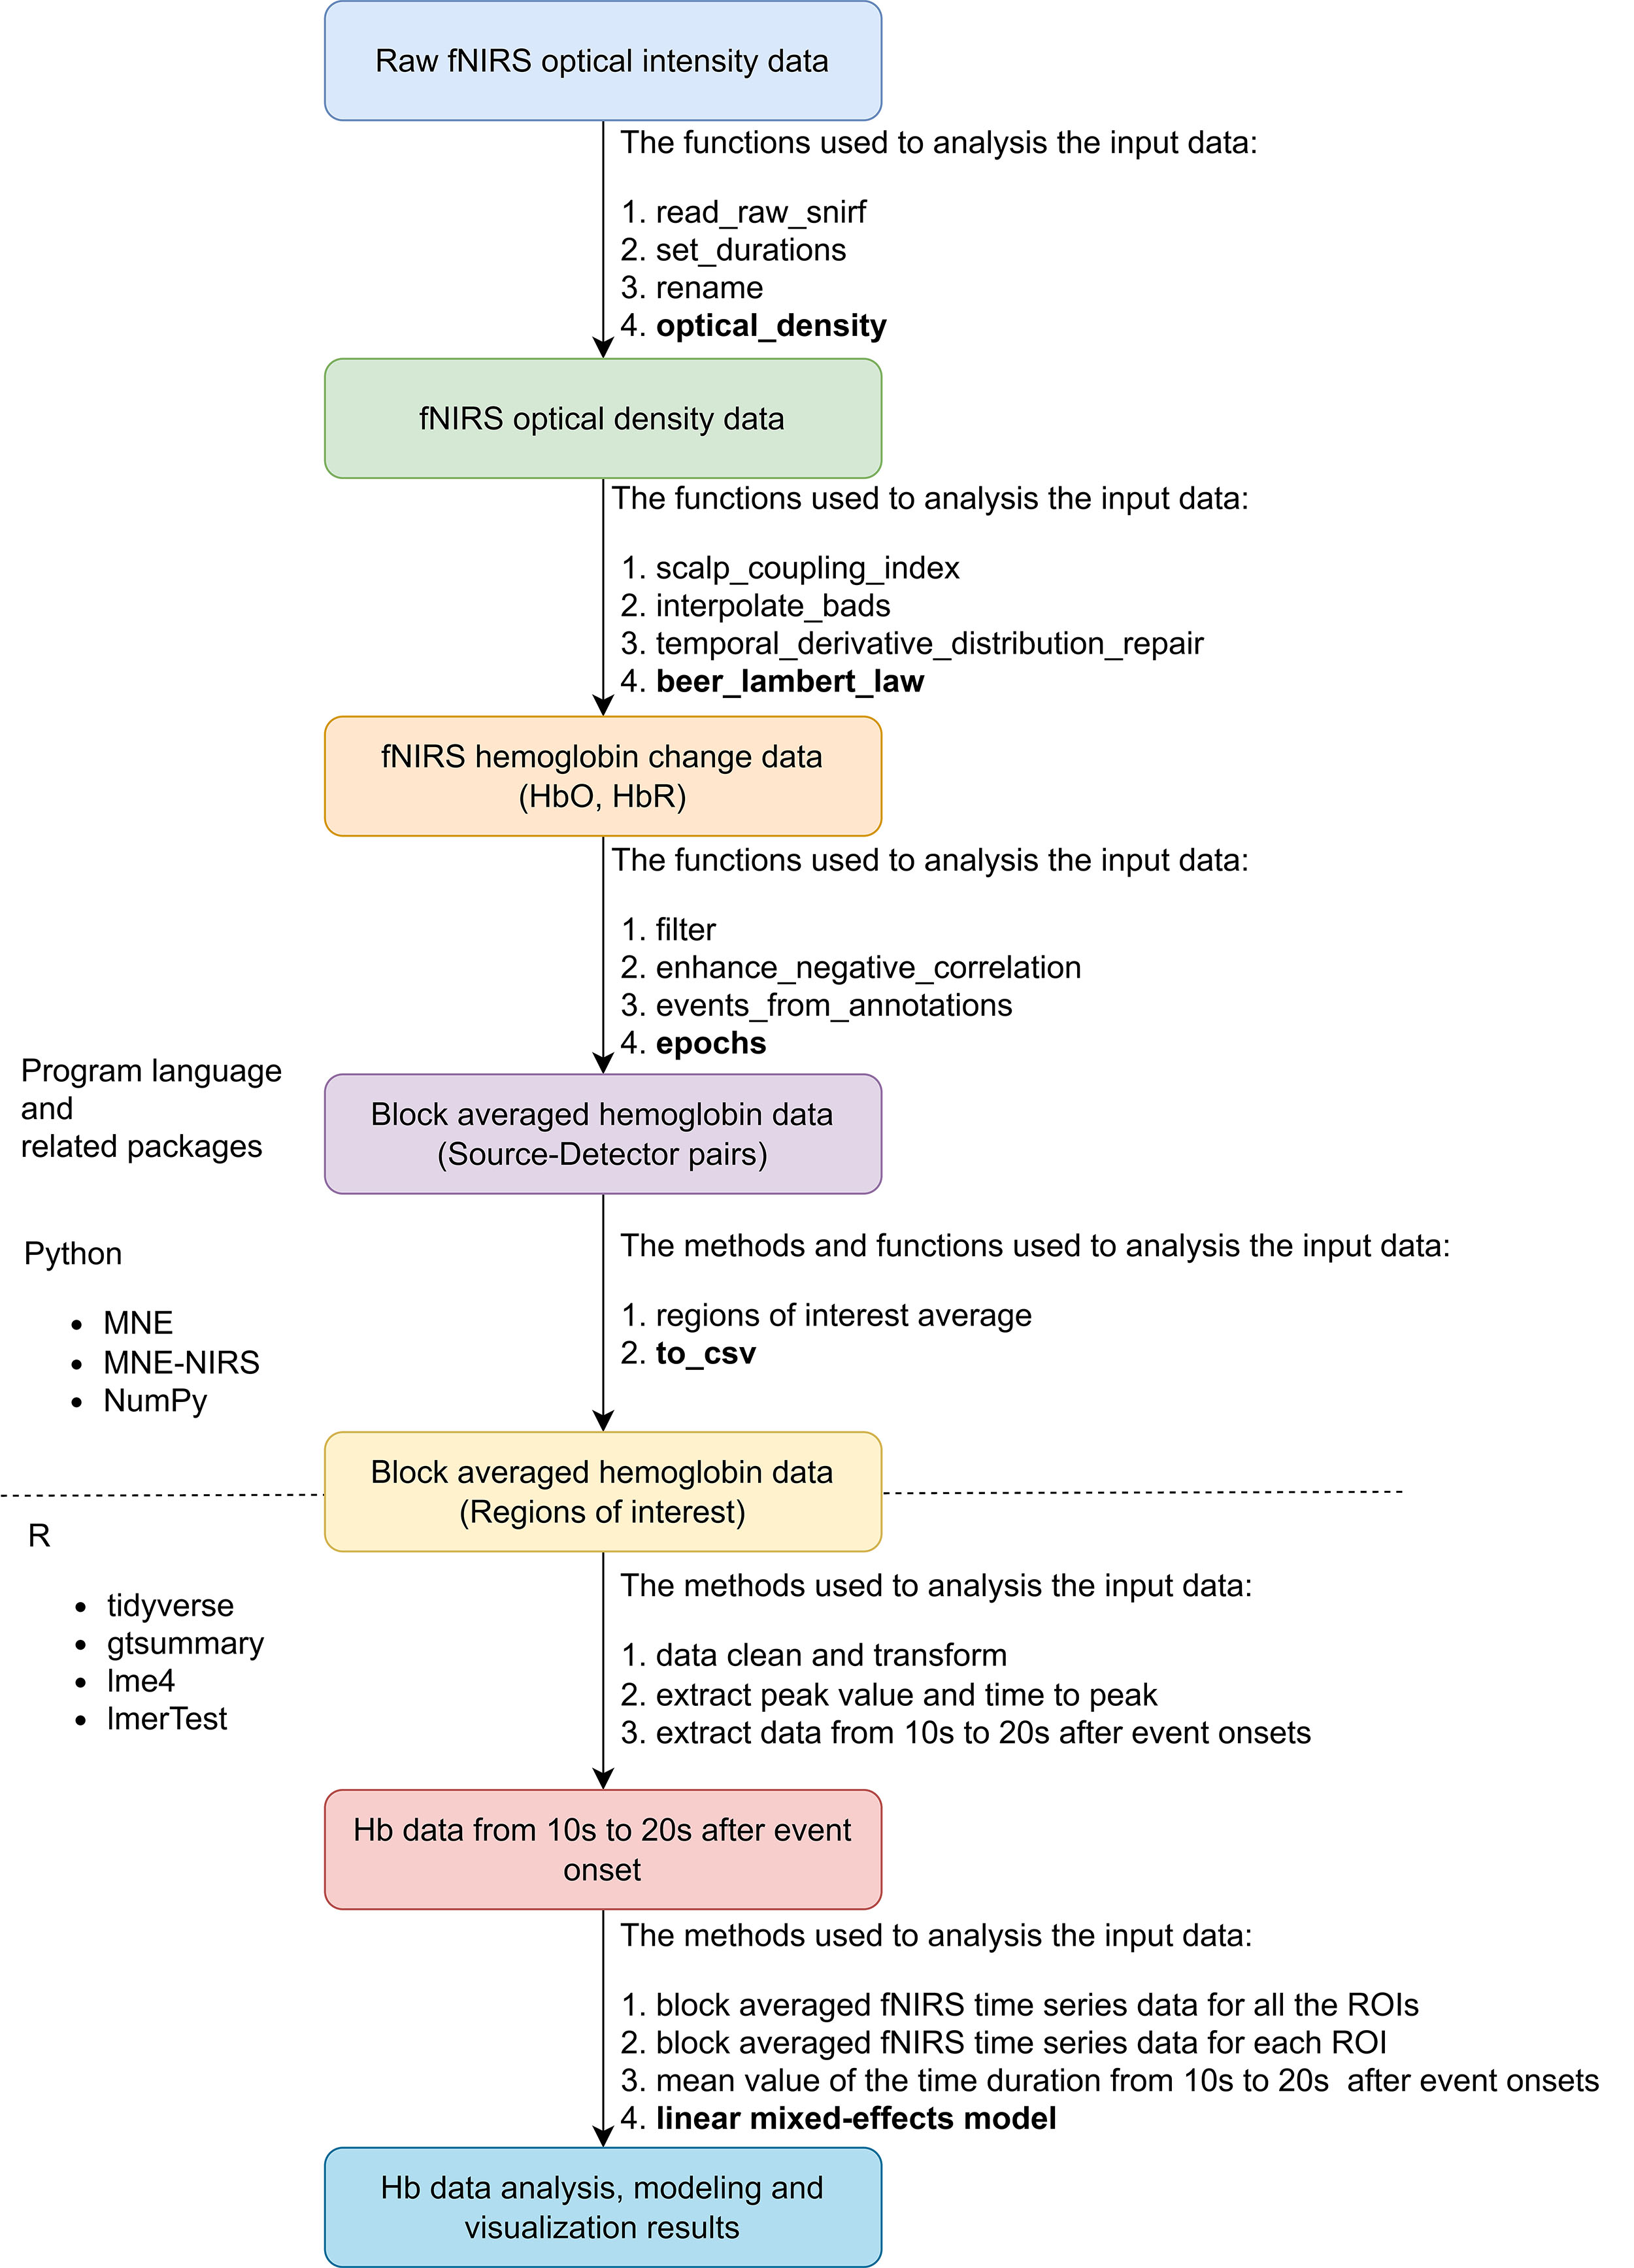
The overall pipeline of the fNIRS data preparation, preprocessing, and analysis is shown in Fig. 4. As there is no standard for fNIRS data preprocessing and analysis, the processing methods were based on expert consensus on fNIRS used in rehabilitation and motor study fields [49, 50]. The recorded fNIRS raw data of all the participants were saved in folders organized with a hierarchical structure. A custom Python script based on the MNE-BIDS Python library (https://github.com/mne-tools/mne-bids) was used to manage the fNIRS data [50]. We used the MNE-NIRS (https://github.com/mne-tools/mne-nirs) and MNE Python (https://github.com/mne-tools/mne-python) libraries to preprocess the fNIRS raw time series data and extract all evoked block averaged data [51]. The automated anatomical atlas (AAL) 2 was used to represent the brain regions of left MNN, 8 ROIs were matched with this montage: Frontal_Inf_Tri_L, IFG; Frontal_Mid_2_L, MFG; Frontal_Sup_2_L, superior frontal gyrus (SFG); Parietal_Inf_L Inferior, IPL; Parietal_Sup_L, SPG; Postcentral_L, postcentral gyrus; Precentral_L, Precentral gyrus and Supp_Motor_Area_L, SMA [52].
 Fig. 4.
Overview of fNIRS data preprocessing and analysis pipeline. Abbreviation: fNIRS, functional near-infrared spectroscopy; snirf, shared near-infrared spectroscopy; Hb, hemoglobin; HbO, oxy-hemoglobin; HbR, deoxy-hemoglobin; ROI, region of interest; csv, comma-separated values; NIRS, near-infrared spectroscopy.
The individual-level analysis steps were as follows. (1) Imported the raw fNIRS
optical intensity data saved in the shared near-infrared spectroscopy format
(.snirf) [53], set the durations of each stimulus to 15 seconds for all the
conditions, and renamed the trigger codes to mark the events. Then, converted the
raw light intensity values to optical density (OD) values; (2) Quantified the
quality of the data by calculating the scalp coupling index (SCI); then,
interpolated the bad channels on the threshold of SCI
The group-level analysis steps were as follows. (1) Computed the epoch data of mean and standard error (SE) for all the channels and ROIs, and visualized them in a line plot to present the change of HbO data and the time characteristics thereof; (2) As HbO data is more sensitive in response to the stimulus and has a higher signal-to-noise ratio (SNR), we used the HbO data to build linear mixed-effects models (LMMs); (3) thus, to test the brain activation patterns and the factors influencing the HbO change significantly, with the average HbO concentration change in a specific duration as a dependent variable, fixed effects were tested for groups, ROIs, and conditions and their interactions. The participants were treated as random intercepts; ROIs were treated as a random slope. The means of F-tests with Satterthwaite’s method was used to evaluate the significance of the fixed effects [55]. The main R packages used for data transformation, analysis and visualization were Tidyverse (https://cran.r-project.org/web/packages/tidyverse/index.html) and gtsummary (https://cran.r-project.org/web/packages/gtsummary/index.html) packages; lme4 (https://cran.r-project.org/web/packages/lme4/index.html) and LmerTest (https://cran.r-project.org/web/packages/lmerTest/index.html) were used for LMMs model building.
The normally distributed continuous variables, confirmed by the Shapiro-Wilk
normality test, were described as mean
Block averaged HbO and HbR time series data of all the channels for each group and condition is shown in Fig. 5. The HbO concentration increases and HbR concentration decreases, which represents the cortical activation of the whole MNN. Averaged HbO and HbR time series data for each ROI and both conditions and groups are shown in Fig. 6.
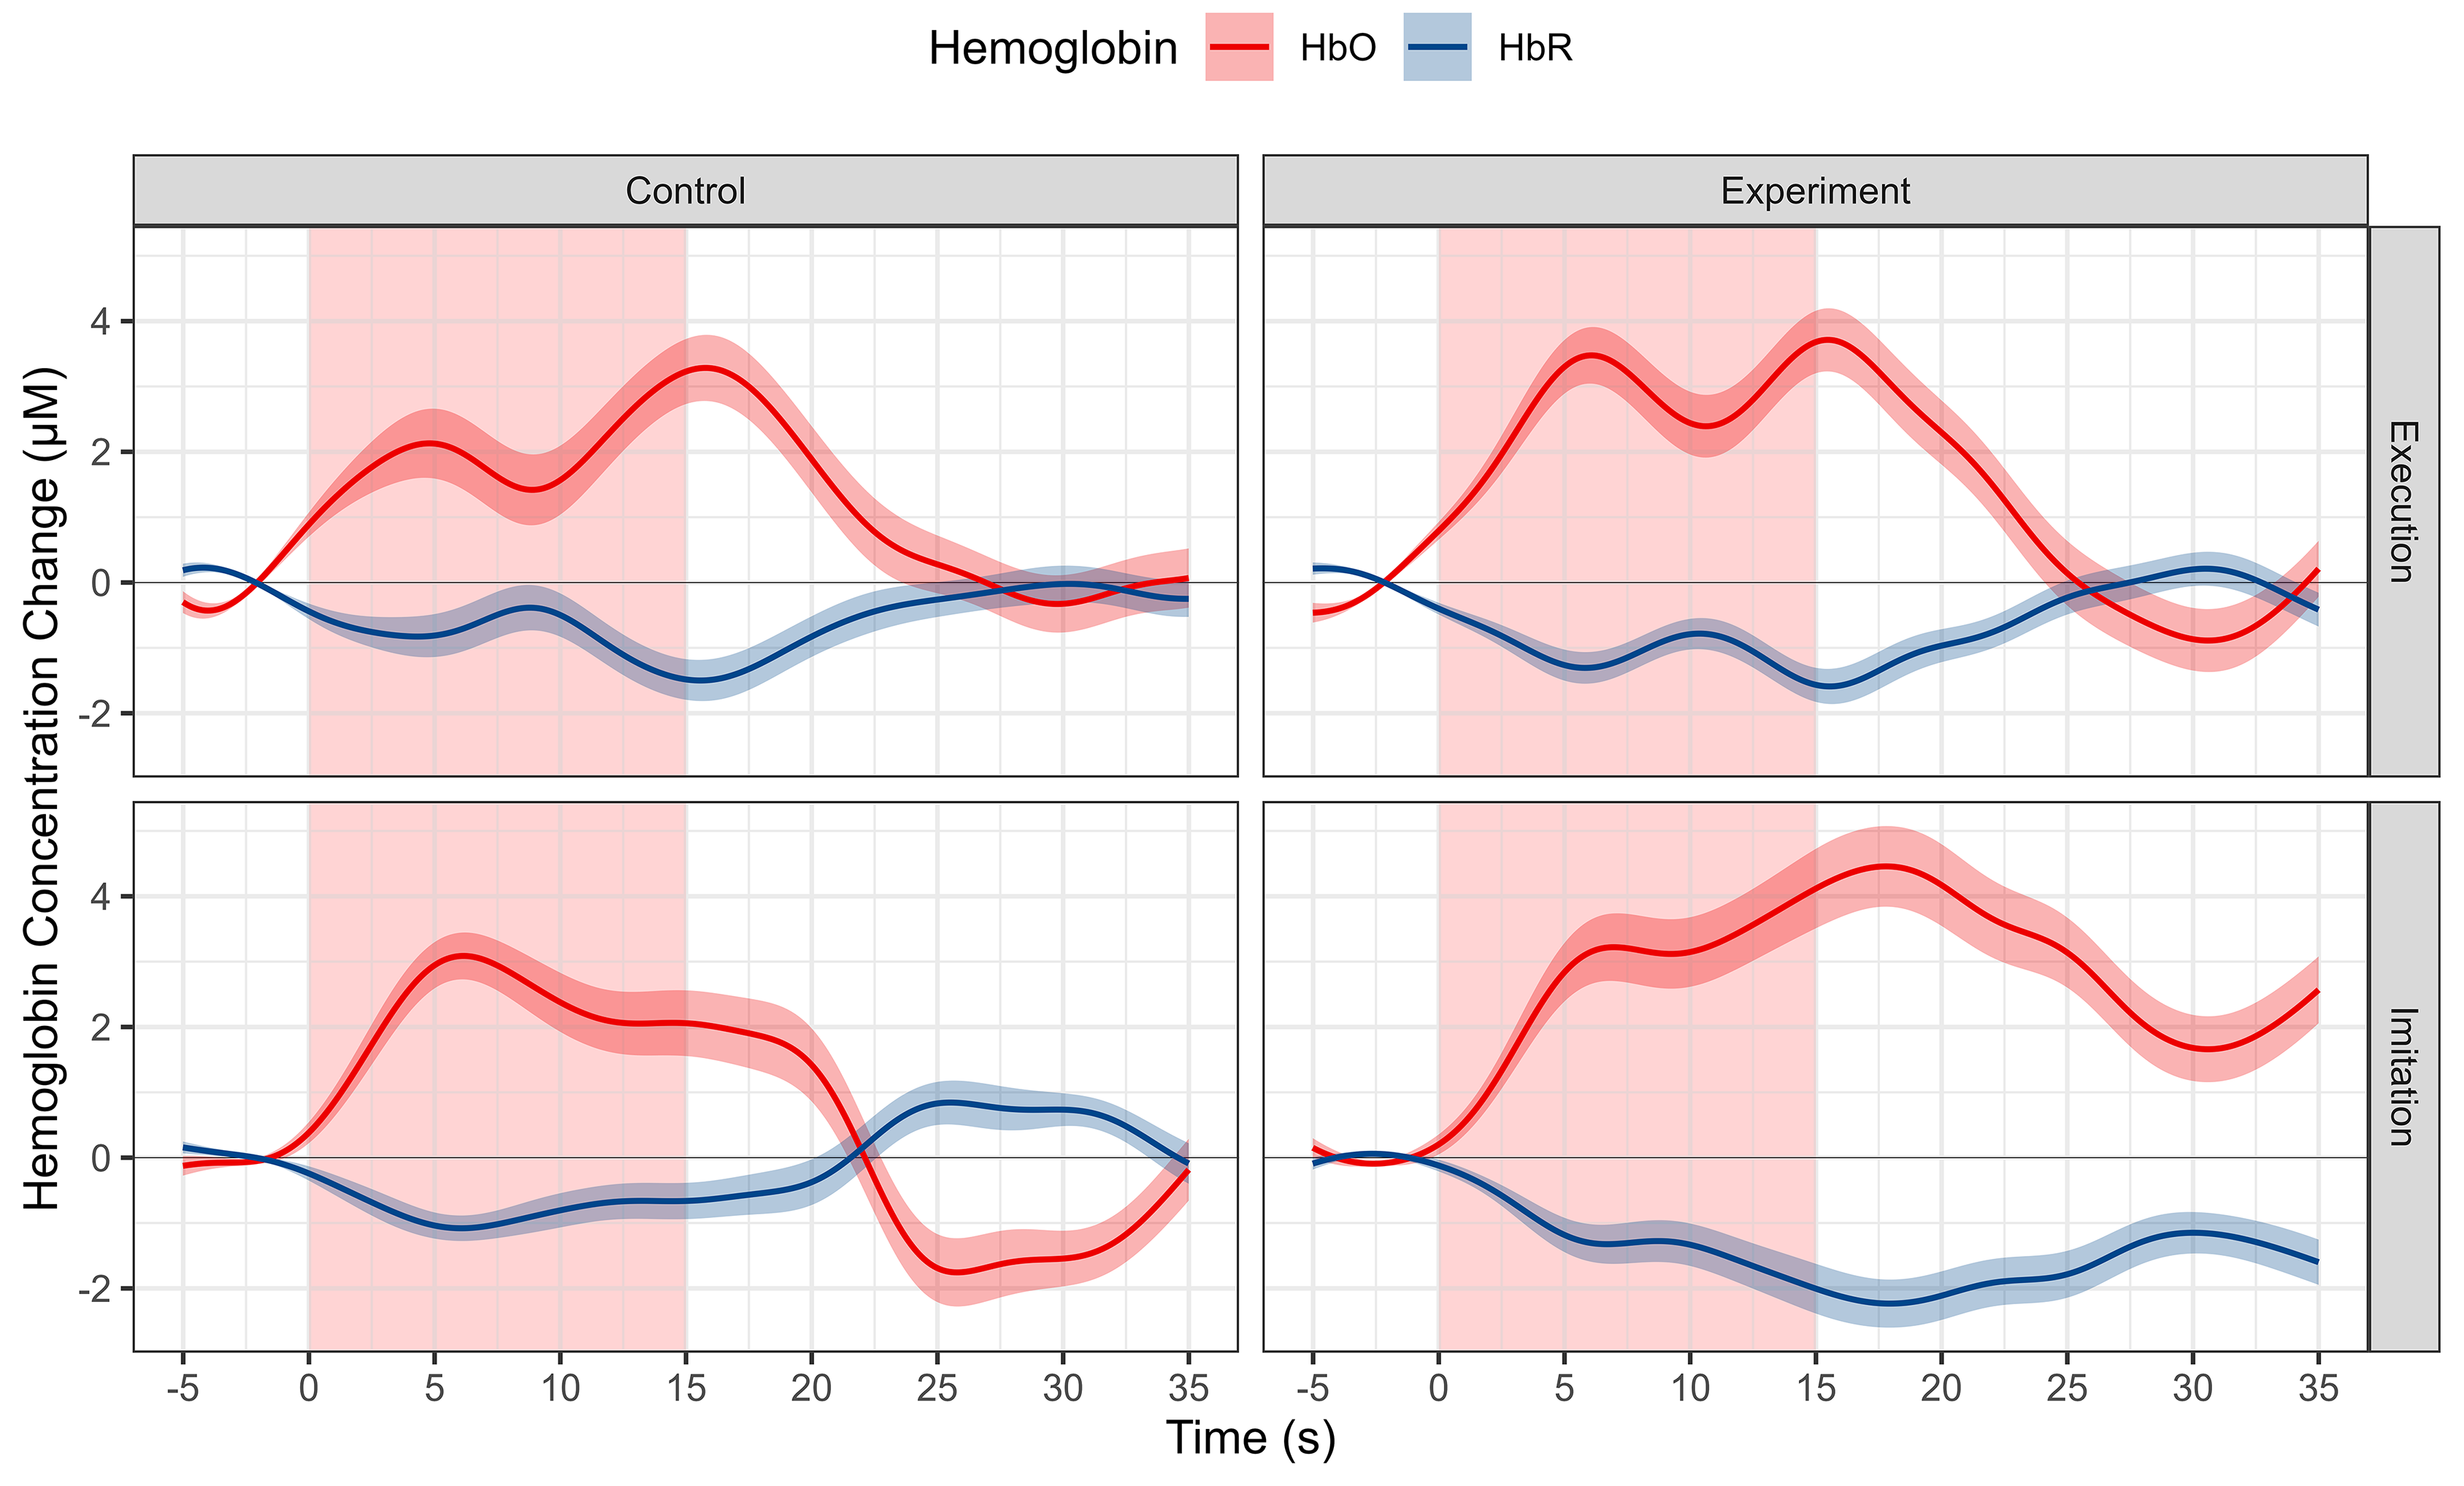 Fig. 5.
Morphology of fNIRS responses of the whole MNN using the block averaging approach for different conditions and groups. Each column represents a different group. Each row represents a different condition. Red represents HbO, and blue represents HbR. Shaded lines indicate SE. Abbreviation: HbO, oxy-hemoglobin; HbR, deoxy-hemoglobin; SE, standard error; MNN, Mirror neuron network.
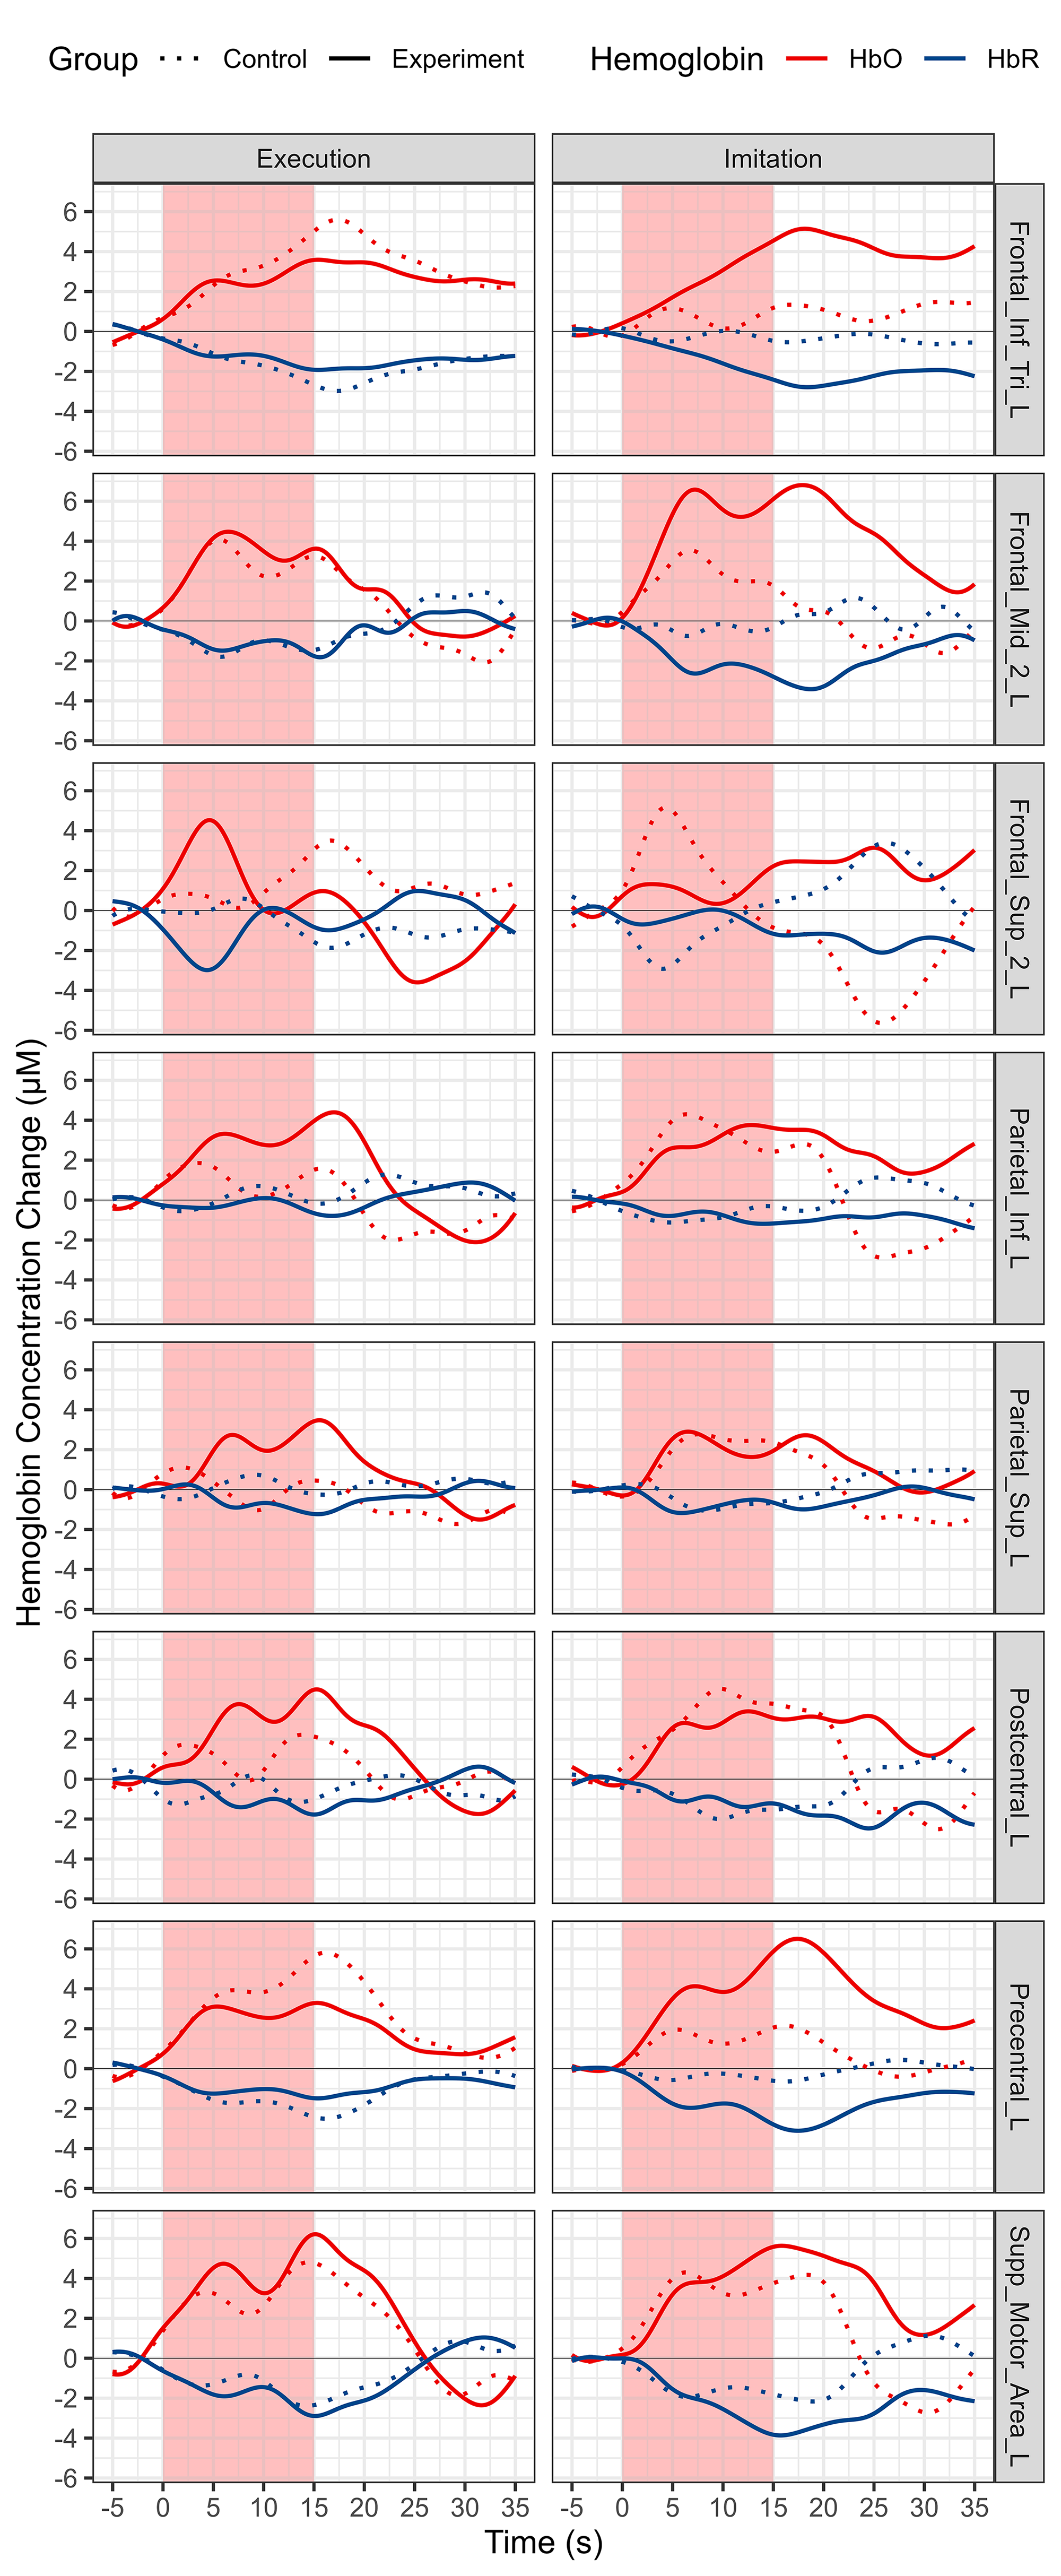 Fig. 6.
Morphology of fNIRS responses using the block averaging approach for all ROIs, conditions and groups. Each column represents a different condition. Each row represents a different ROI. Red represents HbO, and blue represents HbR. Solid line represents experiment group, and dotted line represents experiment group. Abbreviation: HbO, oxy-hemoglobin; HbR, deoxy-hemoglobin.
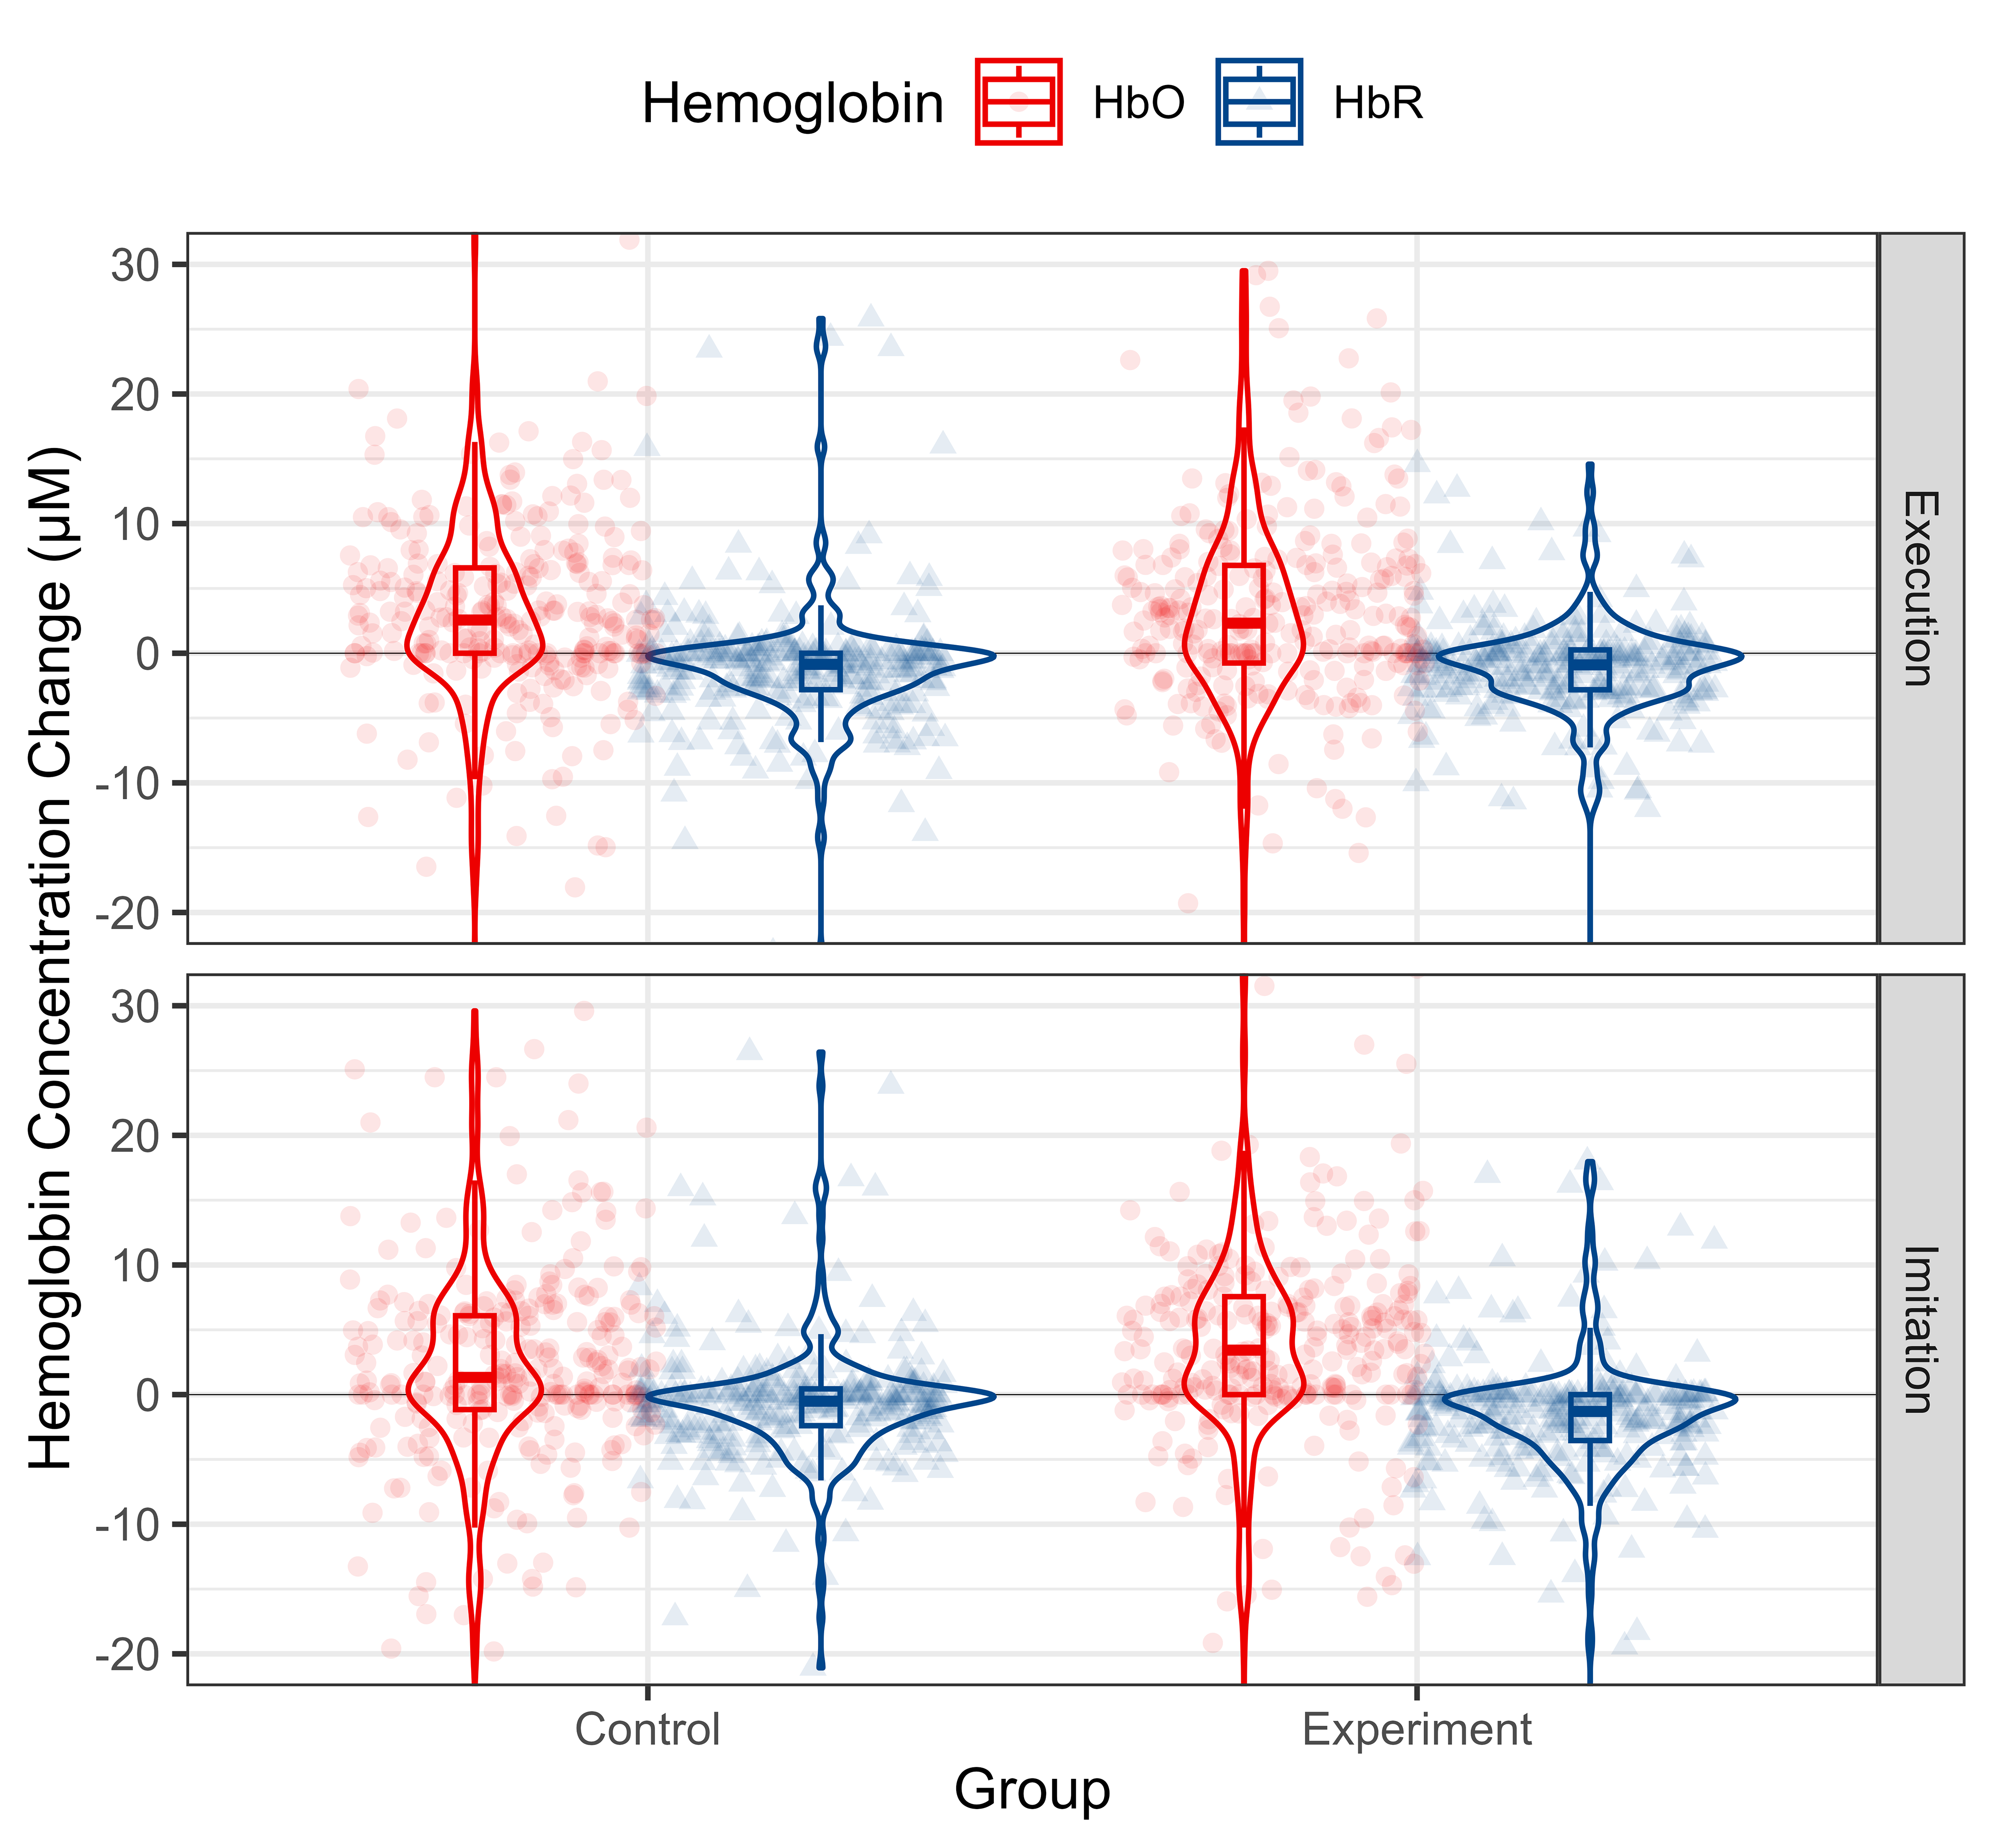
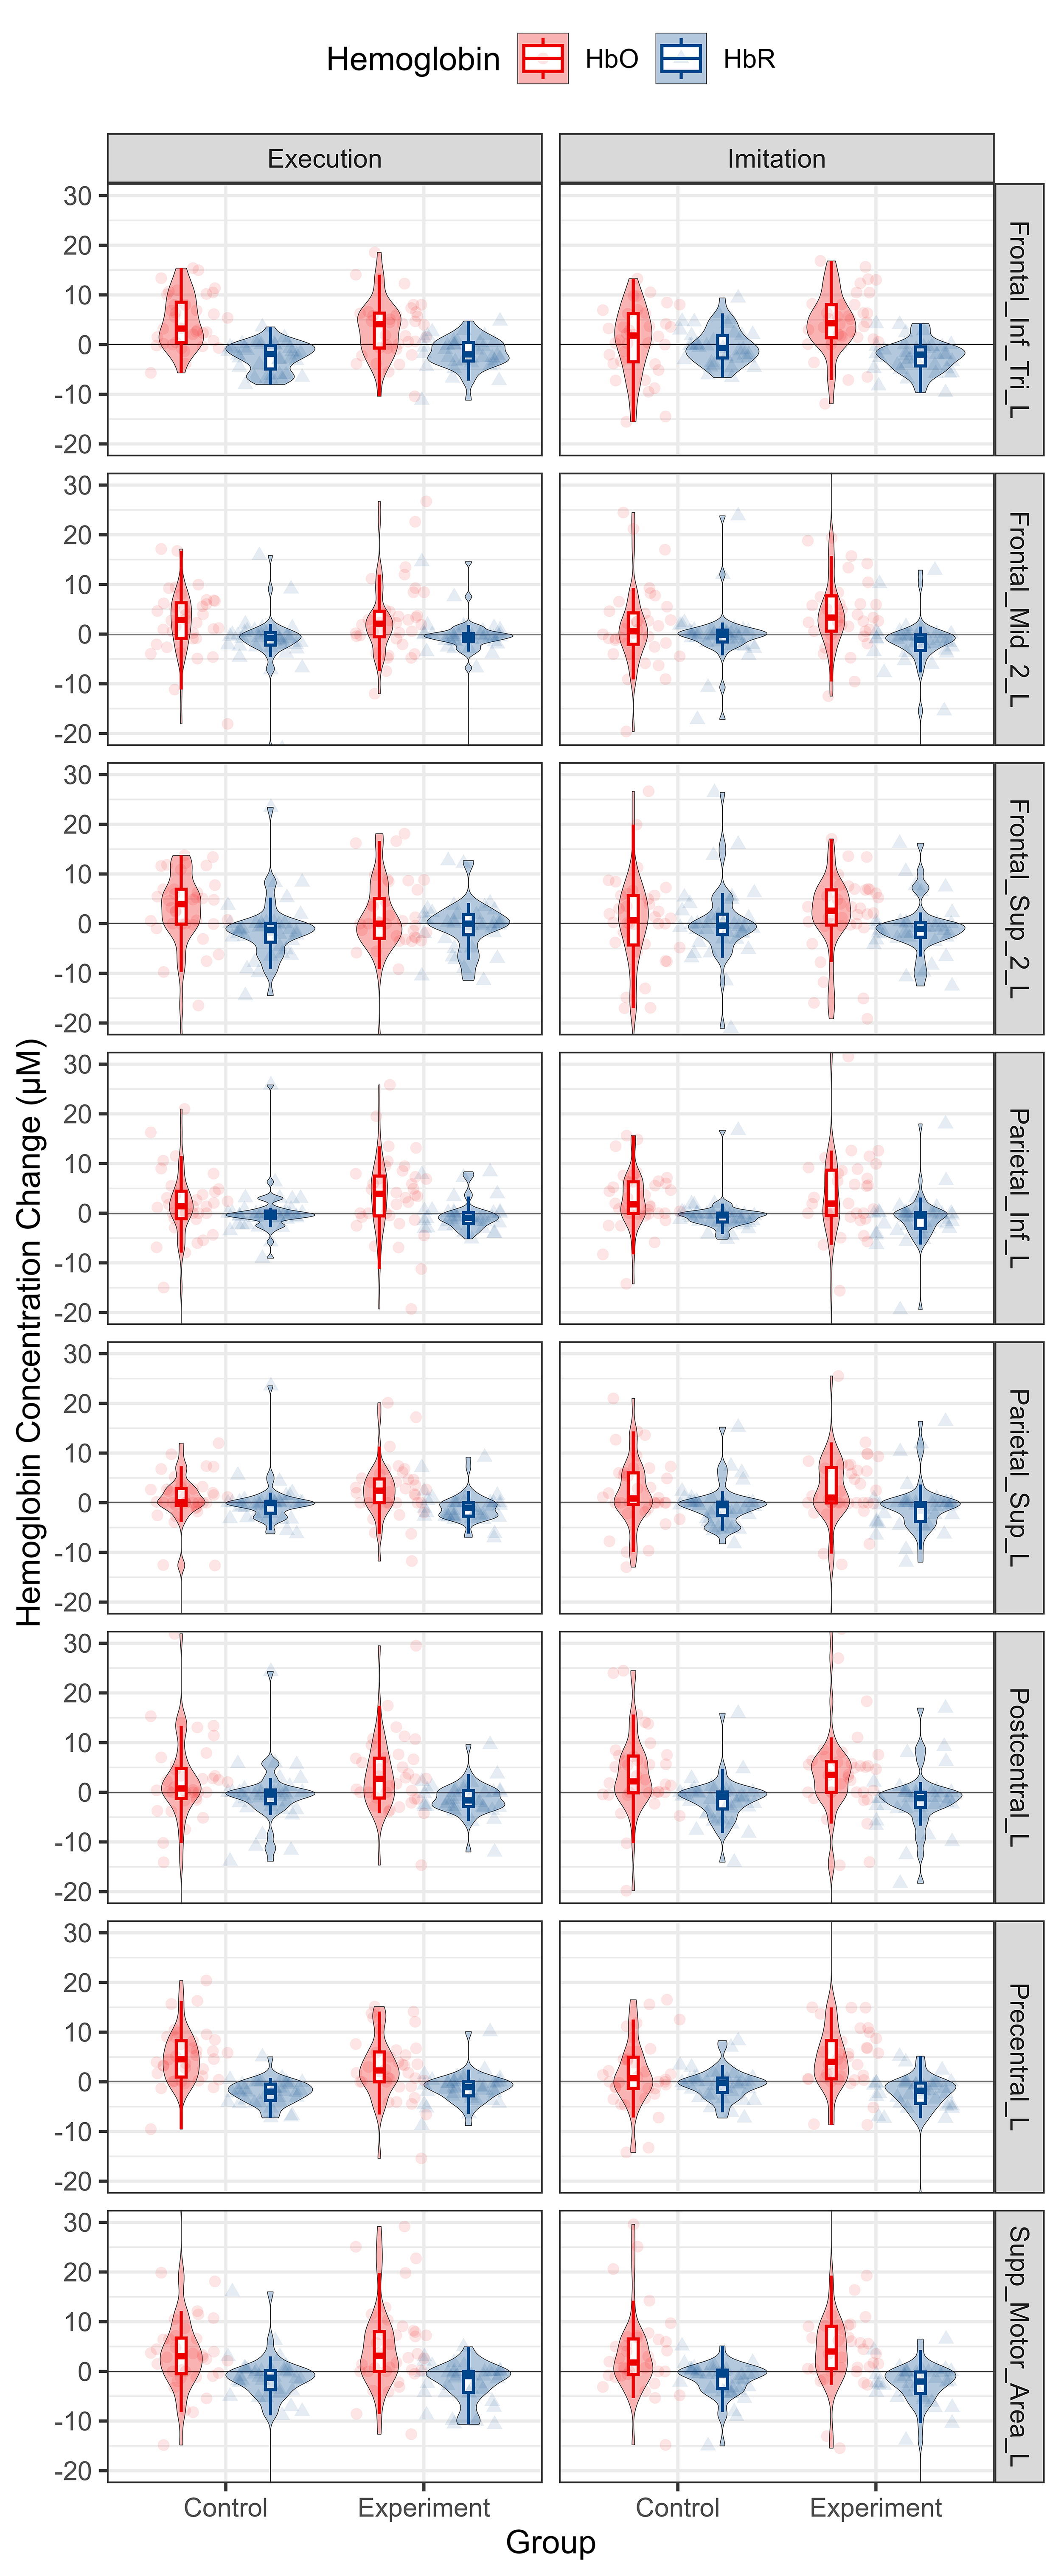
According to the observation of time to peak, we extracted Hb data from 10 s to 20 s after the onset of the tasks and computed the mean value thereof to reflect the cortical activation level. The distribution of Hb concentration mean value from 10 s to 20 s after the onset for each group and condition is shown in Fig. 7. The data for each ROI is shown in Fig. 8.
 Fig. 7.
Descriptive statistics of Hb concentration mean value from 10 s to 20 s after the onsets of the whole MNN for different conditions and groups. HbO and HbR data are shown in red and blue, respectively. Each column represents a different group. Each row represents a different condition. Abbreviation: HbO, oxy-hemoglobin; HbR, deoxy-hemoglobin.
 Fig. 8.
Descriptive statistics of Hb concentration mean value from 10 s to 20 s from onsets per group, condition and ROI. HbO and HbR data are shown in red and blue, respectively. Each column represents a different condition. Each row represents a different ROI. Abbreviation: HbO, oxy-hemoglobin; HbR, deoxy-hemoglobin.
Regarding cortical activation during ME condition, the estimated hemodynamic activation in different ROIs of MNN evoked by ME with and without ES are shown in Table 2 and Fig. 9. Regarding cortical activation during MI condition, the estimated hemodynamic activation in different ROIs of MNN evoked by MI with and without ES are shown in Table 3 and Fig. 9.
| ROI | Group | Estimate (µM) | SE | 95% CI | t | p-value | q-value |
| Frontal_Inf_Tri_L | Control | 4.708 | 1.224 | 2.306–7.109 | 3.846 | 0.000*** | 0.001** |
| Experiment | 3.271 | 1.224 | 0.870–5.673 | 2.672 | 0.008** | 0.027* | |
| Frontal_Mid_2_L | Control | 2.565 | 1.400 | –0.182–5.312 | 1.832 | 0.068 | 0.109 |
| Experiment | 2.946 | 1.400 | 0.199–5.693 | 2.104 | 0.037* | 0.069 | |
| Frontal_Sup_2_L | Control | 2.510 | 1.534 | –0.500–5.521 | 1.636 | 0.104 | 0.158 |
| Experiment | 0.371 | 1.534 | –2.639–3.381 | 0.242 | 0.809 | 0.835 | |
| Parietal_Inf_L | Control | 0.814 | 1.409 | –1.951–3.579 | 0.577 | 0.564 | 0.623 |
| Experiment | 3.585 | 1.409 | 0.820–6.350 | 2.544 | 0.012* | 0.030* | |
| Parietal_Sup_L | Control | –0.005 | 1.352 | –2.657–2.647 | –0.004 | 0.997 | 0.997 |
| Experiment | 2.614 | 1.352 | –0.038–5.266 | 1.934 | 0.054 | 0.091 | |
| Postcentral_L | Control | 1.622 | 1.434 | –1.191–4.436 | 1.132 | 0.259 | 0.319 |
| Experiment | 3.537 | 1.434 | 0.724–6.350 | 2.467 | 0.014* | 0.033* | |
| Precentral_L | Control | 5.000 | 1.296 | 2.457–7.543 | 3.858 | 0.000*** | 0.001** |
| Experiment | 2.888 | 1.296 | 0.345–5.431 | 2.228 | 0.027* | 0.057 | |
| Supp_Motor_Area_L | Control | 4.013 | 1.447 | 1.174–6.852 | 2.774 | 0.006** | 0.024* |
| Experiment | 4.991 | 1.447 | 2.152–7.830 | 3.450 | 0.001** | 0.003** |
Abbreviation: ROI, region of interest; SE, standard error; CI, confidence
interval. Significant level: *
| ROI | Group | Estimate (µM) | SE | 95% CI | t | p-value | q-value |
| Frontal_Inf_Tri_L | Control | 0.905 | 1.224 | –1.496–3.307 | 0.740 | 0.460 | 0.525 |
| Experiment | 4.405 | 1.224 | 2.003–6.806 | 3.599 | 0.000*** | 0.002** | |
| Frontal_Mid_2_L | Control | 1.454 | 1.400 | –1.292–4.201 | 1.039 | 0.300 | 0.356 |
| Experiment | 6.035 | 1.400 | 3.289–8.782 | 4.311 | 0.000*** | 0.001*** | |
| Frontal_Sup_2_L | Control | –0.520 | 1.534 | –3.530–2.490 | –0.339 | 0.735 | 0.784 |
| Experiment | 1.821 | 1.534 | –1.189–4.831 | 1.187 | 0.237 | 0.304 | |
| Parietal_Inf_L | Control | 2.736 | 1.409 | –0.029–5.501 | 1.941 | 0.054 | 0.091 |
| Experiment | 3.568 | 1.409 | 0.803–6.333 | 2.532 | 0.012* | 0.030* | |
| Parietal_Sup_L | Control | 2.160 | 1.352 | –0.492–4.812 | 1.598 | 0.111 | 0.162 |
| Experiment | 2.125 | 1.352 | –0.527–4.777 | 1.572 | 0.117 | 0.163 | |
| Postcentral_L | Control | 3.771 | 1.434 | 0.958–6.585 | 2.630 | 0.009** | 0.029* |
| Experiment | 3.142 | 1.434 | 0.329–5.955 | 2.191 | 0.030 | 0.059 | |
| Precentral_L | Control | 1.739 | 1.296 | –0.804–4.282 | 1.342 | 0.181 | 0.241 |
| Experiment | 5.446 | 1.296 | 2.903–7.989 | 4.202 | 0.000*** | 0.001*** | |
| Supp_Motor_Area_L | Control | 3.685 | 1.447 | 0.846–6.524 | 2.547 | 0.012* | 0.030* |
| Experiment | 5.172 | 1.447 | 2.334–8.011 | 3.575 | 0.000*** | 0.002** |
Abbreviation: ROI, region of interest; SE, standard error; CI, confidence
interval. Significant level: *
 Fig. 9.
Estimates of fNIRS response per group, condition and ROI
calculated by the LMM model using HbO concentration mean value from 10 s to 20 s
after onsets. Control and experiment group responses are shown in green and
orange, respectively. The presence of a response (statistical difference to 0, q
To test the difference between two groups, the mean HbO change data of the experiment group minus the control group during the MI and ME condition were used as indexes. The results are shown in Table 4 and Fig. 9. During MI condition, ES can significantly improve the activation of the following ROIs: Frontal_Inf_Tri_L (t = 2.022, p = 0.044), Frontal_Mid_2_L (t = 2.314, p = 0.022), and Precentral_L (t = 2.314, p = 0.022). There was no significant difference in all the ROIs between the control and experiment groups during ME condition.
| ROI | Condition | Estimate (µM) | SE | df | t | p-value |
| Frontal_Inf_Tri_L | Execution | –1.437 | 1.731 | 248.889 | –0.830 | 0.407 |
| Imitation | 3.499 | 1.731 | 248.889 | 2.022 | 0.044* | |
| Frontal_Mid_2_L | Execution | 0.381 | 1.980 | 175.015 | 0.192 | 0.848 |
| Imitation | 4.581 | 1.980 | 175.015 | 2.314 | 0.022* | |
| Frontal_Sup_2_L | Execution | –2.139 | 2.170 | 146.600 | –0.986 | 0.326 |
| Imitation | 2.341 | 2.170 | 146.600 | 1.079 | 0.282 | |
| Parietal_Inf_L | Execution | 2.771 | 1.993 | 172.548 | 1.390 | 0.166 |
| Imitation | 0.832 | 1.993 | 172.548 | 0.418 | 0.677 | |
| Parietal_Sup_L | Execution | 2.619 | 1.912 | 189.613 | 1.370 | 0.172 |
| Imitation | –0.035 | 1.912 | 189.613 | –0.018 | 0.985 | |
| Postcentral_L | Execution | 1.915 | 2.028 | 166.402 | 0.944 | 0.346 |
| Imitation | –0.629 | 2.028 | 166.402 | –0.310 | 0.757 | |
| Precentral_L | Execution | –2.113 | 1.833 | 210.922 | –1.153 | 0.250 |
| Imitation | 3.707 | 1.833 | 210.922 | 2.022 | 0.044* | |
| Supp_Motor_Area_L | Execution | 0.978 | 2.046 | 163.405 | 0.478 | 0.633 |
| Imitation | 1.488 | 2.046 | 163.405 | 0.727 | 0.468 |
Abbreviation: ROI, region of interest; SE, standard error. Significant level: *
Many studies have shown that MNN was activated during motor observation, imagery, execution, and imitation [56, 57]. We have previously revealed that MNN’sactivation patterns were similar during observation, execution, and imitation of hand actions combined with NMES [1]. In this study, we further investigated the brain activation difference between ME and MI with ES versus without ES. We found that ES may be helpful to improve activation in most ROIs of the MNN during ME and MI. These findings may be beneficial to the popularization and application of MNN-based rehabilitation strategies and the development of related rehabilitation devices.
For core MNN brain regions, our results revealed that, compared with the control group. except for IFG where activation increased significantly during MI but showed a tendency of decrease during ME, the other two core ROIs of MNN, PMC and IPL, showed increased activation during both ME and MI (Figs. 6,9). The MNN plays an important modulation role in the neural control of ME and MI, the results of this study suggest that it is possible to enhance this effect by ES [2]. In addition, ES may be helpful to improve motor initiation, because it can make muscles activate faster to start the desired action, and PMC is functionally related to motor initiation, the induced changes of brain and muscle both facilicate the initation of movement [58]. In the MI condition, the overall (Figs. 5,7) and most ROIs (Figs. 6,8) of MNN showed increased activation trends with ES, and there were more significantly activated ROIs (five ROIs activated with ES, two ROIs activated without ES, respectively) (Fig. 9, Table 4). There was no statistically significant difference between the two groups in the ME condition, nonetheless, we still observed a trend towards an increase in the experiment group in the overall (Figs. 5,7) and most ROIs (Figs. 6,8) of MNN.
For other brain regions, the MFG showed increased activation during both conditions in both groups (Figs. 6,8,9). The MFG is related to working memory, attention, and planning, it receives and sends widespread connections as part of network in higher cognitive functions [59]. These increases may be attributed to the MNN-based rehabilitation strategies including more cognitive process and ES enhances the sensory inputs to improve the connections of different brain areas [60]. The postcentral gyrus oversees somatotopic organization and sensory motor integration, for this area, an increased trend was observed during ME, whereas a decreased trend was shown during MI (Figs. 6,8,9). This may be attributed to the absence of motion visual inputs during ME, which may reduce the feelings of ES and decrease the attentional level [61]. The activation of the precentral gyrus increased during MI but decreased during ME. One of the possible reasons is that comparing with action videos with visual information of biological actions, the visual information of scenery videos can’t present action information, which may reduce the attention level, resulting in a weaker motor performance or a smaller range of motion (ROM) than in MI [62]. No motor performance data such as speed and ROM were recorded in this experiment, to further study the relationships of motor performance and motor visual inputs, video analysis or data glove with sensors are needed to compare the ME quality and amplitude of the produced motion in future studies [63]. Besides, the decrease of SPG during our experiments may be attributed to less visuo-motor transformation and spatial processing workload; the PFC may also take part in this process to handle visuo-spatial working memory [47].
The reason for no significant difference being found between the experiment and control groups in some ROIs may be attributed to our choice of participant. For healthy individuals with no motor dysfunctions, it is easy to finish all the ME and MI tasks. In some ROIs, the activation level was lower with ES than without ES, a possible reason is that ES moving the hands passively, thus affecting the active participation and attention level of the participants. However, for patients with neurological conditions, it is hard to finish the full range hand movement without the help of ES. Therefore, activation of the MNN may be obviously different with or without ES in patients with CNS injuries. Another possible reason may be the relationship of visual and sensory information, for MI, ES is a promoting factor to provide consistent visual and sensory information; whereas, for ME, ES is sometimes a interference factor, because of the inconsistency between visual and sensory information. In addition, the technical characteristics of fNIRS may be a factor contributing to the lack of statistically significant results, because of its relatively poor spatial resolution and relatively shallow penetration depths [64]. Further investigations using different technologies and more clinical trials need to be conducted to achieve a deeper understanding of these factors.
Without ES, most ROIs’s activation patterns are similar between ME and MI conditions [65]. Our previous study has shown that the activation of MNN was obviously higher during NMES + MI than during NMES + ME, which revealed that NMES will enhance the brain activation when there is the executed action’s visual information [1]. The visual system plays a part in restoring motor cognitive functions through neuroplasticity in stroke rehabilitation [66]. Motor function is related to visual and spatial processing, which is important to rehabilitation strategies aiming to enhance upper extremity motor function after stroke [67]. Compared with ME, MI is a more complex task, including more cognitive components, which means a high energy and resource load [68]. In our study, some participants reported that it was easy to relax when looking at the scenery videos, even feeling fatigue and boredom in the latter half of the experiment, thereby reducing the range of movements. This may have resulted in decreased attentional level and motivation.
It is necessary to try different kinds of visual information presentation forms to enrich the MNN based rehabilitation options. Some studies have focused on this. For example, mirror therapy (MT) is an important rehabilitation therapy based on MNN theory [5, 69]. The mirror visual feedback to the CNS can sustain promising therapeutic potential as part of the treatment for pain reduction and hand function [69]. In recent years, researchers keep searching for new kinds of MT visual information presentation forms. Compared with conventional MT, the parieto-frontal network showed greater activation in video based MT, which shows that greater focus on visual feedback could promote neuroplasticity [5]. Immersive virtual reality based MT can also improve cortical activation and enhance rehabilitation outcomes [70]. In addition, integrated application of MT and robotic training can enhance the functional gains of activities of daily living (ADLs) [71]. Taken together, these studies suggest that technologies used to present visual information may play a crucial role in MNN-based rehabilitation treatments.
The above findings suggest that ES may help to enhance the activation of MNN, it is conceivable that the effects of central-peripheral synchronous stimulation on cortical activation may be contributed to this phenomenon. In addition, multi-sensory integration may also play a key part in this process. The consistency of different sensory inputs, including visual, tactile, ES evoked motor proprioception, and motor perception reinforce each other, thus improving brain excitability (Fig. 10).
 Fig. 10.
Schematic diagram of the possible neural mechanism using central and peripheral stimulus synchronously to improve neural plasticity, particularly the combination of MNN-based rehabilitation methods and ES.
By sensory-motor coupling and integration, the central and peripheral synchronous stimulus influence each other, attaining synergistic effects. Some studies have confirmed this assumption, especially in BCI studies. For example, PES combined with action observation helps to improve BCI signal quality and feature classifier accuracy [47]. In addition, BCI action observation feedback combined with PES is capable of facilitating sensorimotor cortical activation in the affected hemispheres [72], thus enhancing task-driven corticospinal plasticity and treatment induced neural plasticity [73]. Furthermore, adding other treatment methods to MNN-based methods may be helpful to perform motor tasks, for example, the combination of NIBS and MNN-based rehabilitation strategies are important study directions in neurorehabilitation [74]. These strategies are helpful to modulate neural oscillations and enhance human motor and cognitive function [75]. In another study, MNN strategies paired with conventional rehabilitation resulted in significant improvements in wrist and hand impairment [76]. This has been expanded to include more forms of central and peripheral stimulus synchronous application, including combination of different central stimuli, such as TMS, tDCS, TUS, tBPM combined with MNN-based rehabilitation strategies.
In addition to stimulating muscles and peripheral nerves, ES could also activate the spinal cord and brain. On the one hand, the visual stimulation and biological kinematics information provided by action videos, as well as the cognitive activities of observation, imagery, and understanding of the actions, help to enhance brain excitability [77]. On the other hand, the somatic and tactile sensation of electrodes attached to the skin, the contraction caused by ES acting over muscles and nerves, the stimulation of joint kinesiology and positional sensation driven by muscle contraction, and the increase of motor amplitudes assisted by ES may form feedback loops in a comprehensive way [78]. When the spinal cord obtains ES-evoked sensory responses, both intraspinal networks and ascending pathways can be influenced, thus enhancing the excitability of the peripheral nerves, spinal cord, and brain [39]. Furthermore, the combination of the two forms of comprehensive training improves the interest of treatment. The participant’s attention is further concentrated, and the motivation is enhanced, especially when the action scenes appears, and the activation of brain regions may be further enhanced. In summary, central-peripheral synchronous stimulation may enhance the activation level of brain regions with MNN as the core, improve the degree of participation in rehabilitation training, thus playing a role in improving the rehabilitation efficacy.
The findings of our study have prosperous potential applications in neurorehabilitation treatments, they have unique values in design and manufacture of the related rehabilitation devices. The combination of action observation, imagination, comprehension, imitation based on MNN and conventional ES in daily physical therapy can help enhance the brain activation of the existing treatment techniques, thus enhancing clinical effects and efficacy. The theory of integrating stimulus from both central and peripheral directions to promote each other may play an important role in the neurology and neurorehabilitation fields [79]. By combining active movement and assist movement organically, ME + ES and MI + ES will hopefully be new rehabilitation interventions, especially for patients with manual muscle test (MMT) grade 2 to 4 and who need active-assist training. In addition, by modifying the ES parameters and visual inputs (for example, relaxing sceneries with light music), the program we used may be beneficial to reduce pain, thus playing a part in pain management [80]. Moreover, this kind of treatment is easy to utilize in group training, therefore, it is possible to enhance brain connectivity among different individuals and bring some positive effects to the physiotherapy sessions, thus providing positive impacts on mood and motivation [81].
In the rehabilitation engineering field, this study verifies the feasibility of enhancing central stimulation by superimposing peripheral stimulation (ES, peripheral magnetic stimulation, and mechanical stimulation) to improve the signal intensity and SNR of brain activity signals. This has important reference value for the development of instruments and equipments, such as fNIRS signal based neurobiofeedback and BCI devices [44]. ES can be utilized to augment the activation signal generated by CNS and the sensory feedback during an action, and improve classification accuracy of the BCI signal decoding results [39]. To further improve the accuracy of the classification algorithm, large samples of data need to be collected and analyzed in a uniform way. In addition, the cortical activation patterns can be used as trigger signals to control ES devices to conduct BCI rehabilitation trainings [82]. The implementation of the related therapies can be integrated into a all-in-one device, thus helping new rehabilitation device development, and can be used in rehabilitation institute, hospital, community, and home rehabilitation programs, especially in tele-rehabilitation settings, which has good socioeconomic value.
Additionally, accurate evaluation of brain activation can be a neuroimaging biomarker to estimate the recovery potential of patients with CNS conditions, thus producing individualized rehabilitation plans. Activation of MNN may be a potential neuroimaging biomarker for motor function recovery [83]. For example, an electroencephalogram (EEG) study has revealed that event-related desynchronization during action observation is an early predictor of recovery in sub-cortical stroke [84]. Another fNIRS study showed that the correlation between FC of MNN and autistic traits can be used in clinical outcome evaluations [85]. In the future, the correlation between the activation level of the MNN and the results of the patient functional ability scales can be combined to build predictive models.
To sum up, synchronization of MNN based rehabilitation strategies (central intervention) and ES (peripheral intervention) may produce synergistic effects in ehancing brain activation. The fNIRS signals detected during these conditions could be used as potential neural imaging biomarkers to predict rehabilitation outcomes.
There are some limitations of our study. First, as the Nz-Cz-Iz distance has a statistically significant difference between the two groups, a 3D digitizer should be used to measure the individualized channel location data for more accurate brain modeling. Second, we did not assess the performance of the motor trials, therefore, it was impossible to use the quality of motor outcome as a variable to build the models. In future studies, motion tracking systems, data gloves or video analysis software can be used to record the motor quality, such as range of motion, mean speed, mean distance, normal path length, spectral arc length, number of peaks, and task time metrics [86]. Third, other brain regions also play important roles during ME and MI, and both hemispheres are engaged in the process of related information. Therefore, it is reasonable to detect whole brain information using an fNIRS system with more channels in the future. Another possible solution is to use different brain imaging metrics to further confirm the experiment results, for example, using EEG + fNIRS or functional magnetic resonance imaging (fMRI) + fNIRS to take full advantage of the temporal and spatial resolution of different technologies. Fourth, patients with different disease should be investigated to verify these findings, especially in patients with motor and cognitive impairments. Fifth, there are many indexes in fNIRS data analysis, including peak, time to peak, area under the curve, mean, slope from stimulus onset to peak, minimum, peak-to-peak and various frequency domain indicators [47]. Further analyses should be performed in future studies, especially in the BCI signal patterns extraction and neurobiofeedback signal augments studies [62]. Resting state inter- and intra-hemispheric FC, brain signal complexity, and frequency domine indexes could be utilised to explore the brain change evoked by MNN-based approaches and it’s clinical relevance [87]. Last, with the development of artificial intelligence, related fNIRS preprocessing and processing approaches may play more important roles, which include machine learning, deep learning, and hybrid models [88].
This study revealed that most ROIs of the MNN were activated during ME and MI with and without ES. In the ES group, more ROIs were activated and some ROIs showed a higher activation level. The superposition or combination of ES with rehabilitation techniques based on MNN may bring about the effect of central-peripheral synchronous stimulation, which is helpful in enhancing brain plasticity and functional reorganization, thus improving the rehabilitation effects and efficacy.
The data presented in this study are available on request from the corresponding authors.
YC and FC designed the research study. YC and FBH performed the research. MZ provided help and advice on data analysis. YC, MZ and JW analyzed the data. YC and JW wrote the manuscript. All authors contributed to editorial changes in the manuscript. All authors read and approved the final manuscript. All authors have participated sufficiently in the work and agreed to be accountable for all aspects of the work.
The research protocol was approved by the Ethics Committee of China Rehabilitation Research Center (Ethic Approval Number: 2021-053-1). The study was carried out in accordance with the guidelines of the Declaration of Helsinki and all of the participants provided signed informed consent.
The authors are grateful to all the participants in this study. We think all the staffs in CRRC research and financial management departments, included but not limited to Nian Zhang, Shi-hao Chen, Ting-ting Zhang, Rui-yao Yang, Li-jun Meng, Zhao-nan He, Jing-yi Lu and Yu-qi Ti for the supporting work during the whole study.
This research was funded by Capital’s Funds for Health Improvement and Research Youth Fund, grant number CFH2022-4-6014, and China Rehabilitation Research Center Youth Fund, grant number 2021ZX-Q8.
The authors declare no conflict of interest.
Supplementary material associated with this article can be found, in the online version, at https://doi.org/10.31083/JIN25731.
References
Publisher’s Note: IMR Press stays neutral with regard to jurisdictional claims in published maps and institutional affiliations.